40
Datacenter Energy Efficiency Research: An Update Lawrence Berkeley National Laboratory Bill Tschudi [email protected] July 29, 2004
| Date post: | 24-Jan-2018 |
| Category: |
Technology |
| Upload: | datacenters |
| View: | 231 times |
| Download: | 1 times |

Datacenter Energy Efficiency Research: An Update
Lawrence Berkeley National Laboratory
Bill [email protected]
July 29, 2004
Data center energy efficiency research and deployment sponsors
• California Energy Commission
• Pacific Gas and Electric Co.
• New York State Energy Research and Development Authority
• DOE Federal Energy Management Program

Today’s outline
• Overview of past and present research
• Energy benchmarking and best practices
• Power supplies in IT equipment
• Efficient UPS systems• Demonstrations• Q & A

Completed activities
OVERVIEW
• Data center case studies and benchmarking
• Research roadmap for CA
• CA market assessment
OVERVIEW
Prior work in New York
• Case studies/energy benchmarking
• Workshops
OVERVIEW
Related prior activities
• Jon Koomey study of impact of the Internet
• Jennifer Jackson-Mitchell thesis/case study
• Case studies/energy benchmarking
• Studies of standby losses and power supplies

OVERVIEW
Current activities
• Benchmarking and best practices identification
• Self-benchmarking protocol• Investigate uninterruptible
power supplies (UPS)• Investigate power supplies in
IT equipment• Collaborate on building
interface developments

– NYSERDA sponsored project• Air management – modeling and demonstration
with SUNY, GA TECH, and IBM
– CEETherm• University of Maryland/Georgia Tech
Related activities
OVERVIEW

• 6-10 data centers – (still seeking sites)
• Self-benchmarking protocol
• Review all benchmark results to determine better
performing systems Best Practices
• Add benchmarks for standby generation
• Investigate other performance metrics
Energy benchmarking
Benchmarking
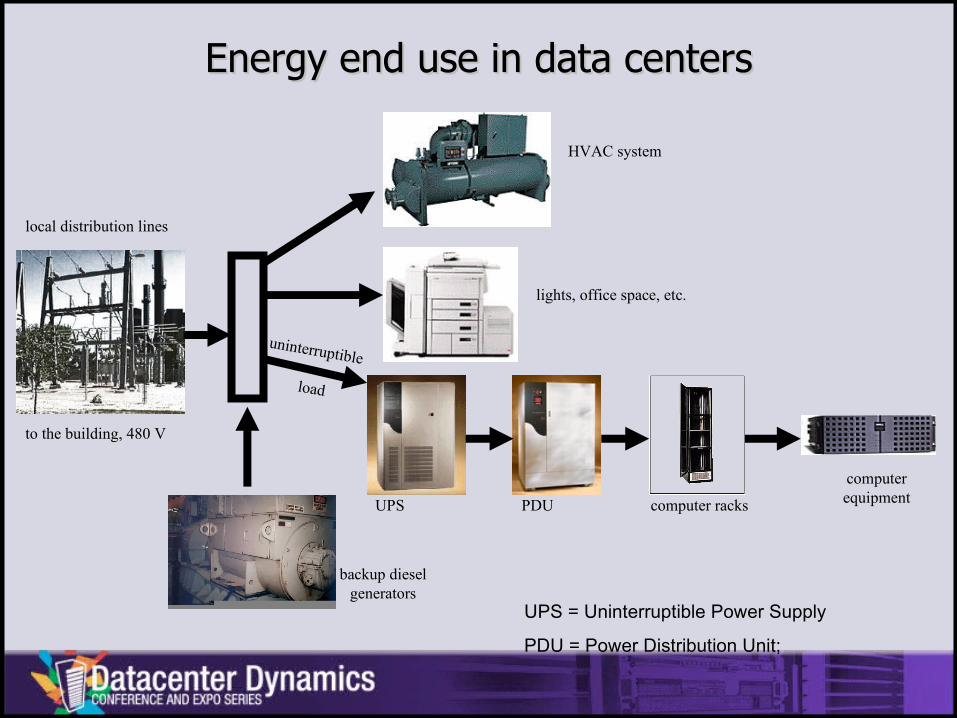
local distribution lines
to the building, 480 V
HVAC system
lights, office space, etc.
UPS PDU computer racks
backup diesel generators
Energy end use in data centersEnergy end use in data centers
computerequipment
uninterruptible
load
UPS = Uninterruptible Power Supply
PDU = Power Distribution Unit;

“In God we trust – all others bring data”
Quote: Lee Eng-Lock

Power consumption in data centers
Benchmarking
Data Center Server Load
51%
Data Center CRAC Units
25%
Cooling Tower Plant4%
Electrical Room Cooling
4%
Office Space Conditioning
1%
Lighting2%
Other13%
Computer Loads67%
HVAC - Air Movement
7%
Lighting2%
HVAC - Chiller and
Pumps24%

Benchmarks of IT equipment load density
Benchmarking
Computer Load Density
010203040506070
1 2 3 4 5 6 7 8 9 10 11 12 13 14 15
Facility
W/s
q.f
t.

Projections if fully loaded
Benchmarking
0102030405060708090
100
1 2 3 4 5 6 7 8 9 10 11 12 13 14
Facility Identifier
W/S
q.F
t.
Current Computer Load Projected Computer Load
Average 39.3
Average ~25

Distribution of computer room power reported to uptime institute
0.00
0.20
0.40
0.60
0.80
1.00
0 20 40 60 80 100
Computer room UPS power (Watts/square foot)
Fra
ctio
n of
tot
al f
loor
are
a in
sam
ple
1999
2000
2001
Number of facilities Total floor area
Computer room power density
Million square feet W/square foot1999 35 1.55 22.92000 38 1.72 22.42001 48 1.86 25.3
Source: Uptime Institute, 2002.
Benchmarking

HVAC effectiveness
Benchmarking
HVAC (as a % of total load)
0%
10%
20%
30%
40%
50%
60%
1 2 3 4 5 6 7 8 9 10 11 12
Data Center Identifier
% o
f to
tal
load

Benchmarks of chillers
Benchmarking
0.0
0.2
0.4
0.6
0.8
1.0
1.2
Facility
kW
/ t
on
7.5 average

Benchmarking
UPS efficiency

Inverter
In Out
Bypass
Battery/ChargerRectifier
Internal Drive
External Drive
I/O
Memory Controller
µ Processor
SDRAM
Graphics Controller
DC/DCAC/DC
DC/DC
AC/DC Multi output PS
Voltage Regulator Modules
5V
12V
3.3V
12V 1.5/2.5V
1.1V-1.85V
3.3V
3.3V
12V
PWM/PFCSwitcher
Unregulated DCTo Multi Output Regulated DC
Voltages
How many times are we converting electricity?
Typical existing data center configuration

• Measure performance of various systems at several load factors
• Investigate effects of different redundancy configurations
• Develop energy efficiency spec for UPS systems• Scoping study for data center
DC architecture
Investigating efficiency opportunity for UPS systems
UPS Systems

Status of UPS investigation
• Protocols developed for field or shop measurement.
• Mfgs specifications reviewed for efficiency versus load for static and inertial UPS topology.• Calculation tools developed:
• For comparing AC versus DC powering at rack level
• For evaluating cost savings due to higher efficiency UPS.
• Completed testing of UPS to show impact of “high efficiency” option on static UPS
•Coordinating with International labeling effort for power quality & efficiency
UPS Systems

Measured efficiency vs. load
32.00%
89.10%
64.30%
91.30%
0.00%
20.00%
40.00%
60.00%
80.00%
100.00%
Median 90th Percentile
Field UPS Loading (%) Field UPS Efficiency (%)
Sample of 12 field measurements, including ten from LBNL roadmap activity
UPS Systems
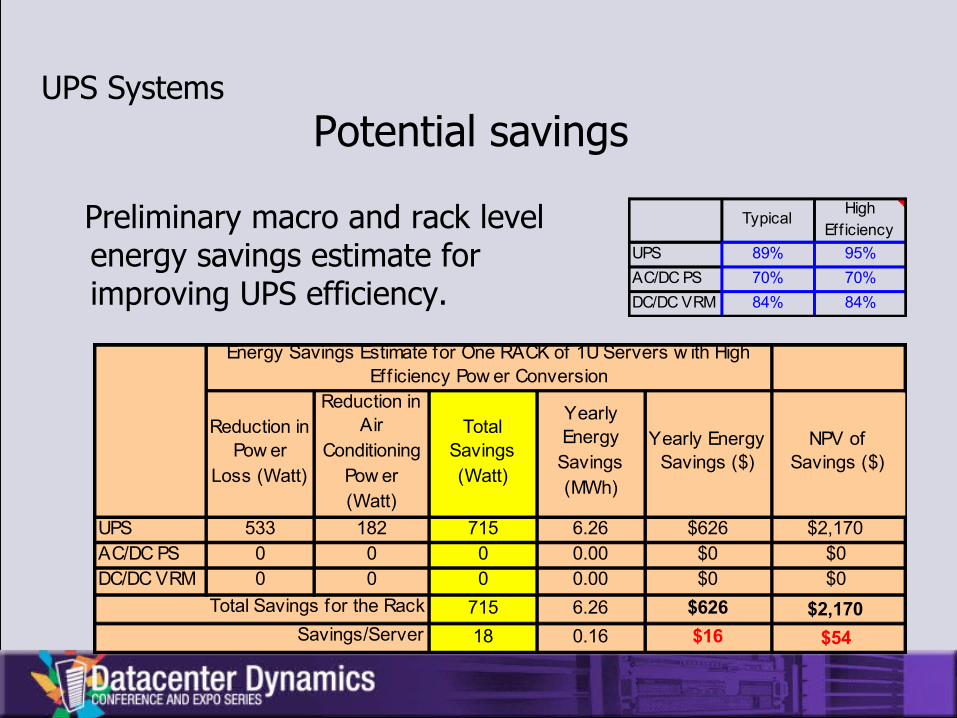
Potential savingsUPS Systems
Preliminary macro and rack level energy savings estimate for improving UPS efficiency.
Reduction in Pow er
Loss (Watt)
Reduction in Air
Conditioning Pow er (Watt)
Total Savings (Watt)
Yearly Energy Savings (MWh)
Yearly Energy Savings ($)
NPV of Savings ($)
UPS 533 182 715 6.26 $626 $2,170AC/DC PS 0 0 0 0.00 $0 $0DC/DC VRM 0 0 0 0.00 $0 $0
715 6.26 $626 $2,170
18 0.16 $16 $54
Total Savings for the Rack
Savings/Server
Energy Savings Estimate for One RACK of 1U Servers w ith High Eff iciency Pow er Conversion
TypicalHigh
Eff iciency
UPS 89% 95%
AC/DC PS 70% 70%
DC/DC VRM 84% 84%
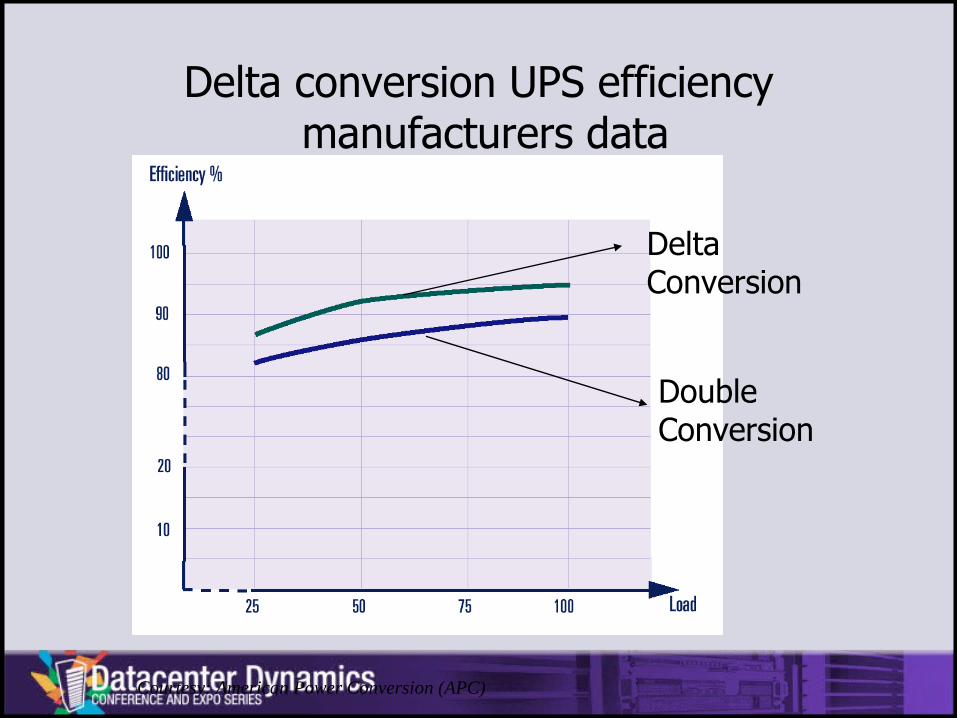
Delta Conversion
Double Conversion
Delta conversion UPS efficiency manufacturers data
Courtesy: American Power Conversion (APC)
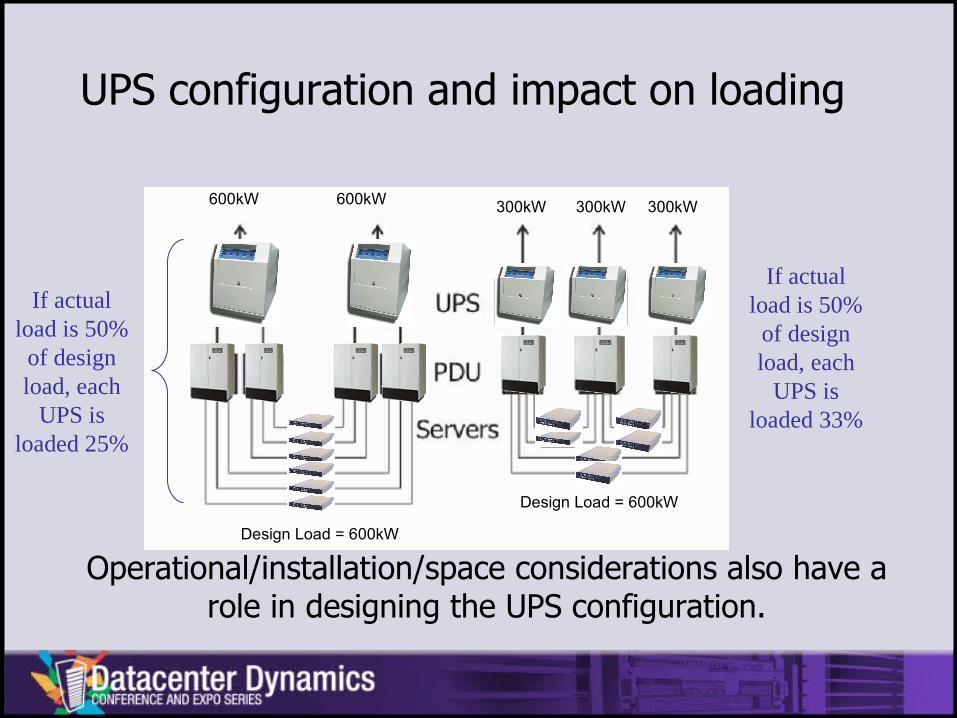
Operational/installation/space considerations also have a role in designing the UPS configuration.
If actual load is 50%
of design load, each
UPS is loaded 25%
If actual load is 50%
of design load, each
UPS is loaded 33%
Design Load = 600kW
Design Load = 600kW
600kW 600kW 300kW 300kW 300kW
UPS configuration and impact on loading

Only Energy Relating Savings Considered; Other Savings such as Size, Heat Sink Cost not considered
AC Power Architecture
DC Power Architecture
Total input Power(Watt)
UPS 85% NA AC Powering 8590
AC/DC PS 72% NA DC Powering 6137
DC/DC VRM (12V-1.75V) 84% 84% Net Savings 2453 837 3290 28.82 $3,458$11,984
DC/DC (48V-12V) NA 95% 82 0.72 $86 $300
DC/DC (48V-5V/3.3V) NA 90%
Nextek Power Module (AC/DC Rectifier)
NA 92%
1U Dual Processor Server Power Budget
Typical (W) Maximum (W)
Dual Processor Power (@1.75V DC)
60 130
Mother Board, PCI Card, DDR Memory and Other
Peripheral DC Power Consumption (@12V, 5V
and 3.3V DC)
60 220
Electricity Cost $0.12 Cents/Kwh
Life Time 4 years
Discount Rate 6% percent
Overall Cooling System Efficiency
1200 Watt/Ton
Number of 1U Servers Per Rack
40
2.4 GHz Dual Xeon Processor Based 1U Server Power Budget
2.4 GHz Dual Xeon Processor Based 1U Server Power Budget
NPV of Savings ($)
Total Savings Per Server
Power Conversion Efficiency
Energy Savings Estimate for One RACK of 1U Servers with High Efficiency Power Conversion
Reduction in Air
Conditioning Power (Watt)
Total Savings (Watt)
Yearly Energy Savings (MWh)
Yearly Energy Savings ($)
Calculating Energy Savings Using High Efficiency DC Power Architecture in a Server Application; Rev 0.0, 04/10/2004 Pls send comments to [email protected]
Calculations Based on Typical Power Budget for a Dual 2.4 GHz Xeon Processor based 1U Server Rack
Input Data (Fill in Values (Blue Boxes) for the Data
and Assumptions Used for the Analysis )Results of Energy Savings Estimate
120V AC
AC/DC/AC Conversion
UPS with Battery
350 W AC/DC Front End Multi Output DC
Power Supply
120V AC
12V DC 1.75VDC
Floppy Drive 0.5ACDROM Drive 0.8AHard Drives, IDE, 4X 2.4ABlowers, 4X 6.6A
12V DC
Mother Board 8.0APCI Card 5AHard Drives, IDE, 4X 1.2ABlowers, 4X 6.6AKeyboard & Mouse 0.5AFloppy Drive 0.2ACD ROM Drive 0.2A
5V DC
Mother Board 1.5ADDR Memory 8.5A
3.3V DC
Xeon 2.4HHz, 2X 14A@12VDC-DCVRM
Top View
208/277V AC
Multiple Power Router 1
48V DC
12V DC 1.75VDC
Floppy Drive 0.5ACDROM Drive 0.8AHard Drives, IDE, 4X 2.4ABlowers, 4X 6.6A
Mother Board 8.0APCI Card 5AHard Drives, IDE, 4X 1.2ABlowers, 4X 6.6AKeyboard & Mouse 0.5AFloppy Drive 0.2ACD ROM Drive 0.2A
5V DC
Mother Board 1.5ADDR Memory 8.5A
3.3V DC
Xeon 2.4HHz, 2X 14A@12VDC-DCVRM
12V DC
Battery Energy Storage 2
Option for Direct DC PV Coupling
DC-DC Conversion 3
DC-DC Conversion 4
AC Powering Architecture
DC Powering Architecture

• Document efficiency of existing power supplies• Measure performance to determine real life
efficiency• Recommend efficiency performance thresholds• Work with Server System Infrastructure (SSI) group
to advance better performance
Investigating power supplies commonly used in IT equipment
Energy Efficient Power Supplies
131
32 32
72
41
86
27 32
020406080
100120140
AC DC
Loss
es
DC/DC
Loss
esFa
ns
Drives
PCI C
ards
Proc
esso
rs
Memor
y
Chips
et
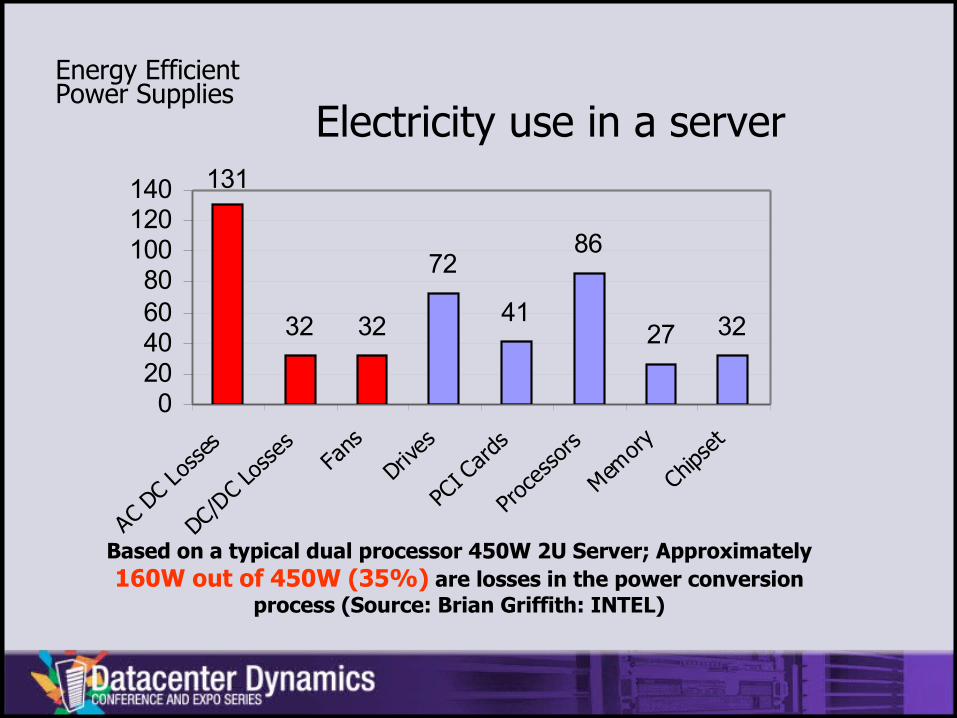
Electricity use in a server
Based on a typical dual processor 450W 2U Server; Approximately 160W out of 450W (35%) are losses in the power conversion
process (Source: Brian Griffith: INTEL)
Energy Efficient Power Supplies
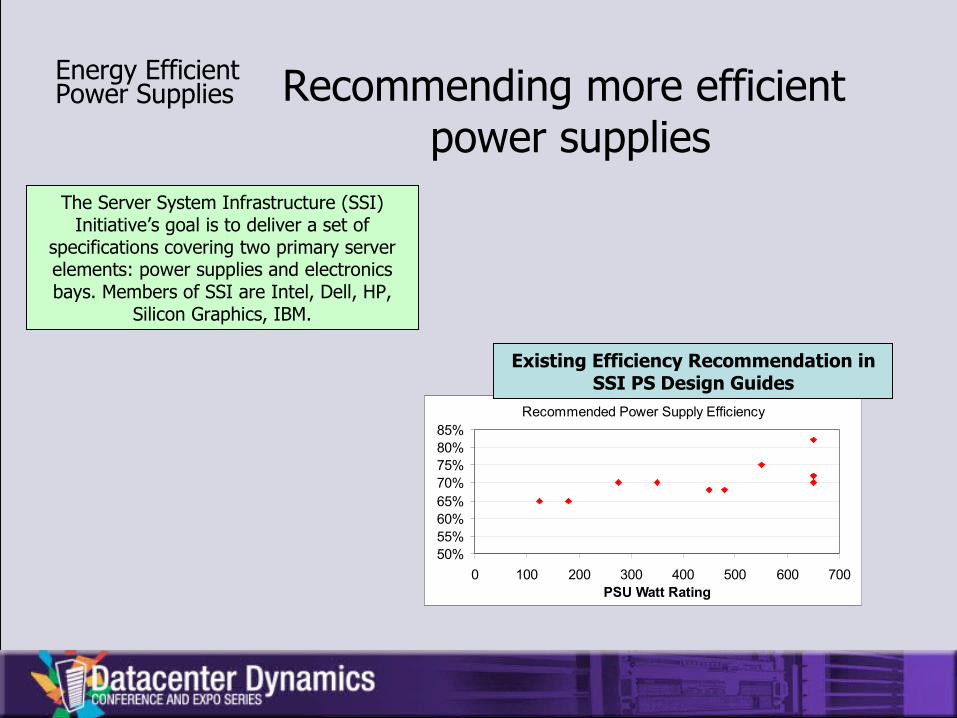
Recommending more efficient power supplies
Recommended Power Supply Efficiency
50%55%60%65%70%75%80%85%
0 100 200 300 400 500 600 700PSU Watt Rating
Existing Efficiency Recommendation in SSI PS Design Guides
The Server System Infrastructure (SSI) Initiative’s goal is to deliver a set of
specifications covering two primary server elements: power supplies and electronics bays. Members of SSI are Intel, Dell, HP,
Silicon Graphics, IBM.
Energy Efficient Power Supplies

Full Load Efficiency >
68%
Redundant System of Power Supplies for Servers
Energy Efficient Power Supplies

Testing power supplies

86.5%50%
89.4%N/A85%
89.6%*94%100%
Test Results
Factory Spec
Percent Loading
Real life efficiencyLinear 60Hz Load Current
-5
-3
-1
1
3
5
0 0.005 0.01 0.015 0.02 0.025 0.03
Curre
nt (
Amps
)
Based on EPRI PEAC Testing of a 20kVA, 3-Ph Double Conversion UPS
Energy Efficient Power Supplies

Importance of a flat power supply efficiency curve
500W 1U Server Power Supply Efficiency Data
0
20
40
60
80
100
0% 10% 20% 30% 40% 50% 60% 70% 80% 90% 100%
% Loading
Eff
icie
ncy
(%
)
Typical Loading
Range for Server PSU
Energy Efficient Power Supplies

Redundant Power Supply (300W + 300W)
At 50% Design Load each
supply is loaded 25%
1200 W 4+1 (N+1) Redundant Power Supply System
At 50% design load each supply is loaded 40%
Power supply system redundancy can be accomplished without using “redundant power supplies”.
Power supply redundancy
Energy Efficient Power Supplies

Courtesy: American Power Conversion (APC)
Processor Utilization for EPRI PEAC Web Server (Single Pentium 3 Processor)
0
20
40
60
80
100
12:0
0:00
AM
12:0
0:00
AM
12:0
0:00
AM
12:0
0:00
AM
8 Hour Log at 1 second Interval
% P
roce
sso
r U
sag
e
0
20
40
60
80
100
0% 10% 20% 30% 40% 50% 60% 70% 80% 90% 100%
% of Time Processor Utilization was Less than Y Axis
Pe
rce
nt
Pro
ce
ss
or
Us
ag
e
1st 17 hour run
2nd 17 hour run
80% of the time the processor usage was less than 4% of its peak capability
A GHz processor is using MHz resource most of the time

Looking for production metricsAC Power Input Versus Percent CPU Time
0
25
50
75
100
125
150
Wat
ts
0
20
40
60
80
100
120
% C
PU
Tim
e
WattsProc Time %
Dell Power Edge 2400 (Web/SQL Server)
Very Low Processor
Activity does not relate to
very low power consumption
Most of the time the GHz processor is doing activities that can be done by a MHz processor but the input power
consumption does not change much

CA public utilities’ emerging technology program and the CA Energy Commission are planning demonstration projects.
Possibilities:– Air management– Air flow visualization– Alternative cooling strategies– UPS upgrades and reconfigurations– Rack level DC distribution– On site power generation– Ideas?
Demonstration projects

Technology Transfer
LBNL data center websites
• http://hightech.lbl.gov/• http://Datacenters.lbl.gov


Thank you
Questions?


