21
Data Products Released in 2011 and Products to be Released in the Next Year Paula Wright Information Services Specialist Dallas Regional Office May 23, 2012
| Date post: | 18-Dec-2015 |
| Category: |
Documents |
| Upload: | easter-parrish |
| View: | 217 times |
| Download: | 3 times |

Data Products Released in 2011 and Products to be Released in the
Next Year
Paula WrightInformation Services Specialist
Dallas Regional OfficeMay 23, 2012

2010 Census Data Products Released in:• 2011
– 2010 Census Redistricting Data ( P.L.94-171) Summary File … released 02/3/2011 – 03/24/2011
– Demographic Profile … released 05/26/2011– Summary File 1 (SF1) … released 06/16/2011 – 08/25/2011– Advance Group Quarters Summary File … released 04/20/2011
• Data table (P42 from SF 1) showing population in group quarters (7 types)– Same-Sex Couple Households Supplemental Tables … released 09/27/2011
• Same-sex spouse responses are tabulated as reported (not edited during processing to “unmarried partner, as in other standard 2010 Census or ACS data products)
• 2012– Summary File 2 (SF2) … released from 12/15/2011 – 04/26/2012
• SF2 tables add a new layer of detail to the population and housing topics released last year from the 2010 Census. SF2 offers characteristic data available for up to 331 detailed race and Hispanic origin groups.
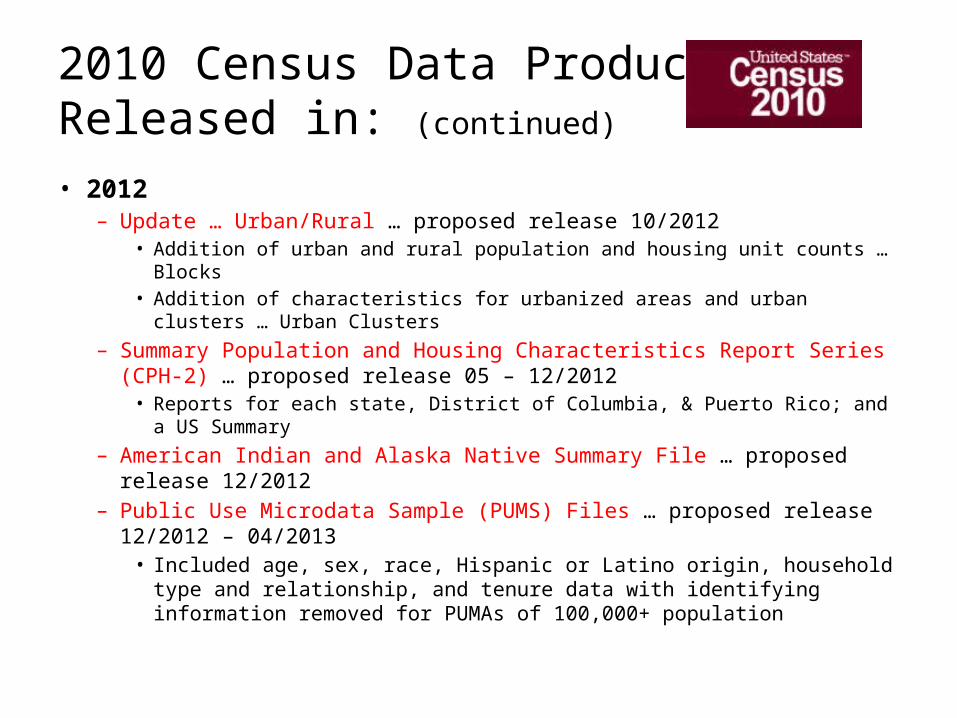
2010 Census Data Products Released in: (continued)
• 2012– Update … Urban/Rural … proposed release 10/2012
• Addition of urban and rural population and housing unit counts … Blocks• Addition of characteristics for urbanized areas and urban clusters … Urban
Clusters– Summary Population and Housing Characteristics Report Series
(CPH-2) … proposed release 05 – 12/2012 • Reports for each state, District of Columbia, & Puerto Rico; and a US Summary
– American Indian and Alaska Native Summary File … proposed release 12/2012
– Public Use Microdata Sample (PUMS) Files … proposed release 12/2012 – 04/2013• Included age, sex, race, Hispanic or Latino origin, household type and
relationship, and tenure data with identifying information removed for PUMAs of 100,000+ population
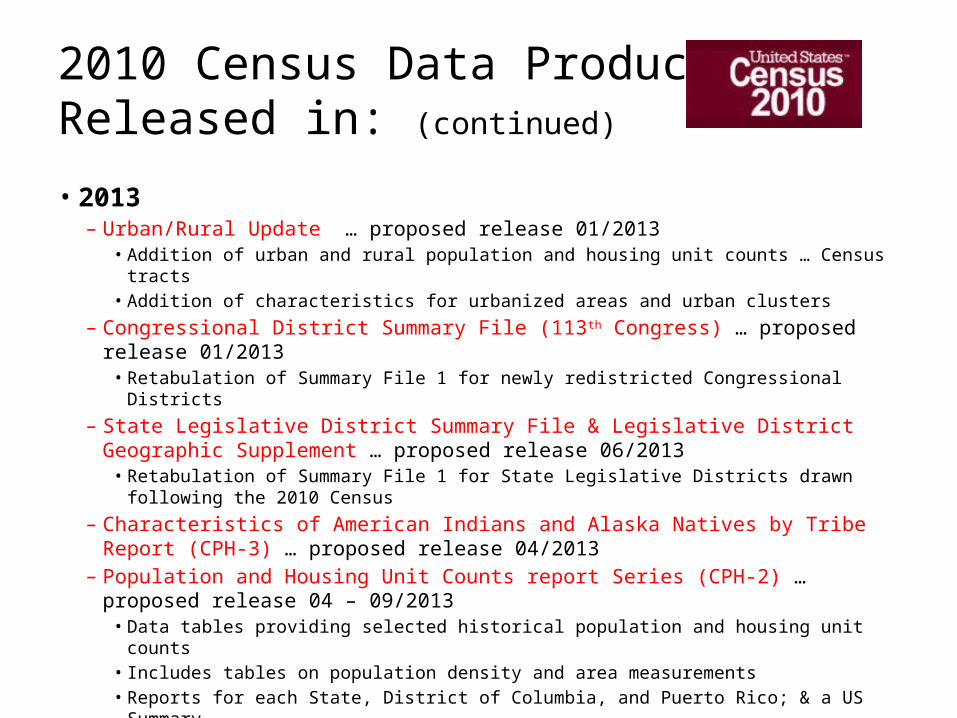
2010 Census Data Products Released in: (continued)
• 2013– Urban/Rural Update … proposed release 01/2013
• Addition of urban and rural population and housing unit counts … Census tracts• Addition of characteristics for urbanized areas and urban clusters
– Congressional District Summary File (113th Congress) … proposed release 01/2013• Retabulation of Summary File 1 for newly redistricted Congressional Districts
– State Legislative District Summary File & Legislative District Geographic Supplement … proposed release 06/2013• Retabulation of Summary File 1 for State Legislative Districts drawn following the
2010 Census– Characteristics of American Indians and Alaska Natives by Tribe Report (CPH-
3) … proposed release 04/2013– Population and Housing Unit Counts report Series (CPH-2) … proposed
release 04 – 09/2013• Data tables providing selected historical population and housing unit counts• Includes tables on population density and area measurements• Reports for each State, District of Columbia, and Puerto Rico; & a US Summary

2010 Urban Area Product Release Schedule
• March 26, 2012– Press Release with
accompanying maps• Austin experienced the 2nd largest
urban growth over the last 10 years when compared to its peers.
• According to the 2010 Census, Texas has the largest rural population and the secondlargest urban population after California.
– Lists of urban areas– TIGER/Line shapefiles– Relationship files
• May – June 2012– Individual urban area
maps
• October 2012– Summary File 1 updated
with urban areas
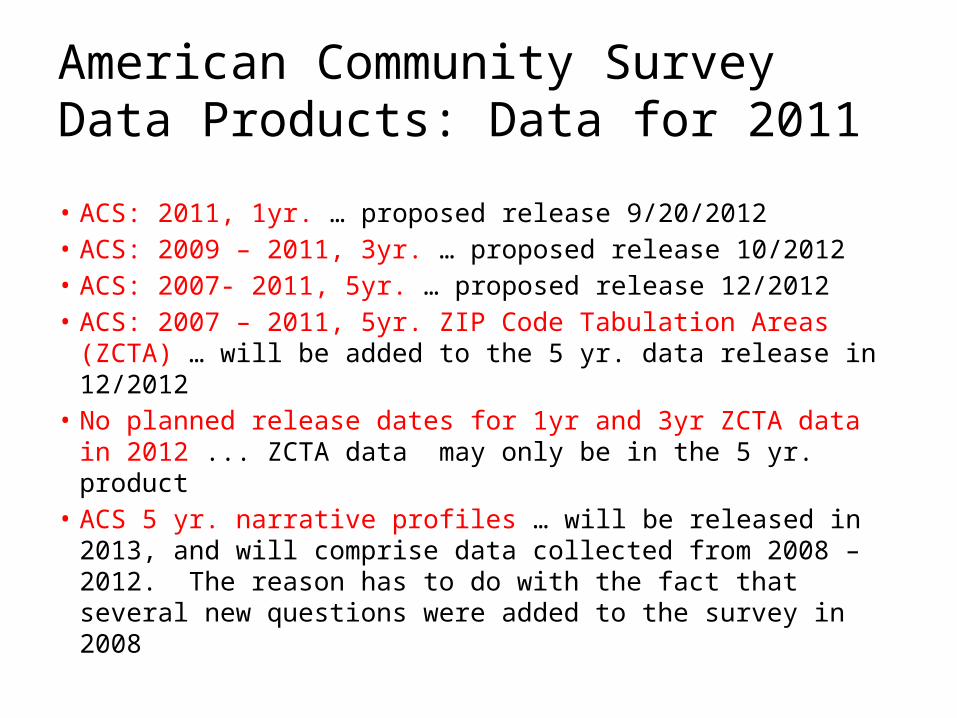
American Community Survey Data Products: Data for 2011
• ACS: 2011, 1yr. … proposed release 9/20/2012• ACS: 2009 – 2011, 3yr. … proposed release 10/2012• ACS: 2007- 2011, 5yr. … proposed release 12/2012• ACS: 2007 – 2011, 5yr. ZIP Code Tabulation Areas (ZCTA) …
will be added to the 5 yr. data release in 12/2012 • No planned release dates for 1yr and 3yr ZCTA data in
2012 ... ZCTA data may only be in the 5 yr. product • ACS 5 yr. narrative profiles … will be released in 2013, and
will comprise data collected from 2008 – 2012. The reason has to do with the fact that several new questions were added to the survey in 2008
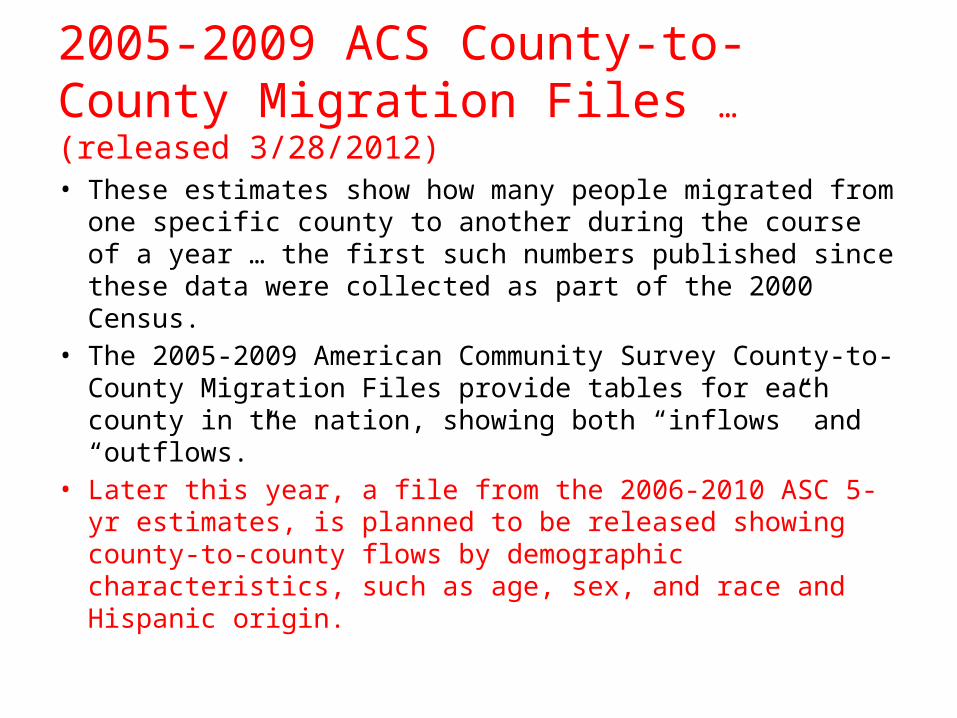
2005-2009 ACS County-to-County Migration Files … (released 3/28/2012)
• These estimates show how many people migrated from one specific county to another during the course of a year … the first such numbers published since these data were collected as part of the 2000 Census.
• The 2005-2009 American Community Survey County-to-County Migration Files provide tables for each county in the nation, showing both “inflows” and “outflows.”
• Later this year, a file from the 2006-2010 ASC 5-yr estimates, is planned to be released showing county-to-county flows by demographic characteristics, such as age, sex, and race and Hispanic origin.
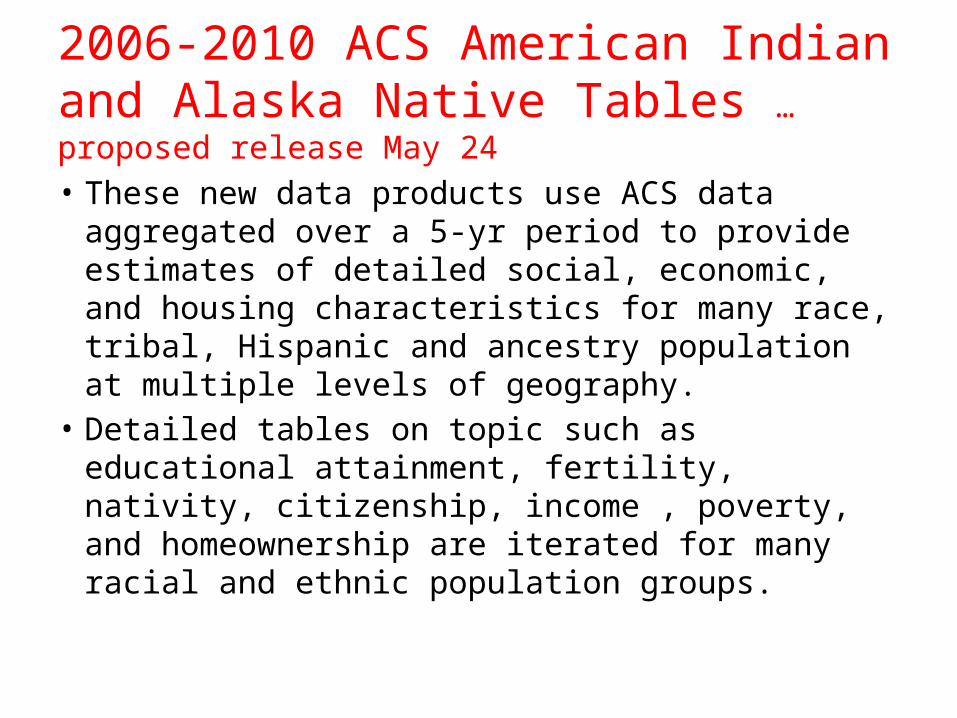
2006-2010 ACS American Indian and Alaska Native Tables … proposed release May 24
• These new data products use ACS data aggregated over a 5-yr period to provide estimates of detailed social, economic, and housing characteristics for many race, tribal, Hispanic and ancestry population at multiple levels of geography.
• Detailed tables on topic such as educational attainment, fertility, nativity, citizenship, income , poverty, and homeownership are iterated for many racial and ethnic population groups.

The Foreign-Born Population in the United States: 2010 … released 5/10/2012
• This report based on 2010 ACS estimates, examines difference in characteristics among foreign-born region-of-birth groups on a wide range of topics that include household, are, sex, marital status, fertility, period of entry into the United States, naturalization and citizenship status, language, education, labor force, occupation, health insurance coverage, income and poverty.
• The report also compares such characteristics by the foreign-born and native-born populations.

The annual population & housing unit estimates are released on a flow basis throughout the year, beginning with the national & state total estimates release in
December and ending with the state & county housing unit estimates release during the following summer
Population Detail Latest Date Available Date of Next ReleaseNational & State population & demographic components of population change
7/1/2011 12/2012 (7/1/2012 data)
State population 18 & over 7/1/2011 1/2013 (7/1/2012 data)
County population & demographic components of population change
7/1/2011 4/2013 (7/1/2012 data)
Metro & Micropolitan statistical area population & demographic components of population change
7/1/2011 4/2013 (7/1/2012 data)
National, State, and County populations by age, sex, race, & Hispanic origin: July 1, 2011
7/1/2009 5/2012
National, State, and County housing units
7/1/2009 6/2012
Incorporated place and minor civil division population
7/1/2009 6/2012
Schedule of New Estimates

Population Estimates for Counties, Metropolitan and Micropolitan Areas: July 1, 2011 (released 4/05/2012)
• These estimates are the 1st look at population growth or decline for these areas since the 2010 Census counts were released a year ago.
• Solid growth in Texas continues …– Out of 5 large metro areas (2011 populations of at least 1
million) among the 20 fastest growing from 2010 to 2011, 4 of them were in TX:• Austin (second)• San Antonio (16th)• Dallas-Ft. Worth (17th)• Houston (18th)

Population Estimates for Counties, Metropolitan and Micropolitan Areas: July 1, 2011 (continued)
• Dallas-Ft. Worth and Houston added more people between 2010 and 2011 than any other metro area (155,000 and 140,000, respectively.)
• Among county growth, the top 10 numeric gainers were all in the Sun Belt, with 4 in TX: Harris, Dallas, Bexar, and Tarrant.
• Houston metro area surpassed the 6 million mark between 2010 and 2011.
• Among the 50 fastest-growing counties from 2010 to 2011, Texas contained more of these counties than any other state, with 12.
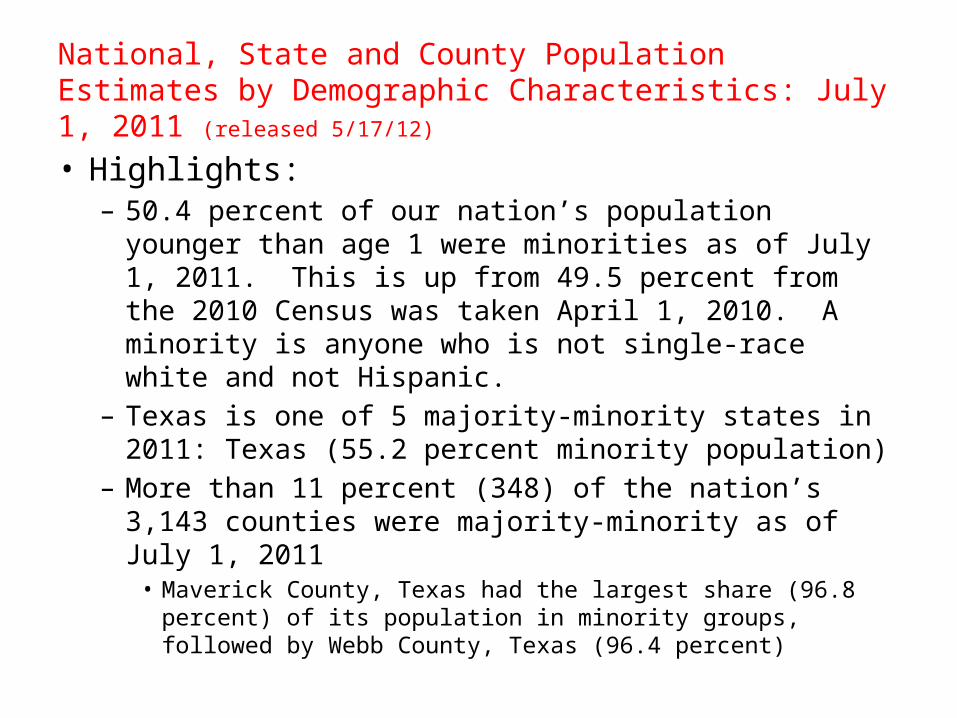
National, State and County Population Estimates by Demographic Characteristics: July 1, 2011 (released 5/17/12)
• Highlights:– 50.4 percent of our nation’s population younger than age 1
were minorities as of July 1, 2011. This is up from 49.5 percent from the 2010 Census was taken April 1, 2010. A minority is anyone who is not single-race white and not Hispanic.
– Texas is one of 5 majority-minority states in 2011: Texas (55.2 percent minority population)
– More than 11 percent (348) of the nation’s 3,143 counties were majority-minority as of July 1, 2011• Maverick County, Texas had the largest share (96.8 percent) of its
population in minority groups, followed by Webb County, Texas (96.4 percent)

National, State and County Population Estimates by Demographic Characteristics: July 1, 2011 (continued)
– Nationally, the most populous minority group remains Hispanics, who numbered 52 million in 2011.
– Starr County, Texas --- on the Mexican border – had the highest share of Hispanics (95.6 percent)
– African-Americans were the second largest minority group in the United States, at 43.9 million in 2011 (up 1.6 percent from 2010).• Texas had the largest numeric increase since 2010 (84,000).
– Non-Hispanic White Alone• Texas had the largest numeric increase in this population group
since 2010 (80,000).
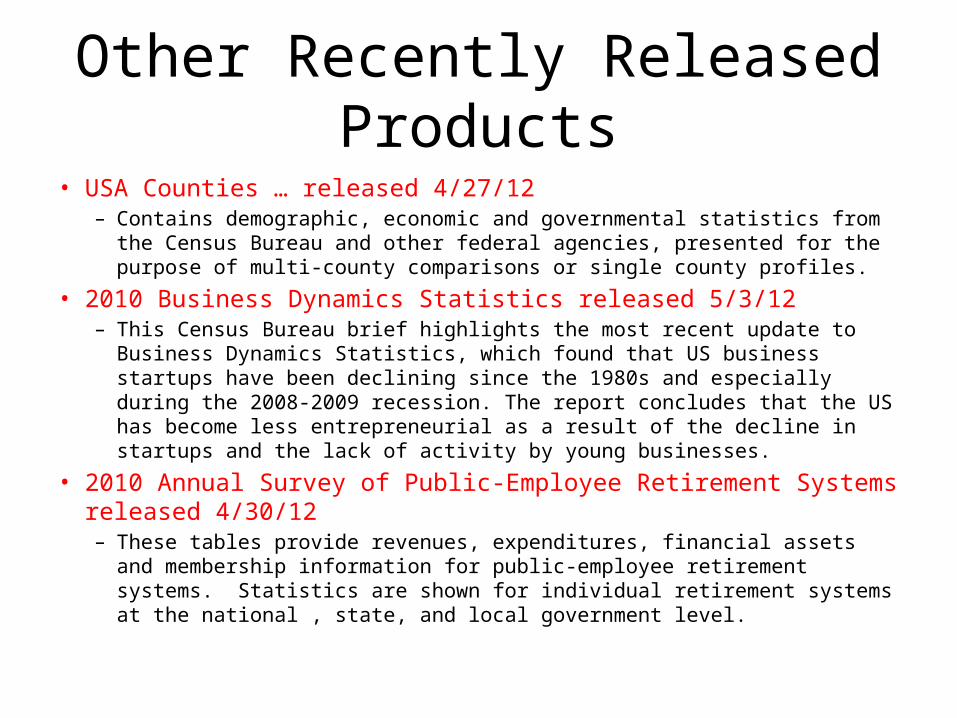
Other Recently Released Products• USA Counties … released 4/27/12
– Contains demographic, economic and governmental statistics from the Census Bureau and other federal agencies, presented for the purpose of multi-county comparisons or single county profiles.
• 2010 Business Dynamics Statistics released 5/3/12– This Census Bureau brief highlights the most recent update to Business
Dynamics Statistics, which found that US business startups have been declining since the 1980s and especially during the 2008-2009 recession. The report concludes that the US has become less entrepreneurial as a result of the decline in startups and the lack of activity by young businesses.
• 2010 Annual Survey of Public-Employee Retirement Systems released 4/30/12– These tables provide revenues, expenditures, financial assets and membership
information for public-employee retirement systems. Statistics are shown for individual retirement systems at the national , state, and local government level.

The Census Bureau homepage lists some of
the most current press & product releases
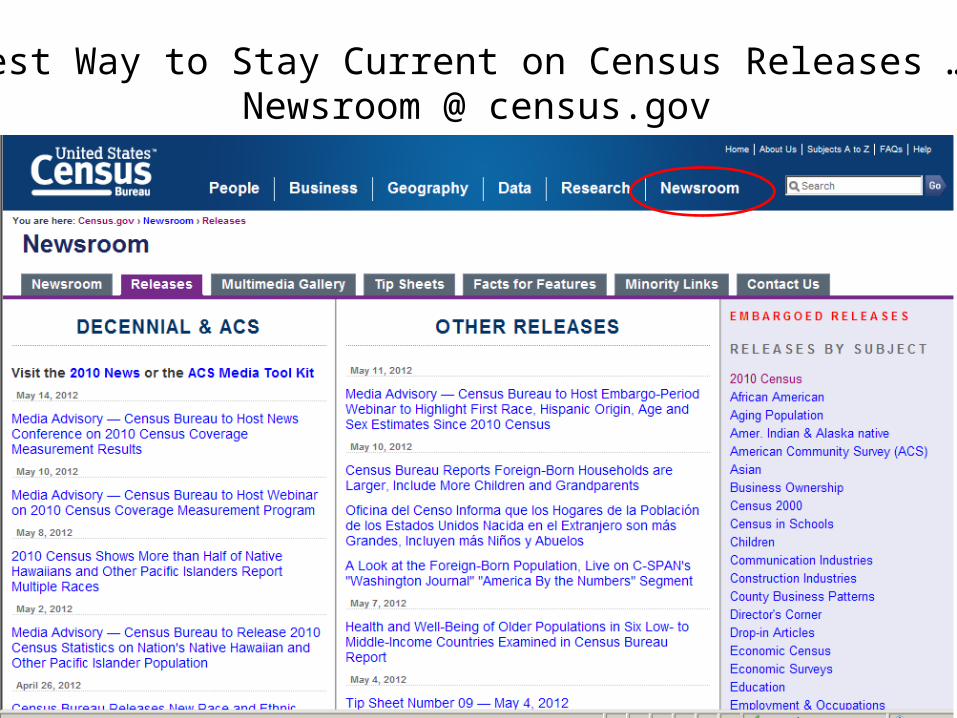
Best Way to Stay Current on Census Releases … Newsroom @ census.gov
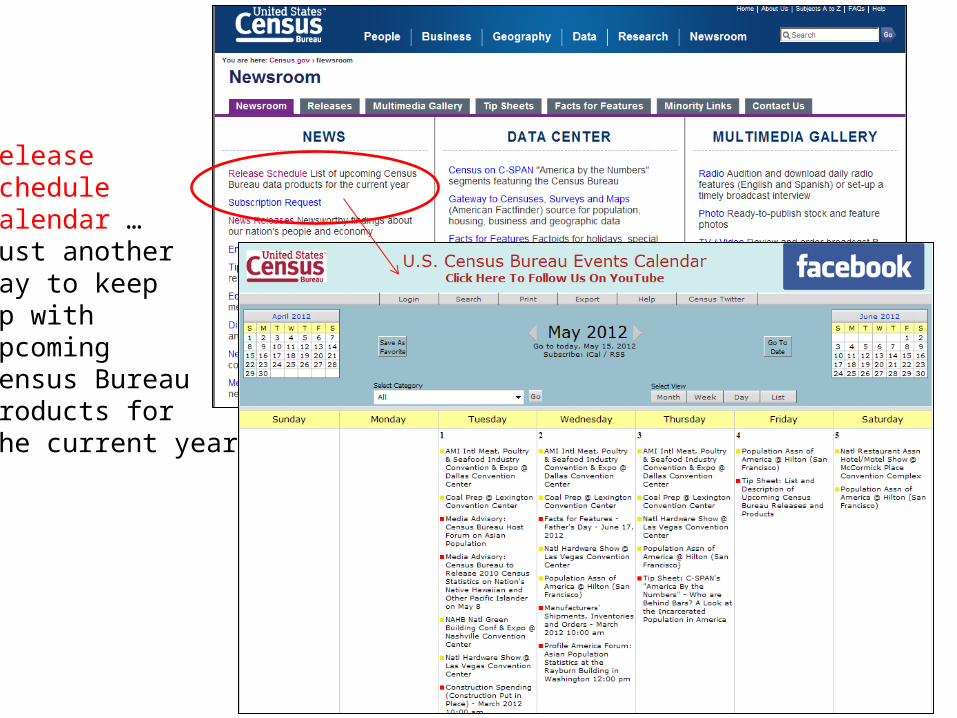
Release ScheduleCalendar …just anotherway to keepup with upcomingCensus Bureauproducts for the current year


Thank You


