Data Quality Enhancement in Oil Reservoir Operations: An application of IPMAP Paul Hong-Yi Lin Working Paper CISL# 2012-03 June 2012 Composite Information Systems Laboratory (CISL) Sloan School of Management, Room E62-422 Massachusetts Institute of Technology Cambridge, MA 02142
Transcript
Data Quality Enhancement in Oil Reservoir Operations:
An application of IPMAP
Paul Hong-Yi Lin
Working Paper CISL# 2012-03
June 2012
Composite Information Systems Laboratory (CISL)
Sloan School of Management, Room E62-422
Massachusetts Institute of Technology
Cambridge, MA 02142
1
Data Quality Enhancement in Oil Reservoir Operations: An application of IPMAP
By
Paul Hong-Yi Lin
BASc. Electrical Engineering (2006) The University of British Columbia
Submitted to the System Design and Management Program in Partial Fulfillment of the Requirements for the Degree of
The author hereby grants to MIT permission to reproduce and to distribute publicly paper and electronic copies of this thesis document in whole or in part in any medium now known or
hereafter created.
Signature of Author______________________________________________________
Paul Hong-Yi Lin System Design and Management Program
System Design & Management Program Massachusetts Institute of Technology
2
Data Quality Enhancement in Oil Reservoir Operations: An application of IPMAP
By
Paul Hong-Yi Lin
Submitted to the System Design and Management Program
on March 1, 2012 in Partial Fulfillment of the Requirements for the Degree of Master of Science in Engineering and Management
ABSTRACT
This thesis presents a study of data quality enhancement opportunities in upstream oil and gas industry. Information Product MAP (IPMAP) methodology is used in reservoir pressure and reservoir simulation data, to propose data quality recommendations for the company under study. In particular, a new 4-step methodology for examining data quality for reservoir pressure management systems is proposed:
1. Trace the data flow and draw the IPMAP
2. Highlight the cross-system and organizational boundaries
3. Select data quality analytical questions based on data quality literature review
4. Apply the analytical questions at each boundary and document the results
This original methodology is applied to the three management systems to collect a pressure survey: using a spreadsheet, a standardized database and an automated database. IPMAPs are drawn to each of these three systems and cross-system and organizational boundaries are highlighted. Next, data quality systematic questions are applied. As a result, three data quality problems are identified and documented: well identifier number, well bore data and reservoir datum. The second experiment investigates the data quality issues in the scope of reservoir simulation and forecasting. A high-level IPMAP and a process flow on reservoir simulation and forecasting are generated. The next section further elaborates on the first high level process flow and drills into the process flow for simulation. The analytical data quality questions are raised to the second simulation process flow and limited findings were documented. This thesis concludes with lessons learned and directions for future research. Thesis Advisor: Stuart E. Madnick John Norris Maguire Professor of Information Technology Sloan School of Management Professor of Engineering Systems School of Engineering Massachusetts Institute of Technology
3
ACKNOWLEDGEMENTS
I would like to thank Professor Stuart Madnick for his support, insight, and guidance in the course of my research. I would like to thank Allen Moulton and Yang Lee for providing detail guidance and research directions. I would also like to thank Director Patrick Hale for making the SDM program flexible to tailor to individual needs. In addition, I would like to thank the colleagues in the EG organization who has spent time with me for interview and data collection. Finally, I would like to thank my family and friends for love and support during my study at MIT.
4
This page is intentionally left blank.
5
Table of Contents 1. Introduction .......................................................................................................................................... 8
1.1 Research Motivation .................................................................................................................. 8
1.2 Research Objective .................................................................................................................... 9
1.3 Research Framework (Qualitative Case Study) .................................................................. 10
1.4 Structure of Thesis ................................................................................................................... 12
Figure 1: Data Longevity ............................................................................................................ 8 Figure 2: Reservoir Information Process Flow ...........................................................................11 Figure 3: EG Upstream Business Information Map ...................................................................13 Figure 4: Generation and Migration of Oil and Gas ...................................................................15 Figure 5: The Seismic Method ..................................................................................................15 Figure 6: Oil Perforations ..........................................................................................................16 Figure 7: Waterflood .................................................................................................................17 Figure 8: Five Nodes of IPMAP .................................................................................................23 Figure 9: LCM of Pressure Survey ............................................................................................29 Figure 10: Example of Pressure Survey ....................................................................................31 Figure 11: BHP Survey Search .................................................................................................31 Figure 12: IPMAP on Spreadsheet Process ..............................................................................32 Figure 13: IPMAP of RIS ...........................................................................................................35 Figure 14: Enter API Number ....................................................................................................37 Figure 15: Search API ...............................................................................................................37 Figure 16: Vendor and Well Information Check .........................................................................38 Figure 17: Verify Test Conditions ..............................................................................................38 Figure 18: Charted Data ............................................................................................................39 Figure 19: IPMAP of WPS .........................................................................................................40 Figure 20: Data Loaded Automatically from WPL ......................................................................41 Figure 21: User-inputted Values ................................................................................................41 Figure 22: Design Pressure Bomb ............................................................................................42 Figure 23: FFP Three Step Workflow ........................................................................................55 Figure 24: High Level IPMAP for Simulation .............................................................................57 Figure 25: Process Flow for Design a New Subsurface Development .......................................59 Figure 26: Process Flow for Simulation .....................................................................................62
7
List of Tables
Table 1: Data Quality Dimensions .............................................................................................18 Table 2: Comparison Summary - IPMAP with Other Modeling Methods ....................................21 Table 3: Simulation Analytical Questions ..................................................................................28 Table 4: Data Quality Dimensions Summary .............................................................................28 Table 5: Data Quality Dimensions .............................................................................................45 Table 6: Spreadsheet Analysis ..................................................................................................46 Table 7: RIS Analysis ................................................................................................................48 Table 8: WPS Analysis ..............................................................................................................50 Table 9: System Level Analysis ................................................................................................52 Table 10: Simulation Analytical Questions ................................................................................64 Table 11: Data Quality Dimensions Summary ...........................................................................64
8
1. Introduction
1.1 Research Motivation
The Fundamental Problem EnerGizer Inc. (EG) is an oil and gas company1 that has global operations in oil productions and refineries. Profit of an oil and gas company derives primarily from its upstream business. Upstream oil and gas business refers to the searching for and the recovery and production of crude oil and natural gas. Upstream oil and gas decisions draw on massive quantities of data, internal EG analyst estimates that the data generated by its upstream business is growing at 60% per year. Furthermore, oil reservoir simulation and forecasting requires complex engineering data calculations and assumptions. As a result, data quality plays a critical role in the profitability of EG. In general, the upstream oil and gas data quality problems can be summarized below:
Data longevity: reservoir information value varies over its life cycle. In some cases, it
declines uniformly and eventually becomes negative as shown in the Figure 1 ( Source:
EG internal report) below. Or it could cyclically regain value through operational re-use.
Therefore it is a challenge to decide on the data retention period. In addition, EG has a
very long lived field that has reservoir pressure data predates 1927.
Figure 1: Data Longevity
Data accumulation: EG has over 52,0002 active wells. The Bureau of Ocean Energy Management, Regulation and Enforcement (BOEMRE) has a specific requirement for BHP surveys. For each new reservoir, a static BHP survey must be completed within 3 months after the date of first continuous production. EG also has an internal policy to conduct pressure surveys to a significant portion of its wells annually. As a result, vast amount of reservoir pressure information are accumulated every year.
1 Although EG is a fictitious name, the research was conducted at an actual company
2 From EG official website
9
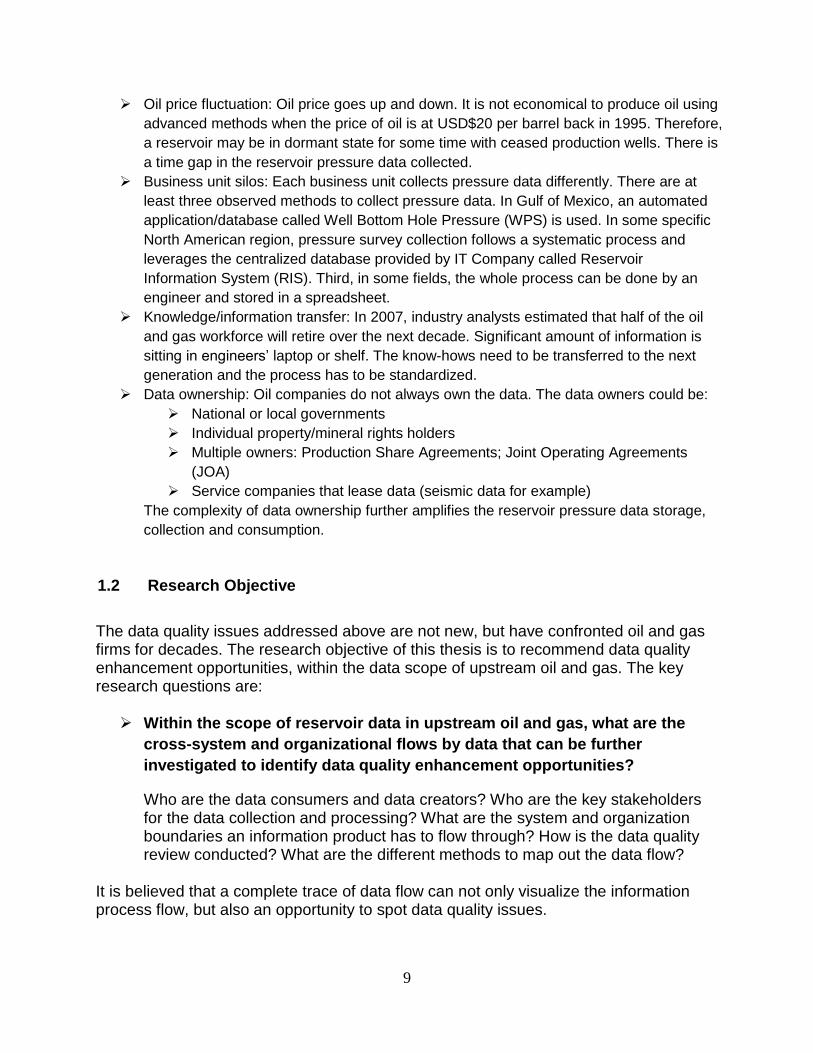
Oil price fluctuation: Oil price goes up and down. It is not economical to produce oil using
advanced methods when the price of oil is at USD$20 per barrel back in 1995. Therefore,
a reservoir may be in dormant state for some time with ceased production wells. There is
a time gap in the reservoir pressure data collected.
Business unit silos: Each business unit collects pressure data differently. There are at
least three observed methods to collect pressure data. In Gulf of Mexico, an automated
application/database called Well Bottom Hole Pressure (WPS) is used. In some specific
North American region, pressure survey collection follows a systematic process and
leverages the centralized database provided by IT Company called Reservoir
Information System (RIS). Third, in some fields, the whole process can be done by an
engineer and stored in a spreadsheet.
Knowledge/information transfer: In 2007, industry analysts estimated that half of the oil
and gas workforce will retire over the next decade. Significant amount of information is
sitting in engineers’ laptop or shelf. The know-hows need to be transferred to the next
generation and the process has to be standardized.
Data ownership: Oil companies do not always own the data. The data owners could be:
National or local governments
Individual property/mineral rights holders
Multiple owners: Production Share Agreements; Joint Operating Agreements
(JOA)
Service companies that lease data (seismic data for example)
The complexity of data ownership further amplifies the reservoir pressure data storage,
collection and consumption.
1.2 Research Objective
The data quality issues addressed above are not new, but have confronted oil and gas firms for decades. The research objective of this thesis is to recommend data quality enhancement opportunities, within the data scope of upstream oil and gas. The key research questions are:
Within the scope of reservoir data in upstream oil and gas, what are the
cross-system and organizational flows by data that can be further
investigated to identify data quality enhancement opportunities?
Who are the data consumers and data creators? Who are the key stakeholders for the data collection and processing? What are the system and organization boundaries an information product has to flow through? How is the data quality review conducted? What are the different methods to map out the data flow?
It is believed that a complete trace of data flow can not only visualize the information process flow, but also an opportunity to spot data quality issues.
10
1.3 Research Framework (Qualitative Case Study)
A Case Study Approach The approach of this thesis is primarily based on case studies. As identified in S. Madnick et al.’s paper “Overview and Framework for Data and Information Quality Research” (2009), Case Study is one of the high level data quality research method. The case study is an empirical method that uses a mix of quantitative and qualitative evidence to examine a phenomenon in its real-life context (Yin 2002). The in-depth inquiry of a single instance or event can lead to a deep understanding of why and how it happened. Useful hypotheses can be generated and tested using case studies (Flyvbjerg 2006). The method is widely used in data quality research. For example, Davidson et al. (2004) reported a longitudinal case study in a major hospital on how information product maps were developed and used to improve data quality. Several other data quality case studies can be found in (Lee et al. 2006). Two-Phase Approach An overlapping and simultaneous two phase research effort is applied. In other words, this approach is drilling two wells at the same time. This thesis is to look into two different data quality experiments using IPMAP. Experiment 1 The first case is to apply IPMAP to the reservoir pressure data. More specifically, the IPMAP is applied to the three different known management systems of collecting pressure data as indicated in the reservoir pressure problem section earlier. This thesis is to suggest a new method to examine the data quality, in which is original in the data quality and IPMAP research field. This approach is to highlight the cross-system and organizational boundary on the IPMAPs drawn. The data quality questions, which are derived from data quality literatures, are applied at these cross-system and organizational boundaries. This approach is applied to a detailed physical level to monitor and trace the data flow. Experiment 2 The second case is to apply IPMAP to reservoir simulation and forecasting. IPMAP is applied to a high level or architecture level of reservoir simulation and forecasting. The IPMAP then attempts to drill into further details of data flow. This experiment will also look into the use of process flow, in addition to the IPMAP approach, to search for data quality improvement opportunities
11
To understand more how does pressure survey fit into the overall upstream oil and gas business, the reservoir information process flow as shown in Figure 2 is referenced from MIT Information Quality program and EG.
Figure 2: Reservoir Information Process Flow
The first step of reservoir pressure information collection involves having vendor to perform actually data measurement at a well. The second step is to process and transform the collected data into data analytics and estimates by reservoir engineer. The third step is to store the reservoir pressure data into a database. The Experiment 1 of pressure survey will be involved with the first three steps of the above process flow. The Experiment 2 involves the accumulation of the data in Experiment 1 and includes the fourth step which is to do reservoir modeling by simulation engineers. The ultimate results of either of the processes feed into asset development team or operation team. How does the selected approach address the key research questions? The IPMAP approach is selected because it could map out clearly the data flow during its life cycle. IPMAP can provide visualizations of the entire data flow and can isolate the system and organizational boundaries. Two different experiments are chosen in order to verify the applicability of IPMAP at both physical and architectural level. Reservoir simulation and forecasting is selected because this process is performed based on the accumulated pressure data in the first experiment. This would represents a significant portion of the oil upstream business, as the combination of the two experiments monitors how pressure data is collected and is feed into data transformation, simulation and forecasting, for business decision analysis. Data Sources A hallmark of case study research is the use of multiple data sources, a strategy which also enhances data credibility (Patton, 1990; Yin, 2003). Potential data sources of this thesis include, but are not limited to: EG documentation, EG archival records, interviews with IT representative and subject matter experts, direct observations, and participant-observation. Within this case study research, critical qualitative and quantitative data
12
are collected, and they facilitate reaching a holistic understanding of the phenomenon being studied. Detailed academic resources are documented in the appendix section.
1.4 Structure of Thesis
Chapter 1 starts with the research motivation of the thesis. The fundamental problems of data in upstream oil and gas industry are listed. The research objective and key research questions are stated. The thesis methodology, two phase approach of drilling two experiments at the same time are explained with ties to the research questions. Chapter 2 provides background and literature information. In particular, an overview of upstream oil and gas industry is presented. Basic oil and gas exploration, appraisal, and production concepts are introduced to give a better understanding of the problems at hand. The second part of this chapter explains the fundamental ideas of an Information Product Map (IPMAP). Chapter 3 begins with the problems that the company under study is encountering in getting the accurate information about reservoir pressure. The three methodologies of obtaining pressure surveys are drawn into IPMAP. The data quality analytical questions are applied at cross-organizational boundaries. Potential data quality problems are discovered and recommendations are made. Chapter 4 explains the simulation and forecast aspect of the upstream oil business. Multiple methods are used in this section in an attempt to identify data quality issues: IPMAP and process flow chart. The correlation of IPMAP with enterprise architecture is investigated and data quality issue is documented. Chapter 5 concludes and summarizes the findings in this research. Areas for future research opportunities are suggested as well as the research improvement recommendations. 1.5 Confidentiality Production data and diagrams presented in this thesis have been distorted or are hypothetical for the purpose of ensuring the confidentiality of information proprietary to the company under study.
13
2. Background and Literature
2.1 Upstream Oil and Gas Industry The oil and gas industry is commonly categorized into three major groups: Upstream, midstream and downstream, given midstream operations are typically included in the downstream category. This thesis will focus in the upstream oil sector, which typically refers to the searching for and the recovery and production of crude oil and natural gas. The upstream oil sector is also known as the exploration and production (E&P) sector.
In EG’s organization, the upstream business management division oversees four major business functions: Exploration and appraisal, field development, production management and field operations. In addition, business function of subsurface characterization and modeling and drilling completions and workovers act as support teams to the above-mentioned four major business units. As depicted in Figure 3, reference from EG internal document, each business function is subdivided into next-level groups.
Figure 3: EG Upstream Business Information Map
14
EG’s organization has identified that sound reservoir management is an essential requirement of any successful oil and gas company. According to EG’s Vice Chairman of the Board and Executive Vice President, Global Upstream and Gas, “EG’s future success will in large part be measured by the ability to grow upstream production, while similarly growing the reserve base to enable further sustained production growth.” Major oil companies are valued mainly on their proved reserves volumes as proved reserves are seen as a clear indicator of a company’s future earning capability. Consequently, for a company to sustain its competitive position, it needs to continue to replenish its proved reserves base as quickly as it is produced. As EG plans to grow production over the next ten years, they must maintain a Reserves Replacement Ratio (RRR) in excess of 100% in order to maintain their competitive position. The market valuation depends on how attractive the future looks for the company under study. With less and less access to new basins and sizeable resources in many countries, EG will have to focus more on what they have already discovered and how they can more effectively turn resources to reserves to production. Reservoirs and crude oil production Crude oil is a mixture of molecules formed by carbon and hydrogen atoms. Many types of crude oils exist, some more valuable than others. Heavy crude oils are very thick and viscous and are difficult or impossible to produce, whereas light crude oils are very fluid and relatively easy to produce (Hyne 2001). In order to have a commercial deposit of gas or oil, three geological conditions must have been met (Hyne 2001). First, there must be a source rock in the subsurface of that area that generated the gas or oil at some time in the geological past. Second, there must be a separate, subsurface reservoir rock to hold the gas or oil. Third, there must be a trap on the reservoir rock to concentrate the gas or oil into commercial quantities. The source of gas and oil is the organic matter that is buried and preserved in the ancient sedimentary rocks. In the subsurface, temperature is the most important factor in turning organic matter into oil (Hyne 2001). As the source rock is covered with more sediment and buried deeper in the earth, it becomes hotter and hotter. The minimum temperature for the formation of oil is about 120°F. The reactions that change organic matter into oil are complex and time consuming. If the source rock is buried deeper where temperatures are above 350°F, the remaining organic matter will generate natural gas. After oil and gas have been generated, they rise through fractures in the subsurface rocks. The rising gas and oil can intersect a layer of reservoir rock. A reservoir rock is a sedimentary rock that contains billions of tiny spaces called pores (Hyne 2001). The gas and oil flow into the pores of the reservoir rock layer. Water, gas or oil will always flow along the path of least resistance. In the subsurface, a reservoir rocky layer has the least resistance. The ease in which the fluid can flow through the rock is called
15
permeability, and the movement of the gas and oil up the angle of the reservoir rock toward the surface is called migration. Figure 4 illustrates the generation and migration of oil and gas.
Figure 4: Generation and Migration of Oil and Gas3
As the gas and oil migrates up along the reservoir rock, it can encounter a trap. A trap is a high point in the reservoir rock where the gas or oil is stopped and concentrated. In the trap, the fluids separate according to their density. The gas goes on to the top to form gas cap. Oil goes into the middle layer. The water stays at the bottom. A caprock or seal rock must be present to enclose the fluids and complete a trap. Oil and gas could leak up to the surface without a caprock.
Figure 5: The Seismic Method4
So how do oil and gas companies locate the reservoirs? Seismic exploration method is the answer. Seismic exploration uses an acoustic source and several hydrophone array
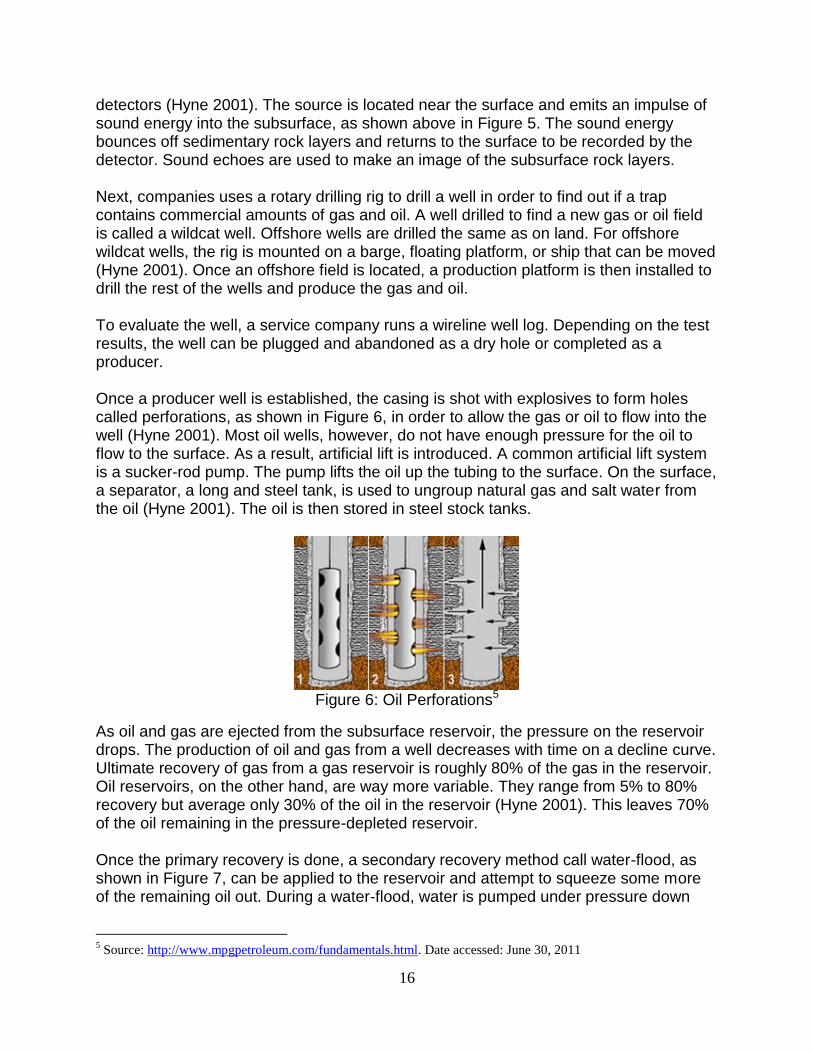
detectors (Hyne 2001). The source is located near the surface and emits an impulse of sound energy into the subsurface, as shown above in Figure 5. The sound energy bounces off sedimentary rock layers and returns to the surface to be recorded by the detector. Sound echoes are used to make an image of the subsurface rock layers. Next, companies uses a rotary drilling rig to drill a well in order to find out if a trap contains commercial amounts of gas and oil. A well drilled to find a new gas or oil field is called a wildcat well. Offshore wells are drilled the same as on land. For offshore wildcat wells, the rig is mounted on a barge, floating platform, or ship that can be moved (Hyne 2001). Once an offshore field is located, a production platform is then installed to drill the rest of the wells and produce the gas and oil. To evaluate the well, a service company runs a wireline well log. Depending on the test results, the well can be plugged and abandoned as a dry hole or completed as a producer. Once a producer well is established, the casing is shot with explosives to form holes called perforations, as shown in Figure 6, in order to allow the gas or oil to flow into the well (Hyne 2001). Most oil wells, however, do not have enough pressure for the oil to flow to the surface. As a result, artificial lift is introduced. A common artificial lift system is a sucker-rod pump. The pump lifts the oil up the tubing to the surface. On the surface, a separator, a long and steel tank, is used to ungroup natural gas and salt water from the oil (Hyne 2001). The oil is then stored in steel stock tanks.
Figure 6: Oil Perforations5
As oil and gas are ejected from the subsurface reservoir, the pressure on the reservoir drops. The production of oil and gas from a well decreases with time on a decline curve. Ultimate recovery of gas from a gas reservoir is roughly 80% of the gas in the reservoir. Oil reservoirs, on the other hand, are way more variable. They range from 5% to 80% recovery but average only 30% of the oil in the reservoir (Hyne 2001). This leaves 70% of the oil remaining in the pressure-depleted reservoir. Once the primary recovery is done, a secondary recovery method call water-flood, as shown in Figure 7, can be applied to the reservoir and attempt to squeeze some more of the remaining oil out. During a water-flood, water is pumped under pressure down
5 Source: http://www.mpgpetroleum.com/fundamentals.html. Date accessed: June 30, 2011
injection wells into the depleted reservoir to force some of the remaining oil through the reservoir toward producing wells. Enhanced oil recovery involves pumping fluids that are not natural to the reservoir, such as carbon dioxide or steam, down injections wells to obtain more production.
Figure 7: Waterflood6
After the well has been depleted, it is plugged and abandoned. Cement must be poured down the well to seal the depleted reservoir and to protect any subsurface fresh water reservoirs. A steel plate is then welded to the top of the well.
2.2 Data Quality: IPMAP Approach
Data Quality Poor data quality can have a severe impact on the overall effectiveness of an organization. An industry executive report noted that more than 60% of surveyed firms (500 medium-size corporations with annual sales of more than $20 million) had problems with data quality. The Wall Street Journal also reported that, “Thanks to computers, huge databases brimming with information are at our fingertips, just waiting to be tapped. They can be mined to find sales prospects among existing customers; they can be analyzed to unearth costly corporate habits; they can be manipulated to divine future trends. Just one problem: Those huge databases may be full of junk. . . .In a world where people are moving to total quality management, one of the critical areas is data.” The quality of a product depends on the process by which the product is designed and produced (Wand and Wang 1996). Likewise, the quality of data depends on the design and production processes involved in generating the data. To design for better quality, it is necessary first to understand what quality means and how it is measured. Data
quality, as presented in the literature, is a multidimensional concept. Frequently mentioned dimensions are accuracy, completeness, consistency, and timeliness. The choice of these dimensions is primarily based on intuitive understanding (Ballou and Pazer 1985), industrial experience (Firth and Wang 1996), or literature review (Kriebel 1979). However, a literature review (Wang, Storey and Firth 1995) shows that there is no general agreement on data quality dimensions. Wand and Wang provided a summary of data quality dimensions from various literatures as shown in Table 1.
Table 1: Data Quality Dimensions
The table provided the most often cited7 data quality dimensions based on a comprehensive literature review (Wang, Storey and Firth 1995). The descriptions and definitions for the top-cited data quality dimensions are documented below. Accuracy and Precision: There is no exact definition for accuracy. According to Wand and Wang, inaccuracy can be interpreted as a result of garbled mapping into a wrong state of the information system. Lack of precision is a case which is typically viewed as inaccuracy. Incompleteness may cause choice of a wrong information system state during data production, resulting in incorrectness. Note that inaccuracy refers to cases where it is possible to infer a valid state of the real world, but not the correct one. This is different from the case of meaningless states where no valid state of the real world can be inferred. Reliability: Reliability has been linked to probability of preventing errors or failures (Hansen 1983), to consistency and dependability of the output information (Kriebel 1979), and to how well data ranks on accepted characteristics (Agmon and Ahituv). In addition, reliability
7 Each appearance in a published article is counted as one citation. Thus, the result is biased in favor of the
dimensions used by authors who have published extensively and authors whose articles have been quoted by others.
However, as as indicator of the notable data quality dimensions, the result provides a reasonable basis for further
discussion.
19
has been interpreted as a measure of agreement between expectations and capability (Brodie 1980), and as how data conforms to user requirements or reality (Agmon and Ahituv). It is clear there is no generally accepted notion of reliability and that it might be related either to characteristics of the data or of the system. Timeliness and Currency: Timeliness has been defined in terms of whether the data is out of date (Ballou and Pazer 1985) and availability of output on time (Kriebel 1979). A closely related concept is currency which is interpreted as the time a data item was stored (Wang, Reddy and Kon 1995). Timeliness is affected by three factors: How fast the information system state is updated after the real-world system changes (system currency); the rate of change of the real-world system (volatility); and the time the data is actually used. While the first aspect is affected by the design of the information system, the second and third are not subject to any design decision. Lack of timeliness may lead to a state of the information system that reflects a past state of the real world. Completeness: Generally, the literature views a set of data as complete if all necessary values are included: “All values for a certain variable are recorded” (Ballou and Pazer 1985). Completeness is the ability of an information system to represent every meaningful state of the represented real world system (Wand and Wang 1996). Thus, it is not tied to data-related concepts such as attributes, variables, or values. A state-based definition to completeness provides a more general view than a definition based on data; in particular, it applies to data combinations rather than just to null values. Also, it enables data items to be mandatory or optional depending on the values of other data items. Consistency: In the literature, consistency refers to several aspects of data. In particular, it links to values of data, to the representation of data, and to physical representation of data. A data value can only be expected to be the same for the same situation. Inconsistency would mean that the representation mapping is one to many. IPMAP Literature in data quality management, reflecting over three decades of research, has suggested many viable solutions for assessing, managing, and improving quality (Shankaranarayanan and Wang 2007). The Total Data Quality Management (TDQM) approach for systematically managing data quality in organizations is a dominant paradigm (Wang 1998). This addresses not just data but also the processes that create that data. It is based on the perspective of managing data as a product and adopts several concepts from the manufacture of physical products. One of these is modeling and representing the manufacture of data products (Wang et al. 1998). In this thesis, the analysis is based on research on models for data manufacture, focusing on the Information Product Map (IPMAP) (Shankaranarayanan et al. 2003).
20
Visualizing the Creation of an Information Product Given the volumes of data and the complexity in managing data within organizations, it is becoming increasingly evident that a formal modeling method that can alleviate the task of data quality managers is needed. This can be accomplished by offering data quality managers the ability to represent, in an intuitive and easy manner, the complex “production” systems that are used to capture, store, create, and communicate data in organizations (Shankaranarayanan and Wang 2007). A graphical representation of the different process elements (Ballou et al. 1998) can be used to create a visualized mapping of the data process. One such representation is the IPMAP. The IPMAP is an extension of the Information Manufacturing System or IMS proposed in (Ballou et al. 1998). Process documentation, specifically in a visual form, contributes to data quality improvement and provides an important tool to all information stakeholders – managers will find it important for capturing the entire process and understanding all the elements that are involved (Redman 1996), (Shankaranarayanan et al. 2003). According to Shankaranarayanan and Wang (2007), the IPMAP helps the data quality manager (the custodian) see what raw materials are used (source blocks), what processing is performed and what new data is created (processing blocks and output data elements), what intermediate storages are involved (storage blocks), how data elements are assembled to create subcomponents and final IPs (assembly – variation of processing blocks), what quality checks are conducted (inspection blocks), whether a subcomponent is reworked (cyclic flows), how the final IP is formatted (variation of processing blocks) and who is using the IP (consumer block). Distinguishing IPMAP from Other Modeling Methods The IPMAP, in data quality management, serves primarily as a management tool that helps analyze and understand data manufacturing processes (Shankaranarayanan and Wang 2007). It is important to understand how other modeling methods are different from IPMAP and whether if they can complement or substitute the IPMAP. Shankaranarayanan and Wang reviewed some of these methods and discussed the relative merits and demerits of the IPMAP. A summary of this comparison is presented in the table below.
Model / Software Tool How does it differ from IPMAP? Can it complement / substitute the IPAMP?
Process Flow Chart (top down chart or a detailed flow chart)
Shows the steps within a process. The arrows between stages capture the predecessor / successor association. The flow of data is not captured.
Can complement the IPMAP. Process stages within the IP and the business rules/logic associated with each processing stage can be made explicit using Process Flow Charts.
21
Assembly Diagram (a popular use of the flow chart)
Shows the assembly stages that a physical product goes through as it assembled from raw materials to a finished product. The arrows represent the “product flow” through the different stages.
Can substitute the IPMAP for representing the “assembly” of the IP, i.e., constructs offered here can be used to depict the manufacture of the IP. It is designed to represent physical product manufacture and is therefore restricted in its ability to show the different types of processing and storage associated with creating IPs.
Conceptual Data Models (such as ERM)
Is data centric and offers a navigational view of data and data relationships. Represent facts about the real world and cannot represent the flow of data nor can it represent processing. These are not intuitive and require formal training to understand.
Can complement the IPMAP. Data storages in the IPMAP can be described in considerable detail using conceptual data models. Cannot substitute the IPMAP.
Work Flow Models and its predecessor, Work Flow Charts
Are similar to an IPMAP in many respects. Represents activities, data, and data flow in a business process and supports analyses and automation. Key benefit - can represent the checks and balances required to implement the flow of work within a business process. Can also associate roles or individuals with tasks and can specify control flows that define dependency relationships among tasks. Work flow models typically deal with a much deeper level of process granularity compared to IPMAPs.
Can substitute the IPMAP given certain restrictions due to the fact that they are not designed for this purpose. Offers a more process-centric view of the manufacture, while the IPMAP offers a product-centric view of the manufacture. Can also complement the IPMAP if used to represent a more granular descriptions of processes.
Microsoft Visio - a popular tool used to create models
Offers a variety of process diagramming templates that can make the task of creating flow charts, data flow diagrams, some UML diagrams, and work flow diagrams, easy. Does not offer the ability to capture and communicate metadata associated with model constructs, unlike specialized tools that support some of the other models (ERWin, Sybase Power Designer, Oracle CASE)
May be used to create preliminary representations of the IPMAP. Cannot support all the features of the IPMAP due to the lack of a backend metadata repository
Table 2: Comparison Summary - IPMAP with Other Modeling Methods
22
Evaluating Data Quality in Context A key principle of leveraging Information Product Map (IPMAP) in a given scenario is that the concept of information must be managed as a product using an information product approach, or IP approach. Contrast this approach to the often observed treatment of information as by-product. The by-product approach places its focus on the wrong target, usually the system instead of the end product, the information (Lee et al. 2006). A data element is defined as the smallest unit of a given data. Examples of a data element are names, data of birth, degree programs and etc. Information product is defined as a collection of data elements. Each information product has to have a specific data consumer. The data consumer is the final node on an IPMAP. Data consumers could be government regulatory reports, senior management teams, and legal representatives. According to Lee et al. (2006), managing information as product requires a fundamental change in understanding information. To properly treat information as product, a company must follow four rules:
Understand the consumer’s information needs.
Manage information as the product of a well-defined production process.
Manage information as a product with a life cycle.
Appoint an information product manager to manage the information product.
The IPMAP offers a comprehensive view of the data used in a decision-task by informing the consumer about the sources or providers of the data, storages, transformations and processing, logic and assumptions associated with these transformations and processing, and the custodians associated with each of these stages (Shankaranarayanan and Wang 2007). It further provides access to the methods for evaluating quality. The consumer or decision-maker now has the ability to compute and gauge the quality of the data in the context of the task in which the data is to be used. The decision maker would do so by assigning weights to the data, reflecting the perceived importance of that data for the task it is used.
Need for Managing DQ in Inter-organizational settings The advances in information technology (IT) greatly facilitate inter-organizational data exchange. IT reduces the data collection, transfer and processing costs and makes data assets more attractive and valuable to create, own, and manage. Daniel and White (2005) suggest that the inter-organizational data linkages will become ubiquitous in the future. Data networks for inter-organizational data exchange are characterized by multiple, independent data sources from which this data is extracted, and multiple, independent data repositories in which the data is captured / stored. Data management for decision-making in such environments involves gathering relevant data from outside the organization and integrating it with local data. Organizations appear to implicitly
23
assume that the quality of the data obtained from other organizations is acceptable. Research indicates that poor data quality (DQ) is a serious problem within many organizations (e.g., Eckerson 2002). In a network supporting data exchange among organizations, it is important to assure organizations of the quality of data they get from other organizations. A prerequisite is that organizations must first manage DQ internally. Further, organizations use data received from another organization as inputs (either directly or after processing) to their business operations and decision-making. The issue of data quality is therefore not local to or isolated within one specific organization. Developing Information Product Maps To execute the information product approach, a firm needs not only a supportive philosophy but also models, tools, and techniques. In this thesis, five possible nodes of collect, quality analysis, store, process, consume will be representing the information product flow, as illustrated in Figure 8.
Figure 8: Five Nodes of IPMAP
Detail contents of these five nodes are customized and documented in the later section of the reservoir pressure IPMAP. As a general rule, collect nodes is the start node of an IPMAP. Collect is the process of capturing the initial information product or involves in the creation of the information product. There can be more than one collect node, despite the fact that typically one collect node is sufficient. Quality analysis (QA) node is one of the process nodes and specializes in information quality verification. It is common to have several QA nodes in an IPMAP as the ultimate benefit of IPMAP is to trace the information flow thoroughly and to enhance data quality. Store node is also a very popular node that will be appeared quite often. This can be the firm’s data management systems, databases or storage space of an application or tool. There are no changes to the data here as this process node is only for storage and information retrieval. The process node is a general process node that is not either a storage or QA. It can be representing any process that is applied to a given information product during its life cycle. Typically, there are a lot of process nodes in an IPMAP and they do change the contents or formats of the information product. The consume node is the final stop of the information product. There could be multiple consume nodes as the information product has several information customers. An IPMAP is composed of mixtures of the five nodes, with arrows in between them indicating the directions of the information flow. The information or data flowing between nodes is marked with data identification number.
24
2.3 Experimental Method Two-Phase Approach An overlapping and simultaneous two phase research effort is applied. In other words, this approach is drilling two wells at the same time. This thesis is to look into two different data quality experiments using IPMAP. Experiment 1 The first case is to apply IPMAP to the reservoir pressure data. More specifically, the IPMAP is applied to the three different known management systems of collecting pressure data as indicated in the reservoir pressure problem section. This thesis is to suggest a new method to examine the data quality, in which is new in the data quality and IPMAP research field. This approach is to highlight the cross-system and organizational boundary on the IPMAPs drawn. The data quality questions, which are derived from data quality literatures, are applied at these cross-system and organizational boundaries. This approach is applied to a detailed physical level to monitor and trace the data flow. This new approach contains 4 distinct steps:
1. Trace the data flow and draw the IPMAP
2. Highlight the cross-system and cross-organizational boundaries
3. Select data quality analytical questions based on data quality literature review
4. Apply the analytical questions at each boundaries and document the results
The purpose of the IPMAP approach is to identify data quality improvement opportunities. This new approach is applied to 3 cases:
Case A: No formal system
Case B: Partially systematized using standardized RIS management system
Case C: Full cycle system using autonomous WPS management system
Step 1: Trace the data flow and draw the IPMAP Draw the IPMAPs from the origin of the information product to the consumer of the information product. Step 2: Highlight the cross-system and cross-organizational boundaries One of the key advantages of this IPMAP method is to isolate the system and organizational boundaries. A cross-system boundary is a situation where the data flows through from one system to another within the same company context. A cross-organizational boundary is a situation where the data flows through from one company
25
to another company context. As data makes its cross-system or cross-organizational boundary flow, it may experience different data quality expectations and treatment. As a result, data loss or quality damage may occur. On the IPMAPs, cross-system and cross-organizational boundaries will be highlighted. The next step is to re-visit and summarize the data cross-system and organizational boundary flow by the three IPMAPs. With all the cross-system and cross-boundary scenarios listed out, the next step is to apply the data quality analytical questions to each one of the scenarios and document the findings. These data quality questions are selected based on the data quality literature review. Step 3: Select data quality analytical questions based on data quality literature review The top 7 most cited data quality dimensions are accuracy, reliability, timeliness, relevance, completeness, currency and consistency. Based on these top 7 dimensions, 6 data quality analytical questions are derived. Systematic questions to examine data quality as information product flow across system and organizational boundaries:
Could data source provide multiple outputs for a single data request? (Consistency,
Accuracy)
Is there time expiration to the data? (Timeliness)
If the data is updated on the origin organization, is the data acquiring organization
notified of the data updates? (Currency)
Can the data acquiring organization modify the data on its behalf? (Flexibility, Accuracy)
Has any quality check performed once the data is migrated to a new organization?
(Accuracy, Reliability)
Step 4: Apply the analytical questions at each boundaries and document the results The findings of the analysis result will be documented and data quality improvement opportunities will be recommended. The next set of the analysis investigates the quality of the three different pressure survey management systems at the system level. The questions to be considered for each of the management systems:
Is there a standardized process for issuing pressure survey?
Is there a standardized process for designing pressure survey?
Is there a standardized process for storing the pressure survey?
Is there a standardized step to validate the reservoir datum?
26
The findings of the analysis result will be documented and data quality improvement opportunities will be recommended. Experiment 2 The second case is to apply IPMAP to reservoir simulation and forecasting. IPMAP is applied to a high level or architecture level of reservoir simulation and forecasting. The IPMAP then attempts to drill into further details of data flow. This experiment will also look into the use of process flow, in addition to the IPMAP approach, to search for data quality improvement opportunities. This new approach contains 6 distinct steps:
1. Trace the data flow and draw the IPMAP at high level
2. Highlight the cross-system and cross-organizational boundaries
a. If boundaries cannot be identified, apply the process flow diagram
b. Drill into more detailed level of process flow diagram
3. Select data quality analytical questions based on data quality literature review
4. Apply the analytical questions at each boundaries and document the results
Step 1: Trace the data flow and draw the IPMAP Draw the IPMAPs from the origin of the information product to the consumer of the information product at the high level. Step 2: Highlight the cross-system and cross-organizational boundaries
a. If boundaries cannot be identified, apply the process flow diagram
If the cross-system and cross-organizational boundaries cannot be identified at the architectural level, this approach will shift direction to apply process flow diagram. As the data quality literature suggests, a process flow diagram can be beneficial to the data quality study.
b. Drill into more detailed level of process flow diagram
In order to apply any data quality analytical questions, the nodes must be further drilled into more detail steps. Step 3: Select data quality analytical questions based on data quality literature review I brainstormed several questions based on the data quality dimensions listed in the data quality literature. These questions are organized below:
27
Dimension
Does the plan clearly show how the proposed model will meet the reservoir characterization & simulation objective(s)?
Clarity
Is the reservoir simulation plan consistent with the project objective?
Consistency
Are there sufficient resources allocated to the reservoir simulation project?
Sufficiency
Has the plan capture the impact of uncertainties? Reliability
Have all the project stakeholders been consulted and agreed with the simulation project plan?
Completeness
Is the reservoir simulation plan clearly documented? Clarity
Is the project scoping plan up-to-date? Currency
Can the reservoir simulation objectives be met with the planned grid?
Scope
Do the selected realizations cover the full range of geologic reservoir uncertainty?
Reliability
Has adequate number of geologic realizations being applied in the uncertainty analysis workflow? One model is typically inadequate, three to five are recommended.
Completeness
Has rigorous screening techniques used for selecting geologic realizations?
Accuracy
Has a comprehensive list of reservoir uncertainty parameters and ranges been identified?
Completeness
Has the entire project team agree with the uncertainty parameters and ranges?
Completeness
Does the up-scaled model adequately preserve pertinent geologic and flow characteristics?
Accuracy
Has post scale-up diagnostic tools employed to quantify accuracy of scale-up?
Accuracy
Are the initial reservoir simulation input parameters correct, and is the reservoir simulation model in equilibrium prior to start of production or injection?
Accuracy
Do the wells in the reservoir simulation model deliver correct production rates with specified surface or down hole back pressures?
Accuracy
Do the performance predictions adequately represent the business scenarios under consideration?
Informativeness
Does entire project team agrees with the business cases under evaluation with reservoir simulation model?
Completeness
28
Does the project team clearly understand reasons for performance prediction differences?
Understandability
Has the link between performance predictions and economic model been discussed and developed?
Completeness
Is the project documentation fit-for-purpose? Format
Table 3: Simulation Analytical Questions
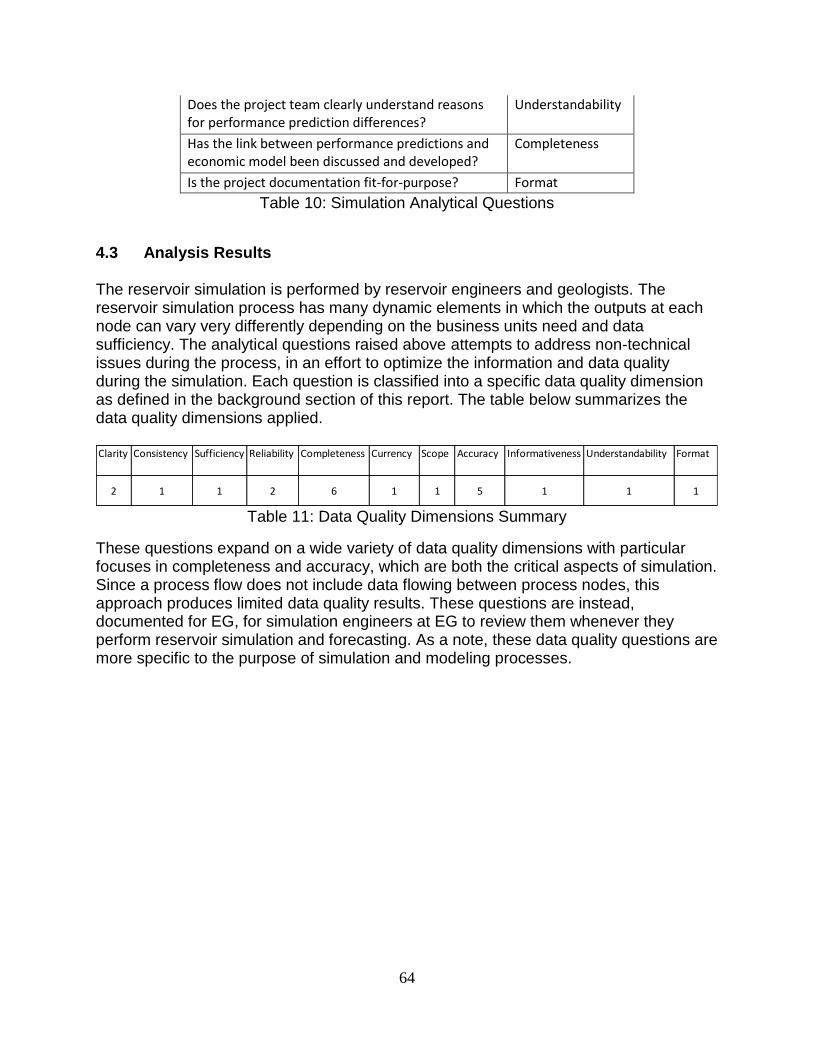
The analytical questions raised above attempts to address non-technical issues during the process, in an effort to optimize the information and data quality during the simulation. Each question is classified into a specific data quality dimension as defined in the background section of this report. The table below summarizes the data quality dimensions applied.
Table 4: Data Quality Dimensions Summary
Step 4: Apply the analytical questions at each boundaries and document the results Similar to Experiment 1, data quality questions will be applied and the findings of the analysis result will be documented and data quality improvement opportunities will be recommended.
As indicated in the introduction, this first experiment drills into the process of collecting pressure data. Oil and gas companies gather pressure data by requesting third party vendors to perform pressure surveys on the production wells. This section is to introduce pressure survey and draw IPMAPs for three management systems of managing pressure survey data in EG. The key research objectives are to trace the data flow of the pressure survey process, highlight the system and organizational boundaries and search for data quality problems.
3.1 Pressure Survey Life Cycle Model (LCM) describes the target architecture of information, in context of the business functions they support, and additionally illustrates the logical systems in which information resides and flows. Figure 9, reference from EG internal document, shows a small section of the Life Cycle Model (LCM), co-produced by EG’s IT team and MIT Information Quality (IQ) project team. LCM maps out the entire process flow for EG’s upstream business at an aggregated level. In order to identify potential information quality problems, this case is drilled into logical level where the actual business processes take place. The focus will be on how to design the pressure survey test and how to collect the pressure survey data, within the business level of reservoir surveillance, analysis and optimization.
Figure 9: LCM of Pressure Survey
30
Before describing how a pressure survey is performed, it is useful to understand the terminologies associated with reservoir pressure. Tubing pressure is measured on the fluid in the tubing, whereas casing pressure is measured on the fluid in the tubing-casing annulus. Bottom Hole Pressure (BHP) is measured at the bottom of the well. The pressure is measured either as flowing, with the well producing, or shut-in or static, after the well has been shut-in and stabilized for a period of time such as 24 hours. The original pressure in a reservoir before any production has occurred is called virgin, initial, or original pressure. During production, reservoir pressure decreases. Reservoir pressure can be measured at any time during production by shut-in BHP in a well. A pressure bomb, an instrument that measures BHP, can be run into the well on a wire line. A common pressure gauge consists of a pressure sensor, recorder, and a clock-driven mechanism for the recorder. The chart records pressure with time as the test is being conducted. Temperature can also be recorded on a similar instrument. As this experiment will explore further into the collection and use of pressure surveys, an example of actual shut-in pressure survey is provided in Figure 10 below:
BOMB TYPE:LMR SERIAL # 9441 CLOCK: NA CALIBRATION DATE:
RESERVOIR DATUM, SS PRESSURE DATE
K.B. ELEVATION ABOVE S.L. + LAST TEST
RESERVOIR DATUM, TVD THIS TEST 09/07/99
K.B. TO TUBING HANGER 46 CHANGE
PERFORATED INTERVAL MD 6310-6320 RATE OF CHANGE PSI/DAY
* LAST MEASURED GRADIENT ** RESERVOIR FLUID GRADIENT
DATUM SUBSEA: FIELD: E.I. 456
SOURCE CODE: STME SAND: LOWER 9900
BHP (TVD) LEASE: OCS-G 4325
BOTTOM HOLE TEMP: 144.0 DEG F WELL #: B-8
SI TEST DURATION: 48 HRS API#:
BOMB ON BOTTOM: 48 HRS CHEV NO:
DATA INTERPRETED BY: joe TEST DATE: 09/07/99
P TVD/ /
DEG F TVDTVD
31
Figure 10: Example of Pressure Survey8
A typical pressure survey contains measured depth (MD), true vertical depth (TVD), temperature, pressure at different depth in a well. Bottom hole Pressure Survey usually measured in pounds per square inch (psi), at the bottom of the hole. A service company typically charges about $300 for a pressure survey conducted on land. Reservoir pressure changes over time. The goal of BHP survey is to update the changing reservoir pressure and accumulate the reservoir pressure data about a specific reservoir, in which can help engineers understand and characterize the reservoir better.
Minerals Management Service (MMS) provides an online query, an index in delimited ASCII format and an Access file to download. The online query select options include Field, Lease, Well, API and Reservoir. A sample output is shown in Figure 11.
Figure 11: BHP Survey Search9
Field is the name of the field in which the well is located. Lease number is the number assigned to a lease by the regulatory agency having jurisdiction over mineral activity in the territory where the lease is located. Well is the name assigned to the completion by the lease operator. API well number is a unique well identification number consisting of (from left to right) a two digit state code (or pseudo for Offshore), a three digit county code (or pseudo for Offshore), a five digit unique well code, and if applicable, a two digit sidetrack code as defined in API Bulletin D12A. The reservoir has two columns. The first one is the name given to an oil or gas reservoir. The second one is the name given to an oil or gas reservoir as applied to the name submitted on the MMS well summary form. 3.2 IPMAP To re-iterate the concepts of IPMAP, an information product is traced from data producer to information consumer, including highlighting the cross-system and organizational boundaries. This section is to apply the IPMAP method to the 3 pressure survey management systems within the EGs firm:
A) No formal system
B) Partially systematized
C) Full cycle system
8 Source: http://petroleumengineeringspreadsheets.com/bhp_reports/file_description_bhp_reports.html. Date
accessed: February 15, 2012 9 Source: http://www.gomr.boemre.gov/homepg/offshore/royalty/bhpproc.html. Date accessed: July 10, 2011
3.2.1 Case A: No formal system In some business units, the number of active producers is limited. There is no business need to pay for centralized database service or to set up a customized database tool. The engineers leverage their wisdom and know-how to execute the process of collecting pressure surveys. This approach is named no formal system as the business process integration and standardization is low. The IPMAP of this case is shown in Figure 12.
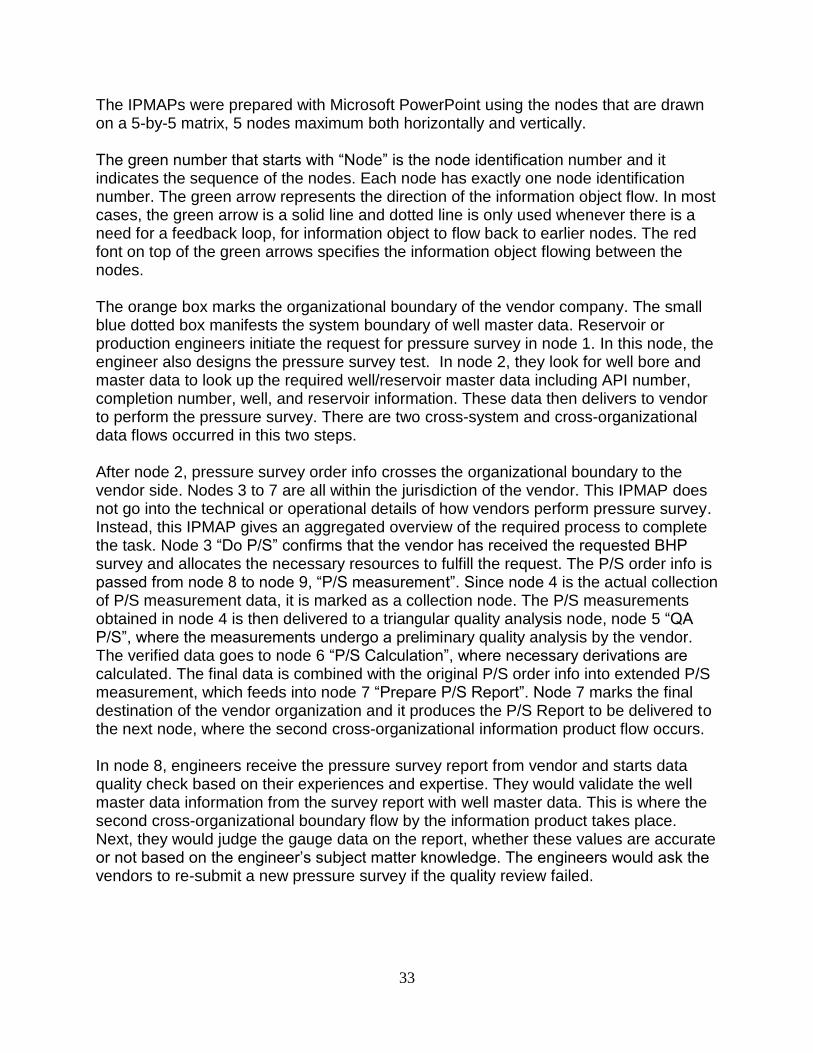
Figure 12: IPMAP on Spreadsheet Process
33
The IPMAPs were prepared with Microsoft PowerPoint using the nodes that are drawn on a 5-by-5 matrix, 5 nodes maximum both horizontally and vertically. The green number that starts with “Node” is the node identification number and it indicates the sequence of the nodes. Each node has exactly one node identification number. The green arrow represents the direction of the information object flow. In most cases, the green arrow is a solid line and dotted line is only used whenever there is a need for a feedback loop, for information object to flow back to earlier nodes. The red font on top of the green arrows specifies the information object flowing between the nodes. The orange box marks the organizational boundary of the vendor company. The small blue dotted box manifests the system boundary of well master data. Reservoir or production engineers initiate the request for pressure survey in node 1. In this node, the engineer also designs the pressure survey test. In node 2, they look for well bore and master data to look up the required well/reservoir master data including API number, completion number, well, and reservoir information. These data then delivers to vendor to perform the pressure survey. There are two cross-system and cross-organizational data flows occurred in this two steps. After node 2, pressure survey order info crosses the organizational boundary to the vendor side. Nodes 3 to 7 are all within the jurisdiction of the vendor. This IPMAP does not go into the technical or operational details of how vendors perform pressure survey. Instead, this IPMAP gives an aggregated overview of the required process to complete the task. Node 3 “Do P/S” confirms that the vendor has received the requested BHP survey and allocates the necessary resources to fulfill the request. The P/S order info is passed from node 8 to node 9, “P/S measurement”. Since node 4 is the actual collection of P/S measurement data, it is marked as a collection node. The P/S measurements obtained in node 4 is then delivered to a triangular quality analysis node, node 5 “QA P/S”, where the measurements undergo a preliminary quality analysis by the vendor. The verified data goes to node 6 “P/S Calculation”, where necessary derivations are calculated. The final data is combined with the original P/S order info into extended P/S measurement, which feeds into node 7 “Prepare P/S Report”. Node 7 marks the final destination of the vendor organization and it produces the P/S Report to be delivered to the next node, where the second cross-organizational information product flow occurs. In node 8, engineers receive the pressure survey report from vendor and starts data quality check based on their experiences and expertise. They would validate the well master data information from the survey report with well master data. This is where the second cross-organizational boundary flow by the information product takes place. Next, they would judge the gauge data on the report, whether these values are accurate or not based on the engineer’s subject matter knowledge. The engineers would ask the vendors to re-submit a new pressure survey if the quality review failed.
34
If the submitted report is a soft copy, engineers would typically store them in their own laptop, as indicated in node 11. Otherwise, a hardcopy report is most likely going to end up on a shelf or stacked in an engineer’s desk as indicated by node 10. 3.2.2 Case B: Partially systematized with Reservoir Information System (RIS)
The Reservoir Information System (RIS) is a relational Oracle database that stores well and pattern data used to manage gas and fluid injection projects. The database was originally developed by EG’s Information Technology Company for an oil field in West Texas. The centralized ITC team charges a fee for business units or any field that leverages RIS. Based on the individual business needs and funding of a business unit, a business unit may decide to use RIS or not. EG’s business units in Alaska and Texas are among the ones who are billed for the RIS technology. To illustrate the benefits of RIS, the business needs of EG’s Texas oil field are explored in further detail below. The Texas oil field has adopted the RIS database in an effort to better manage the asset and utilize it as a best practice. Effective reservoir management is based on using quality data in a timely manner to make better operating decisions. This data would include items such as completion information, perforations, pressures, wellbore mechanicals, etc. Over the past few years, data for the Texas oil field has been stored in a variety of ways, digital spreadsheets and documents, and hardcopies by many people. Data has been lost as people have left the project. Data is stored in formats that are not accessible for more than one application. Implementing RIS allows the Texas oil field to store data in a structured format that will make the data accessible for multiple applications. It enables Texas oil field to achieve the desired financial performance using sound reservoir management practices. To illustrate the operating guidelines of RIS, this IPMAP shown in Figure 13 examines in depth the approach EG’s Alaska oil field took to set up a standard process for pressure survey life cycle management. This case is to apply IPMAP to this standardized method in an attempt to identify data quality improvement opportunities.
35
Figure 13: IPMAP of RIS
The IPMAP of RIS starts with node 1 “P/S Request + Design Test”. This node includes the design of the test by the data owner. Next, the data owner checks for the well/reservoir master data from node 2 “Well Production Log” (WPL) database. Node 2 is the first cross-system boundary flow by a data in this IPMAP. The pressure survey order info is emailed to vendor together with two additional requirements below:
Have vendor include the raw pressure data captured from the gauge with the report
Have vendor include the Data Custodian in emails containing pressure survey data
The raw pressure data is the gauge data collected in a text or XLS file that contains the pressures per depth (as in a gradient) or time (either actual or cumulative time). It is important to capture this data so that it can be integrated with other tools. If the data custodian is included as a copy on the vendor’s email, the data custodian can begin the
36
process of capturing this in the pressure survey database on data owner’s behalf and notify data owner when it is ready for review. After node 2, pressure survey order info crosses the first organizational boundary to the vendor side. Nodes 3 to 7 are all within the jurisdiction of the vendor. This IPMAP does not go into the technical or operational details of how vendors perform pressure survey. Instead, this IPMAP gives an aggregated overview of the required process to complete the task. Node 3 “Do P/S” confirms that the vendor has received the requested BHP survey and allocates the necessary resources to fulfill the request. The P/S order info is passed from node 8 to node 9, “P/S measurement”. Since node 4 is the actual collection of P/S measurement data, it is marked as a collection node. The P/S measurements obtained in node 4 is then delivered to a triangular quality analysis node, node 5 “QA P/S”, where the measurements undergo a preliminary quality analysis by the vendor. The verified data goes to node 6 “P/S Calculation”, where necessary derivations are calculated. The final data is combined with the original P/S order info into extended P/S measurement, which feeds into node 7 “Prepare P/S Report”. Node 7 marks the final destination of the vendor organization and it produces the P/S Report to be delivered to the next node, where the second cross-organizational information product flow occurs. In addition, the vendor sends back the data in any format they like. This process is not standardized. Node 8 “Perform preload quality check” represents that data owner has received pressure survey report from vendor and the report undergoes a preliminary quality analysis. During the review, the data owner is to quality check the following:
Validate the survey is good for analysis Analysis tools are recommended to be used to validate the quality of the survey originally provided by the vendor. If the is answer NO, then immediately set the quality check status to “FAIL” and contact the vendor at this time for a new survey if not already done so. If the answer YES, that the survey is good for analysis. Data owner’s next step is to determine if the pressure survey report is a softcopy or a hardcopy as represented in node 9. If it is a hardcopy, send the documents to the file room to be scanned and associated with a well – follow current Well File management process, as shown in node 10. If the report is in an email, forward the email to the data custodian as described in node 11. After node 11, data owner enters into a new system boundary and logs into the RIS database in node 12. The data owner has to search for duplicates. The system can retrieve surveys that are currently in the system based on the search criteria. Data owner has to ensure that a survey is not already stored in RMIS before adding a new entry. Next, the survey info goes into node 13, where survey types and file location information are required. Some surveys contain both gradient and buildup information. For these cases, select more than one survey type. Survey type helps to define what
37
data fields should be captured. For example, transient surveys require rate history and wellbore surveys require depths. In node 14, data owner has to validate the well/reservoir master data with WPL database. This is the third time data has flowed outside of a system boundary. The RMIS allows user to input the API and completion number to validate as depicted below or to search API if the information is not known.
Figure 14: Enter API Number (Source: from EG internal document)
To search API, data owner has to enter the well name and field name as shown in the diagram below:
Figure 15: Search API (Source: from EG internal document)
API 12 and Completion # are validated against the well master database of WPL. Data owner cannot submit a survey with an invalid API12. Data owner submits pressure survey information in node 15. Once submitted, a confirmation email will be sent to the data custodian and the data owner, informing the data custodian that there is a pressure survey ready for upload. In node 16, data custodian enters the pressure survey report data into RIS, as represented as a storage node in node 17. After the manual data input is completed, data custodian informs the data owner in node 18 to perform post quality check on data in node 19. In node 19, data owner has to first make sure the data on the screen matches the data in the vendor report file. If that is the case, data owner should proceed to perform the following 3 steps of post quality check:
[1] Validate vendor and well information Check that the well information matches that in the survey information and that the vendor information such as company, contact and cost are correct. It is very important that company, contact information and API12 and completion are correctly set as shown in Figure 16 below:
38
Figure 16: Vendor and Well Information Check (Source: from EG internal document)
[2] Validate test information
Data owner should review the test types and select one. If there is only one test type, by default the test conditions section should be open; otherwise, data owner needs to click the survey type link to view the test conditions for each test. In the test conditions, values set as “Not provided” are not in the Vendor Report and values populated match those in the vendor report. A sample of test condition is depicted in Figure 17 below.
Figure 17: Verify Test Conditions (Source: from EG internal document)
[3] Validate the gauge data collected in the test User to click Chart, Table or Excel links to view the gauge data. It is recommend exporting data into an analysis tool to verify that it has been properly loaded. It is also suggested to review the gauge data by viewing the charted data as illustrated in Figure 18 below:
39
Figure 18: Charted Data (Source: from EG internal document)
The final step for data owner is to edit any part of survey that requires changes before setting the quality check to “pass” or “fail”. The Bureau of Ocean Energy Management, Regulation and Enforcement (BOEMRE) requires that an operator conduct a static BHP survey for each new reservoir and annually for any reservoir with three or more producing completions10. BHP surveys are documented on form MMS-140 (Minerals Management Service). One original and one copy are required. For each new reservoir, a static BHP survey is required within 3 months after the date of first continuous production. A BHP survey consists of pressure and gradient information at the middle of the well's perforated interval along with pressure and gradient information obtained at stops coming out of the hole. For each producing reservoir with three or more producing completions, BHP surveys are required on a sufficient number of key wells (i.e., wells located in different structural positions in the reservoir - for example, on the east flank, west flank, and middle of an anticlinal structure) to establish an average reservoir pressure. Node 20 on the IPMAP represents the process of turning RIS BHP data into MMS-140 report. The information product breaks out the system boundary of RMIS here. The MMS-140 report is feed into the final information consumer node 21, which is the regulator of the BOEMRE. 3.2.3 Case C: Full cycle system with Well Pressure System (WPS) The IPMAP in Figure 19 maps out the process of one of EG’s underwater business unit is using to collect pressure surveys.
10
Source: http://www.gomr.boemre.gov/homepg/offshore/royalty/bhpproc.html. Date accessed: July 12, 2011
The IPMAP starts with the first node “P/S Request”. The operator logs into the WPS database whenever a request for a pressure survey is triggered. The next node is “Request new entry in WPS”. The request entry button can be found under the Data menu of the WPS interface. As a result, a blank BHP survey information product is created. The BHP survey flows to the next destination node “Make selection on field, lease, well”. In this node, user selects the intended field, lease and well from a dropdown box and chooses whether this pressure survey is active or static. Node 4, a storage node, to node 3 is the first cross-system boundary flow by data in this IPMAP. Once the desired reservoir, field and well is selected, WBHP, as indicated by yellow dotted box, needs to load the relevant master data from Well Production Log (WPL) database as represented by the blue dotted box, as WPS does not store these values by itself. As indicates in Figure 20, referenced from EG internal document, once the field, lease, well and reservoir are picked, the well API number and Sidetrack digits
41
are loaded automatically from the WPL database together with the information on Kelly Bushing (KB) elevation above sea level, KB to tubing head flange, and perforated interval (MD). Users cannot modify these numbers. These data are all included as “Well/Reservoir Master Data” flowing from node 4 to node 3 on the IPMAP.
Figure 20: Data Loaded Automatically from WPL
Node 5 indicates the additional well bore data that the engineers require. For example, a requirement of the system is the distance from KB elevation to the Well Head. The engineer can ask the IT programmer to load this data in from an excel spreadsheet or can access the existing pressure surveys for a specific well to obtain this data. This node is surrounded by a purple system boundary and is the second time that the information product has performed a cross-system flow. The information product BHP survey is updated with all the values above and makes its trip to the next stop, node 6 “Enter shut-in time, type, completion date, contractor”. The values below can be modified by the users. These values are again all accumulated onto the information product BHP survey.
Figure 21: User-inputted Values (Source: from EG internal document)
The next destination is node 7 “Design PS stops entry”. This is a process that requires domain and expert knowledge of how to design a pressure survey test. As explained in the 3.1 Problem Description section, a pressure bomb is an instrument that measures BHP and can be run into the well on a wireline. This is the stage where the engineer decides at which depth in the well the measurement is required. As shown in the diagram below, various types of entries are required. And again, these values all adds on top of the information product BHP survey.
42
Figure 22: Design Pressure Bomb (Source: from EG internal document)
The BHP survey is now complete and is ready to be sent to the vendor. The WPS allows user to validate the reservoir datum number. The user can check the reservoir datum number from old PHS (Production History System), which is the old database that has reservoir datum data stored at the completion level. User can change the reservoir datum number if it is incorrect. This denotes the third time data has experienced cross-system boundary flow. Note that node 2, 3, 6, 7 and 9 are all process nodes and executed in the WPS database. The WPS allows user to email the designed BHP survey spreadsheet to vendor directly, which is represented as node 9 “Mail the BHP survey to vendor”. After node 9, BHP survey crosses the first organizational boundary from WPS to the vendor side. Nodes 10 to 13 are all within the jurisdiction of the vendor. This IPMAP does not go into the technical or operational details of how vendors perform pressure survey. Instead, this IPMAP gives an aggregated overview of the required process to complete the task. Node 10 “Do P/S” confirms that the vendor has received the requested BHP survey and allocates the necessary resources to fulfill the request. The P/S order info is passed from node 10 to node 11, “P/S measurement”. Since node 11 is the actual collection of P/S measurement data, it is marked as a collection node. The P/S measurements obtained in node 11 is then delivered to a triangular quality analysis node, node 12 “QA P/S”, where the measurements undergo a preliminary quality analysis by the vendor. In this case, the vendor does not compute the necessary reservoir pressure calculations as the designed spreadsheet from the WPS already has the calculations built-in. The final data feeds into node 13 “Prepare P/S Report”. Node 13 marks the final destination of the vendor organization and it produces the P/S Report to be delivered to the next node, where the second cross-organizational information product flow occurs. The P/S report is transferred to node 14, “Upload vendor spreadsheet in WPS” and back to the domain of WPS. In node 14, the user saves the email document received
43
from vendor into a specific folder and locates the folder after logging into the WPS database. The vendor spreadsheet then feeds into a quality analysis node, node 15 “QA P/S”, where the second quality analysis occurs at EG’s side. Node 15 also has a feedback loop that connects back to node 10, which is the start node of the Vendor pressure survey process. This highlights the fact that if the quality analysis failed at node 15, a re-submission of the pressure survey is required by the vendor. The vendor is therefore, has to produce a BHP survey again by following the nodes 10 to 13. The vendor spreadsheet after QA is now ready to be uploaded into WPS and this process is represented in node 16 “Load vendor spreadsheet”. The pressure survey loaded can be transformed into reports. The WPS management system has a function to automatically generate reports, as described in node 17 “Generate reports”. The reports can be exported into excel as spreadsheet files. The two report options available include:
The CC-111 Form shows a single pressure survey. Multiple surveys can be viewed with forward and backward keys.
The Pressure Summary Report is a list of all surveys based on the query criteria. It is generated to the screen as a list.
The final information consumer is node 18 “Management team”. Either CC-111 form or pressure summary report is delivered from node 17 to node 18. This is the sixth time that information product has flow out of its domain boundary, from WPS to the decision makers. Node 18 is characterized as a consumer node on the IPMAP, filled with green paintings.
3.3 Analysis Results The purpose of the IPMAP approach is to identify data quality improvement opportunities. In the previous sections, the IPMAP is applied to 3 cases: the simplified spreadsheet storage, standardized RIS management system and autonomous WPS management system. One of the key advantages of this IPMAP method is to isolate the system and organizational boundaries. A cross-system boundary is a situation where the data flows through from one system to another within the same company context. A cross-organizational boundary is a situation where the data flows through from one company to another company context. As data makes its cross-organizational boundary flow, it may experience different data quality expectations and treatment. As a result, data loss or quality damage may occur. Let’s re-visit and summarize the data cross-system and organizational boundary flow by the three IPMAPs:
Case A:
From node 2 to node 1, where the data in well master data source goes out to
the engineer’s survey request to be sent to vendor (cross-system)
44
From node 1 to node 3, where the pressure survey order information enters
vendor organization (cross-organizational)
From node 7 to node 8, where the prepared pressure survey report is delivered
to EG’s engineer for quality analysis (cross-organizational)
Case B:
From node 2 to node 1, where the data in WPL goes out to the engineer’s survey
request to be sent to vendor (cross-system)
From node 1 to node 3, where the pressure survey order information enters
vendor organization (cross-organizational)
From node 7 to node 8, where the prepared pressure survey report is delivered
to EG’s data owner for preload quality check (cross-organizational)
From node 11 to node 12, where the data owner enters the RIS database to add
a new pressure survey (cross-system)
From node 2 to node 14, where the data owner validate the well/reservoir master
data of the vendor report with WPL database (cross-system)
From node 17 to node 20, where the verified BHP table exits the RIS boundary
and is organized into a government regulatory report, MMS-140 (cross-system)
Case C:
From node 4 to node 3, where WPS attempts to obtain well/reservoir master data
from WPL database (cross-system)
From node 5 to node 3, well bore data is loaded into WPS from a spreadsheet or
existing pressure surveys in WPS (cross-system)
From node 8 to 7, where reservoir datum is delivered to WPS from the old PHS
database (cross-system)
From node 9 to node 10, where the designed BHP survey is sent to the vendor
for actual pressure survey work (cross-organizational)
From node 13 to node 14, where the finished survey from vendor is delivered to
EG in the WPS domain (cross-organizational)
From node 17 to node 18, where the final product, pressure summary report
leaves the WPS boundary and feeds into the decision makers (cross-system)
With all the cross-system and cross-boundary scenarios listed out, the next step is to apply the data quality analytical questions to each one of the scenarios and document the findings. These data quality questions are selected based on the data quality literature review, as summarized by Wand and Wang (1996) in the table shown below:
45
Table 5: Data Quality Dimensions
The top 7 most cited data quality dimensions are accuracy, reliability, timeliness, relevance, completeness, currency and consistency. Based on these top 7 dimensions, 6 data quality analytical questions are derived. Systematic questions to examine data quality as information product flow across system and organizational boundaries:
Could data source provide multiple outputs for a single data request? (Consistency,
Accuracy)
Is there time expiration to the data? (Timeliness)
If the data is updated on the origin organization, is the data acquiring organization
notified of the data updates? (Currency)
Can the data acquiring organization modify the data on its behalf? (Flexibility, Accuracy)
Has any quality check performed once the data is migrated to a new organization?
(Accuracy, Reliability)
3.3.1 Case A Analysis Results These questions are applied and validated toward each of the cross-system and cross-organizational boundary scenario in each of the three cases. The table below is the analysis result of the spreadsheet IPMAP:
Questions\scenarios Node 2 to 1 Node 1 to 3 Node 7 to 8
[1] Could data source provide multiple outputs for a single data request?
Only one value for each of the masters and well data
Only one pressure survey spreadsheet for a well at a time
Only one pressure survey spreadsheet for a well at a time
[2] Data time expiration None None None
46
[3] Notification of cross-boundary data updates
No; Well master data does not inform requester of data updates
Yes; EG can notify vendor if any pressure survey format update
Yes; Vendor can notify EG if any pressure survey update
[4] Ability to modify the data of the acquiring organization
Yes; Survey requester can modify the data acquired from WPL
Yes; Vendor can input the data but cannot modify data format
Yes; EG can modify the report
[5] Data quality check at acquiring organization
Yes; survey requester performs the check
Yes; Vendor performs quality check
Yes; survey requester performs quality check
Table 6: Spreadsheet Analysis
The first question is to examine the accuracy and consistency of the system. At the first of the 3 cross-system and cross-organizational boundaries, this question is to make sure the well reservoir master data is only sourced from single location. The documents reviewed suggested that there is only one source for well master data and the database can only return one value for each information asked. This is also true for the 2nd and 3rd cross-system and organizational boundaries. The vendor can only get the information from one source within the company under study and the vendor can only return the measured pressure survey report to the same company. The 2nd analytical question is to address whether if there is any time limit or expiration to the data flow at each of the boundaries. The documents reviewed suggested that there is not a time limit specified for each of the three boundaries. The 3rd analytical question is to figure out if the data source notifies the data acquirer about any update to the existing data. From the reports studied, it is acknowledged that vendor and the company can easily notify each other about the data or information updates. However, for the master data, it may not be the same case. As shown in the table above, the questions intend to assess the data qualities at the different phases of cross-system and cross-organizational flow by data. The box that is highlighted in yellow indicates the potential area where data quality enhancement may apply:
From node 2 to node 1, where the data in well master data goes out to the engineer’s
survey request to be sent to vendor
The engineers do not get a notification on the update of API number and sidetrack digits whenever there is such an update in the well master data source. As a result, the spreadsheets that engineers store in their computer or in the drawers does not reflect
47
the correct well or reservoir. Engineers would need to set up a separate systematic method to validate the API number and sidetrack digits. The 4th question checks the flexibility and the accuracy of the data. Throughout the pressure survey collection process, the engineers may do a quality review on the data. This question is to verify the flexibility of the data if an error is found on the data. The engineer or other key stakeholders needs to be able to modify the data if it is incorrect. At the first boundary, the survey requester can modify the well master data from received from the database. At the second boundary, vendor can modify the data but has to leave the format constant. At the third boundary, engineers can modify the pressure survey report received from vendor. The last analytical question is to verify if there are data quality checks at each boundary. From the documents studied, it is believed that the survey requester, vendor, engineers would do quality checks. But these documents do not indicated information about the methodologies of these quality checks and the depth and coverage of these checks. 3.3.2 Case B Analysis Results The next case analysis result is the RIS IPMAP. This analysis is applied to the 6 cross-system and cross-organizational boundary scenarios and is depicted below:
Questions\scenarios Node 2 to 1 Node 1 to 3 Node 7 to 8 Node 11 to 12 Node 2 to 14 Node 17 to 20
[1] Could data source provide multiple outputs for a single data request?
Only one value for each of the masters and well data
Only one pressure survey spreadsheet for a well at a time
Only one pressure survey spreadsheet for a well at a time
Only one email from data custodian
Only one value for each of the masters and well data
Only one pressure survey spreadsheet for a well at a time
[2] Data time expiration None None None None None None
[3] Notification of cross-boundary data updates
No; WPL does not inform requester of data updates
Yes; the company under study can notify vendor if any pressure survey format update
Yes; Vendor can notify the company under study if any pressure survey update
Not Applicable
No; WPL does not inform requester of data updates
Yes; Regulators get updated reports, if any
[4] Ability to modify the data of the acquiring organization
Yes; Survey requester can modify the data acquired from WPL
Yes; Vendor can input the data but cannot modify data format
Yes; the company under study can modify the report
Not Applicable
Not Applicable
Yes; Regulators can modify the data
48
[5] Data quality check at acquiring organization
Yes; survey requester performs the check
Yes; Vendor performs quality check
Yes; data owner performs preload quality check
Yes; data owner performs post quality check in RIS
Yes; data owner performs post quality check in RIS
Yes; Regulators performs data quality check
Table 7: RIS Analysis
The first question is to examine the accuracy and consistency of the system. At the first of the 6 cross-system and organizational boundaries, this question is to make sure the well reservoir master data is only sourced from single location. The documents reviewed suggested that there is only one source for well master data and the database can only return one value for each information asked. This is also true for the 2nd and 3rd cross-system and organizational boundaries. The vendor can only get the information from one source within the company under study and the vendor can only return the measured pressure survey report to the same company. The 4th boundary and the 6th boundary is also the same case as there is only one pressure survey flowing in and out RIS at a time. The 5th boundary is similar to the first boundary where there is only once source for well master data and database can only return one value. The 2nd analytical question is to address whether if there is any time limit or expiration to the data flow at each of the boundaries. The documents reviewed suggested that there is not a time limit specified for each of the six boundaries. The 3rd analytical question is to figure out if the data source notifies the data acquirer about any update to the existing data. From the reports studied, it is acknowledged that vendor and the company can easily notify each other about the data or information updates. However, for the master data, it may not be the same case. These questions intend to assess the data qualities at the different phases of cross-system and cross-organizational flow by data. The boxes that are highlighted in yellow indicate the potential area where data quality enhancement may apply. These are:
From node 2 to node 1, where the data in WPL goes out to the engineer’s survey
request to be sent to vendor
From node 2 to node 14, where the data owner validate the well/reservoir master data of
the vendor report with WPL database
The above-mentioned two scenarios have the same problem. Anytime there is a correction to the API number and sidetrack digits of a well bore in the WPL, the updated data does not reflect in the RIS automatically nor does this process notifies the RIS coordinator. The IT person assigned to the RIS Database needs to be notified in order to assign the pressure data to the correct well identity data (Field, Lease, and Reservoir). The WPL coordinator is the key contact who maintains the API number and sidetrack digits.
49
For the 6th boundary, the regulators do get the updated report, if any. The 4th question checks the flexibility and the accuracy of the data. Throughout the pressure survey collection process, the engineers may do a quality review on the data. This question is to verify the flexibility of the data if an error is found on the data. The engineer or other key stakeholders needs to be able to modify the data if it is incorrect. At the first boundary, the survey requester can modify the well master data from received from the database. At the second boundary, vendor can modify the data but has to leave the format constant. At the third boundary, engineers can modify the pressure survey report received from vendor. This question is not applicable to 4th and 5th boundary. At 6th boundary, the regulators can change the data if necessary. The last analytical question is to verify if there are data quality checks at each boundary. From the documents studied, it is believed that the survey requester, vendor, engineers, data owners would do quality checks. 3.3.3 Case C Analysis Results The third analysis finding is for the automation case by the WPS system and is depicted in the table below. This table includes the 6 cross system and cross-organizational flow by the information product.
Questions\scenarios Node 4 to 3 Node 5 to 3 Node 8 to 7 Node 9 to 10 Node 13 to 14 Node 17 to 18
[1] Could data source provide multiple outputs for a single data request?
Only one value for each of the masters and well data
Only one value for each of the well bore data
PHS may return multiple results with different values
Only one pressure survey spreadsheet for a well at a time
Only one pressure survey spreadsheet for a well at a time
Not Applicable
[2] Data time expiration None None None None None None
[3] Notification of cross-boundary data updates
No; WPL does not inform WPS of data updates
No changes to the existing spreadsheets
PHS is an old database; no updates
Yes; the company under study can notify vendor if any pressure survey format update
Yes; Vendor can notify the company under study if any pressure survey update
Yes; Managers get updated reports, if any
[4] Ability to modify the data of the acquiring organization
No; WPS cannot modify the data acquired from WPL
Yes; users can modify the well bore data acquired
Yes; WPS allows user to modify the incorrect datum value
Yes; Vendor can input the data but cannot modify data format
Yes; the company under study can modify the report
Yes; Managers can modify the report
50
[5] Data quality check at acquiring organization
Yes; WPS has data quality check
Yes; Yes; users need to validate datum value
Yes; Vendor performs quality check
Yes; WPS has data quality check
Not Applicable
Table 8: WPS Analysis
The first question is to examine the accuracy and consistency of the system. At the first of the 6 cross-system and organizational boundaries, this question is to make sure the well reservoir master data is only sourced from single location. The documents reviewed suggested that there is only one source for well master data and the database can only return one value for each information asked. This is also true for the 2nd cross-system and organizational boundary, where the well bore data is extracted. At the 3rd boundary, the box is highlighted in yellow to indicate the potential area where data quality enhancement may apply.
From node 8 to 7, where reservoir datum number is delivered to WPS from the old PHS
database
The first scenario of data quality problem is from node 8 to 7. This is where the user reviews the reservoir datum number that acquired from the old PHS database. Ideally each reservoir should have only one pressure datum. The pressure datum is a Sub-Sea (SS) True Vertical Depth (TVD) measurement. This is a TVD depth from the water level or ground level. For wells over water it is the TVD measurement less the KB-mean water level distance. A common error is to put the TVD measure instead of the SS. Because the old PHS data had multiple datum for a single reservoir, the new WPS Database could not establish a data integrity method based on Reservoir. The system maintains the Datum at the completion level. It allows you to have a different datum for the same reservoir. Users have to validate the reservoir datum and assign the correct value to it, if necessary. The vendor can only get the information from one source within the company under study and the vendor can only return the measured pressure survey report to the same company. Therefore, there is no data quality issues identified at the 4th and the 5th boundaries. The 6th boundary is also the same case as there is only one pressure survey flowing in and out WPS at a time. The 2nd analytical question is to address whether if there is any time limit or expiration to the data flow at each of the boundaries. The documents reviewed suggested that there is not a time limit specified for each of the six boundaries. The 3rd analytical question is to figure out if the data source notifies the data acquirer about any update to the existing data. At the first boundary, the box is highlighted in yellow to indicate the potential area where data quality enhancement may apply.
51
From node 4 to node 3, where WPS attempts to obtain well/reservoir master data from
WPL database
To discover into further details of what is going on from node 4 to node 3, the data travel for this segment must be identified. There are two types of data flow through this path:
Well Master Data: API number and Sidetrack digits of a well
Well Bore Data: Kelly Bushing (KB) Elevation
Anytime there is a correction to the API number and sidetrack digits of a well bore in the WPL, it affects the sidetrack digits which are the key elements of the Well Bottom Hole Pressure Database. The IT person assigned to the WPS Database needs to be notified in order to assign the pressure data to the correct well identity data (Field, Lease, and Reservoir). The WPL coordinator is the key stakeholder who maintains the API number and sidetrack digits. Currently, there are pressure data assigned to incorrect sidetrack digits in the WPS database. At the 2nd boundary of the 3rd analytical question, there are no changes to the existing spreadsheets. At the 3rd boundary, the PHS is an old database and therefore there will not be any update associated with this. At 4th and 5th boundary, both the company under study and the vendor will notify each other if there is any update. At the last boundary, managers will get notified if any update. The 4th analytical question checks the flexibility and the accuracy of the data. Throughout the pressure survey collection process, the engineers may do a quality review on the data. This question is to verify the flexibility of the data if an error is found on the data. The engineer or other key stakeholders needs to be able to modify the data if it is incorrect. At the first boundary, the box is highlighted in yellow to indicate the potential area where data quality enhancement may apply.
From node 4 to node 3, where WPS attempts to obtain well/reservoir master data from
WPL database
At the first boundary, the survey requester cannot modify the well master data received from the database. The KB elevation is also automatically loaded from WPL. The downside is that the WPS user cannot modify this data directly. It has to be corrected through the IT Well Data group. At the second boundary, the data requester can modify the well bore data extracted. At the 3rd boundary, engineers can modify the reservoir datum obtained from the database. At the 4th boundary, the vendor is allowed to modify the data but has to keep the format as it is. The engineers at the company under study can modify the report after receiving from the vendor side at the 5th boundary. At 6th boundary, the managers can change the data if necessary.
52
The last analytical question is to verify if there are data quality checks at each boundary. From the documents studied, it is believed that the survey requester, vendor, engineers, data owners would do quality checks. The methodology applied at this analysis section is original in the field of data quality and IPMAP research. This is a new proposed systematic approach to examine data quality at cross-system and organizational boundaries. The analytical questions are derived from data quality literatures, with focus on the most cited data quality dimensions. The results of this approach, as summarized in this section, are convincing and illustrative as data quality issues are identified. 3.3.4 System Analysis Results The next set of the analysis investigates the quality of the three different pressure survey management systems at the system level. The questions to be considered for each of the management systems:
Is there a standardized process for issuing pressure survey?
Is there a standardized process for designing pressure survey?
Is there a standardized process for storing the pressure survey?
Is there a standardized step to validate the reservoir datum?
The result of the system level analysis is shown in the table below:
Case A Case B Case C
Is there a standardized process for issuing pressure survey?
No No Yes
Is there a standardized process for designing pressure survey?
No No Yes
Is there a standardized process for storing the pressure survey?
No Yes Yes
Is there a standardized step to validate the reservoir datum?
No No Yes
Table 9: System Level Analysis
The first case’s approach also does not have a standardize process in checking the reservoir datum, issuing, designing and storing pressure surveys. Over the years, reservoir data has been stored in a variety of ways, digital spreadsheets and documents, and hardcopies by many people. Data could have been lost as people have left the
53
project. Data is stored in formats that are not accessible for more than one application. Therefore, a standardized process like WPS is highly recommended. The RIS approach does not have a standardized approach to verify the reservoir datum number and issuing and designing pressure survey. Validation of reservoir datum needs to be complimented into the post quality analysis by data owner. In addition, since there is no standardized method to design the pressure survey, the vendor would return the pressure survey in any format they like. At the systems level, WPS is the preferred pressure survey management system as it is most standardized and automated tool. In the WPS management system, the data returned by the vendor is the same format requested by EG, lowering the chances for data quality errors. However, it is interesting to point out that WPS is implemented in EG’s underwater business unit. This asset cannot afford pressure data quality issues as it is very expensive to perform an underwater pressure survey. The pressure surveys on land, however, are typically more economical to execute.
As indicated in the introduction, this second experiment is based on a top-down approach and is drilled into the process of reservoir simulation and forecasting. Oil and gas companies perform reservoir simulation and forecasting, based on the pressure data collected, to evaluate the well production optimization and well construction planning. This section is to introduce EG’s Fit-For-Purpose (FFP) approach on reservoir simulation and forecasting and attempt to draw IPMAP on an architectural level. The correlation of process flow chart to IPMAP is investigated and documented. The key research objectives are to trace the data flow of the reservoir simulation and forecasting process, highlight the system and organizational boundaries and search for data quality problems.
4.1 Fit-For-Purpose
Given the large quantity of data involved and the complicated methods for reservoir modeling and forecasting, data can easily experience poor quality during the process. Fit-For-Purpose (FFP) reservoir modeling and forecasting is a structured approach initiated by EG to determine the best modeling and forecasting solutions for an asset and is designed to be decision driven. The FFP reservoir modeling and forecasting structured thought process supports two elements of the reservoir management framework: characterize asset base and forecast.
The purpose of reservoir characterization is to make sure fields have up-to-date reservoir descriptions that meet the need for identifying and maturing opportunities, developing reliable forecasts and accurately estimating reserves. FFP is designed to be scalable for use on a wide range of asset types including: key and non-key fields, major capital projects, producing asset optimization and harvest, business development and exploration. The goal of the FFP model is to answer the question, “what is the best modeling method for the situation?” The answers could depend on:
The specific modeling purposes for your specific project and situation
What decisions the model is meant to support
The reservoir and recovery characteristics such as fluid types and complexity
The constraints of the project including time and budget limitations
FFP modeling is expected to involve the use of complementary methods phased to provide consistent results in the appropriate time frame. A three step workflow as shown in Figure 23 referenced from EG internal document has been designed to implement FFP by a consistent approach to thinking through the issues that influence the selection of an appropriate modeling/forecasting strategy and plan.
55
Figure 23: FFP Three Step Workflow
The first step is framing. It has three stages:
Stage 1: Consider the business purpose
Stage 2: Consider reservoir and recovery characteristics
Stage 3: Consider the restraints that will limit modeling approaches
The first stage in the process is to consider the business purpose and the specific decisions that will be supported by the model. This stage is critical, and it is the stage most often overlooked. It is vital that clarifying conversations are held to enable fully understanding of the needs of the business decision-makers. The second stage is to answer the questions for reservoir and recovery characteristics. Projects using straightforward recovery mechanisms will require a different modeling approach than projects employing more complex methods such as waterflooding or gas injection. The third stage is to consider all of the constraints that will limit the modeling approaches that are appropriate for the project. Different projects have different data accessible to them, so care must be taken to use approaches that do not presume the availability or gathering of data beyond what can be provided. Additionally, the resource and timeframe constraints must be considered. The second step is discussion. Once the team completes framing and has a shared understanding of how the models will be used by the business, the team will begin to identify and discuss the pros and cons of the various modeling and forecasting options. There are two tools available to identify these options: the Level 1 and 2 Selector tools. The Level 1 Selector is a high-level tool that offers advice as to the appropriate modeling/forecasting approach. It is an excel macro that uses a series of questions to conduct an analysis. The Level 2 Selector is a web-based tool which provides a more comprehensive range of dynamic and static modeling FFP solutions. It contains a library of case histories and provides much more detail to recommended modeling/forecasting approaches. Common dynamic and static modeling methods are listed below, with decrease in complexity from top to bottom: Dynamics Modeling Methods:
Reservoir Simulation
Streamline Simulation
Integrated Production Modeling and Nodal Analysis
Analytical models
Production type-curves/advanced decline curves/transient rate analysis
56
Predictive methods: material balance, Buckley Leverett
Trend analysis: Decline curves: exponential, hyperbolic and harmonic
Recovery Factor Analogy
Static Modeling Methods: 3D geocellular models
Probabilistic
Crystal Ball
Map Based Models
Analogy
The third step is the selection. During the this step, the team will select the FFP modeling method, combination of methods, and document the resulting FFP modeling and forecasting plans to submit for review. Reservoir modeling and forecasting are critical path activities that can support an extensive array of business decisions. EG invests over $20 million per year on reservoir modeling and forecasting technologies and services. The primary reason for this investment is to support business-critical decisions. Using the FFP modeling and forecasting methods has many benefits that add value. From an operations perspective, the FFP approach ensures that only models that support business decisions are generated. This improves the value and the efficiency of the modeling work by reducing both model complexity and cycle time wherever appropriate. The FFP approach also encourages an open discussion about the value and tradeoffs from various modeling techniques, which will also lead to greater understanding of the best applications of the different modeling techniques. Since reservoir modeling and forecasting workflows are directly linked to the project decision frame and schedule, using the FFP approach also has the potential to create significant financial value to the business. FFP can result in a reduction in appraisal and development cost and reduce the time required to make a Final Investment Decision (FID). FFP can generate efficiencies in the work processes and add value to the business. 4.2 IPMAP
A high-level IPMAP is shown in Figure 24 to illustrate the high-level data types that are required to flow across different steps for a simulation task. The IPMAP inherits the same visualization methods as the IPMAP in the previous section. Each node is a process step with sequence number clearly listed. The data flowing between the nodes is represented by the red font. The information consumer is the last node filled with green color.
57
Figure 24: High Level IPMAP for Simulation
The IPMAP clearly indicates that the 3 major steps of material balance analysis11, build geocellular model12 and reservoir simulation all require current data, existing data and analysis, models and simulation. However, the fact that this IPMAP is a generalization at the high-level limits the ability to yield data quality enhancement opportunities because an architectural level IPMAP does not map out the detail data flow at the physical level. It is not clear which database do the existing data and new data come from or flow to. In addition, this high level IPMAP cannot differentiate and visualize system and organizational boundaries. The sections in the following discuss the further approaches adapted to tackle the problem at different perspectives.
Simulation Process Flow
The key research question of this thesis is: within the scope of reservoir data in upstream oil and gas, what are the cross-system and organizational flows by data that can be further investigated to identify data quality enhancement opportunities? Given 11
The materials balance method for an oil field uses an equation that relates the volume of oil, water and gas that
has been produced from a reservoir and the change in reservoir pressure to calculate the remaining oil. It assumes
that, as fluids from the reservoir are produced, there will be a change in the reservoir pressure that depends on the
remaining volume of oil and gas. The method requires extensive pressure-volume-temperature analysis and an
accurate pressure history of the field. It requires some production to occur (typically 5% to 10% of ultimate
recovery), unless reliable pressure history can be used from a field with similar rock and fluid characteristics.
(Source: Wikipedia) 12
A geocellular model is a 3D earth model.
58
the limited applicability of IPMAP at a higher level, this section attempts to map out the process of reservoir simulation and forecasting by process flow chart. As documented in Chapter 2.2 section of this report, a process flow chart can complement the IPMAP to allow the decision makers to gain a better understanding of a process. This section summarizes two process flows to perform reservoir simulation. Analytical questions, classified according to the data quality dimensions explained in the background section, are applied to each step to identify the data quality enhancement opportunities.
The FFP reservoir modeling and simulations covers a variety of processes to characterize an asset base and forecast. The process flow in this section is drawn for the workflow of “design a new subsurface development”. This process flow is for new field developments and new reservoir developments in producing fields. However, it is different from “optimize a producing asset” in that it does not include history matching of historical data. This process incorporates much more uncertainty in original hydrocarbons in place and well performance because of the lack of historical performance. This process flow represents a very high level process summary and the primary actor is reservoir engineer. There are two possible outputs of this process (Source: from EG internal documents):
Minimum guarantees: Existing data gathered and assessed. An initial estimate of in place volumes, ultimate recovery potential is made. New development project economic performance has been estimated forming the basis for the decision to not pursue the development or postpone the evaluation and collect additional data.
Success guarantees: Number, type and drilling schedule for producers and injectors, optimized for business metrics. P10, P50, and P90 production and injection rate predictions. P10, P50 and P90 estimates of hydrocarbons in place and ultimate recoverable.
The exploration and appraisal process and definitions of P10, P50 and P90 are explained further below, as derived from EG’s internal documents.
Resources are hydrocarbons which may or may not be produced in the future. A resource number may be assigned to an undrilled prospect or an unappraised discovery. Appraisal by drilling additional delineation wells or acquiring extra seismic data will confirm the size of the field and lead to project sanction. At this point the relevant government body gives the oil company a production license which enables the field to be developed. This is also the point at which oil reserves can be formally booked.
Oil reserves are primarily a measure of geological risk of the probability of oil existing and being producible under current economic conditions using current technology. The three categories of reserves generally used are proven, probable, and possible reserves (Source: Wikipedia):
Proven reserves - defined as oil and gas "Reasonably Certain" to be producible
using current technology at current prices, with current commercial terms and
government consent- also known in the industry as 1P. Some Industry specialists
refer to this as P90 - i.e. having a 90% certainty of being produced.
Probable reserves - defined as oil and gas "Reasonably Probable" of being
produced using current or likely technology at current prices, with current
commercial terms and government consent - Some Industry specialists refer to
this as P50 - i.e. having a 50% certainty of being produced. - This is also known
in the industry as 2P or Proven plus probable.
Possible reserves - i.e. "having a chance of being developed under favorable
circumstances" - Some industry specialists refer to this as P10 - i.e. having a 10%
certainty of being produced. - This is also known in the industry as 3P or Proven
plus probable plus possible.
The first process flow is provided below. The sequence of the flow is denoted by the green number with an alphabet and four digits to follow it. There are no data flowing between the nodes as this is a process flow chart, not an IPMAP.
Figure 25: Process Flow for Design a New Subsurface Development
60
The first node to the third node follows the same procedure that is described in the FFP section earlier. In this case, the business decision is to whether or not to design a new subsurface development. Once the recommended static and dynamic modeling approaches are set in node three, the process flow goes on to node 4 to gather the required data. Node 5 represents the data sources of all the System of Records (SOR), including the RIS and WPS which has the accumulated bottom hole pressure data explained in Chapter 3. More detailed steps to gather the data:
1. Create database
2. Collect and inventory data
3. Perform basic processing and interpretation
Node 6 is to validate the data which includes following steps:
1. Quality control data
2. Assess uncertainty in basic interpretation
Node 7 is to enhance the data and includes two steps:
1. Supplement data
2. Update project schedule
For node 4, 6 and 7, it is suggested to collect and inventory all available reservoir data and quality control it. Seismic data is processed and interpretation of major horizons and faults completed. Log data is interpreted and reconciled with core data. Special data required for unconventional reservoir simulation should be collected and quality reviewed. The primary actors for these three processes are reservoir engineer and geologists. The process flow chart now goes to node 8 to be interpreted with following steps:
1. Reservoir properties from seismic
2. Generate velocity model
3. Construct geologic framework
4. Create reservoir fluid model
5. Detailed petrophysical interpretation
The integration at node 9 involves the following:
1. Create relative permeability model
2. Dynamic data interpretation and integration
The reconciliation at node 10 takes below steps:
1. Generate volumetrics
2. Assess uncertainty
3. Update project schedule
61
Node 8 to 10 is primarily about how dynamic data is interpreted, integrated and reconciled with the geologic data. Initial estimate of hydrocarbons in place and uncertainty is determined. The primary actors for these three processes are reservoir engineer and geologists. Node 11 is a complicated combined process as listed below:
1. Load and integrate data
2. Conduct static data analysis and spatial modeling
3. Build file scale grid
4. Develop endpoint modeling strategies
5. Build endpoint models and populate with facies and reservoir properties
6. Uncertainty assessment for Hydrocarbon in place (HCIP)13 and connectivity
7. Validate uncertainty ranges for HCIP and connectivity
8. Select base case models
9. Build base case models
10. Update project schedule
The result of this node should create geocellular models representing P10, P50 and P90 HCIP and connectivity. The primary actor for this process is the geologists. These details steps require subject matter expertise and deep reservoir engineering know-how which will not be discussed within the scope of this case. The next node is the simulation process. This is another sophisticated process that requires subject matter expertise. However, this simulation node is worth further detail investigation as it involves copious data transformations and assumptions. This node is zoomed into another process flow, as depicted below, in an attempt to identify potential data quality improvement opportunities.
13
Oil in place or Hydrocarbon in place (HCIP) is the total hydrocarbon content of an oil reservoir and is often
abbreviated STOOIP, which stands for Stock Tank Original Oil In Place, or STOIIP for Stock Tank Oil Initially In
Place, referring to the oil in place before the commencement of production. In this case, stock tank refers to the
storage vessel (often purely notional) containing the oil after production.
The process flow above lays out the procedure to perform a simulation. The process flow map does not allow for the mapping of the cross-system and organizational boundaries, as there is no specific data travel between the nodes. However, it does provide visualizations of the entire process flow. The methodology of the first experiment is to apply data quality analytical questions at the cross-system and organizational boundaries. Since there is no such boundary in the process flow, this experiment is to apply data quality questions at each node, in an attempt to discover data quality issues. At each node, I suggested several questions based on the data quality dimensions listed in the data quality literature. These questions are organized below:
At node 1 Dimension
Does the plan clearly show how the proposed model will meet the reservoir characterization & simulation objective(s)?
Clarity
Is the reservoir simulation plan consistent with the project objective?
Consistency
63
Are there sufficient resources allocated to the reservoir simulation project?
Sufficiency
Has the plan capture the impact of uncertainties? Reliability
Have all the project stakeholders been consulted and agreed with the simulation project plan?
Completeness
Is the reservoir simulation plan clearly documented? Clarity
Is the project scoping plan up-to-date? Currency
At node 2
Can the reservoir simulation objectives be met with the planned grid?
Scope
At node 3
Do the selected realizations cover the full range of geologic reservoir uncertainty?
Reliability
Has adequate number of geologic realizations being applied in the uncertainty analysis workflow? One model is typically inadequate, three to five are recommended.
Completeness
Has rigorous screening techniques used for selecting geologic realizations?
Accuracy
At node 4
Has a comprehensive list of reservoir uncertainty parameters and ranges been identified?
Completeness
Has the entire project team agree with the uncertainty parameters and ranges?
Completeness
At node 5
Does the up-scaled model adequately preserve pertinent geologic and flow characteristics?
Accuracy
Has post scale-up diagnostic tools employed to quantify accuracy of scale-up?
Accuracy
At node 6
Are the initial reservoir simulation input parameters correct, and is the reservoir simulation model in equilibrium prior to start of production or injection?
Accuracy
At node 7
Do the wells in the reservoir simulation model deliver correct production rates with specified surface or down hole back pressures?
Accuracy
At node 8
Do the performance predictions adequately represent the business scenarios under consideration?
Informativeness
Does entire project team agrees with the business cases under evaluation with reservoir simulation model?
Completeness
64
Does the project team clearly understand reasons for performance prediction differences?
Understandability
Has the link between performance predictions and economic model been discussed and developed?
Completeness
Is the project documentation fit-for-purpose? Format
Table 10: Simulation Analytical Questions
4.3 Analysis Results The reservoir simulation is performed by reservoir engineers and geologists. The reservoir simulation process has many dynamic elements in which the outputs at each node can vary very differently depending on the business units need and data sufficiency. The analytical questions raised above attempts to address non-technical issues during the process, in an effort to optimize the information and data quality during the simulation. Each question is classified into a specific data quality dimension as defined in the background section of this report. The table below summarizes the data quality dimensions applied.
Table 11: Data Quality Dimensions Summary
These questions expand on a wide variety of data quality dimensions with particular focuses in completeness and accuracy, which are both the critical aspects of simulation. Since a process flow does not include data flowing between process nodes, this approach produces limited data quality results. These questions are instead, documented for EG, for simulation engineers at EG to review them whenever they perform reservoir simulation and forecasting. As a note, these data quality questions are more specific to the purpose of simulation and modeling processes.
This thesis presented a study of data quality enhancement opportunities in upstream oil and gas industry. In particular, a new methodology for examining data quality for reservoir pressure management systems is proposed. This new approach contains 4 distinct steps:
1. Trace the data flow and draw the IPMAP
2. Highlight the cross-system and cross-organizational boundaries
3. Select data quality analytical questions based on data quality literature review
4. Apply the analytical questions at each boundary and document the results
This original methodology is applied to reservoir pressure management systems and the data quality results are documented. The second experiment involves in applying IPMAPs to reservoir simulation and forecasting at an architectural level, in pursuit of identifying data quality strategy for the company under study. In the second experiment, however, limited findings were documented. This thesis starts with introduction on the upstream oil and gas industry, explaining how oil companies explore for oil and how to extract oil. As a rule of thumb, a high-performing oil company is one that puts more oil reserves into the books than the oil it produces annually. In other word, oil companies look to maintain a reserve replacement ratio (RRR) over 100%. To achieve the target, oil companies must manage its massive amount of data in an adequate manner. Literature materials in data quality and IPMAP are then presented. The first experiment of this thesis is to apply the IPMAP to reservoir pressure survey management systems. It is known that the company has at least three systems to manage a pressure survey:
Case A: No formal system
Case B: Partially systematized with RIS
Case C: Full cycle system with WPS
The detailed processes to perform each of the steps above are documented. IPMAP are drawn to clearly identify the cross-system and organizational boundaries for an information product flow. The data quality systematic questions are then applied to each of the boundaries. As a result, three data quality problems are identified:
1. Well Master Data: Well API and Sidetrack digits
To issue a pressure survey, well master data and well bore data are required. Anytime there is a correction to the API number and sidetrack digits of a well bore in the WPL, it affects the sidetrack digits which are the key elements of the WPS Database. The IT person assigned to the WPS Database needs to be notified in order to assign the pressure data to the correct well identity data (Field, Lease, and Reservoir). The WPL
66
coordinator is the key administrator who maintains the API number and sidetrack digits. Currently, there are pressure data assigned to incorrect sidetrack digits in the WPS database.
2. Well Bore Data: Kelly Bushing Elevation
The KB elevation is also automatically loaded from WPL. The downside is that the WPS user cannot modify this data directly. It has to be corrected through the IT Well Data group if any change is needed.
3. Reservoir datum
User reviews the reservoir datum number that acquired from the old PHS database. Ideally each reservoir should have only one pressure datum. The pressure datum is a Sub-Sea (SS) True Vertical Depth (TVD) measurement. This is a TVD depth from the water level or ground level. For wells over water it is the TVD measurement less the KB-mean water level distance. A common error is to put the TVD measure instead of the SS. Because the old PHS data had multiple datum for a single reservoir, the new WPS Database could not establish a data integrity method based on Reservoir. The system maintains the datum at the completion level. It allows you to have a different datum for the same reservoir. Users have to validate the reservoir datum and assign the correct value to it, if necessary. Next, system-level analytical questions are applied to each of the three management systems. The spreadsheet approach does not have a standardize process in checking the reservoir datum, issuing, designing and storing pressure surveys. Over the years, reservoir data has been stored in a variety of ways, digital spreadsheets and documents, and hardcopies by many people. Data could have been lost as people have left the project. Data is stored in formats that are not accessible for more than one application. Therefore, a standardized process like WPS is highly recommended. The RIS approach does not have a standardized approach to verify the reservoir datum number and issuing and designing pressure survey. Validation of reservoir datum needs to be complimented into the post quality analysis by data owner. In addition, since there is no standardized method to design the pressure survey, the vendor would return the pressure survey in any format they like. At the systems level, WPS is the recommended pressure survey management system as it is most standardized and automated tool. In the WPS management system, the data returned by the vendor is the same format requested by EG, lowering the chances for data quality errors. However, it is interesting to point out that WPS is implemented in EG’s underwater asset. This asset cannot afford pressure data quality issues as it is very expensive to perform an underwater pressure survey. The pressure surveys on land, however, are typically much more economical to execute. The next chapter investigates the data quality issues in the scope of reservoir simulation and forecasting. The simulation and forecasting is selected because it leverages the
67
reservoir pressure data accumulated by the pressure survey processes. Simulation and forecasting is the data consumer of reservoir pressure data. The concept of FFP is described. The thesis generates a high-level IPMAP on reservoir simulation and forecasting. In addition, a high level process flow for design a new subsurface development in drawn. The next section further elaborates on the first high level process flow and drills into the process flow for simulation, as this step contains massive amount of data usage. The analytical questions are raised to the second simulation process flow, in an effort to search data quality issues during the simulation. Different from the first experiment, these analytical questions were applied at each node level. This is because of the limitations of the process flow that the cross-system and organizational boundaries cannot be differentiated and highlighted. The questions address non-technical aspect of the process and are documented for the benefit of the company under study. Each question is classified into a specific data quality dimension as defined in the background section of this report. These questions expand on a wide variety of data quality dimensions with particular focuses in completeness and accuracy, which are both the critical aspects of simulation. There were no significant findings of this experiment as the process flow does not contain actual data flow and analytical question results are difficult to track. 5.1 Lessons Learned
Newly proposed data quality analytical methodology produced convincing results
The methodology applied at the first experiment is original in the field of data quality and IPMAP research. This is a new proposed systematic approach to examine data quality at cross-system and organizational boundaries. The analytical questions are derived from data quality literatures, with focus on the most cited data quality dimensions. The results of this approach, as summarized in the earlier sections, are convincing and illustrative as data quality issues are identified. This could be a pragmatic method to improve the data quality at different aspects of operations of different industries.
IPMAP offers a visualization of data flow In this thesis, there are total of four IPMAPs drawn. Each offers a good visualization of data flow from data origin to data consumer. IPMAP is advantageous in that each specific data flowing between any two processing nodes are clearly indicated. In addition, this thesis isolates each cross-system and organizational boundary on the IPMAPs. Cross-system boundary is defined as the data flow between two different systems in a same company organization. Cross-organizational boundary is defined as the data flow between two different company organizations. Pay extra attention to data quality at cross-organizational boundaries
68
All the data quality problems spotted in this thesis occurs at cross-system and organizational boundaries. This is consistent with the IPMAP literature. Shankaranarayanan and Wang (2007) highlighted the need for managing data quality in inter-organizational settings. This is primary because data can have different quality expectations and separate data quality management processes at different organizations.
IPMAP’s correlation with other modeling techniques In the case of reservoir simulation and forecasting, two process flow charts are presented. At each of the steps, data quality analytical questions are raised. These questions address non-technical data quality issues during the simulation process. These questions can be beneficial to the company under study as they provide systematic review questions targeted to improve data accuracy and completeness. IPMAP has limited functionality at high level The early section of Chapter 4 includes a high level IPMAP on reservoir simulation. It is clear what type of data is required for material balance analysis, geocelluar model building and reservoir simulation. However, in order to identify a data quality problem, specific data flow must be highlighted. In addition, cross-system and organizational boundaries cannot be clearly differentiated.
5.2 Directions and Enhancement for Future Research
Limited support from Subject Matter Experts (SMEs) Reservoir pressure and reservoir simulation and forecasting are complex processes that require significant reservoir engineering knowledge to understand. This thesis is constructed with limited support from the Subject Matter Expert (SME) from EG. In addition, most key stakeholders within EG’s organization consider reservoir pressure and reservoir simulation to be challenging topics as they are dynamic and always changing. The directions for future research must leverage the SME’s technical knowledge to build a solid understanding of the data quality in an upstream oil and gas company. Data quality analytical questions to include additional dimensions The data quality analytical questions applied in the first experiment only covers the top most cited dimensions. The 5 questions raised can be expanded to examine more data quality dimensions or the same dimensions but in more depth. This would probably involve more technical aspect of the upstream oil and gas industry and would take longer time to analyze the results. Validate the data quality analytical questions in different systems
69
The new proposed data quality examination methodology is applied to the three known pressure survey management systems at the company under study. The scalability of any framework or methodology is always very critical. A future area of study could be to apply this approach to other aspects of the upstream oil and gas operations. In the best case scenario, this methodology can be proved to be pragmatic in different systems. It is expected that questions will be updated to be adaptive to different systems. Select a different data mapping techniques or methods for reservoir simulation The second experiment of this thesis did not produce indicative results. This could be due to the limited functionality of IPMAPs at the architectural level and the restricted features of the process flow charts. A new direction of future research could be to apply a different methodology other than IPMAPs and process flow, where the different approach may be pragmatic at the architectural level.
70
6. References
Agmon, N., and Ahituv, N. Assessing Data Reliability in an Information Systems. J. of Manage. Info. Syst. 4, 2 (1987), pp. 34–44. Ballou, D.P., and Pazer, H.L. Modeling data and process quality in multi-input, multi- output information systems. Manage. Sci. 31, 2 (1985), pp. 150–162. Ballou, D., Wang R.Y., Pazer H., and Tayi, G. K. (1998), Modeling Information
Manufacturing Systems to Determine Information Product Quality, Management Science, 44 (4), 462-484
Brodie, M.L. Data quality in information systems. Info. Manage. (1980), pp. 245–258. Creswell, J. (1998). Research design: Qualitative, quantitative, and mixed methods
approaches (2nd ed.). Thousand Oaks, CA: Sage. DAVIDSON, B., LEE, Y.W., WANG, R. 2004. Developing data production maps:meeting
patient discharge data 1 DEMING, W.E. 1982. Out of the Crisis. MIT Press, Cambridge, MA.
FLYVBJERG, B. 2006. Five misunderstandings about case study research. Qualitative Inquiry 12, 2, 219-245.
Firth, C.P., and Wang, R.Y. Data Quality Systems: Evaluation and Implementation. Cambridge Market Intelligence, London. 1996.
Hyne, Norman J. Nontechnical Guide to Petroleum Geology, Exploration, Drilling, and Production. Tulsa, OK: Penn Well, 2001. Print.
Hansen, J. V. Audit considerations in distributed processing systems. Commun. ACM 26, 5 (1983), pp. 562–569. Kriebel, C.H. Evaluating the quality of information systems. Design and Implementation
of Computer Based Information Systems. N. Szysperski and E. Grochla, Ed. Sijthtoff & Noordhoff, Germantown. 1979.
Lee, Y. W., Pipino, L. L., Funk, J. D. and Wang, R. Y. (2006), Journey to Data Quality, MIT Press, Cambridge MA Madnick, S.E., Lee, Y.W., Wang, R.Y. and Zhu, H.W., Overview and Framework
for Data and Information Quality Research. J. Data and Information Quality, Vol.1, No.1. (June 2009), pp.1-22.
Miles, M. B., & Huberman, A. M. (1994). Qualitative data analysis: An expanded source book (2nd ed.). Thousand Oaks, CA: Sage.
Patton, M. (1990). Qualitative evaluation and research methods (2nd ed.). Newbury Park, CA: Sage.
Redman, T.C. (1996) Data Quality for the Information Age. Boston, MA: Artech House, 1996.
Ross, Jeanne W., Peter Weill, and David Robertson. Enterprise Architecture as Strategy: Creating a Foundation for Business Execution. Boston, MA: Harvard Business School, 2006. Print.
Shankaranarayanan G. and Watts, S. (2003), A Relevant, Believable Theory of Data Quality Assessment, Proceedings of the 8th International Conference on Information Quality, Cambridge, MA
Shankaranarayanan, G., Ziad, M. and Wang, R. Y. (2003) Managing Date Quality in
71
Dynamic Decision Environment: An Information Product Approach Journal of Database Management, 14 (4) 14-32
Shankaranarayanan, G. and Wang, R.Y., IPMAP: Research Status and Direction, The 12th International Conference on Information Quality, November 2007, pp. 510-517.
Stake, R. E. (1995). The art of case study research. Thousand Oaks, CA: Sage. Wand, Yair and Wang, R.Y., Anchoring Data Quality Dimensions in Ontological Foundations, Communications of ACM, November 1996. pp. 86-95. Wang, R. Y. (1998) A Product Perspective on Total Data Quality Management, Communications of the ACM, 41(2), 56-65 Wang, R.Y., Kon, H.B., and Madnick, S.E. Data quality requirements analysis and
modeling. In Proceedings of the the 9th International Conference on Data Engineering. (Vienna, Austria, 1993), pp. 670–677. 1993
Wang, R. Y., Lee, Y. W., Pipino, L. L. and Strong, D. M. (1998), Manage your Information as a Product, Sloan Management Review 39(4), 95-105.
Wang, R.Y., Reddy, M. P., and Kon, H.B. Toward quality data: An attribute-based approach. Decision Support Syst. (1995) pp.349–372. Wang, R.Y., Storey, V.C., and Firth, C.P. A framework for analysis of data quality
research. IEEE Trans. on Knowl. Data Eng. 7, 4 (1995), pp. 623–640. Wang, R. Y. and Strong, D. M. (1996) Beyond Accuracy: What Data Quality Means to
Data Consumers, Journal of Management Information Systems 12(4), 5-34. Yin, R. K. (2002). Case study research: Design and methods (3rd ed.). Thousand Oaks,