70
DATA REPORTING GAP SUSTAINABLE DEVELOPMENT GOALS (SDGs) PAKISTAN'S PERSPECTIVE
| Date post: | 16-Jul-2019 |
| Category: |
Documents |
| Upload: | truongdieu |
| View: | 212 times |
| Download: | 0 times |

DATA REPORTING GAP
SUSTAINABLE DEVELOPMENT GOALS (SDGs)
PAKISTAN'S PERSPECTIVE

SUSTAINABLE DEVELOPMENT GOALS (SDGs)
PAKISTAN'S PERSPECTIVEDATA
REPORTING GAP
01
DRAFT REPORT - For Review
December 2017
DATA REPORTING
GAP

SUSTAINABLE DEVELOPMENT GOALS (SDGs)
PAKISTAN'S PERSPECTIVEDATA
REPORTING GAP
“SDGs encompasses a universal, transformative and integrated agenda that heralds an historic turning point for our world. This is the People's Agenda, a plan of action for ending poverty in all its dimensions, irreversibly, everywhere, and leaving no one behind. It seeks to ensure peace and prosperity, and forge partnerships with people and planet at the core. The integrated, interlinked and indivisible 17 Sustainable Development Goals are the people's goals and demonstrate the scale, universality and ambition of this new Agenda.”
SUSTAINABLE DEVELOPMENT GOALS (SDGs)
PAKISTAN'S PERSPECTIVE
[Former UN Secretary-General Ban Ki-moon]
DRAFT REPORT - For ReviewDecember 2017
Federal SDGs Support UnitMinistry of Planning, Development and Reforms
Prepared By:
DATA REPORTING
GAP
02
03
The data reporting gap exercise was initiated one year ago, with an initial assessment exercise (Annexure II) conducted in collaboration between UNDP and the Planning Commission. The objectives of the exercise were, (i) To examine data availability for each indicator; (ii) To examine data availability at the disaggregated level; and, (iii) To develop a fact sheet for each indicator at the possible disaggregated level.
Initiated in May 2017, this report is one step further to the initial assessment exercise. It is prepared using existing national databases. The initial phase involved populating datasheets on each SDG indicator, both at the national and provincial levels. During the assignment, there were several obstacles debated upon, including identifying various sources of data, as well as devising an action plan for instances where requisite data wasn't available.
Following the Global Tier System, a coding system was devised for each indicator, that aided in identifying efforts needed to fill the data gap on SDGs. It is safe to say that this report may serve as a guiding document for everyone to reduce the data reporting gap. It will eventually help in monitoring SDG achievements till 2030.
Preface
SUSTAINABLE DEVELOPMENT GOALS (SDGs)
PAKISTAN'S PERSPECTIVEDATA
REPORTING GAP

04
Tableof ContentsChapter 1: Introduction
Chapter 2: Methodology 2.1 Analysis of Data Availability
2.3 Multiplicity of Data Sources
Chapter 3: Unveiling the Exercise 3.1 Identification of Preferred Source
3.2 Role of Data Reporting Agency
3.3 Identification of the Role of Lead Ministries
3.4 Role of International Organizations
Chapter 4: The Long Haul: Government Endeavor Towards Reporting of SDGs Indicators 4.1 Institutional Coordination
4.1.1 PBH
(a) Education
(b) Health, Nutrition and Gender Equality
(c) Water & Sanitation
(d) Poverty, Labour and Employment
4.1.2 Miscellaneous Organizations
4.2 Streamlining of National Survey Instruments
Chapter 5: The Way Forward
5.1 Use of Technology for Data Collection
Annexure I Table 1: Data Gap Analysis for Sustainable Development Goals Indicator Summary by Goal
Table 2: Indicator Summary by Preferred Source
Table 3: Indicator Summary by Reporting Agency
Table 4: Indicators Summary by Lead Ministry
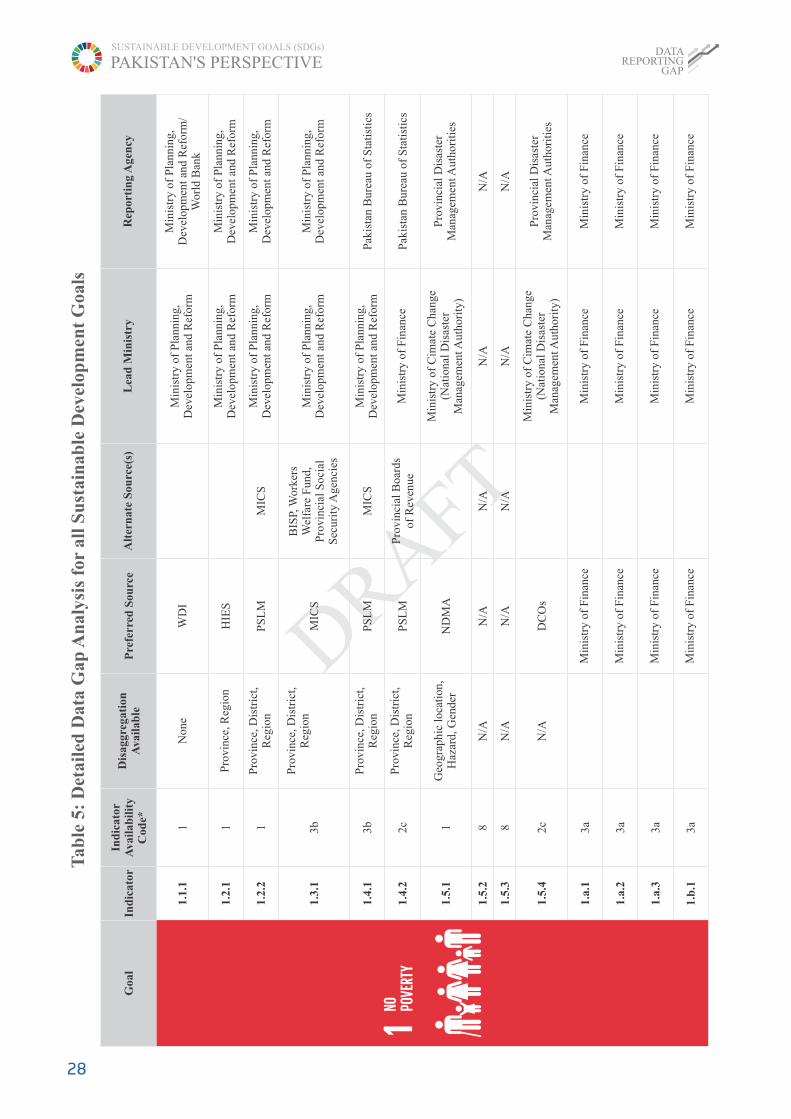
Table 5: Detailed Data Gap Analysis for all Sustainable Development Goals
List of Figures
SUSTAINABLE DEVELOPMENT GOALS (SDGs)
PAKISTAN'S PERSPECTIVEDATA
REPORTING GAP
Figure 1: Data Reporting Gap Analysis -Overall
Figure 2: Efforts Required to Reduce Data Reporting Gap - Summary
Figure 3: Goal wise Availability
Figure 4: Indicator Availability by Goal - Tier 1
Figure 5: Indicator Availability by Goal - Tier 2
Figure 6: Indicator Availability by Goal - Tier 3
Figure 7: Availability of Indicators by Disaggregation
12
12
13
13
14
14
15
6
88
8
911
16
16
16
1717
17
17
17
18
18
18
18
20
21
2222
23
25
27
28

05
Acronyms
CRVS
HIES
HMIS
IAEG
ICT
ILO
LFS
MDGs
MICS
MNCH
MoF
MoPD&R
MoIT
MoST
NADRA
NCDs
NDMA
NEAS
NEMIS
PBS
PDHS
PDMA
PMDC
PSLM
PSU
SDGs
SIDS
UN
UNDP
UNESCO
UNICEF
UNSC
WASH
WB
WHO
Civil Registration Vital Statistics
Household Income and Expenditure Survey
Health Management Information System
Inter-Agency Expert Group
Information and Communication Technology
International Labour Organization
Labour Force Survey
Millennium Development Goals
Multiple Indicator Cluster Survey
Maternal, Newborn and Child Health
Ministry of Finance
Ministry of Planning, Development and Reform
Ministry of Information Technology
Ministry of Science and Technology
National Database Registration Authority
Non-communicable Diseases
National Disaster Management Authority
National Education Assessment System
National Education Management Information System
Pakistan Bureau of Statistics
Pakistan Demographic and Housing Survey
Provincial Disaster Management Authority
Pakistan Medical and Dental Council
Pakistan Social and Living Standard Measurement
Primary Sample Unit
Sustainable Development Goals
Small Independent Developing States
United Nations
United Nations Development Program
United Nation Education, Scientific and Cultural Organization
United Nation International Child Emergency Fund
United Nations Statistical Commission
Water, Sanitation and Hygiene
World Bank
World Health Organization
SUSTAINABLE DEVELOPMENT GOALS (SDGs)
PAKISTAN'S PERSPECTIVEDATA
REPORTING GAP
06
Introduction
1. IAEG uses four tiers to classify reporting difficulty; these codes are 1, 2, 3 and 8. Codes 1, 2 and 3 show the rising level of reporting difficulty while 8 shows the irrelevance of an indicator in the local context or its application only at the global or regional level. Available at https://unstats.un.org/sdgs/iaeg-sdgs/tier-classification/
Transformative in nature, the Sustainable Development Goals (SDGs) aim to promote and ensure intergenerational equity so that future generations may live better, improved lives. “Leaving no one l e f t b e h i n d ” a n d e n s u r i n g “sustainability” are the core foundations for the SDGs. These are translated into seventeen goals centered around the five P's: People, Prosperity, Planet, Peace and Partnership. These goals were formally adopted in 2015 as National Development Goals, following which federal and provincial governments have started mainstreaming SDGs into national and sub-national plan-ning.
1.1 Objectives of Study
This detailed data gap analysis serves as the initial point for the mainstreaming of the SDGs. The objective of this exercise is two-pronged. The first part involves conducting a detailed analysis of Pakistan's data ecosystem vis-à-vis reporting needs. The second is to create baselines so that provin-cial and federal governments may use this information in their result-based management endeavors for
public sector plans. Moreover, the outputs of this report will also be of use to relevant stakeholders to review and analyze the current situation. Subsequently, this will lead to clarity and facilitation in the national as well as provincial decision-making process, for assigning various functions of data generation and usage.
At the outset, it should be borne in mind that this exercise is about investigating actions leading to reducing the reporting gap. So essentially, it is a progressive exercise and not a post mortem exercise. The entire exercise is a desk review, vetted through an intensive consultative process. Each SDG indicator is analyzed for the extent of effort that is required to report on the relevant target. Guidance for classifying the 'effort level' is taken from the global tier system devised by Inter-Agency Expert Group (IAEG), however this taxonomy is custom-ized to gain clarity for actions needed to reduce data gaps. Compared to the four codes used by IAEG, this exercise uses ten codes. Tier 1 and Code 1 are the same, while Tier 2 is further divided into 2a, 2b, 2c, and 2d.
Chapter 1
SUSTAINABLE DEVELOPMENT GOALS (SDGs)
PAKISTAN'S PERSPECTIVEDATA
REPORTING GAP

07
2. Major lead ministries include Ministry of Finance; Ministry of National Health Services, Regulations and Coordination; Ministry of Climate Change; Ministry of Planning, Development and Reform; Ministry of Overseas Pakistanis and Human Resource Development; Ministry of Federal Education and Professional Training; Ministry of Interior, and provincial ministries of education, health, water supply and sanitation, rural development, road and infrastructure.
SUSTAINABLE DEVELOPMENT GOALS (SDGs)
PAKISTAN'S PERSPECTIVEDATA
REPORTING GAP
Similarly, Tier 3 is further divided into 3a, 3b, 3c, and 3d. Each code captures the rising level of report-ing difficulty, and 8 means irrelevance.
The exercise has culminated into detailed results and summary sheets, which present the status of data availability; the extent and type of effort needed; responsible lead ministries, reporting agencies, UN agencies and multilateral organizations other than UN; institutional sources of data, and other sources of data including survey data.
1.2 Main Findings: A Summary
The gist of this exercise is that Pakistan's data ecosystem is not in a very bad state vis-à-vis SDGs' reporting needs. Pakistan fares reasonably well in capturing the inclusion and equity aspects of SDGs but needs substantial improvement in the sustainability aspects of goals, specifically related to natural resources, biodiversity, urban life, climate change, WASH and peace and justice. Moreover, reporting on the qualitative aspects of SDGs in
general is also an area that requires improvement.
Altogether, out of 244 indicators, 43 are global indicators for which clarity on the role of national statistical organizations is mini-mal. Out of the remaining 201 indicators, half are either avail-able, or minor effort is needed to make them available. The other half requires major efforts that entail detailed consultations with relevant stakeholders, institutional coordination and new surveys. Data availability for indicators of goals concerning poverty, zero hunger; quality education; gender equality; affordable and clean energy; decent work and economic growth; and industry innovation and infrastructure, is significant, with reporting ranging between 50 percent and 80 percent. However, the situation does not bode well for goals relating to clean water and sanitation; reduced inequalities; sustainable cities and communi-ties; responsible consumption and production; life on land; life below water, and peace and justice. The reporting of indicators in these ranges between 0 percent and 38 percent, thus leaving a large reporting gap.
Ministries occupy a pivotal role in creating demand for data relevant to their respective goals and targets. This demand is triggered by embedding a results based framework in policies and plans developed by them. In order for this report to be useful, it is
2important that relevant ministries take a leading role in indicator monitoring and then use it to develop subsequent policies to monitor progress on SDGs.
1.3 Structure of Report
The report comprises of five chapters. chapter two elucidates methodology; chapter three summarizes the required effort by goal, by lead ministry/division, by source and by reporting agency; chapter four outlines government endeavors towards reporting of SDGs indicators; and finally, the last chapter concludes the report by suggesting several measures to reduce the data reporting gap on SDGs.

08
The core objective of the data gap analysis is to suggest actions required to reduce the SDGs reporting gap. The indicators differ in their reporting; few are reported at the global level, while most are country specific. Certain indica-tors depend on their socioeco-nomic and geographical peculiar-
3ity. Considering these aspects is impor t an t wh i l e ana lyz ing reporting gaps and developing a way forward for narrowing these gaps.
2.1 Analysis of Data Availability
The UNSC has published metadata 4for most of the indicators post
consultations with the IAEG-SDGs. The metadata provides a detailed overview of the proposed indicator with the purpose of reporting, definition by global agency and method of computa-tion along with the level of disaggregation. It also identifies different data sources and pro-poses new methods of data collection.
Work on the mapping of indicators on data availability was conducted in two phases. The analysis in the
first phase was a post mortem based on the IAEG tier system. The coding of data sources was classified in four distinct codes that are as follows:
1. Data is available on a regular basis and standards are also available;
2. Data is not available on a regular basis but standards are available;
3. Neither data nor standards are available; and,
8. Indicator is not relevant.
This exercise revealed some notable findings of data availabil-i t y a t d i f f e r e n t l e v e l s o f disaggregation. At the federal level, 52 percent of the indicators were assigned code 1, 13 percent were assigned code 2 and 33 percent were assigned code 3. Only two percent of the indicators were found to be not relevant at the federal level. From a data avail-ability perspective, the most desirable code among these four codes was code 1. However, the situation deteriorates as we move to sub-national (provincial) and especially, local levels (district). At the provincial level, the highest percentage (39 percent) was assigned code 3. This suggests that
a lot of effort has to be made so as to make these indicators available for reporting, considering that they have to be established first, only after which data can then be made available. At the district level, only 11 percent of the indicators are available on a regular basis with standards (code 1).
2.2 Classification of codes: New and old approaches
While the IAEG tiered approach is useful, its limitation lies in the fact that it relies upon the availability of standards as one of the major aspects of classification. This would mean that for the 62 indicators for which metadata does not provide any guidance for computation, standards would not be not available as a result. Of these, 17 can be reported using national data definitions, while survey data is available for several others. This means that the number of indicators for which metadata is not available falls to 44. Of these 44 indicators, 19 are to be reported at the global level for which national statistical organizations do not have a major role. So the number of indicators for which
Methodology
Chapter 2
3. For example, least developed countries, landlocked and small island countries.
4. Meta data on 62 indicators is not available. For further reading, please refer to “Compilation of Metadata for the Proposed Global Indicators for the Review of the 2030 Agenda for Sustainable Development.” Available at https://unstats.un.org/sdgs/iaeg-sdgs/metadata-compilation/
SUSTAINABLE DEVELOPMENT GOALS (SDGs)
PAKISTAN'S PERSPECTIVEDATA
REPORTING GAP

09
SUSTAINABLE DEVELOPMENT GOALS (SDGs)
PAKISTAN'S PERSPECTIVEDATA
REPORTING GAP
metadata is not available while national statistical organizations are responsible for reporting them is only 25 - a very small number compared to the total of 244 indicators (10.2 percent). This shows that unavailability of metadata is not the limiting factor, and is redundant in determining actions to reduce reporting gaps at the national and sub-national context.
Using these insights, IAEG-SDG codes are expanded into new codes' classification in accordance with the level of effort needed to obtain data. The IAEG classifica-tion codes were more status-oriented, while the new codes are designed to be action-oriented. Nonetheless, the new codes can easily be compared with the global tier system. This was crucial to ascertain the quantum of work required to fill al l exist ing reporting gaps and to develop an actionable agenda to improve reporting on SDG indicators.
Following are the new classifica-tion of codes for data gap analysis:
After a thorough review of all existing and potential sources of data in Pakistan, each indicator
was assigned one of the above ten codes to capture the action required to bring reporting close to the standards defined in the SDGs metadata.
Code 1 is assigned to the indicators where standards are available, data and reporting structures are already present, and the indicator is reported regularly, thus no action is required. Code 2a is assigned to indicators where standards are available, data is also available, but computation is required to obtain the indicators. Similarly, code 2b is assigned to those indicators where standards are available but data is reported irregularly. Code 2c is assigned to those indicators where standards are available, data is not available but can be obtained by adding a question or rephrasing certain questions in the existing surveys, thus requiring minor effort. Code 2d is assigned to those indicators where standards are available, data is not available and adding a new module in the existing surveys or introducing new surveys is required, thus the need for major
effort to cover the reporting gap.
Following Tier 3, Code 3a is assigned to those indicators where standards are not available but data is reported by a few international agencies, such as WHO that reports regularly on 3.9.1, 3.9.2 and 3.9.3, as well as SBP that has data on 10.5.1, and IMF that has the methodology to compute certain indicators. Similarly, code 3d is assigned to those indicators where standards are not available but national standards are avail-able, such as GDP per capita that is calculated using a system of national accounts by the PBS. Code 3b is assigned to those indicators where standards are not available and data is also not available but can be obtained by adding a question or rephrasing certain questions in existing surveys, thus requiring minor effort. Unlike 2c, however, we have significant issues of setting standards for the indicators. Code 3c is assigned to those indicators where standards are not available, data is not available and adding a new module in the existing surveys or introducing new surveys is required, thus requiring major effort to cover the reporting gap. Several significant consultation sessions with stakeholders are requisite in order to set standards as well as to obtain the indicators.
Finally, Code 8 was assigned to indicators that were global in nature, and therefore did not require national level reporting. This code is identical to Code 8 in the IAEGs coding scheme.
2.3 Multiplicity of Data Sources
The survey data sources for several goals have substantial overlaps and duplications, which provide an opportunity to increase SDG report ing while gaining on efficiency and coverage. For example, in Goal 2, several targets related with malnutrition are reported by MICS as well as by PDHS. However, PDHS reports at
Definition Codes
Standards available data available
Standard available computation required
Standard available data irregularly available
Standard available, data not available, minor effort
Standard available, data not available, major effort
Standard not available, data is reported by few agencies
Standard not available, data not available, minor effort
Standard not available, data not available, major effort
Standard not available, data is reported, national standards are available
Global Indicator
1
2a
2b
2c
2d
3a
3b
3c
3d
8

10
the provincial level, while MICS reports district level indicators. In Goal 3, the potential choices for targets related with mother, child and infant mortality reporting can be MICS, but PDHS is also reporting these indicators. For Goal 4, targets related with the supply side of education can be reported by PSLM or EMIS or both. For education quality, NEAS and ASER can both be considered, where the former is produced by the public sector and the latter by the private sector. They do differ in coverage, therefore the inclusion aspect may be the primary factor in preferring one over the other. The same holds true for labor market indicators, where PSLM and LFS
are both potential sources, but PSLM coverage is limited to the district level, while LFS covers only the provincial level.
Survey data sources differ in their regional coverage; demographic group coverage; disability and vulnerability coverage; and, income group coverage. SDG indicators being inclusive, require reporting on these dimensions. Therefore, capability or potential capability of national data sources to produce the required level of disaggregation forms the objective basis of comparison and prefer-ence. Regularity of data is the other major factor for preferred choice.
These criteria are applicable to most of the survey data sources, especial ly those which can primarily be used to report on Goals 1, 2, 3, 4, 5, 8 and 10. These goals capture social, human and economic equity. Other goals, such as Goals 6, 7, 8 and 9, require a mix of survey and institutional data for reporting, while the remaining goals, such as Goals 11, 12, 13, 14, 15, 16 and 17, require more i n s t i t u t i o n a l r e p o r t i n g . Notwithstanding this, the “Means o f I m p l em en t a t i o n ” ( M o I ) indicators for almost all the goals require institutional reporting. These aspects make the data gap exercise exploratory in nature.
SUSTAINABLE DEVELOPMENT GOALS (SDGs)
PAKISTAN'S PERSPECTIVEDATA
REPORTING GAP

11
The availability of precise data is a p re requis i te fo r measur ing development outcomes. Most of the projects/initiatives in develop-ing countries like Pakistan have failed or discontinued owing to the absence of timely and accurate information about tangible and intangible benefits. This has also hampered the development process as the unavailability of d a t a h a s r e s u l t e d i n t h e misallocation of valuable public resources. Therefore, collection and timely dissemination of information could vastly improve the decision-making and measur-able outcomes of government initiatives.
The data generation, collection, analysis and reporting is a complex task that requires specialized training and capacity of human resource. While collection of information has remained quite active on part of most ministries and divisions, however a lack of sharing it regularly has caused bottlenecks. This has led to a reduced loss of appetite for informed decis ion making. Another impediment is the lack of appropriate mechanisms for data flows among different government ministries and departments, which has compromised institutional strengthening and capacity of line ministries and statistical organiza-tions to collect and timely dissemi-
nate required data for informed decisions.
As discussed in the previous chapter, data gap analysis requires several steps. The first step includes identifying the sources of data collection for each indicator along with a need for computation, minor data collection effort and major data collection effort. Minor data collection effort implies alterations in the phrasing of survey questions according to the SDG indicator, or adding new questions relevant to the SDG indicator in the existing surveys. Major data collection effort requires comprehensive consulta-tion with relevant stakeholders including international develop-ment agencies , government agencies, CSOs and INGOs working on various SDGs indica-tors, as well as data collection and reporting agencies. This discus-sion will decide whether to add sets of questions in a questionnaire, and/or add modules in existing questionnaires, and/or conduct separate surveys. Furthermore, consultation is also required where standards are not available (Tier 3 or Code 3a, 3b, 3c and 3d).
Table 1-Annexure summarizes the codes for the seventeen goals. Out of 244 indicators, 43 (18 percent) are global, therefore percentages computed in the last column of
Table 1-Annexure are done by dividing with 201 Following the change in denominator, out of 201non-global indicators, 49.75 percent are either available; or computation is required; or can be available with minor efforts; or national standards are available, i.e., codes 1, 2a, 2b, 2c, and 3d (see Figure 1). Indicators requiring significant efforts were 40.8 percent (Codes 2d, 3b, and 3c), while more significant effort is needed for those variables (code 3a - 9.5 percent) that are not concep-tually clear, as well as whose method of computation and other explanation is not provided in the metadata, except that a few organizations are reporting them regularly. For instance, WHO reports regularly (on i.3.9.1, i.3.9.2 and i.3.9.3); SBP has data on Financial Soundness Indicators (i.10.5.1); and, IMF houses the methodology to compute it.
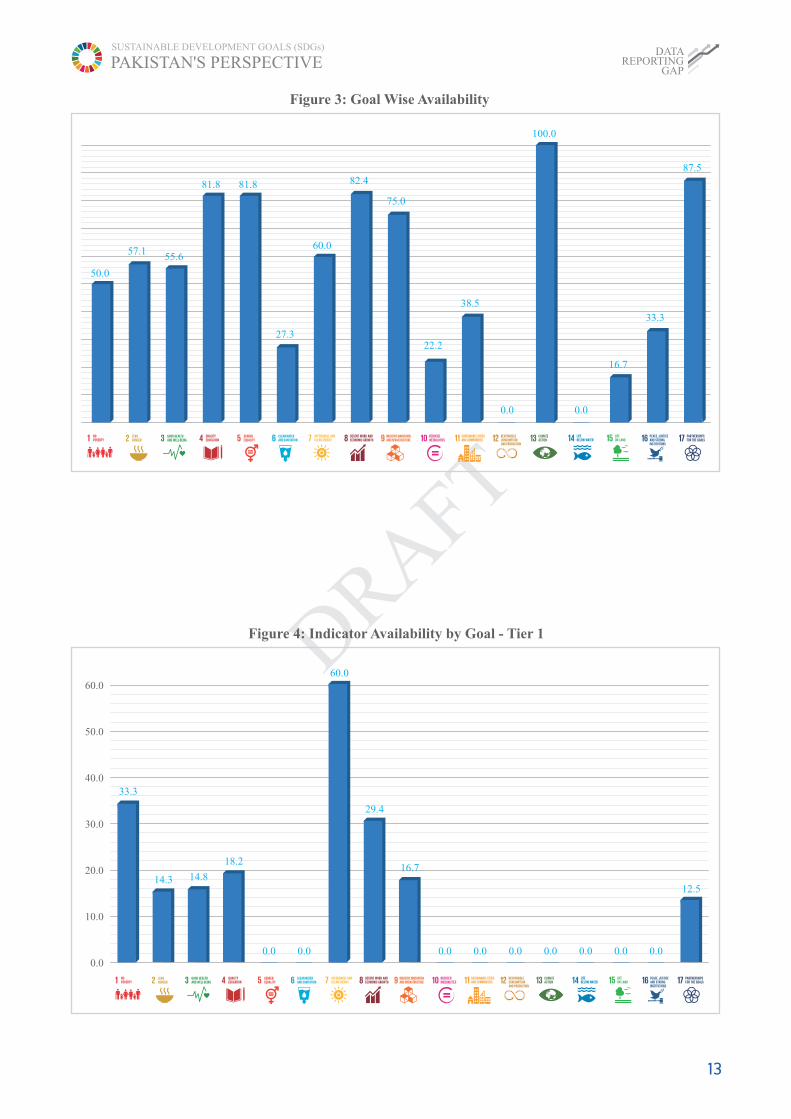
Figure 2 (Table 1-Annexure) presents a goal-wise situation vis-a-vis reporting gaps. Results in Figure 2 and Figure 3 need to be read jointly to determine the role of national statistical organizations and required action. For example, in goal 17, data availability without including global indica-tors, is 87.5 percent, but drops substantially after including global indicators. This implies that in Goal 17, data on most of the
Unveiling the Exercise
Chapter 3
SUSTAINABLE DEVELOPMENT GOALS (SDGs)
PAKISTAN'S PERSPECTIVEDATA
REPORTING GAP

12
Figure 1 : Data Reporting Gap Analysis - Overall
11.44
22.89
1.99
29.85
11.94
9.45
5.974.968
1.49
1 2b 2c 2d 3a 3b 3c 3d2a
Figure 2 : Efforts Required to Reduce Data Reporting Gap – Summary
1 2a 2b 2c 2d 3a 3b 3c 3d 8
2
0
0
0
2
2
4
4
2
2
2
2
4
4
7
4
23
4
8
1
00
0
0
0
01
1
3
00
2
3
0
2
2
2
5
0
0
0
8
2
10
0
1
1
1
3
0
0
0
1
1
1
1
3
5
5
0
0
0 0
0
0
2
2
5
1
2 2
0
3
4
2
0
0
2
010
7
1
1
3
0
4
0
4
3
2
0
6
0
1
0 0
5
1
2
0
22
0101
8
1
10
0
20
3
10
10
2
1
4
17
2
1
4
1
00
indicators is available. Similarly, Figure 3 shows 100 percent availability of Goal 13, because six out of seven are global indicators while the remaining one requires
5computation. Besides Goal 17, most of the indicators of Decent Job and Economic Growth (Goal
8), Gender Equality (Goal 5) and Education (Goal 4) are available, followed by Industry, Innovation and Infrastructure (Goal 9), Affordable and Clean Energy (Goal 7), No Hunger (Goal 2), Health and Well-Being (Goal 3) and Poverty (Goal 1). This implies
that the overall situation of data availability is not very grim despite the low percentage of availability in Goal 6, Goal 10, Goal 12, Goal 14, Goal 15 and Goal 16. The situation will further improve after consultation with stakeholders.
5. 13.1.2 Number of deaths, missing persons and persons affected by disaster per 100,000 people
SUSTAINABLE DEVELOPMENT GOALS (SDGs)
PAKISTAN'S PERSPECTIVEDATA
REPORTING GAP
13
Figure 3: Goal Wise Availability
50.0
57.155.6
81.8 81.8
27.3
60.0
82.4
75.0
22.2
38.5
100.0
0.0
16.7
33.3
87.5
0.0
Figure 4: Indicator Availability by Goal - Tier 1
60.0
50.0
40.0
30.0
20.0
10.0
0.0
33.3
14.3 14.8
18.2
0.0 0.0 0.0 0.0 0.0 0.0 0.0 0.0 0.0
60.0
29.4
16.7
12.5
SUSTAINABLE DEVELOPMENT GOALS (SDGs)
PAKISTAN'S PERSPECTIVEDATA
REPORTING GAP

14
Figure 5: Indicator Availability by Goal - Tier 2
100.0
90.0
80.0
70.0
60.0
50.0
40.0
30.0
20.0
10.0
0.0
2a 2b 2c 2d
Figure 6: Indicator Availability by Goal - Tier 3
50.0
45.0
40.0
35.0
30.0
25.0
20.0
15.0
10.0
5.0
0.0
2a 2b 2c 2d
SUSTAINABLE DEVELOPMENT GOALS (SDGs)
PAKISTAN'S PERSPECTIVEDATA
REPORTING GAP

Pertinent ministries and institu-tions, based on their functional responsibilities and mandates, are assigned relevant tasks related with the demand and supply of data for SDG indicators. After the 2010 devolution, most sectors have been transferred to provincial govern-ments, bringing the policy and planning of these sectors under the purview of provinces. Most of the goals map uniformly on depart-ments; however, there is some variation in mapping.
The lack of a results-based management (RBM) culture is another issue that obscures the role of ministries and institutions. Mid-term and short term plans are given due diligence whilst setting targets, which in turn raise demand for resources. In situations when sub-optimal measures are used, generated data is not timely communicated or demand for
precise data is weak, thereby not fostering the culture for RBM. Thus, the roles, responsibilities and resources related to data generation and data use are not amply rooted in public sector planning. This makes the identifi-cation process cumbersome and more intensive. Sincere and intensive efforts have been made to assign these roles to ministries, departments, and institutions, however these endeavors are open to improvement.
Another aspect making identifica-tion a challenge is the qualitative nature of data reporting. Unlike MDGs, SDGs require qualitative data, for example, quality educa-tion, affordable health, sustainable production etc. To capture the qualitative aspect of indicators, the definition of each indicator needs to be reviewed, unanimously decided by all stakeholders and
their computation procedure should be clearly communicated. For instance, data on numeracy skills to examine the quality of education is collected by PBS as well as by the National Education Assessment Survey (NEAS) and ASER. Each reports a different indicator value due to differences in the methodology of collecting and computing the indicator. Thus, it is necessary to come up with unified definitions to overcome the problems of multiplicity and/or identify one significant source that should be followed across the board.
Following the spirit of SDGs; farthest behind first and leaving no one behind data is required at the disaggregated level. Figure 7 summarizes the need for data at the disaggregated level by global, national, provincial and district.
Figure 7 : Availability of Indicators by Disaggregation
National Province District Global
45
90
66
43
Note: These values are output of intensive desk review which can be changed after through consultations with provinces and other stakeholder
15
SUSTAINABLE DEVELOPMENT GOALS (SDGs)
PAKISTAN'S PERSPECTIVEDATA
REPORTING GAP
16
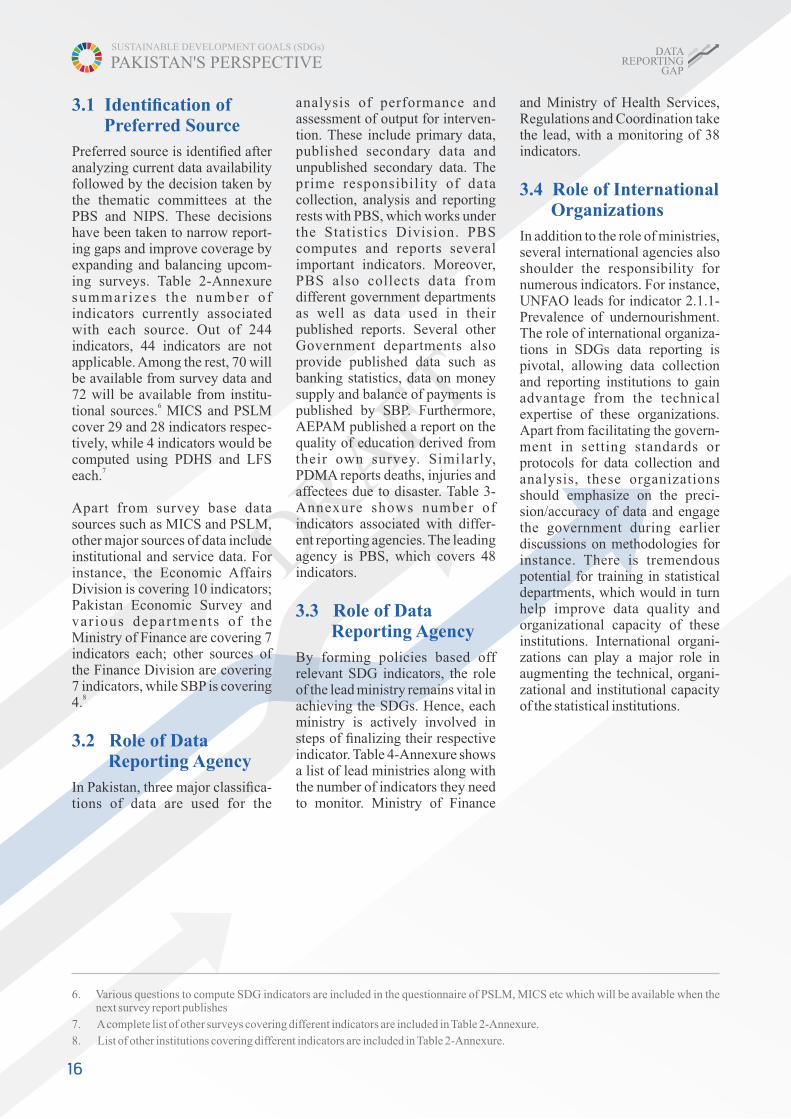
3.1 Identification of Preferred Source
Preferred source is identified after analyzing current data availability followed by the decision taken by the thematic committees at the PBS and NIPS. These decisions have been taken to narrow report-ing gaps and improve coverage by expanding and balancing upcom-ing surveys. Table 2-Annexure summar izes the number of indicators currently associated with each source. Out of 244 indicators, 44 indicators are not applicable. Among the rest, 70 will be available from survey data and 72 will be available from institu-
6tional sources. MICS and PSLM cover 29 and 28 indicators respec-tively, while 4 indicators would be computed using PDHS and LFS
7each.
Apart from survey base data sources such as MICS and PSLM, other major sources of data include institutional and service data. For instance, the Economic Affairs Division is covering 10 indicators; Pakistan Economic Survey and var ious departments of the Ministry of Finance are covering 7 indicators each; other sources of the Finance Division are covering 7 indicators, while SBP is covering
84.
3.2 Role of Data Reporting Agency
In Pakistan, three major classifica-tions of data are used for the
analysis of performance and assessment of output for interven-tion. These include primary data, published secondary data and unpublished secondary data. The prime responsibility of data collection, analysis and reporting rests with PBS, which works under the Statistics Division. PBS computes and reports several important indicators. Moreover, PBS also collects data from different government departments as well as data used in their published reports. Several other Government departments also provide published data such as banking statistics, data on money supply and balance of payments is published by SBP. Furthermore, AEPAM published a report on the quality of education derived from their own survey. Similarly, PDMA reports deaths, injuries and affectees due to disaster. Table 3-Annexure shows number of indicators associated with differ-ent reporting agencies. The leading agency is PBS, which covers 48 indicators.
3.3 Role of Data Reporting Agency
By forming policies based off relevant SDG indicators, the role of the lead ministry remains vital in achieving the SDGs. Hence, each ministry is actively involved in steps of finalizing their respective indicator. Table 4-Annexure shows a list of lead ministries along with the number of indicators they need to monitor. Ministry of Finance
and Ministry of Health Services, Regulations and Coordination take the lead, with a monitoring of 38 indicators.
3.4 Role of International Organizations
In addition to the role of ministries, several international agencies also shoulder the responsibility for numerous indicators. For instance, UNFAO leads for indicator 2.1.1-Prevalence of undernourishment. The role of international organiza-tions in SDGs data reporting is pivotal, allowing data collection and reporting institutions to gain advantage from the technical expertise of these organizations. Apart from facilitating the govern-ment in setting standards or protocols for data collection and analysis, these organizations should emphasize on the preci-sion/accuracy of data and engage the government during earlier discussions on methodologies for instance. There is tremendous potential for training in statistical departments, which would in turn help improve data quality and organizational capacity of these institutions. International organi-zations can play a major role in augmenting the technical, organi-zational and institutional capacity of the statistical institutions.
6. Various questions to compute SDG indicators are included in the questionnaire of PSLM, MICS etc which will be available when the next survey report publishes
7. A complete list of other surveys covering different indicators are included in Table 2-Annexure.
8. List of other institutions covering different indicators are included in Table 2-Annexure.
SUSTAINABLE DEVELOPMENT GOALS (SDGs)
PAKISTAN'S PERSPECTIVEDATA
REPORTING GAP
17
Government Endeavor towards Reporting of SDGs Indicators
The act ive response of the Government of Pakistan towards the reporting of the SDGs displays their perennial commitment and seriousness for the cause. The robust data ecosystem, once created, will improve efficiency and may contribute towards an effective result based management system.
Based on this commitment, the government had initiated the process of reviewing SDGs reporting needs at the end of 2016. PBS took the lead and convened meetings with stakeholders. Moreover, NIPS also initiated stakeholder consultations and several questions were included in the PDHS 2017-18. Similarly, UNICEF and PBS are mutually deciding on conducting National Coordinated MICS simulta-neously in all four provinces.
4.1 Institutional Coordinationa
4.1.1 PBSThe technical committee formed at PBS led to the consensus that Pakistan has several data instru-ments, both institutional and survey based. These instruments may be consolidated, synchro-nized, and balanced to fulfill the reporting requirements of SDG indicators, in a timely and efficient
manner. Four technical subcom-mittees are formed to look into the sufficiency of data instruments and their reporting gaps vis-à-vis the quantitative and qualitative scope of the SDGs. The four committees are, i) Education; ii) Health, Nutrition and Gender Equality; iii) Water and Sanitation; and, iv) Poverty, Labour and Employment.
(a) EducationThis subcommittee analyzed reporting gaps in goal 4, especially in the context of early childhood education, organized learning, non-formal education, ICT, disparities in access to education and proficiency assessment. The needed changes in PSLM were discussed and made part of the forthcoming PLSM. In an effort to integrate proficiency assessment with the PSLM survey, the PSLM sampling frame was used. This would help in relating proficiency findings with education access da ta a t the na t iona l l eve l . Moreover, it would also cover the public and private sector thus enabling the governance and service delivery aspects of the quality of education. These changes intend to substantially increase the coverage of education targets.
(b) Health, Nutrition and Gender Equality
This sub-committee occupies chief focus on health-related goals: goal 2 (nutrition), goal 3 (health) and goal 5 (Gender equality). As a result of several deliberations between various stakeholders, clarity was obtained in relying on certain surveys for specific goals. For example, for malnutrition, it was observed that while PDHS and MICS both offer suitable choices, however, MICS enjoys more coverage at the district level unlike PDHS, which extends only up to the provincial level. Likewise, for reproductive health, PSLM, PDHS and MICS are all suitable choices.
Consequently, the source that provides reporting regularity and maximum accuracy and depth, would be the preferred source for the government. Moreover, it is easier to triangulate with other data sets if the sampling frame used in each data set remains constant.
While information on malnutri-tion, reproductive health and epidemics exists, information on non-communicable diseases (NCDs) needs to be strengthened. Certain tangible ways such as including the module on NCDs in existing surveys, strengthening service data from provincial health departments, and integrating
The Long Haul:Chapter 4
SUSTAINABLE DEVELOPMENT GOALS (SDGs)
PAKISTAN'S PERSPECTIVEDATA
REPORTING GAP

18
WHO sources on NCDs in public health information systems, offer plausible solutions. In the end, information from all these sources may be triangulated so as to assess their effectiveness.
The quantum of mortality ques-tions is high in the SDG indicators. In Pakistan, the mortality data by cause of death is virtually non-existent. Reporting on mortality and morbidity very much hinges on a well-functioning Civil Registration and Vital Statistics (CRVS) System. While a CRVS in provinces continues to evolve, there is still much to be done to ensure complete efficiency. Once fully operationalized, the system will provide a basis for birth registration, demographic infor-mation, social planning, health and death information, and may possibly compliment the census as well. A related development was an agreement on the revitalization of the Pakistan Demographic
9Survey (PDS).
Despite the comprehensive effort, there exist a number of speed bumps. First, information on private sector health providers and health care financing is not readily available in government systems. Although the Pakistan Medical and Dental Council (PMDC) registers health practitioners, however, detailed information on the quantitative and qualitative aspects of clinics, hospitals and diagnostics is scant. Information related to private healthcare financing and out of pocket expenditures is very important because the latter serves as a major source of health shocks, whilst the former works as a shock absorber, thereby being one of the major sources of poverty.
(c) Water & Sanitation Upstream of health is water, sanitation and hygiene (WASH),
which implies that health care planning and management without investing properly in WASH will n o t g i v e p r o p e r r e s u l t s . Investments in health care struc-tures, systems and flows would lead to sub-optimal returns of public expenditures. The technical sub-committee on WASH deliber-ated and proposed that on and off site management of water and sanitation are two distinct aspects and since current surveys did not cover this aspect, therefore there is a need for a community survey in order to bridge the information gap.
(d) Poverty, Labour and Employment
There has been a lot of detailed reporting on poverty, labour and employment related SDGs in Pakistan. While majority of the indicators are available, the rest will be available with the next PSLM su rvey. Ma jo r gaps included the mismatch in regional coverage by PSLM district level and PSLM provincial level surveys. However, PBS has decided to restart HIES providing coverage at district level. This will allow computation and compari-son of different poverty measure-ments at the district level, which bodes well with decentralization and demand driven policy and planning. To generate authentic information on social protection and transfers, mapping of BISP surveys with HIES is a feasible option.
Labour Force Survey, on the other hand, is a useful instrument to obtain data on labor force partici-pation, skills, use of ICT, unpaid work and employment informa-tion. However, nontrivial duplica-tion between HIES/PSLM and LFS can be reduced by either removing the employment module from HIES/PSLM and increasing coverage of LFS from provincial
level to district level, or keeping employment in HIES/PSLM and critically thinking about LFS. To generate information on care and undocumented economy, which is absolutely essential for female unpaid work, a simple module of major chores may be added in the HIES or LFS. It is indeed essential to carry out a time use survey after regular intervals to capture information on care and invisible chores etc.
4.1.2 Miscellaneous Organizations
Although PBS was the chief authority involved in data collec-tion and reporting tasks, a few other institutions such as NIPS (PDHS), NADRA, EAD and certain development authorities (for example CDA) also per-formed active roles in the reporting of several SDG indicators.
Meetings with NIPS has led to include significant questions which are directly dealt with SDGs indicators. Most of those indica-tors are related to Goal 3 (Health and Well Being) and Goal 5 (Gender Equality).
4.2 Streamlining of National Survey Instruments
Significant overlaps lie across survey instruments in Pakistan. For example, PSLM district and PSLM provincial surveys differ in terms of consumption and income modules. PSLM (district) chiefly focuses on the progress of MDGs and therefore, does not delve deeper into consumption and income aspects. Post 2015, the government intends to discontinue the PSLM survey, whilst restarting the HIES. This provides an opportunity to compare the role of HIES, MICS and PDHS vis-à-vis
9. PDS caters information on mortality and cause of death, but was discontinued in 2006.
SUSTAINABLE DEVELOPMENT GOALS (SDGs)
PAKISTAN'S PERSPECTIVEDATA
REPORTING GAP
19
their importance in the context of specific SDGs. This will achieve balancing on one hand, while avoiding duplication and increased coverage on the other, thus gaining on inclusive reporting.
Similarly, there is significant overlap in PSLM (district and provincial) and the LFS. While all have an employment module and generate similar information on labor market indicators, the LFS generates additional information on occupational safety etc. In terms of coverage, the PLSM (district) provides labor market information at the district level whereas LFS provides the same, but only at the provincial level.
Thus, rephrasing a few questions as well as increasing the effort of data collection and computation of SDG indicators, will enable PBS to save on the extra effort required in conducting two separate surveys.
Apart from survey data, several SDG indicators require strength-ening of service data for effective report ing and advancement towards inclusion. This is true in general and relevant in terms of serving as a means of implementa-tion information for several SDGs. Similarly, for targets related with WASH means of implementation, significant capacity building and coordination effort is needed for local government departments and
rural development departments. Moreover, for SDGs indicators related to biodiversity, institu-tional coordination and strength-ening is critical.
In addition, data for several indicators may also be available with minor effort, but owing to the absence of information, it becomes impossible to compute a required SDG indicator. For instance, disaggregated data on foreign loans and grants by sector is not published by the EAD, thus minor effort is required to use institu-tional data to compute a required indicator of SDGs.
SUSTAINABLE DEVELOPMENT GOALS (SDGs)
PAKISTAN'S PERSPECTIVEDATA
REPORTING GAP

20
Quality data generation is essential for evidence based policy and planning. However, social and economic sectors, and infrastruc-ture planning is often not guided b y d e p r i v a t i o n , n e e d a n d susta inabi l i ty, and ins tead, provisioning is often driven by ad hoc response and/or political motivation. This approach often makes the public-sector planning and implementation, reactive, and not responsive or proactive. This impl ies tha t inc lus ion and sustainability are not the major drivers of our planning process.
While political interests cannot be undermined, however, results based inclusive planning has never been given a chance to highlight its attractiveness. For instance, the disconnect between different tiers of the health system and WASH illustrates the broken upstream and downstream links falling in the health value chain, and thus makes policies and plans which will innately generate sub optimal returns to public investments.
Same can be said about links between agriculture output and natural resources, soil quality etc. which translate into unsustainable urban sprawls and resulting poverty. Thus, it fails to incorpo-rate the effects of poverty based crimes on peace, which feed negatively into the economic
potential of urban centres. There are ample anecdotes of regular purchases and stocking of drugs and supplies in basic health units without relating the size of these supplies according to the nature a n d q u a n t u m o f d i s e a s e s . Similarly, in basic health units, often doctors are considered an integral part of needed human resource, wherein, paramedics, technicians would suffice to provide the needed services in satisfactory way. This, in essence means, that the system fails to establish a 'planning equilibrium' that renders it incapable to address the mismatch between supply and demand.
The major issue is the non-utility of data, as opposed to the dearth of data per say. Lack of capacity and a 'bureaucratic inertia' can be the contributing factors, nevertheless, major corrections may only come from political leadership.
SDG reporting is enterprise in nature, involving a range of departments. Some of these are responsible for initiating demand for information for resource allocation, while others are responsible for gathering data. Therefore, timely reporting of SDGs requires close coordination between these departments. The consumption of data hinges upon the timely collection, reporting
The Way Forward
Chapter 5
SUSTAINABLE DEVELOPMENT GOALS (SDGs)
PAKISTAN'S PERSPECTIVEDATA
REPORTING GAP
21
SUSTAINABLE DEVELOPMENT GOALS (SDGs)
PAKISTAN'S PERSPECTIVEDATA
REPORTING GAP
and dissemination of this data.
In the context of SDGs, each data reporting agency is expected to adhere to a standard guideline so as to avoid inconsistency in the reporting of indicators. The actionable points of the guideline are:
a) Develop a strong coordination with the ministries/divisions involved in the reporting of SDGs;
b) Enhance coordination among key statistical organizations, both at the federal and provin-cial levels;
c) Strengthen the technical c a p a c i t y o f m i n i s-tries/divisions and reporting agencies through trainings;
d) Improve quality of data by ensuring complete harmony in the technical aspects of SDGs;
e) Develop a timeline for the dissemination of the data between 2015-2030;
f) Allocate reasonable and continuous resources for SDG indicators that were not previously collected, com-puted and published;
g) Increase coverage through inclusive reporting;
h) M i n i m i z e d u p l i c a t i o n - including reporting of same indicator, surveys etc, and utilize idle resources for other
data collection; and,
I) L a u n c h o f n e w s u r v e y instruments (such as cause of death or mortality survey).
5.1 Use of Technology for Data Collection
Although the past bears witness to the collection of socio-economic data for informed decis ion making, yet, data from telecom-munication and social media has yet to play its due role in supple-menting the available information. In this context, following are a few areas that offer guidelines to maximize the use of ICT:
Ÿ Using real time data will enable easier monitor ing of the security situation;
Ÿ Tracking cell phone data can help estimate the size of population in a particular region. Estimates can be compared with the available census at the disaggregated level in order to compute results;
Ÿ Increasing the social sector's service delivery, especially in case of using outreach for increasing access, for example, use of a 'doctor hotline' or building an app for determining
diagnosis;
Ÿ Monitoring financial flows by mobile money to keep track of financial inclusion and saving possibilities;
Ÿ Development of a mobile app to monitor traffic flow at different times;
Ÿ Use of specialized sensors for environment monitoring;
Ÿ Employing spatial data to assess the extent of urban sprawls, slums and using this informat ion for crea t ing innovat ive so lu t ions for sustainable cities and commu-nities;
Ÿ Employing spatial mapping for solid waste management and identifying ways of sustainable management of waste in urban areas;
Ÿ Integrating spatial and big data for monitoring and evaluation of inclusive development initiatives; and,
Ÿ Increasing the role of the private sector and the citizens in the implementation of SDGs through ICT.

22
Nu
mb
er o
f In
dic
ator
s b
y L
evel
of
Eff
ort
Req
uir
ed f
or A
vail
abil
ity
TO
TA
L
Per
cen
t
Goa
l
Ann
exur
e1T
able
1 :
Dat
a G
ap A
nal
ysis
for
Su
stai
nab
le D
evel
opm
ent
Goa
ls I
nd
icat
or S
um
mar
y b
y G
oal
23 11.5
2 0 0 0 3 0 1 0 0 2 2 4 6 2 2 2 178 43 21.5
14 14 27 11 14 11 6 17 12 11 15 13 7 10 14 23 25
Tot
al
244 -
49.7
5
50 57.1
55.6
81.8
81.8
27.3
60 82.4
75 22.2
38.5 0 100 0
16.7
33.3
87.5
Per
cen
tage
0 0 0 0 0 0 0 1 0 0 0 0 0 0 0 0 23d2a
2b2c
2d3a
3b3c
1 4 2 4 2 0 0 3 5 2 0 0 0 0 0 0 0 1
0 4 7 4 5 1 0 5 5 2 3 0 1 0 1 4 4
0 0 0 0 2 0 0 0 0 0 1 0 0 0 0 1 0
2 2 4 3 2 2 0 3 2 0 1 0 0 0 1 2 0
0 2 8 1 2 8 1 1 1 4 7 2 0 5 8 10 0
4 2 3 0 0 0 0 1 0 3 0 3 0 1 1 0 1
2 0 0 0 0 0 0 1 2 0 0 4 0 2 0 1 0
0 2 1 1 0 0 1 0 0 0 1 0 0 0 1 3 0
46 23.0
4 2.0
24 12.0
60 30.0
19 9.5
12 6.0
10 5.0
3 1.5
SUSTAINABLE DEVELOPMENT GOALS (SDGs)
PAKISTAN'S PERSPECTIVEDATA
REPORTING GAP

Table 2 : Indicator Summary by Preferred Source
1
2
3
4
5
6
7
8
28
29
4
4
3
1
1
1
Survey Data
Number of Indicators
Total 69
Institutional Data
1
2
3
4
5
6
7
8
9
10
11
12
13
14
15
16
17
10
7
7
4
2
4
4
3
3
1
3
2
1
1
1
1
1
World Health Organization (1 indicator shared with PSLM)
Economic Affairs Division
Pakistan Economic Survey
Ministry of Finance
State Bank of Pakistan
Pakistan Telecommunication Authority
Provincial Disaster Management Authorities
Pakistan Bureau of Statistics
Project to Improve Financial Reporting & Auditing (PIFRA)
World Development Indicators
Provincial Forestry, Wildlife and Fisheries Departments
Demand for Grants (Pink Book) - Ministry of Finance
Academy of Education Planning and Monitoring
Annual Budget Statement
Compendium of Environmental Statistics
Dictrict Coordination Officers (DCOs)
Education Management Information System (EMIS)
Source Name
Pakistan Standard of Living Measurement (PSLM)
Multiple Indicator Cluster Survey (MICS)
Pakistan Demographic and Health Survey (PDHS)
Labor Force Survey (LFS)
Agriculture Census
Agriculture Statistics
Census for Manufacturing Industries
Household Income and Expenditure Survey (HIES) (2 indicators shared with PSLM)
23
SUSTAINABLE DEVELOPMENT GOALS (SDGs)
PAKISTAN'S PERSPECTIVEDATA
REPORTING GAP

Total 70
18
19
20
21
22
23
24
25
26
27
28
29
30
31
32
33
34
35
1
1
1
1
1
1
1
1
1
1
1
1
1
1
1
1
1
1
Provincial Finance Departments (shared with Ministry of Finance)
Worker's Welfare Fund, Provincial Social Security Agencies (shared with NSER/BISP)
Others
TBD after Consultation
Not Applicable
61
44
Total 244
Pakistan Environment Protection Agency
Energy Yearbook
Food and Agriculture Organization
Federal Board of Revenue (Customs Department)
Ministry of National Health Services, Regulation and Coordination
Ministry of Overseas Pakistanis and Human Resource Development
National Disaster Management Authority
National Accounts
National/Provincial Assembly of Pakistan
Pakistan Medical and Dental Council
Provincial Bureaus of Statistics
Provincial Health Departments
Provincial Women Development Departments
S & GAD and Establishment Division
Securities and Exchange Commission of Pakistan
SUPARCO
24
SUSTAINABLE DEVELOPMENT GOALS (SDGs)
PAKISTAN'S PERSPECTIVEDATA
REPORTING GAP

25
Table 3 : Indicator Summary by Reporting Agency
Name of Reporting Agency/ Department Number of Indicators
1
2
3
4
5
6
7
8
9
10
11
12
13
14
15
16
17
18
19
20
21
22
23
24
25
26
27
28
Cabinet Secretariat
Economic Affairs Division
Federal Board of Revenue
Hydrocarbon Development Institute of Pakistan
Malaria Control Program
Ministry of Climate Change
Ministry of Finance
Ministry of Human Rights
Ministry of Interior
Ministry of Law and Parliamentary Affairs
Ministry of National Food Security and Research
Ministry of National Health Services, Regulations and Coordination
Ministry of Overseas Pakistanis and Human Resource Development
Ministry of Planning, Development and Reform
Ministry of Railways
Ministry of Science and Technology
National AIDS Control Program
National Institute of Population Studies
National TB Control Program
Pakistan Bureau of Statistics
Pakistan Telecommunication Authority
Pakistan Tourism Development Corporation
Provincial Bureaus of Statistics
Provincial Disaster Management Authorities
Provincial Education Departments
Pakistan Environment Protection Agency
National Transport Research Center (shared with Ministry of Railways)
2
1
9
1
1
1
6
16
2
9
1
9
14
1
4
1
1
1
9
1
1
48
4
1
7
6
3
4
Academy of Education Planning and Monitoring (one indicator shared with PBS)
SUSTAINABLE DEVELOPMENT GOALS (SDGs)
PAKISTAN'S PERSPECTIVEDATA
REPORTING GAP
26
Total 244
Provincial Forestry, Wildlife and Fisheries Departments
Provincial Livestock and Fisheries Departments
Securities and Exchange Commission of Pakistan
State Bank of Pakistan
TBD after Consultation
Not Applicable/Relevant
1
3
1
1
1
7
1
26
44
29
30
31
32
33
34
35
36
37
World Bank ](shared with Ministry of Planning, Development and Reform)
Provincial Transport Departments (shared with Ministry of Railways)
Provincial Finance Departments (shared with Ministry of Finance)
SUSTAINABLE DEVELOPMENT GOALS (SDGs)
PAKISTAN'S PERSPECTIVEDATA
REPORTING GAP

27
Table 4 : Indicators Summary by Lead Ministry
Name of Lead Ministry Number of Indicators
1
2
3
4
5
6
7
8
9
10
11
12
13
14
15
16
17
18
19
20
Not Applicable/Relevant
Ministry of Finance
Ministry of National Health Services, Regulations and Coordination
Ministry of Climate Change
TBD after Consultation
Ministry of Planning, Development and Reform
Ministry of Federal Education and Professional Training
Ministry of Overseas Pakistanis and Human Resource Development
Ministry of Interior
Ministry of National Food Security and Research
Ministry of Industries and Production
Ministry of Human Rights
Ministry of Information, Technology and Telecommunication
Ministry of Science and Technology
Ministry of Water and Power
Pakistan Tourism Development Corporation
Ministry of Housing and Works
Ministry of Law and Parliamentary Affairs
Ministry of Petroleum and Natural Resources
Ministry of Railways
44
38
38
23
23
13
12
12
11
8
5
4
3
2
2
2
1
1
1
1
Total 244
SUSTAINABLE DEVELOPMENT GOALS (SDGs)
PAKISTAN'S PERSPECTIVEDATA
REPORTING GAP
28
Tab
le 5
: D
etai
led
Dat
a G
ap A
nal
ysis
for
all
Su
stai
nab
le D
evel
opm
ent
Goa
ls
Goa
lIn
dic
ator
Ind
icat
or
Ava
ilab
ilit
y C
ode*
Dis
aggr
egat
ion
A
vail
able
Pre
ferr
ed S
ourc
eA
lter
nat
e S
ourc
e(s)
Lea
d M
inis
try
Rep
orti
ng
Age
ncy
1.1.
1
1.2.
1
1.2.
2
1.3.
1
1.4.
1
1.4.
2
1.5.
1
1.5.
2
1.5.
3
1.5.
4
1.a.
1
1.a.
2
1.a.
3
1.b
.1
1 1 1 3b 3b 2c 1 8 8 2c 3a 3a 3a 3a
Non
e
Pro
vinc
e, R
egio
n
Pro
vinc
e, D
istr
ict,
R
egio
n
Pro
vinc
e, D
istr
ict,
R
egio
n
Pro
vinc
e, D
istr
ict,
R
egio
n
Pro
vinc
e, D
istr
ict,
R
egio
n
Geo
grap
hic
loca
tion
, H
azar
d, G
ende
r
N/A
N/A
N/A
WD
I
HIE
S
PS
LM
MIC
S
PS
LM
PS
LM
ND
MA
N/A
N/A
DC
Os
Min
istr
y of
Fin
ance
Min
istr
y of
Fin
ance
Min
istr
y of
Fin
ance
Min
istr
y of
Fin
ance
MIC
S
BIS
P, W
orke
rs
Wel
fare
Fun
d,
Pro
vinc
ial
Soc
ial
Sec
urit
y A
genc
ies
MIC
S
Pro
vinc
ial
Boa
rds
of R
even
ue
N/A
N/A
Min
istr
y of
Pla
nnin
g,
Dev
elop
men
t an
d R
efor
m
Min
istr
y of
Pla
nnin
g,
Dev
elop
men
t an
d R
efor
m
Min
istr
y of
Pla
nnin
g,
Dev
elop
men
t an
d R
efor
m
Min
istr
y of
Pla
nnin
g,
Dev
elop
men
t an
d R
efor
m
Min
istr
y of
Pla
nnin
g,
Dev
elop
men
t an
d R
efor
m
Min
istr
y of
Fin
ance
Min
istr
y of
Cim
ate
Cha
nge
(Nat
iona
l D
isas
ter
Man
agem
ent A
utho
rity
)
N/A
N/A
Min
istr
y of
Cim
ate
Cha
nge
(Nat
iona
l D
isas
ter
Man
agem
ent A
utho
rity
)
Min
istr
y of
Fin
ance
Min
istr
y of
Fin
ance
Min
istr
y of
Fin
ance
Min
istr
y of
Fin
ance
Min
istr
y of
Pla
nnin
g,
Dev
elop
men
t an
d R
efor
m/
W
orld
Ban
k
Min
istr
y of
Pla
nnin
g,
Dev
elop
men
t an
d R
efor
m
Min
istr
y of
Pla
nnin
g,
Dev
elop
men
t an
d R
efor
m
Min
istr
y of
Pla
nnin
g,
Dev
elop
men
t an
d R
efor
m
Pak
ista
n B
urea
u of
Sta
tist
ics
Pak
ista
n B
urea
u of
Sta
tist
ics
Pro
vinc
ial
Dis
aste
r M
anag
emen
t Aut
hori
ties
N/A
N/A
Pro
vinc
ial
Dis
aste
r M
anag
emen
t Aut
hori
ties
Min
istr
y of
Fin
ance
Min
istr
y of
Fin
ance
Min
istr
y of
Fin
ance
Min
istr
y of
Fin
ance
SUSTAINABLE DEVELOPMENT GOALS (SDGs)
PAKISTAN'S PERSPECTIVEDATA
REPORTING GAP

29
Goa
lIn
dic
ator
Ind
icat
or
Ava
ilab
ilit
y C
ode*
Dis
aggr
egat
ion
A
vail
able
Pre
ferr
ed S
ourc
eA
lter
nat
e S
ourc
e(s)
Lea
d M
inis
try
Rep
orti
ng
Age
ncy
2.1.
1
2.1.
2
2.2.
1
2.2.
2
2.3.
1
2.3.
2
2.4.
1
2.5.
1
2.5.
2
2.a.
1
2.a.
2
2.b
.1
2.b
.2
2.c.
1
1 2d 1 3a 2a 3c 2c 3c 2d 2a 2a 2c 3a 2a
Pro
vinc
e, R
egio
ns
Pro
vinc
e, R
egio
ns
Pro
vinc
es
Pro
vinc
es
Pro
vinc
es
Pro
vinc
es
Pro
vinc
es
MIC
S
PS
LM
MIC
S
MIC
S
Agr
icul
ture
Cen
sus
PS
LM
/HII
CS
PS
LM
/HII
CS
TB
D
TB
D
Dem
and
for
Gra
nts
Boo
k of
M
inis
try
of F
inan
ce
EA
D
PIF
RA
SB
P
PB
S
Min
istr
y of
Nat
iona
l H
ealt
h S
ervi
ces,
Reg
ulat
ions
an
d C
oord
inat
ion
Min
istr
y of
Nat
iona
l F
ood
Sec
urit
y an
d R
esea
rch
Min
istr
y of
Nat
iona
l H
ealt
h S
ervi
ces,
Reg
ulat
ions
an
d C
oord
inat
ion
Min
istr
y of
Nat
iona
l H
ealt
h S
ervi
ces,
Reg
ulat
ions
an
d C
oord
inat
ion
Min
istr
y of
Nat
iona
l F
ood
Sec
urit
y an
d R
esea
rch
Min
istr
y of
Nat
iona
l F
ood
Sec
urit
y an
d R
esea
rch
Min
istr
y of
Nat
iona
l F
ood
Sec
urit
y an
d R
esea
rch
Min
istr
y of
Nat
iona
l F
ood
Sec
urit
y an
d R
esea
rch
Min
istr
y of
Nat
iona
l F
ood
Sec
urit
y an
d R
esea
rch
Min
istr
y of
Fin
ance
Min
istr
y of
Fin
ance
Min
istr
y of
Fin
ance
Min
istr
y of
Fin
ance
Min
istr
y of
Pla
nnin
g,
Dev
elop
men
t an
d R
efor
m
Min
istr
y of
Nat
iona
l H
ealt
h S
ervi
ces,
Reg
ulat
ions
an
d C
oord
inat
ion
Min
istr
y of
Nat
iona
l F
ood
Sec
urit
y an
d R
esea
rch
Sta
te B
ank
of P
akis
tan
Pak
ista
n B
urea
u of
Sta
tist
ics
Pro
vinc
es
NN
S, P
DH
S
MIC
S, N
NS
PD
HS
, NN
S
PD
HS
, NN
S
PS
LM
Agr
icul
ture
Cen
sus
PIF
RA
Min
istr
y of
C
omm
erce
and
T
rade
Min
istr
y of
Nat
iona
l H
ealt
h S
ervi
ces,
Reg
ulat
ions
an
d C
oord
inat
ion
Min
istr
y of
Nat
iona
l H
ealt
h S
ervi
ces,
Reg
ulat
ions
an
d C
oord
inat
ion
Min
istr
y of
Nat
iona
l F
ood
Sec
urit
y an
d R
esea
rch
Min
istr
y of
Nat
iona
l F
ood
Sec
urit
y an
d R
esea
rch
Min
istr
y of
Nat
iona
l F
ood
Sec
urit
y an
d R
esea
rch
Min
istr
y of
Nat
iona
l F
ood
Sec
urit
y an
d R
esea
rch
Min
istr
y of
Nat
iona
l F
ood
Sec
urit
y an
d R
esea
rch
Min
istr
y of
Nat
iona
l F
ood
Sec
urit
y an
d R
esea
rch
Min
istr
y of
Nat
iona
l F
ood
Sec
urit
y an
d R
esea
rch
Min
istr
y of
Nat
iona
l F
ood
Sec
urit
y an
d R
esea
rch
SUSTAINABLE DEVELOPMENT GOALS (SDGs)
PAKISTAN'S PERSPECTIVEDATA
REPORTING GAP

30
Con
tinu
ed...
Goa
lIn
dic
ator
Ind
icat
or
Ava
ilab
ilit
y C
ode*
Dis
aggr
egat
ion
A
vail
able
Pre
ferr
ed S
ourc
eA
lter
nat
e S
ourc
e(s)
Lea
d M
inis
try
Rep
orti
ng
Age
ncy
3.1.
1
3.1.
2
3.2.
1
3.2.
2
3.3.
1
3.3.
2
3.3.
3
3.3.
4
3.3.
5
3.4.
1
3.4.
2
3.5.
1
2a 1 1 1 2d 2a 2a 2a 2d 2d 2c 2d
Pro
vinc
ial
Pro
vinc
ial,
Dis
tric
t
Pro
vinc
ial,
Dis
tric
t
Pro
vinc
ial,
Dis
tric
t
Pro
vinc
ial,
Dis
tric
t
Pro
vinc
ial,
Dis
tric
t
Nat
iona
l, P
rovi
ncia
l
N/A
N/A
MIC
S
PS
LM
MIC
S
MIC
S
TB
D
MIC
S
PS
LM
MIC
S
TB
D
TB
D
TB
D
TB
D
Min
istr
y of
Nat
iona
l H
ealt
h S
ervi
ces,
Reg
ulat
ions
an
d C
oord
inat
ion
Nat
iona
l In
stit
ute
of
Pop
ulat
ion
Stu
dies
Pak
ista
n B
urea
u of
Sta
tist
ics
Pro
vinc
ial
Bur
eau
of S
tati
stic
s
Pro
vinc
ial
Bur
eau
of S
tati
stic
s
Nat
iona
l AID
s C
ontr
ol P
rogr
am
Nat
iona
l T
B C
ontr
ol P
rogr
am
Mal
aria
Con
trol
Pro
gram
Pak
ista
n B
urea
u of
Sta
tist
ics
PD
HS
MIC
S/
PD
HS
PS
LM
, PD
HS
PD
HS
PD
HS
MIC
S
N/A
N/A
N/A
Min
istr
y of
Nat
iona
l H
ealt
h S
ervi
ces,
Reg
ulat
ions
an
d C
oord
inat
ion
Min
istr
y of
Nat
iona
l H
ealt
h S
ervi
ces,
Reg
ulat
ions
an
d C
oord
inat
ion
Min
istr
y of
Nat
iona
l H
ealt
h S
ervi
ces,
Reg
ulat
ions
an
d C
oord
inat
ion
Min
istr
y of
Nat
iona
l H
ealt
h S
ervi
ces,
Reg
ulat
ions
an
d C
oord
inat
ion
Min
istr
y of
Nat
iona
l H
ealt
h S
ervi
ces,
Reg
ulat
ions
an
d C
oord
inat
ion
Min
istr
y of
Nat
iona
l H
ealt
h S
ervi
ces,
Reg
ulat
ions
an
d C
oord
inat
ion
Min
istr
y of
Nat
iona
l H
ealt
h S
ervi
ces,
Reg
ulat
ions
an
d C
oord
inat
ion
Min
istr
y of
Nat
iona
l H
ealt
h S
ervi
ces,
Reg
ulat
ions
an
d C
oord
inat
ion
Min
istr
y of
Nat
iona
l H
ealt
h S
ervi
ces,
Reg
ulat
ions
an
d C
oord
inat
ion
Min
istr
y of
Nat
iona
l H
ealt
h S
ervi
ces,
Reg
ulat
ions
an
d C
oord
inat
ion
Min
istr
y of
Nat
iona
l H
ealt
h S
ervi
ces,
Reg
ulat
ions
an
d C
oord
inat
ion
Min
istr
y of
Nat
iona
l H
ealt
h S
ervi
ces,
Reg
ulat
ions
an
d C
oord
inat
ion
Min
istr
y of
Nat
iona
l H
ealt
h S
ervi
ces,
Reg
ulat
ions
an
d C
oord
inat
ion
Min
istr
y of
Nat
iona
l H
ealt
h S
ervi
ces,
Reg
ulat
ions
an
d C
oord
inat
ion
Min
istr
y of
Nat
iona
l H
ealt
h S
ervi
ces,
Reg
ulat
ions
an
d C
oord
inat
ion
SUSTAINABLE DEVELOPMENT GOALS (SDGs)
PAKISTAN'S PERSPECTIVEDATA
REPORTING GAP

31
Min
istr
y of
Int
erio
rP
rovi
ncia
l B
urea
u of
Sta
tist
ics
Nat
iona
l In
stit
ute
of
Pop
ulat
ion
Stu
dies
Pak
ista
n B
urea
u of
Sta
tist
ics
Pak
ista
n B
urea
u of
Sta
tist
ics
Pak
ista
n B
urea
u of
Sta
tist
ics
Nat
iona
l In
stit
ute
of
Pop
ulat
ion
Stu
dies
TB
D a
fter
Con
sult
atio
n
Min
istr
y of
Nat
iona
l H
ealt
h S
ervi
ces,
Reg
ulat
ions
an
d C
oord
inat
ion
Min
istr
y of
Nat
iona
l H
ealt
h S
ervi
ces,
Reg
ulat
ions
an
d C
oord
inat
ion
Min
istr
y of
Nat
iona
l H
ealt
h S
ervi
ces,
Reg
ulat
ions
an
d C
oord
inat
ion
Min
istr
y of
Nat
iona
l H
ealt
h S
ervi
ces,
Reg
ulat
ions
an
d C
oord
inat
ion
Min
istr
y of
Nat
iona
l H
ealt
h S
ervi
ces,
Reg
ulat
ions
an
d C
oord
inat
ion
Min
istr
y of
Nat
iona
l H
ealt
h S
ervi
ces,
Reg
ulat
ions
an
d C
oord
inat
ion
Min
istr
y of
Nat
iona
l H
ealt
h S
ervi
ces,
Reg
ulat
ions
an
d C
oord
inat
ion
Min
istr
y of
Nat
iona
l H
ealt
h S
ervi
ces,
Reg
ulat
ions
an
d C
oord
inat
ion
Min
istr
y of
Nat
iona
l H
ealt
h S
ervi
ces,
Reg
ulat
ions
an
d C
oord
inat
ion
Min
istr
y of
Nat
iona
l H
ealt
h S
ervi
ces,
Reg
ulat
ions
an
d C
oord
inat
ion
Min
istr
y of
Nat
iona
l H
ealt
h S
ervi
ces,
Reg
ulat
ions
an
d C
oord
inat
ion
Min
istr
y of
Nat
iona
l H
ealt
h S
ervi
ces,
Reg
ulat
ions
an
d C
oord
inat
ion
Min
istr
y of
Nat
iona
l H
ealt
h S
ervi
ces,
Reg
ulat
ions
an
d C
oord
inat
ion
Min
istr
y of
Nat
iona
l H
ealt
h S
ervi
ces,
Reg
ulat
ions
an
d C
oord
inat
ion
N/A
Pro
vinc
ial,
Dis
tric
t
Pro
vinc
ial,
Dis
tric
t
Pro
vinc
ial,
Dis
tric
t
Pro
vinc
ial
MIC
S
Pro
vinc
ial
BO
S
MIC
S
MIC
S
PS
LM
, WH
O
MIC
S
WH
O
WH
O
WH
O
MIC
S
TB
D
N/A
PD
HS
DH
ISD
HIS
DH
ISF
inan
ce D
eptt
3.5.
2
3.6.
1
3.7.
1
3.7.
2
3.8.
1
3.8.
2
3.9.
1
3.9.
2
3.9.
3
3.a.
1
3.b
.1
2d 2c 2a 2a 2d 2d 3a 3a 3a 1 2d
Min
istr
y of
Nat
iona
lH
ealt
h S
ervi
ces
and
Reg
ulat
ions
Min
istr
y of
Fin
ance
Min
istr
y of
Fin
ance
Min
istr
y of
Nat
iona
l H
ealt
h S
ervi
ces,
Reg
ulat
ions
an
d C
oord
inat
ion
Min
istr
y of
Nat
iona
l H
ealt
h S
ervi
ces,
Reg
ulat
ions
an
d C
oord
inat
ion
Min
istr
y of
Nat
iona
l H
ealt
h S
ervi
ces,
Reg
ulat
ions
an
d C
oord
inat
ion
Min
istr
y of
Nat
iona
l H
ealt
h S
ervi
ces,
Reg
ulat
ions
an
d C
oord
inat
ion
Min
istr
y of
Nat
iona
l H
ealt
h S
ervi
ces,
Reg
ulat
ions
an
d C
oord
inat
ion
Min
istr
y of
Nat
iona
l H
ealt
h S
ervi
ces,
Reg
ulat
ions
an
d C
oord
inat
ion
Pro
vinc
ial
EA
D
Pro
vinc
ial
Hea
lth
Dep
artm
ents
PM
DC
, Hel
ath
Dep
artm
ent
3.b
.2
3.b
.3
3.c.
1
3.d
.1
2a 3c 2c 2c
SUSTAINABLE DEVELOPMENT GOALS (SDGs)
PAKISTAN'S PERSPECTIVEDATA
REPORTING GAP

32
Goa
lIn
dic
ator
Ind
icat
or
Ava
ilab
ilit
y C
ode*
Dis
aggr
egat
ion
A
vail
able
Pre
ferr
ed S
ourc
eA
lter
nat
e S
ourc
e(s)
Lea
d M
inis
try
Rep
orti
ng
Age
ncy
4.1.
1
4.2.
1
4.2.
2
4.3.
1
4.4.
1
4.5.
1
4.6.
1
4.7.
1
4.a.
1
4.b
.1
4.c.
1
2d 1 3c 2a 2c 2a 1 2c 2a 2a 2c
Nat
iona
l, P
rovi
ncia
l
Pro
vinc
ial
Pro
vinc
ial,
Dis
tric
t
Pro
vinc
ial,
Dis
tric
t
Pro
vinc
ial,
Dis
tric
t
Pro
vinc
ial,
Dis
tric
t
Pro
vinc
ial,
Dis
tric
t
Pro
vinc
ial,
Dis
tric
t
MIC
S
MIC
S
MIC
S
PS
LM
MIC
S
MIC
S
PS
LM
TB
D
AE
PAM
EA
D
EM
IS
Min
istr
y of
Fin
ance
(E
cono
mic
Aff
airs
Div
isio
n)
Min
istr
y of
Fed
eral
Edu
cati
on
and
Pro
fess
iona
l T
rain
ing
Min
istr
y of
Fed
eral
Edu
cati
on
and
Pro
fess
iona
l T
rain
ing
Min
istr
y of
Fed
eral
Edu
cati
on
and
Pro
fess
iona
l T
rain
ing
Min
istr
y of
Fed
eral
Edu
cati
on
and
Pro
fess
iona
l T
rain
ing
Min
istr
y of
Fed
eral
Edu
cati
on
and
Pro
fess
iona
l T
rain
ing
Min
istr
y of
Fed
eral
Edu
cati
on
and
Pro
fess
iona
l T
rain
ing
Min
istr
y of
Fed
eral
Edu
cati
on
and
Pro
fess
iona
l T
rain
ing
Min
istr
y of
Fed
eral
Edu
cati
on
and
Pro
fess
iona
l T
rain
ing
Min
istr
y of
Fed
eral
Edu
cati
on
and
Pro
fess
iona
l T
rain
ing
Min
istr
y of
Fed
eral
Edu
cati
on
and
Pro
fess
iona
l T
rain
ing
Aca
dem
y of
Edu
cati
on P
lann
ing
and
Mon
itor
ing
/ P
akis
tan
Bur
eau
of S
tati
stic
s
Pro
vinc
ial
Bur
eau
of S
tati
stic
s
Pro
vinc
ial
Bur
eau
of S
tati
stic
s
Pak
ista
n B
urea
u of
Sta
tist
ics
Pak
ista
n B
urea
u of
Sta
tist
ics
Pro
vinc
ial
Bur
eau
of S
tati
stic
s
Pak
ista
n B
urea
u of
Sta
tist
ics
Edu
cati
on D
epar
tmen
t
Edu
cati
on D
epar
tmen
t
Eco
nom
ic A
ffai
rs D
ivis
ion
Edu
cati
on D
epar
tmen
t
MIC
S
PS
LM
PS
LM
MIC
S
Edu
cati
on
Dep
artm
ent
SUSTAINABLE DEVELOPMENT GOALS (SDGs)
PAKISTAN'S PERSPECTIVEDATA
REPORTING GAP

33
Goa
lIn
dic
ator
Ind
icat
or
Ava
ilab
ilit
y C
ode*
Dis
aggr
egat
ion
A
vail
able
Pre
ferr
ed S
ourc
eA
lter
nat
e S
ourc
e(s)
Lea
d M
inis
try
Rep
orti
ng
Age
ncy
5.1.
1
5.2.
1
5.2.
2
5.3.
1
5.3.
2
5.4.
1
5.5.
1
5.5.
2
5.6.
1
5.6.
2
5.a.
1
5.a.
2
5.b
.1
5.c.
1
2d 2b 2b 2a 2a 2d 2a 2a 2a 8 2c 8 2c 8
Pro
vinc
e
Pro
vinc
ial
Pro
vinc
ial
Dis
tric
t
N/A
Pro
vinc
ial/
Dis
tric
t
Pro
vinc
ial/
Dis
tric
t
Pro
vinc
ial/
Dis
tric
t
N/A
Pro
vinc
e, D
istr
ict
N/A
Nat
iona
l/P
rovi
ncia
l
N/A
Pro
vinc
ial
Wom
en
Dev
elop
men
t D
epar
tmen
ts
PD
HS
PD
HS
PS
LM
MIC
S
TB
D
Nat
iona
l/P
rovi
ncia
l A
ssem
bly
of
Pak
ista
n
PS
LM
PS
LM
N/A
PS
LM
N/A
MIC
S
N/A
Min
istr
y of
Hum
an R
ight
s(N
CS
W)
Min
istr
y of
Nat
iona
l H
ealt
hS
ervi
ces,
Reg
ulat
ions
an
d C
oord
inat
ion
Min
istr
y of
Ove
rsea
s P
akis
tani
s an
d H
uman
R
esou
rce
Dev
elop
men
t
Min
istr
y of
Law
and
P
arli
amen
tary
Aff
airs
Min
istr
y of
Nat
iona
l H
ealt
h S
ervi
ces,
Reg
ulat
ions
an
d C
oord
inat
ion
N/A
Min
istr
y of
Fin
ance
N/A
Min
istr
y of
Inf
orm
atio
n,
Tec
hnol
ogy
and
Tel
ecom
mun
icat
ion
N/A
Pak
ista
n B
urea
u of
Sta
tist
ics
Nat
iona
l In
stit
ute
of
Pop
ulat
ion
Stu
dies
Nat
iona
l In
stit
ute
of
Pop
ulat
ion
Stu
dies
Pak
ista
n B
urea
u of
Sta
tist
ics
Pak
ista
n B
urea
u of
Sta
tist
ics
Pak
ista
n B
urea
u of
Sta
tist
ics
Min
istr
y of
Law
and
P
arli
amen
tary
Aff
airs
Pak
ista
n B
urea
u of
Sta
tist
ics
Pak
ista
n B
urea
u of
Sta
tist
ics
N/A
Pak
ista
n B
urea
u of
Sta
tist
ics
N/A
Pak
ista
n T
elec
omm
unic
atio
n A
utho
rity
N/A
MIC
S, P
DH
S
N/A
LF
S
MIC
S, P
DH
S
N/A
PD
HS
N/A
PS
LM
/ P
TA
N/A
Min
istr
y of
Nat
iona
l H
ealt
h S
ervi
ces,
Reg
ulat
ions
an
d C
oord
inat
ion
Min
istr
y of
Nat
iona
l H
ealt
hS
ervi
ces,
Reg
ulat
ions
an
d C
oord
inat
ion
Min
istr
y of
Nat
iona
l H
ealt
hS
ervi
ces,
Reg
ulat
ions
an
d C
oord
inat
ion
Min
istr
y of
Nat
iona
l H
ealt
hS
ervi
ces,
Reg
ulat
ions
an
d C
oord
inat
ion
SUSTAINABLE DEVELOPMENT GOALS (SDGs)
PAKISTAN'S PERSPECTIVEDATA
REPORTING GAP

34
Goa
lIn
dic
ator
Ind
icat
or
Ava
ilab
ilit
y C
ode*
Dis
aggr
egat
ion
A
vail
able
Pre
ferr
ed S
ourc
eA
lter
nat
e S
ourc
e(s)
Lea
d M
inis
try
Rep
orti
ng
Age
ncy
6.1.
1
6.2.
1
6.3.
1
6.3.
2
6.4.
1
6.4.
2
6.5.
1
6.5.
2
6.6.
1
6.a.
1
6.b
.1
2c 2a 2d 2d 2d 2d 2d 2d 2d 2c 2d
Dis
tric
t
Dis
tric
t
MIC
S
PS
LM
TB
D
TB
D
TB
D
TB
D
TB
D
TB
D
TB
D
TB
D
TB
D
Min
istr
y of
Pla
nnin
g,
Dev
elop
men
t an
d R
efor
m
Min
istr
y of
Nat
iona
l H
ealt
h S
ervi
ces,
Reg
ulat
ions
an
d C
oord
inat
ion
TB
D a
fter
Con
sult
atio
n
TB
D a
fter
Con
sult
atio
n
TB
D a
fter
Con
sult
atio
n
TB
D a
fter
Con
sult
atio
n
TB
D a
fter
Con
sult
atio
n
TB
D a
fter
Con
sult
atio
n
TB
D a
fter
Con
sult
atio
n
Min
istr
y of
Fin
ance
(E
cono
mic
Aff
airs
Div
isio
n)
TB
D a
fter
Con
sult
atio
n
Pro
vinc
ial
Bur
eau
of S
tati
stic
s
Pak
ista
n B
urea
u of
Sta
tist
ics
TB
D a
fter
Con
sult
atio
n
TB
D a
fter
Con
sult
atio
n
TB
D a
fter
Con
sult
atio
n
TB
D a
fter
Con
sult
atio
n
TB
D a
fter
Con
sult
atio
n
TB
D a
fter
Con
sult
atio
n
TB
D a
fter
Con
sult
atio
n
Eco
nom
ic A
ffai
rs D
ivis
ion
TB
D a
fter
Con
sult
atio
n
Goa
lIn
dic
ator
Ind
icat
or
Ava
ilab
ilit
y C
ode*
Dis
aggr
egat
ion
A
vail
able
Pre
ferr
ed S
ourc
eA
lter
nat
e S
ourc
e(s)
Lea
d M
inis
try
Rep
orti
ng
Age
ncy
5.1.
1
1 1 1 2d 8 3c
Pro
vicn
ial
/ D
istr
ict
Pro
vicn
ial
/ D
istr
ict
Nat
iona
l
Nat
iona
l
N/A
Min
istr
y of
Wat
er a
nd P
ower
Min
istr
y of
Wat
er a
nd P
ower
Min
istr
y of
Pet
role
um
and
Nat
ural
Res
ourc
e
TB
D a
fter
Con
sult
atio
n
N/A
TB
D a
fter
Con
sult
atio
n
Pak
ista
n B
urea
u of
Sta
tist
ics
Pak
ista
n B
urea
u of
Sta
tist
ics
Hyd
roca
rbon
Dev
elop
men
t In
stit
ute
of P
akis
tan
TB
D a
fter
Con
sult
atio
n
N/A
TB
D a
fter
Con
sult
atio
n
MIC
S
7.1.
1
7.1.
2
7.2.
1
7.3.
1
7.a.
1
7.b
.1
MIC
S
MIC
S
N/A
PS
LM
PS
LM
Ene
rgy
Yea
rboo
k
TB
D
N/A
TB
D
SUSTAINABLE DEVELOPMENT GOALS (SDGs)
PAKISTAN'S PERSPECTIVEDATA
REPORTING GAP

35
Goa
lIn
dic
ator
Ind
icat
or
Ava
ilab
ilit
y C
ode*
Dis
aggr
egat
ion
A
vail
able
Pre
ferr
ed S
ourc
eA
lter
nat
e S
ourc
e(s)
Lea
d M
inis
try
Rep
orti
ng
Age
ncy
8.1.
1
8.2.
1
8.3.
1
8.4.
1
8.4.
2
8.5.
1
8.5.
2
8.6.
1
8.7.
1
8.8.
1
8.8.
2
8.9.
1
8.9.
2
8.10
.1
3d 1 1 3a 2c 2a 1 2a 2a 2c 2d 3b 2c 1
Nat
iona
l
Nat
iona
l
Pro
vinc
ial
Nat
iona
l
Nat
iona
l
Pro
vinc
ial
Pro
vinc
ial
Pro
vinc
ial
Pro
vinc
ial
Pro
vinc
ial
Nat
iona
l/P
rovi
ncia
l
Nat
iona
l/P
rovi
ncia
l
Nat
iona
l/P
rovi
ncia
l
Nat
iona
l
Eco
nom
ic S
urve
y
Eco
nom
ic S
urve
y
PS
LM
TB
D
TB
D
LF
S
LF
S
PS
LM
MIC
S
LF
S
Nat
iona
l Acc
ount
s
LF
S
SB
P
MIC
S
EA
D
Pak
ista
n E
cono
mic
S
urve
y
Min
istr
y of
Fin
ance
Min
istr
y of
Fin
ance
Min
istr
y of
Cli
mat
e C
hang
e
Min
istr
y of
Cli
mat
e C
hang
e
Pak
ista
n T
ouri
sm
Dev
elop
men
t C
orpo
rati
on
Min
istr
y of
Ove
rsea
s P
akis
tani
s an
d H
uman
Res
ourc
e D
evel
opm
ent
Min
istr
y of
Fin
ance
Min
istr
y of
Fin
ance
Min
istr
y of
Fin
ance
(E
cono
mic
Aff
airs
Div
isio
n)
Min
istr
y of
Fin
ance
Pak
ista
n B
urea
u of
Sta
tist
ics
Pak
ista
n B
urea
u of
Sta
tist
ics
Pak
ista
n B
urea
u of
Sta
tist
ics
Pak
ista
n B
urea
u of
Sta
tist
ics
Pak
ista
n B
urea
u of
Sta
tist
ics
Sta
te B
ank
of P
akis
tan
Pak
ista
n B
urea
u of
Sta
tist
ics
Eco
nom
ic A
ffai
rs D
ivis
ion
Min
istr
y of
Fin
ance
SB
P A
nnua
l R
epor
t
SB
P A
nnua
l R
epor
t
LF
S
PS
LM
PS
LM
LF
S
PS
LM
SB
P8.
10.2
8.a.
1
8.b
.1
2a 2a 1
Nat
iona
l
Nat
iona
l
Pro
vinc
ial
Min
istr
y of
Ove
rsea
s P
akis
tani
s an
d H
uman
Res
ourc
e D
evel
opm
ent
Min
istr
y of
Ove
rsea
s P
akis
tani
s an
d H
uman
Res
ourc
e D
evel
opm
ent
Min
istr
y of
Ove
rsea
s P
akis
tani
s an
d H
uman
Res
ourc
e D
evel
opm
ent
Min
istr
y of
Ove
rsea
s P
akis
tani
s an
d H
uman
Res
ourc
e D
evel
opm
ent
Min
istr
y of
Ove
rsea
s P
akis
tani
s an
d H
uman
Res
ourc
e D
evel
opm
ent
Min
istr
y of
Ove
rsea
s P
akis
tani
s an
d H
uman
Res
ourc
e D
evel
opm
ent
Min
istr
y of
Ove
rsea
s P
akis
tani
s an
d H
uman
Res
ourc
e D
evel
opm
ent
Min
istr
y of
Ove
rsea
s P
akis
tani
s an
d H
uman
Res
ourc
e D
evel
opm
ent
Min
istr
y of
Fin
ance
Min
istr
y of
Fin
ance
Pak
ista
n B
urea
u of
Sta
tist
ics
TB
D a
fter
Con
sult
atio
n
TB
D a
fter
Con
sult
atio
n
Pak
ista
n B
urea
u of
Sta
tist
ics
Pak
ista
n B
urea
u of
Sta
tist
ics
Min
istr
y of
Ove
rsea
s P
akis
tan
and
Hum
an
Res
ourc
e D
evel
opm
ent
SUSTAINABLE DEVELOPMENT GOALS (SDGs)
PAKISTAN'S PERSPECTIVEDATA
REPORTING GAP

36
Goa
lIn
dic
ator
Ind
icat
or
Ava
ilab
ilit
y C
ode*
Dis
aggr
egat
ion
A
vail
able
Pre
ferr
ed S
ourc
eA
lter
nat
e S
ourc
e(s)
Lea
d M
inis
try
Rep
orti
ng
Age
ncy
9.1.
1
9.1.
2
9.2.
1
9.2.
2
9.3.
1
9.3.
2
9.4.
1
9.5.
1
3b 2d 1 2a 1 2c 2a 2a
9.5.
2
9.a.
1
9.b
.1
9.c.
1
3b 2a 2a 2c
Pro
vinc
ial/
dist
rict
Nat
iona
l, S
ecto
r
Pro
vinc
ial,
Dis
tric
t
Nat
iona
l
Nat
iona
l
Nat
iona
l
Nat
iona
l
Nat
iona
l, P
rovi
ncia
l
Nat
iona
l
Nat
iona
l, P
rovi
ncia
l
PS
LM
PB
S
Pak
ista
n E
cono
mic
S
urve
y
PS
LM
Pak
ista
n E
cono
mic
S
urve
y
CM
I
Com
pend
ium
of
Env
iorn
men
tal
Sta
tist
ics
Ann
ual
Bud
get
Sta
tem
ent
TB
D
EA
D
PB
S
PT
A
Min
istr
y of
Pla
nnin
g,
Dev
elop
men
t an
d R
efor
m
Min
istr
y of
Rai
lway
s
Min
istr
y of
Ind
ustr
ies
and
Pro
duct
ion
Min
istr
y of
Ind
ustr
ies
and
Pro
duct
ion
Min
istr
y of
Ind
ustr
ies
and
Pro
duct
ion
Min
istr
y of
Ind
ustr
ies
and
Pro
duct
ion
Min
istr
y of
Cli
mat
e C
hang
e
Min
istr
y of
Fin
ance
Min
istr
y of
Fed
eral
Edu
cati
on
and
Pro
fess
iona
l T
rain
ing
(Hig
her
Edu
cati
on C
omm
issi
on)
Min
istr
y of
Fin
ance
(E
cono
mic
Aff
airs
Div
isio
n)
Min
istr
y of
Ind
ustr
ies
and
Pro
duct
ion
Min
istr
y of
Sci
ence
an
d T
echn
olog
y
LF
S
UN
Dat
a
Pak
ista
n B
urea
u of
Sta
tist
ics
Min
istr
y of
Rai
lway
s, N
TR
C,
Pro
vinc
ial
Tra
nspo
rt
Dep
artm
ents
Pak
ista
n B
urea
u of
Sta
tist
ics
Pak
ista
n B
urea
u of
Sta
tist
ics
Pak
ista
n B
urea
u of
Sta
tist
ics
Pak
ista
n B
urea
u of
Sta
tist
ics
Pak
ista
n B
urea
u of
Sta
tist
ics
Min
istr
y of
Fin
ance
Pak
ista
n B
urea
u of
Sta
tist
ics
Eco
nom
ic A
ffai
rs D
ivis
ion
Pak
ista
n B
urea
u of
Sta
tist
ics
Pak
ista
n T
elec
omm
unic
atio
n A
utho
rity
SUSTAINABLE DEVELOPMENT GOALS (SDGs)
PAKISTAN'S PERSPECTIVEDATA
REPORTING GAP

37
Goa
lIn
dic
ator
Ind
icat
or
Ava
ilab
ilit
y C
ode*
Dis
aggr
egat
ion
A
vail
able
Pre
ferr
ed S
ourc
eA
lter
nat
e S
ourc
e(s)
Lea
d M
inis
try
Rep
orti
ng
Age
ncy
10.1
.1
10.2
.1
10.3
.1
10.4
.1
10.5
.1
10.6
.1
10.7
.1
10.7
.2
10.a
.1
10.b
.1
10.c
.1
2a 2d 2d 2a 3a 8 2d 8 3a 3a 2d
Pro
vinc
e
Pro
vinc
e, D
istr
ict
Dis
tric
t
Nat
iona
l
N/a
Nat
iona
l
N/a
Nat
iona
l
Pro
vinc
ial
Nat
iona
l
PS
LM
PS
LM
MIC
S
PS
LM
SB
P
N/A
TB
D
N/A
FB
R
(Cus
tom
s D
epar
tmen
t)
EA
D
TB
D
Min
istr
y of
Pla
nnin
g,
Dev
elop
men
t an
d R
efor
m
Min
istr
y of
Pla
nnin
g,
Dev
elop
men
t an
d R
efor
m
Min
istr
y of
Hum
an R
ight
s
Min
istr
y of
Ove
rsea
s P
akis
tani
s an
d H
uman
Res
ourc
e D
evel
opm
ent
Min
istr
y of
Fin
ance
N/A
TB
D a
fter
Con
sult
atio
n
N/A
Min
istr
y of
Fin
ance
Min
istr
y of
Fin
ance
Min
istr
y of
Fin
ance
Pak
ista
n B
urea
u of
Sta
tist
ics
Sta
te B
ank
of P
akis
tan
Pak
ista
n B
urea
u of
Sta
tist
ics
Pak
ista
n B
urea
u of
Sta
tist
ics
Sta
te B
ank
of P
akis
tan
N/A
TB
D a
fter
Con
sult
atio
n
N/A
Fed
eral
Boa
rd o
f R
even
ue
(Cus
tom
s D
epar
tmen
t)
Min
istr
y of
Fin
ance
Sta
te B
ank
of P
akis
tan
PS
C-B
ISP
LF
S
IMF
N/A
N/A
Min
istr
y of
C
omm
erce
(P
ITA
D a
nd T
DA
P)
SUSTAINABLE DEVELOPMENT GOALS (SDGs)
PAKISTAN'S PERSPECTIVEDATA
REPORTING GAP

38
Goa
lIn
dic
ator
Ind
icat
or
Ava
ilab
ilit
y C
ode*
Dis
aggr
egat
ion
A
vail
able
Pre
ferr
ed S
ourc
eA
lter
nat
e S
ourc
e(s)
Lea
d M
inis
try
Rep
orti
ng
Age
ncy
11.1
.1
11.2
.1
11.3
.1
11.3
.2
11.4
.1
11.5
.1
11.5
.2
11.6
.1
11.6
.2
11.7
.1
11.7
.2
11.a
.1
11.b
.1
11.b
.2
11.c
.1
2d 2a 2d 3c 2d 2a 2a 2d 2c 2d 2b 2d 2d 8 8
Nat
iona
l
Dis
tric
t
Dis
tric
t
Nat
iona
l
Pro
vinc
ial
Pro
vinc
ial
Pro
vinc
ial
Pro
vinc
ial
Pro
vinc
ial
Pro
vinc
ial
Nat
iona
l
Pro
vinc
e
N/A
N/A
TB
D
PS
LM
SU
PAR
CO
TB
D
Min
istr
y of
Fin
ance
, P
rovi
ncia
l F
inan
ce
Dep
artm
ents
PD
MA
PD
MA
TB
D
EPA
TB
D
PD
HS
TB
D
Pro
vinc
ial
Dis
aste
r M
anag
emen
t A
utho
riti
es
N/A
N/A
Min
istr
y of
Hou
sing
and
Wor
ks
Min
istr
y of
Pla
nnin
g,
Dev
elop
men
t an
d R
efor
m
Min
istr
y of
Cli
mat
e C
hang
e
TB
D a
fter
Con
sult
atio
n
Min
istr
y of
Fin
ance
Min
istr
y of
Cim
ate
Cha
nge
(Nat
iona
l D
isas
ter
Man
agem
ent A
utho
rity
)
Min
istr
y of
Cim
ate
Cha
nge
(Nat
iona
l D
isas
ter
Man
agem
ent A
utho
rity
)
Min
istr
y of
Cli
mat
e C
hang
e
Min
istr
y of
Cli
mat
e C
hang
e
TB
D a
fter
Con
sult
atio
n
Min
istr
y of
Nat
iona
l H
ealt
h S
ervi
ces,
Reg
ulat
ions
and
Coo
rdin
atio
n
TB
D a
fter
Con
sult
atio
n
Min
istr
y of
Cim
ate
Cha
nge
(Nat
iona
l D
isas
ter
Man
agem
ent A
utho
rity
)
N/A
N/A
Pak
ista
n B
urea
u of
Sta
tist
ics
Pak
ista
n B
urea
u of
Sta
tist
ics
Pak
ista
n B
urea
u of
Sta
tist
ics
TB
D a
fter
Con
sult
atio
n
Min
istr
y of
Fin
ance
, P
rovi
ncia
l F
inan
ce D
epar
tmen
ts
Pro
vinc
ial
Dis
aste
r M
anag
emen
t Aut
hori
ties
Pro
vinc
ial
Dis
aste
r M
anag
emen
t Aut
hori
ties
Min
istr
y of
Cli
mat
e C
hang
e
Env
iron
men
t P
rote
ctio
n A
genc
y
TB
D a
fter
Con
sult
atio
n
Nat
iona
l In
stit
ute
of
Pop
ulat
ion
Stu
dies
TB
D a
fter
Con
sult
atio
n
Pro
vinc
ial
Dis
aste
r M
anag
emen
t Aut
hori
ties
N/A
N/A
ND
MA
ND
MA
WH
O
DC
Os
N/A
N/A
SUSTAINABLE DEVELOPMENT GOALS (SDGs)
PAKISTAN'S PERSPECTIVEDATA
REPORTING GAP

39
Goa
lIn
dic
ator
Ind
icat
or
Ava
ilab
ilit
y C
ode*
Dis
aggr
egat
ion
A
vail
able
Pre
ferr
ed S
ourc
eA
lter
nat
e S
ourc
e(s)
Lea
d M
inis
try
Rep
orti
ng
Age
ncy
12.1
.1
12.2
.1
12.2
.2
12.3
.1
12.4
.1
12.4
.2
12.5
.1
12.6
.1
12.7
.1
12.8
.1
12.a
.1
12.b
.1
12.c
.1
8 2d 2d 8 3a 3b 3b 3a 8 3b 8 3b 3a
N/A
N/A
Nat
iona
l
Pro
vinc
ial
Nat
iona
l
N/A
N/A
Nat
iona
l
N/A
TB
D
TB
D
N/A
TB
D
TB
D
TB
D
SE
CP
N/A
TB
D
N/A
TB
D
Min
istr
y of
Fin
ance
N/A
Min
istr
y of
Cli
mat
e C
hang
e
Min
istr
y of
Cli
mat
e C
hang
e
N/A
Min
istr
y of
Cli
mat
e C
hang
e
Env
iron
men
t P
rote
ctio
n A
genc
y
Env
iron
men
t P
rote
ctio
n A
genc
y
Sec
urit
ies
and
Exc
hang
e C
omm
issi
on o
f P
akis
tan
N/A
Aca
dem
y of
Edu
cati
on
Pla
nnin
g an
d M
onit
orin
g
N/A
Pak
ista
n T
ouri
sm
Dev
elop
men
t C
orpo
rati
on
Min
istr
y of
Fin
ance
N/A
Min
istr
y of
Cli
mat
e C
hang
e
Min
istr
y of
Cli
mat
e C
hang
e
N/A
Min
istr
y of
Cli
mat
e C
hang
e
Min
istr
y of
Cli
mat
e C
hang
e
Min
istr
y of
Cli
mat
e C
hang
e
Min
istr
y of
Fin
ance
(S
ecur
itie
s an
d E
xcha
nge
C
omm
issi
on o
f P
akis
tan)
N/A
Min
istr
y of
Fed
eral
Edu
cati
on
and
Pro
fess
iona
l T
rain
ing
N/A
Pak
ista
n T
ouri
sm
Dev
elop
men
t C
orpo
rati
on
Min
istr
y of
Fin
ance
N/A
N/A
SE
CP
N/A
N/A
SUSTAINABLE DEVELOPMENT GOALS (SDGs)
PAKISTAN'S PERSPECTIVEDATA
REPORTING GAP

40
Goa
lIn
dic
ator
Ind
icat
or
Ava
ilab
ilit
y C
ode*
Dis
aggr
egat
ion
A
vail
able
Pre
ferr
ed S
ourc
eA
lter
nat
e S
ourc
e(s)
Lea
d M
inis
try
Rep
orti
ng
Age
ncy
13.1
.1
13.1
.2
13.2
.1
13.3
.1
13.3
.2
13.a
.1
13.b
.1
8 2a 8 8 8 8 8
N/A
Pro
vinc
ial
N/A
N/A
N/A
N/A
N/A
N/A
N/A
PD
MA
PD
MA
N/A
N/A
N/A
N/A
N/A
N/A
N/A
N/A
N/A
N/A
N/A
Min
istr
y of
Cim
ate
Cha
nge
(Nat
iona
l D
isas
ter
Man
agem
ent A
utho
rity
)
N/A
N/A
N/A
N/A
N/A
Pak
ista
n B
urea
u of
StN
/A
Pro
vinc
ial
Dis
aste
r M
anag
emen
t Aut
hori
ties
N/A
N/A
N/A
N/A
N/A
atis
tics
Goa
lIn
dic
ator
Ind
icat
or
Ava
ilab
ilit
y C
ode*
Dis
aggr
egat
ion
A
vail
able
Pre
ferr
ed S
ourc
eA
lter
nat
e S
ourc
e(s)
Lea
d M
inis
try
Rep
orti
ng
Age
ncy
14.1
.1
14.2
.1
14.3
.1
14.4
.1
14.5
.1
14.6
.1
14.7
.1
14.a
.1
14.b
.1
14.c
.1
2d 2d 3b 8 2d 2d 3b 3a 2d 8
N/A
Nat
iona
l
Nat
iona
l
Nat
iona
l
Nat
iona
l
Nat
iona
l
N/A
TB
D
TB
D
TB
D
N/A
TB
D
TB
D
TB
D
Min
istr
y of
Fin
ance
FAO
N/A
Min
istr
y of
Cli
mat
e C
hang
e
TB
D a
fter
Con
sult
atio
n
TB
D a
fter
Con
sult
atio
n
N/A
Min
istr
y of
Cli
mat
e C
hang
e
Min
istr
y of
Cli
mat
e C
hang
e
Min
istr
y of
Nat
iona
l F
ood
Sec
urit
y an
d R
esea
rch
Min
istr
y of
Fin
ance
TB
D a
fter
Con
sult
atio
n
N/A
N/A
HE
C
N/A
Env
iron
men
t P
rote
ctio
n A
genc
y
TB
D a
fter
Con
sult
atio
n
TB
D a
fter
Con
sult
atio
n
N/A
Min
istr
y of
Cli
mat
e C
hang
e
Min
istr
y of
Cli
mat
e C
hang
e
Liv
esto
ck a
nd F
ishe
ries
D
epar
tmen
t
Min
istr
y of
Fin
ance
TB
D a
fter
Con
sult
atio
n
N/A
SUSTAINABLE DEVELOPMENT GOALS (SDGs)
PAKISTAN'S PERSPECTIVEDATA
REPORTING GAP

41
Goa
lIn
dic
ator
Ind
icat
or
Ava
ilab
ilit
y C
ode*
Dis
aggr
egat
ion
A
vail
able
Pre
ferr
ed S
ourc
eA
lter
nat
e S
ourc
e(s)
Lea
d M
inis
try
Rep
orti
ng
Age
ncy
Pro
vinc
ial
Pro
vinc
ial
Pro
vinc
ial
Nat
iona
l
N/A
Pro
vinc
ial
N/A
Pro
vinc
ial
Pro
vinc
ial
Pro
vinc
ial
For
estr
y, W
ildl
ife
and
Fis
heri
es D
epar
tmen
t
Agr
icul
ture
Sta
tist
ics
TB
D
TB
D
TB
D
N/A
TB
D
N/A
TB
D
PIF
RA
PIF
RA
TB
D
Min
istr
y of
Cli
mat
e C
hang
e
Min
istr
y of
Cli
mat
e C
hang
e
Min
istr
y of
Cli
mat
e C
hang
e
Min
istr
y of
Nat
iona
l F
ood
Sec
urit
y an
d R
esea
rch
TB
D a
fter
Con
sult
atio
n
TB
D a
fter
Con
sult
atio
n
TB
D a
fter
Con
sult
atio
n
N/A
TB
D a
fter
Con
sult
atio
n
N/A
TB
D a
fter
Con
sult
atio
n
Min
istr
y of
Fin
ance
Min
istr
y of
Fin
ance
TB
D a
fter
Con
sult
atio
n
Pro
vinc
ial
For
estr
y,
Wil
dlif
e an
d F
ishe
ries
Dep
artm
ent
Pro
vinc
ial
For
estr
y,
Wil
dlif
e an
d F
ishe
ries
Dep
artm
ent
Pro
vinc
ial
For
estr
y,
Wil
dlif
e an
d F
ishe
ries
Dep
artm
ent
Pak
ista
n B
urea
u of
Sta
tist
ics
TB
D a
fter
Con
sult
atio
n
TB
D a
fter
Con
sult
atio
n
TB
D a
fter
Con
sult
atio
n
N/A
TB
D a
fter
Con
sult
atio
n
N/A
TB
D a
fter
Con
sult
atio
n
Eco
nom
ic A
ffai
rs D
ivis
ion
Eco
nom
ic A
ffai
rs D
ivis
ion
TB
D a
fter
Con
sult
atio
n
Agr
icul
ture
C
ensu
s
N/A
N/A
EA
D
EA
D
15.1
.1
15.1
.2
15.2
.1
15.3
.1
15.4
.1
15.4
.2
15.5
.1
15.6
.1
15.7
.1
15.8
.1
15.9
.1
15.a
.1
15.b
.1
15.c
.1
2a 2d 2d 2c 2d 2d 2d 8 2d 8 3c 3a 2d 2d
For
estr
y, W
ildl
ife
and
Fis
heri
es D
epar
tmen
t
For
estr
y, W
ildl
ife
and
Fis
heri
es D
epar
tmen
t
SUSTAINABLE DEVELOPMENT GOALS (SDGs)
PAKISTAN'S PERSPECTIVEDATA
REPORTING GAP

42
Goa
lIn
dic
ator
Ind
icat
or
Ava
ilab
ilit
y C
ode*
Dis
aggr
egat
ion
A
vail
able
Pre
ferr
ed S
ourc
eA
lter
nat
e S
ourc
e(s)
Lea
d M
inis
try
Rep
orti
ng
Age
ncy
Min
istr
y of
Int
erio
r
Min
istr
y of
Int
erio
r
Nat
iona
l In
stit
ute
of
Pop
ulat
ion
Stu
dies
Nat
iona
l In
stit
ute
of
Pop
ulat
ion
Stu
dies
Nat
iona
l In
stit
ute
of
Pop
ulat
ion
Stu
dies
Min
istr
y of
Int
erio
r
N/A
Min
istr
y of
Int
erio
r
Min
istr
y of
Int
erio
r
Sta
te B
ank
of P
akis
tan
Min
istr
y of
Int
erio
r
Min
istr
y of
Int
erio
r
Min
istr
y of
Int
erio
r
Min
istr
y of
Fin
ance
Pak
ista
n B
urea
u of
Sta
tist
ics
Cab
inet
Sec
reta
riat
Pak
ista
n B
urea
u of
Sta
tist
ics
N/A
Pak
ista
n B
urea
u of
Sta
tist
ics
Min
istr
y of
Int
erio
r
N/A
Min
istr
y of
Hum
an R
ight
s
Min
istr
y of
Hum
an R
ight
s
16.1
.1
16.1
.2
16.1
.3
16.1
.4
16.2
.1
16.2
.2
16.2
.3
16.3
.1
16.3
.2
16.4
.1
16.4
.2
16.5
.1
16.5
.2
16.6
.1
16.6
.2
16.7
.1
16.7
.2
16.8
.1
16.9
.1
16.1
0.1
16.1
0.2
16.a
.1
16.b
.1
2d 2d 2b 2a 3b 2d 2d 2c 2d 2a 3c 2d 3c 2a 2d 2a 3c 8 2c 2d 8 2d 2d
Pro
vinc
ial
Pro
vinc
ial
Pro
vinc
ial
Pro
vinc
ial
Pro
vinc
ial
N/A
Pro
vinc
ial
Pro
vinc
ial
Pro
vinc
ial
Pro
vinc
ial
Pro
vinc
ial
Dis
tric
t
N/A
Dis
tric
t
Pro
vinc
ial
N/A
TB
D
TB
D
PD
HS
MIC
S
MIC
S
TB
D
N/A
MIC
S
TB
D
SB
P
TB
D
TB
D
TB
D
Dem
and
for
Gra
nts
(Pin
k B
ook)
TB
D
S&
GA
D a
nd
Est
abli
shm
ent
Div
isio
n
PS
LM
N/A
PS
LM
TB
D
N/A
TB
D
TB
D
PD
HS
PD
HS
N/A
Min
istr
y of
Fin
ance
PIF
RA
N/A
MIC
S
N/A
Min
istr
y of
Int
erio
r
Min
istr
y of
Int
erio
r
Min
istr
y of
Nat
iona
l H
ealt
h S
ervi
ces,
Reg
ulat
ions
and
C
oord
inat
ion
Min
istr
y of
Nat
iona
l H
ealt
h S
ervi
ces,
Reg
ulat
ions
and
C
oord
inat
ion
Min
istr
y of
Nat
iona
l H
ealt
h S
ervi
ces,
Reg
ulat
ions
and
C
oord
inat
ion
Min
istr
y of
Int
erio
r
N/A
Min
istr
y of
Int
erio
r
Min
istr
y of
Int
erio
r
Min
istr
y of
Fin
ance
Min
istr
y of
Int
erio
r
Min
istr
y of
Int
erio
r
Min
istr
y of
Int
erio
r
Min
istr
y of
Fin
ance
Min
istr
y of
Pla
nnin
g,
Dev
elop
men
t an
d R
efor
m
Min
istr
y of
Ove
rsea
s P
akis
tani
s an
d H
uman
Res
ourc
e D
evel
opm
ent
Min
istr
y of
Pla
nnin
g,
Dev
elop
men
t an
d R
efor
m
N/A
Min
istr
y of
Int
erio
r
Min
istr
y of
Int
erio
r
N/A
Min
istr
y of
Hum
an R
ight
s
Min
istr
y of
Hum
an R
ight
s
SUSTAINABLE DEVELOPMENT GOALS (SDGs)
PAKISTAN'S PERSPECTIVEDATA
REPORTING GAP

43
Goa
lIn
dic
ator
Ind
icat
or
Ava
ilab
ilit
y C
ode*
Dis
aggr
egat
ion
A
vail
able
Pre
ferr
ed S
ourc
eA
lter
nat
e S
ourc
e(s)
Lea
d M
inis
try
Rep
orti
ng
Age
ncy
17.1
.1
17.1
.2
17.2
.1
17.3
.1
17.3
.2
17.4
.1
17.5
.1
17.6
.1
17.6
.2
17.7
.1
17.8
.1
17.9
.1
17.1
0.1
17.1
1.1
17.1
2.1
17.1
3.1
17.1
4.1
17.1
5.1
17.1
6.1
17.1
7.1
17.1
8.1
17.1
8.2
17.1
8.3
17.1
9.1
17.1
9.2
1 2a 8 2a 3d 3d 8 3a 2a 8 2a 8 8 8 8 8 8 8 8 8 8 8 8 8 8
Pro
vinc
ial
Pro
vinc
ial
N/A
Nat
iona
l
Nat
iona
l
Nat
iona
l
N/A
N/A
Nat
iona
l
N/A
Nat
iona
l
N/A
N/A
N/A
N/A
N/A
N/A
N/A
N/A
N/A
N/A
N/A
N/A
N/A
N/A
Pak
ista
n E
cono
mic
S
urve
y
Pak
ista
n E
cono
mic
S
urve
y
N/A
EA
D
EA
D
EA
D
N/A
EA
D
PT
A
N/A
MIC
S
N/A
N/A
N/A
N/A
N/A
N/A
N/A
N/A
N/A
N/A
N/A
N/A
N/A
N/A
FB
R
FB
R
N/A
PE
S
PE
S
PE
S
N/A
Min
istr
y of
Sci
ence
an
d T
echn
olog
y
N/A
PT
A
N/A
N/A
N/A
N/A
N/A
N/A
N/A
N/A
N/A
N/A
N/A
N/A
N/A
N/A
Min
istr
y of
Fin
ance
Min
istr
y of
Fin
ance
N/A
Min
istr
y of
Fin
ance
Min
istr
y of
Fin
ance
Min
istr
y of
Fin
ance
N/A
Min
istr
y of
Sci
ence
an
d T
echn
olog
y
Min
istr
y of
Inf
orm
atio
n,T
echn
olog
y an
d T
elec
omm
unic
atio
n
N/A
Min
istr
y of
Inf
orm
atio
n,
Tec
hnol
ogy
and
Tel
ecom
mun
icat
ion
N/A
N/A
N/A
N/A
N/A
N/A
N/A
N/A
N/A
N/A
N/A
N/A
N/A
N/A
Min
istr
y of
Fin
ance
Min
istr
y of
Fin
ance
N/A
Eco
nom
ic A
ffai
rs D
ivis
ion
Eco
nom
ic A
ffai
rs D
ivis
ion
Eco
nom
ic A
ffai
rs D
ivis
ion
N/A
Min
istr
y of
Sci
ence
and
T
echn
olog
y
Pak
ista
n T
elec
omm
unic
atio
n A
utho
rity
N/A
Pak
ista
n T
elec
omm
unic
atio
n A
utho
rity
N/A
N/A
N/A
N/A
N/A
N/A
N/A
N/A
N/A
N/A
N/A
N/A
N/A
N/A
SUSTAINABLE DEVELOPMENT GOALS (SDGs)
PAKISTAN'S PERSPECTIVEDATA
REPORTING GAP

Dat
a G
ap A
naly
sis
for S
usta
inab
le D
evel
opm
ent G
oals
Goa
lIn
dica
tor
Indi
cato
rAv
aila
bilit
yCo
de*
Stan
dard
avai
labl
e in
met
adat
a?
Tota
lLi
nkag
esD
eseg
rega
tion
Avai
labl
ePr
efer
red
Sour
ceAl
tern
ate
Sour
ce(s
)Le
ad M
inis
try
Repo
rtin
g Ag
ency
1 2
17.1
.1
17.1
.2
1 1
0 0
Paki
stan
Ec
onom
ic
Sur
vey
Paki
stan
Ec
onom
ic
Sur
vey
Pro
vinc
ial
Pro
vinc
ial
FBR
FBR
MoF
MoF
MoF
MoF
8 2 2 2 8 3 2 8 2 8 8 8 8 8 8 8 8 8 8 8 8 8 8
17.2
.1
17.3
.1
17.3
.2
17.4
.1
17.5
.1
17.6
.1
17.6
.2
17.7
.1
17.8
.1
17.9
.1
17.1
0.1
17.1
1.1
17.1
2.1
17.1
3.1
17.1
4.1
17.1
5.1
17.1
6.1
17.1
7.1
17.1
8.1
17.1
8.2
17.1
8.3
17.1
9.1
17.1
9.2
1 1 0 0 0 0 1 0 1 1 1 1 1 0 0 1 1 0 1 0 0 0 0
0 1 1 0 0 1 5 0 17 0 1 0 0 0 1 0 0 1 0 0 0 0 0
N/A
EAD
EAD
EAD
N/A
EAD
PTA
N/A
PTA
N/A
N/A
N/A
N/A
N/A
N/A
N/A
N/A
N/A
N/A
N/A
N/A
N/A
N/A
N/A
Nat
iona
l
Nat
iona
l
Nat
iona
l
N/A
N/A
Nat
iona
l
N/A
Nat
iona
l
N/A
N/A
N/A
N/A
N/A
N/A
N/A
N/A
N/A
N/A
N/A
N/A
N/A
N/A
N/A
PES
PES
PES
N/A
MoS
T
N/A
N/A
N/A
N/A
N/A
N/A
N/A
N/A
N/A
N/A
N/A
N/A
N/A
N/A
N/A
N/A
MoF
MoF
MoF
N/A
MoS
T
MoI
T
N/A
MoI
T
N/A
N/A
N/A
N/A
N/A
N/A
N/A
N/A
N/A
N/A
N/A
N/A
N/A
N/A
N/A
EAD
EAD
EAD
N/A
MoS
T
PTA
N/A
PTA
N/A
N/A
N/A
N/A
N/A
N/A
N/A
N/A
N/A
N/A
N/A
N/A
N/A
N/A
44
SUSTAINABLE DEVELOPMENT GOALS (SDGs)
PAKISTAN'S PERSPECTIVEDATA
REPORTING GAP

45
Tar
get
C
od
e In
dic
ato
r D
escr
ipti
on
V
alu
e
Un
it
Yea
r
Sou
rce
T1
.1
1.1
.1 P
ropo
rtio
n o
f po
pul
atio
n be
low
th
e in
tern
atio
nal
po
vert
y li
ne,
b
y se
x, a
ge, e
mp
loym
ent
stat
us
and
geo
grap
hic
al l
ocat
ion
(ur
ban
/ ru
ral)
6.0
7%
%
2
015
WD
I
T1
.2
1.2
.2 P
ropo
rtio
n o
f m
en, w
om
en a
nd
chil
dre
n o
f al
l ag
es l
ivin
g in
p
over
ty i
n a
ll i
ts d
imen
sio
ns a
ccor
din
g to
nat
ion
al d
efin
itio
ns
Ove
rall
= 4
3.1
%
2
014
-15
Pla
nni
ng
Co
mm
issi
on
/PS
LM
Ru
ral=
75.
5, U
rban
=10
.6
%
201
4-1
5 P
lan
nin
g C
om
mis
sio
n/P
SL
M
T1
.3
1.3
.1 P
rop
ort
ion
of p
opul
atio
n co
vere
d by
so
cial
pro
tect
ion
floo
rs/
syst
ems,
by
sex,
dis
ting
uis
hin
g ch
ildr
en, u
nem
plo
yed
pers
ons,
old
er
per
sons
, per
son
s w
ith
dis
abil
itie
s, p
regn
ant
wo
men
, new
bor
ns,
wor
k in
jury
vic
tim
s an
d t
he
poo
r an
d th
e vu
lner
able
29.
9%
%
2
014
-15
PR
SP
T1
.4
1.4
.1 P
ropo
rtio
n o
f po
pul
atio
n li
vin
g in
hou
seh
old
s w
ith
acce
ss t
o
bas
ic s
ervi
ces
Imp
rove
d w
ater
sou
rce=
86
.0,
Flu
sh T
oil
et=
67
, Ele
ctri
city
=
91.
0 (
Lig
hti
ng)
, G
as f
or
coo
kin
g=56
.0
%
201
4-1
5 P
SL
M
T1
.5
1.5
.1 N
umb
er o
f d
eath
s, m
issi
ng p
erso
ns a
nd p
erso
ns
affe
cted
by
dis
aste
r p
er 1
00,
000
peo
ple
T1
.5
F
lood
and
Rai
n, 2
88 p
eop
le
die
d in
201
2
Num
ber
201
3 M
ult
i H
azar
d C
onti
genc
y P
lan
2013
T1
.a
1.a
.1 P
rop
orti
on o
f re
sour
ces
allo
cate
d by
th
e go
vern
men
t d
irec
tly
to
pov
erty
red
ucti
on
pro
gram
mes
6
3.1
%
2
014
-15
PR
SP
, Min
istr
y of
Fin
anac
e, G
OP
T1
.a
1.a
.2 P
rop
orti
on o
f to
tal
gove
rnm
ent
spen
din
g on
ess
enti
al s
ervi
ces
(edu
cati
on,
hea
lth
and
soc
ial
pro
tect
ion
) 2
7.2
8 %
2
014
-15
PR
SP
, GO
P &
Bud
get
An
alys
is G
OS
T1
.b
1.b
.1 P
ropo
rtio
n o
f go
vern
men
t re
curr
ent
and
cap
ital
sp
end
ing
to
sect
ors
th
at d
ispr
opo
rtio
nat
ely
ben
efit
wo
men
, th
e p
oor
and
vu
lner
able
gro
ups
0.9
1 %
2
014
-15
PR
SP
, GO
P &
Bud
get
An
alys
is G
OS
T1
.b
6
3.0
8 %
2
014
-15
PR
SP
, GO
P &
Bud
get
An
alys
is G
OS
T2
.1
2.1
.1 P
reva
lenc
e of
und
ern
ouri
shm
ent
19.
9 %
2
016
G
lob
al H
unge
r In
dex
Rep
ort
201
7
T2
.2
2.2
.1 P
reva
lenc
e of
stu
ntin
g (h
eigh
t fo
r ag
e <
-2 s
tan
dar
d d
evia
tio
n fr
om
th
e m
edia
n o
f th
e W
orld
Hea
lth
Org
aniz
atio
n (
WH
O)
Ch
ild
G
row
th S
tan
dard
s) a
mon
g ch
ild
ren
un
der
5 y
ears
of
age
Mo
der
ate=
21.
8%
, S
ever
e=2
1.9
%
%
20
11
Nat
ion
al N
utri
tion
Su
rvey
Tab
le 6
: A
vail
able
Dat
aN
atio
nal
SUSTAINABLE DEVELOPMENT GOALS (SDGs)
PAKISTAN'S PERSPECTIVEDATA
REPORTING GAP

46
T2
.2
2.2
.2 P
reva
lenc
e of
mal
nu
trit
ion
(wei
ght
for
hei
ght
>+
2 o
r <
-2
stan
dar
d d
evia
tio
n f
rom
th
e m
edia
n of
th
e W
HO
Ch
ild
Gro
wth
S
tan
dard
s) a
mo
ng
chil
dre
n u
nder
5 y
ears
of
age,
by
type
(w
asti
ng
and
o
verw
eigh
t)
Stu
ntin
g= 4
3.7%
, W
asti
ng=
15.
1%,
Und
erw
eigh
t=31
.5%
%
201
1 N
atio
nal
Nut
riti
on S
urv
ey
3
.1.1
Mat
erna
l m
ort
alit
y ra
tio
T
-276
, U-1
75, R
-319
P
er 1
00,0
00
live
b
irth
2
006
-07
PD
HS
3
.1.2
Pro
port
ion
of
birt
hs
atte
nded
by
skil
led
heal
th p
erso
nnel
5
2.1
%
201
2-1
3 P
DH
S
3
.2.1
Und
er-f
ive
mor
tali
ty r
ate
89
%
201
3-1
3 P
DH
S
3
.2.2
Neo
nat
al m
ort
alit
y ra
te
55
Per
100
0 li
ve b
irth
2
012
-13
PD
HS
3.3
.2 T
ub
ercu
losi
s in
cid
ence
per
1,0
00 p
opul
atio
n
36
100
0 P
opu
lati
on
201
2-1
3 P
DH
S
T3
.3
3.3
.3 M
alar
ia i
nci
den
ce p
er 1
,000
pop
ula
tion
1
2.1
per
100
0 po
pula
tion
2
015
Mal
aria
Con
trol
Pro
gram
T3
.3
3.3
.4 H
epat
itis
B i
nci
den
ce p
er 1
00,0
00
pop
ulat
ion
2
.5
%
200
7-0
8 P
akis
tan
Med
ical
and
Res
earc
h C
ounc
il
T3
.7
3.7
.1 P
ropo
rtio
n o
f w
om
en o
f re
pro
duct
ive
age
(age
d 1
5-4
9 y
ears
) w
ho
hav
e th
eir
nee
d f
or
fam
ily
plan
nin
g sa
tisfi
ed w
ith
mo
dern
m
eth
ods
37.
1 %
2
012
-13
PD
HS
T3
.7
3.7
.2 A
dol
esce
nt
bir
th r
ate
(age
d 15
-19
year
s) p
er 1
,000
wo
men
in
th
at a
ge g
rou
p 4
4 %
2
012
-13
PD
HS
T3
.a
3.a
.1 A
ge-s
tand
ard
ized
pre
vale
nce
of
curr
ent
tob
acco
use
am
ong
p
erso
ns a
ged
15 y
ears
and
old
er
Fem
ale=
6.4
, Mal
e=4
4.6
%
2
012
-13
PD
HS
T4
.5
4.5
.1 P
arit
y in
dic
es (
fem
ale/
mal
e, r
ural
/ u
rban
, bo
ttom
/ to
p w
ealt
h q
uin
tile
and
oth
ers
such
as
dis
abil
ity
stat
us,
indi
gen
ous
peop
les
and
con
flic
t af
fect
ed, a
s d
ata
bec
om
e av
aila
ble
) fo
r al
l ed
uca
tio
n in
dica
tors
on
this
lis
t th
at c
an b
e di
sagg
rega
ted
GP
I P
rim
ary
= 0
.88
; G
PI
Sec
on
dary
= 0
.87
u
nit
201
4-1
5 P
SL
M
T4
.6
4.6
.1 P
erce
nta
ge o
f p
opu
lati
on
in a
giv
en a
ge g
roup
ach
ievi
ng
at l
east
a
fix
ed l
evel
of
pro
fici
ency
in
fu
ncti
ona
l (a
) li
tera
cy a
nd
(b)
n
umer
acy
skil
ls, b
y se
x
T=
60
%,
M=
70%
, F
=4
9%
%
201
4-1
5 P
SL
M
T4
.a
4.a
.1 P
rop
orti
on o
f sc
hoo
ls w
ith
acce
ss t
o: (
a) e
lect
rici
ty;
(b)
the
Inte
rnet
for
ped
ago
gica
l pu
rpo
ses;
(c)
co
mpu
ters
fo
r p
edag
ogi
cal
pur
pos
es;
(d)
adap
ted
infr
astr
uct
ure
and
mat
eria
ls f
or
stud
ents
wit
h
dis
abil
itie
s; (
e) b
asic
dri
nkin
g w
ater
; (f
) si
ngl
e se
x b
asic
san
itat
ion
faci
liti
es;
and
(g)
bas
ic h
and
was
hin
g fa
cili
ties
(as
per
th
e W
AS
H
indi
cato
r de
fin
itio
ns)
Ele
ctri
city
Pri
mar
y=53
, H
igh
=7
6, H
igh
er S
ec.=
97 -
- D
rin
kin
g W
ater
Pri
mar
y=6
7,
Hig
h=
92
, Hig
her
Sec
.=96
---
S
anit
atio
n P
rim
ary
= 6
7, H
igh
=
93
, Hig
her
Sec
. =
97
%
201
5-1
6 P
akis
tan
Ed
ucat
ion
Sta
tist
ics
T5
.5
5.5
.1 P
ropo
rtio
n o
f se
ats
held
by
wo
men
in
nat
iona
l p
arli
amen
ts a
nd
loca
l go
vern
men
ts
19.
7 P
erce
nt
201
7 h
ttp
://w
ww
.pak
p.g
ov.
pk/2
013
/mem
ber
s-d
irec
tory
/wo
men
-res
erve
d-s
eats
/
T5
.5
5.5
.2 P
ropo
rtio
n o
f w
om
en i
n m
anag
eria
l p
osit
ions
1
.55
Per
cen
t 2
014
-15
LF
S
T6
.2
6.2
.1 P
ropo
rtio
n o
f po
pul
atio
n us
ing
safe
ly m
anag
ed s
anit
atio
n se
rvic
es,
incl
udi
ng
a h
and
-was
hing
fac
ilit
y w
ith
soap
and
wat
er
73
Per
cen
t 2
014
-15
PS
LM
SUSTAINABLE DEVELOPMENT GOALS (SDGs)
PAKISTAN'S PERSPECTIVEDATA
REPORTING GAP

47
T7
.1
7.1
.1 P
ropo
rtio
n o
f po
pul
atio
n w
ith
acc
ess
to e
lect
rici
ty
93.
5 %
2
014
-15
PS
LM
T7
.1
7.1
.2 P
ropo
rtio
n o
f po
pul
atio
n w
ith
pri
mar
y re
lian
ce o
n c
lean
fue
ls
and
tec
hno
logy
4
1.3
%
201
4-1
5 P
SL
M
T7
.2
7.2
.1 R
enew
able
ene
rgy
shar
e in
th
e to
tal
fin
al e
ne
rgy
cons
um
ptio
n
11
%
201
5 P
akis
tan
En
erg
y Y
earb
ook
T8
.1
8.1
.1 A
nnu
al g
row
th r
ate
of r
eal
GD
P p
er c
apit
a 1
.0%
%
2
015
-16
Pak
ista
n E
con
omic
Su
rvey
T8
.1
8.2
.1 A
nnu
al g
row
th r
ate
of r
eal
GD
P p
er e
mp
loye
d p
erso
n
1.9
%
%
201
5-1
6 P
akis
tan
Eco
nom
ic S
urv
ey
T8
.3
8.3
.1 P
ropo
rtio
n o
f in
form
al e
mp
loym
ent
in n
on-a
gric
ultu
re
emp
loym
ent,
by
sex
T
otal
=7
3.6
%,
Mal
e=73
.7%
, F
emal
e= 7
3.0
%
%
201
4-1
5 L
FS
T8
.5
8.5
.1 A
vera
ge
hour
ly e
arn
ings
of
fem
ale
and
mal
e em
plo
yees
, by
occ
upat
ion
, age
an
d pe
rson
s w
ith
dis
abil
itie
s T
otal
=7
7.97
p/h
, Mal
e=82
.73
p/h
, Fem
ale=
50
.83
p/h
p
er h
our
201
4-1
5 L
FS
T8
.5
8.5
.2 U
nem
plo
ymen
t ra
te,
by s
ex,
age
and
per
sons
wit
h d
isab
ilit
ies
Tot
al=
5.9
4%
, M
ale=
4.9
7%
, F
emal
e= 8
.95
%
%
201
4-1
5 L
FS
T8
.8
8.8
.2 I
ncr
ease
in
nat
iona
l co
mpl
ian
ce o
f la
bou
r ri
ghts
(fr
eed
om o
f as
soci
atio
n a
nd c
oll
ecti
ve b
arga
inin
g) b
ased
on
In
tern
atio
nal
Lab
our
Org
aniz
atio
n (I
LO
) te
xtua
l so
urce
s an
d n
atio
nal
leg
isla
tio
n, b
y se
x an
d m
igra
nt
stat
us
TU
R O
vera
ll=
7.4
0,
TU
R
Law
=8
.47,
TU
R
Pra
ctic
e=3
.26
- 2
015
ILO
T8
.10
8.1
0.1
Nu
mb
er o
f co
mm
erci
al b
ank
bra
nche
s an
d a
uto
mat
ed t
elle
r m
achi
nes
(A
TM
s) p
er 1
00,
000
adu
lts
C
om
mer
cial
Ban
k B
ranc
hes=
7.1
3, A
TM
s= 5
.72
p
er 1
00,0
00 p
er
pop
ula
tio
n 2
015
Fo
r C
omm
erci
al B
anks
: S
tati
stic
s on
S
ched
ule
Ban
ks i
n P
akis
tan.
F
or
AT
M:
Pay
men
t sy
stem
sta
tist
ics
for
thir
d qu
arte
r o
f fi
scal
yea
r 2
015
.
T8
.b
8.b
.1 T
otal
go
vern
men
t sp
end
ing
in s
ocia
l pr
ote
ctio
n a
nd
emp
loym
ent
pro
gram
mes
as
a p
rop
orti
on
of t
he
nati
ona
l bu
dget
s an
d
GD
P
2.1
%
2
015
PR
SP
T9
.2
9.2
.1 M
anuf
actu
rin
g va
lue
adde
d as
a p
ropo
rtio
n o
f G
DP
an
d p
er
cap
ita
MV
A a
s %
GD
P=
13
.56
%,
&
Per
Cap
ita=
18,
489
%
2
015
-16
Pak
ista
n E
con
omic
Su
rvey
T9
.2
9.2
.2 M
anuf
actu
rin
g em
plo
ymen
t as
a p
ropo
rtio
n o
f to
tal
empl
oym
ent
Tot
al=
15.
33%
, Mal
e=
12.
06%
, Fem
ale=
3.2
7%
%
201
4-1
5 L
FS
T9
.3
9.3
.1 P
ropo
rtio
n o
f sm
all-
scal
e in
dus
trie
s in
tot
al i
ndu
stry
val
ue
add
ed
8.4
%
%
201
5-1
6 P
akis
tan
Eco
nom
ic S
urv
ey
T9
.4
9.4
.1 C
O2
emis
sio
n p
er u
nit
of
valu
e ad
ded
0
.21
7700
kg
per
$1
GD
P
(PP
P)
2
015
UN
Dat
a
T9
.5
9.5
.1 R
esea
rch
and
dev
elo
pmen
t ex
pen
ditu
re a
s a
pro
port
ion
of G
DP
0
.22
7 %
2
015
-16
An
nua
l B
ud
get
Sta
tem
ent
T9
.b
9.b
.1 P
ropo
rtio
n o
f m
ediu
m a
nd h
igh
-tec
h i
ndu
stry
val
ue
adde
d i
n to
tal
valu
e ad
ded
0.2
5%
%
2
015
UN
Dat
a
T9
.c
9.c
.1 P
rop
orti
on o
f po
pula
tion
cov
ered
by
a m
obi
le n
etw
ork
, by
te
chn
olo
gy
69.
9%
%
2
015
-16
Pak
ista
n E
con
omic
Su
rvey
SUSTAINABLE DEVELOPMENT GOALS (SDGs)
PAKISTAN'S PERSPECTIVEDATA
REPORTING GAP

48
T1
0.1
10.
1.1
Gro
wth
rat
es o
f h
ouse
hol
d e
xpen
ditu
re o
r in
com
e p
er c
apit
a am
ong
th
e bo
tto
m 4
0 pe
r ce
nt
of
the
pop
ulat
ion
and
th
e to
tal
pop
ulat
ion
Nat
ion
al A
vera
ge=
9.2
6%
; B
ott
om 4
0%
= 7
.41
%
%
201
5-1
6 P
SL
M/H
IES
T1
0.2
10.
2.1
Pro
port
ion
of
peo
ple
livi
ng b
elo
w 5
0 p
er c
ent
of
med
ian
in
com
e, b
y ag
e, s
ex a
nd p
erso
ns
wit
h d
isab
ilit
ies
16.
6%
%
2
015
-16
PS
LM
/HIE
S
T1
0.5
10.
5.1
Fin
anci
al S
oun
dnes
s In
dica
tors
1
6.2
%
%
201
5 S
BP
/IF
S
T11
.1
11.1
.1 P
ropo
rtio
n o
f ur
ban
pop
ulat
ion
livi
ng i
n sl
ums,
inf
orm
al
sett
lem
ents
or
inad
equ
ate
hou
sin
g 4
5.5
%
201
4 U
N H
abit
at
T11
.7
11.7
.2 P
ropo
rtio
n o
f pe
rson
s vi
ctim
of
phy
sica
l o
r se
xual
har
assm
ent,
b
y se
x, a
ge, d
isab
ilit
y st
atu
s an
d p
lace
of
occ
urr
ence
, in
th
e pr
evio
us
12
mon
ths
32.
2 %
2
012
-13
PD
HS
T1
4.5
14.
5.1
Cov
erag
e of
pro
tect
ed a
reas
in
rel
atio
n t
o m
arin
e ar
eas
Mar
ine
Pro
tect
ed A
rea=
5.6
, T
erre
stri
al a
nd
mar
ine
area
=8
.6
as %
of
tota
l te
rrit
ori
al a
rea
201
4 W
orl
d B
ank
T1
4.7
14.
7.1
Sus
tain
able
fish
erie
s as
a p
erce
nta
ge o
f G
DP
in
sm
all
isla
nd
dev
elo
pin
g S
tate
s, l
east
dev
elo
ped
co
untr
ies
and
all
cou
ntri
es
0.4
0 %
2
016
-17
Pak
ista
n E
con
omic
Su
rvey
T1
5.1
15.
1.1
For
est
area
as
a pr
opo
rtio
n of
to
tal
land
are
a 5
.70
%
201
6-1
7 P
akis
tan
Eco
nom
ic S
urv
ey
T1
6.1
16.
1.1
Num
ber
of
vict
ims
of
inte
nti
ona
l h
omic
ide
per
100
,00
0 p
opul
atio
n, b
y se
x an
d a
ge
7.8
p
er 1
00,0
00
201
2 U
NO
DC
/WH
O/W
DI
T1
6.1
16.
1.2
Con
flic
t-re
late
d d
eath
s pe
r 10
0,00
0 po
pula
tion
, by
sex,
age
an
d c
ause
1
.92
7748
691
p
er 1
00,0
00
201
5 S
ou
th A
sia
inte
llig
ence
Rev
iew
T1
6.9
16.
9.1
Pro
port
ion
of
chil
dre
n u
nder
5 y
ears
of
age
wh
ose
birt
hs
hav
e b
een
regi
ster
ed w
ith
a ci
vil
auth
ori
ty,
by
age
34
per
cen
t 2
015
UN
ICE
F
T1
7.1
17.
1.1
To
tal
gove
rnm
ent
reve
nue
(by
sour
ce)
as a
per
cent
age
of
GD
P
Tax
Rev
enu
e: 1
1.0
, D
irec
t T
ax:
3.7
9, I
ndi
rect
Tax
: 7
.21
, In
tern
atio
n T
rade
Tax
: 1
.12,
S
ales
Tax
: 3.
97, E
xcis
e D
uty:
0
.06
2, F
eder
al:
10.
25,
P
rovi
nci
al:
0.75
per
cen
t 2
015
-16
Eco
no
mic
Su
rvey
T1
7.1
17.
1.2
Pro
port
ion
of
dom
esti
c bu
dge
t fu
nde
d b
y d
om
esti
c ta
xes
56
per
cen
t 2
015
-16
Eco
no
mic
Su
rvey
T1
7.3
17.
3.1
For
eign
dir
ect
inve
stm
ents
(F
DI)
, offi
cial
dev
elo
pm
ent
assi
stan
ce a
nd
Sou
th-S
outh
Coo
pera
tio
n a
s a
pro
port
ion
of
tota
l d
omes
tic
bud
get
FD
I -
1.7
4; O
DA
- 7
.12
Per
cen
tage
2
015
FD
I -
Eco
nom
ic S
urv
ey,
OD
A -
Wo
rld
Ban
k
T1
7.3
17.
3.2
Vo
lum
e o
f re
mit
tanc
es (
in U
nite
d S
tate
s d
oll
ars)
as
a p
rop
orti
on
of
tota
l G
DP
1
8720
U
S$
Mil
lion
2
015
Eco
no
mic
Su
rvey
T1
7.4
17.
4.1
Deb
t se
rvic
e as
a p
ropo
rtio
n o
f ex
po
rts
of g
oods
and
ser
vice
s 4
5.2
4 P
erce
nta
ge
201
5 E
con
om
ic S
urv
ey
T1
7.6
17.
6.2
Fix
ed I
nte
rnet
bro
adb
and
subs
crip
tion
s p
er 1
00 i
nhab
itan
ts, b
y sp
eed
1
.65
465
per
100
in
hib
itan
ts
201
5 P
TA
web
site
T1
7.8
17.
8.1
Pro
port
ion
of
indi
vidu
als
usin
g th
e In
tern
et
8.8
9 p
erce
nt
201
5 P
TA
web
site
, Eco
nom
ic S
urv
ey
SUSTAINABLE DEVELOPMENT GOALS (SDGs)
PAKISTAN'S PERSPECTIVEDATA
REPORTING GAP
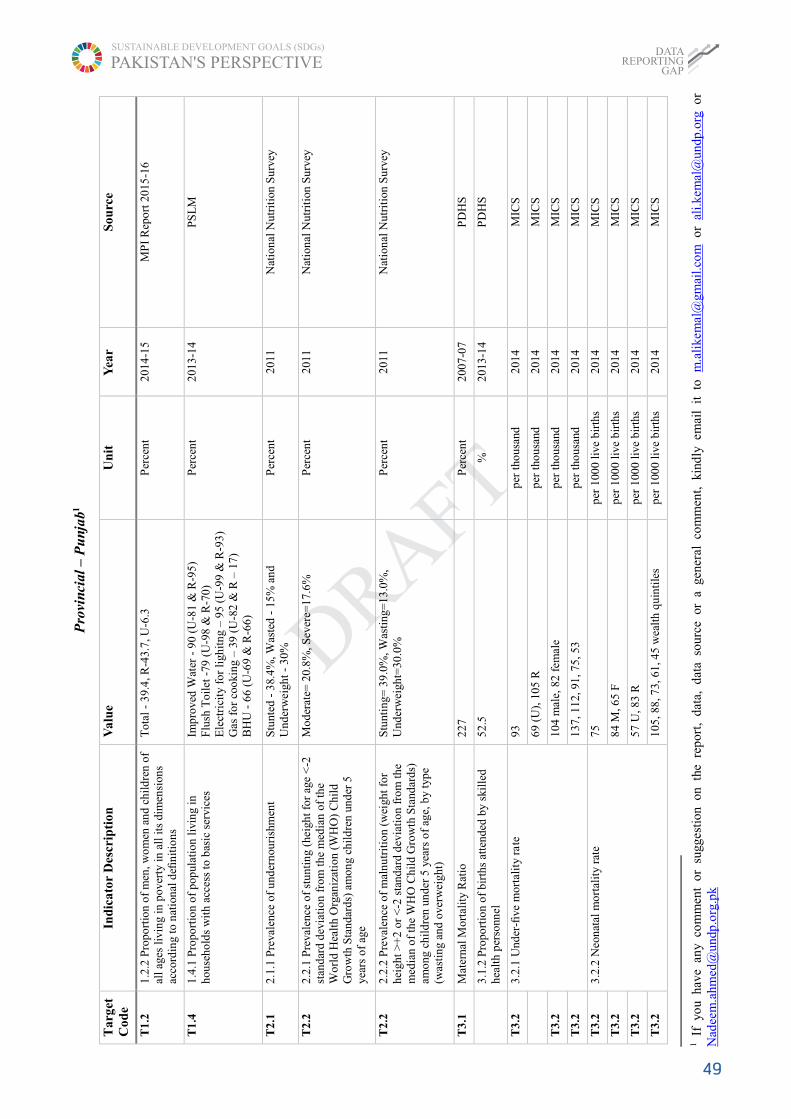
49
Pro
vin
cial
– P
un
jab1
Tar
get
C
od
e In
dic
ato
r D
escr
ipti
on
V
alu
e
Un
it
Yea
r
Sou
rce
T1
.2
1.2
.2 P
ropo
rtio
n o
f m
en, w
om
en a
nd
chil
dre
n o
f al
l ag
es l
ivin
g in
pov
erty
in
all
its
dim
ensi
ons
acco
rdin
g to
nat
ion
al d
efin
itio
ns
Tot
al -
39.
4, R
-43.
7, U
-6.3
P
erce
nt
201
4-1
5 M
PI
Rep
ort
20
15-1
6
T1
.4
1.4
.1 P
ropo
rtio
n o
f po
pul
atio
n li
vin
g in
h
ouse
hold
s w
ith
acc
ess
to b
asic
ser
vice
s Im
pro
ved
Wat
er -
90
(U-8
1 &
R-9
5)
Flu
sh T
oil
et -
79 (
U-9
8 &
R-7
0)
Ele
ctri
city
fo
r li
ghit
ng
– 9
5 (U
-99
& R
-93
) G
as f
or
coo
kin
g –
39
(U
-82
& R
– 1
7)
BH
U -
66
(U-6
9 &
R-6
6)
Per
cen
t 2
013
-14
PS
LM
T2
.1
2.1
.1 P
reva
lenc
e of
und
ern
ouri
shm
ent
Stu
nted
- 3
8.4
%, W
aste
d -
15
% a
nd
Und
erw
eigh
t -
30
%
Per
cen
t 2
011
Nat
ion
al N
utri
tion
Su
rvey
T2
.2
2.2
.1 P
reva
lenc
e of
stu
ntin
g (h
eigh
t fo
r ag
e <
-2
stan
dar
d d
evia
tio
n f
rom
th
e m
edia
n of
th
e W
orl
d H
ealt
h O
rgan
izat
ion
(WH
O)
Chi
ld
Gro
wth
Sta
nda
rds)
am
ong
chil
dre
n u
nd
er 5
ye
ars
of
age
Mo
der
ate=
20.
8%
, Sev
ere=
17.6
%
Per
cen
t 2
011
Nat
ion
al N
utri
tion
Su
rvey
T2
.2
2.2
.2 P
reva
lenc
e of
mal
nu
trit
ion
(wei
ght
for
hei
ght
>+
2 o
r <
-2 s
tand
ard
dev
iati
on
fro
m t
he
med
ian
of
the
WH
O C
hild
Gro
wth
Sta
ndar
ds)
amo
ng c
hil
dre
n un
der
5 y
ears
of
age,
by
typ
e (w
asti
ng
and
over
wei
ght)
Stu
ntin
g= 3
9.0
%, W
asti
ng=
13.
0%,
Und
erw
eigh
t=30
.0%
P
erce
nt
201
1 N
atio
nal
Nut
riti
on S
urv
ey
T3
.1
Mat
erna
l M
orta
lity
Rat
io
22
7 P
erce
nt
200
7-0
7 P
DH
S
3
.1.2
Pro
port
ion
of
birt
hs
atte
nded
by
skil
led
hea
lth
per
sonn
el
52.
5 %
2
013
-14
PD
HS
T3
.2
3.2
.1 U
nder
-five
mor
tali
ty r
ate
9
3 p
er t
hous
and
2
014
MIC
S
6
9 (U
), 1
05 R
p
er t
hous
and
2
014
MIC
S
T3
.2
104
mal
e, 8
2 f
emal
e p
er t
hous
and
2
014
MIC
S
T3
.2
137
, 11
2, 9
1, 7
5, 5
3
per
tho
usan
d
201
4 M
ICS
T3
.2
3.2
.2 N
eon
atal
mo
rtal
ity
rate
7
5 p
er 1
000
live
bir
ths
201
4 M
ICS
T3
.2
84
M, 6
5 F
p
er 1
000
live
bir
ths
201
4 M
ICS
T3
.2
57
U, 8
3 R
p
er 1
000
live
bir
ths
201
4 M
ICS
T3
.2
105
, 88
, 73,
61,
45
wea
lth
qui
nti
les
per
100
0 li
ve b
irth
s 2
014
MIC
S
1 If
yo
u h
ave
any
com
men
t or
sug
gest
ion
on t
he r
epor
t, d
ata,
dat
a so
urce
or
a ge
nera
l co
mm
ent,
kin
dly
em
ail
it t
o
m.a
like
mal
@gm
ail.
com
o
r al
i.ke
mal
@un
dp.o
rg o
r N
adee
m.a
hm
ed@
und
p.o
rg.p
k
SUSTAINABLE DEVELOPMENT GOALS (SDGs)
PAKISTAN'S PERSPECTIVEDATA
REPORTING GAP

50
3
.3.2
Tu
ber
culo
sis
inci
den
ce p
er 1
,000
p
opul
atio
n 3
0 p
er 1
000
popu
lati
on
201
2-1
3 P
DH
S
T3
.3
3.3
.3 M
alar
ia i
nci
den
ce p
er 1
,000
pop
ula
tion
0
.4
per
100
0 po
pula
tion
2
015
Mal
aria
Con
trol
Pro
gram
T3
.7
3.7
.1 P
ropo
rtio
n o
f w
om
en o
f re
pro
duct
ive
age
(age
d 1
5-4
9 y
ears
) w
ho
have
th
eir
need
fo
r fa
mil
y pl
anni
ng
sati
sfied
wit
h m
ode
rn m
etho
ds
47
Per
cen
tage
2
012
-13
PD
HS
T3
.7
32.
2 U
rban
, 27
.4 R
ura
l P
erce
nta
ge
201
2-1
3 P
DH
S
T3
.7
3.7
.2 A
dol
esce
nt
bir
th r
ate
(age
d 10
-14
year
s;
aged
15
-19
yea
rs)
per
1,0
00 w
omen
in
th
at a
ge
gro
up
34
%
201
4 M
ICS
T3
.7
U-2
7 an
d R
-37
%
201
4 M
ICS
T3
.a
3.a
.1 A
ge-s
tand
ard
ized
pre
vale
nce
of
curr
ent
toba
cco
use
am
ong
per
son
s ag
ed 1
5 ye
ars
and
o
lder
Mal
e -
43.
6 a
nd
Fem
ale
- 5
.3
%
201
2-1
3 P
DH
S
T4
.2
4.2
.1 P
ropo
rtio
n o
f ch
ild
ren
un
der
5 ye
ars
of
age
who
are
dev
elo
pm
enta
lly
on t
rack
in
hea
lth
, le
arn
ing
and
psy
chos
oci
al w
ell-
bei
ng,
by
sex
97
.7 (
H),
93.
6 (
L),
62.
2 (
P)
(ove
rall
);
9
7.4
(H
), 9
3.3
(L
), 6
0.3
(P
);
(Mal
e);
98.
0 (
H),
94
(L),
64
.1 (
P)
(fem
ale)
%
201
4 M
ICS
T4
.2
4.2
.2 P
arti
cip
atio
n r
ate
in o
rgan
ized
lea
rnin
g (o
ne y
ear
bef
ore
the
offi
cial
pri
mar
y en
try
age)
, b
y se
x
25.
7, 2
4.9
M, 2
6.6
F
%
201
4 M
ICS
T4
.5
4.5
.1 P
arit
y in
dic
es (
fem
ale/
mal
e, r
ural
/ u
rban
, b
otto
m/
top
wea
lth
qu
inti
le a
nd
oth
ers
such
as
dis
abil
ity
stat
us,
ind
igen
ous
peo
ples
an
d
con
flic
t af
fect
ed, a
s d
ata
bec
om
e av
aila
ble
) fo
r al
l ed
uca
tion
in
dica
tors
on
this
lis
t th
at c
an b
e d
isag
greg
ated
Pri
mar
y -
0.9
7, S
econ
dary
- 0
.98
%
201
4 M
ICS
T4
.5
Urb
an P
rim
ary
- 1
.02,
Ru
ral
Pri
mar
y -
0.9
4 U
rban
Sec
ond
ary
– 1
.12
, Rur
al S
econ
dary
–
0.8
8
%
201
4 M
ICS
T4
.5
Qui
nti
le P
rim
ary
– 0
.76
, 0.9
6, 1
.01
, 1
.03
, 1
.02
; Q
uin
tile
Sec
onda
ry
– 0
.44
, 0.7
8,
1.0
7, 1
.16
, 1.0
8
%
201
4 M
ICS
T4
.6
4.6
.1 P
erce
nta
ge o
f p
opu
lati
on
in a
giv
en a
ge
gro
up
achi
evin
g at
lea
st a
fixe
d le
vel
of
pro
fici
ency
in
fun
ctio
nal
(a)
lit
erac
y an
d (
b)
num
erac
y sk
ills
, by
sex
T=
63
%,
M=
71%
, F
=55
%
%
201
4-1
5 P
SL
M
SUSTAINABLE DEVELOPMENT GOALS (SDGs)
PAKISTAN'S PERSPECTIVEDATA
REPORTING GAP

51
T4
.a
4.a
.1 P
rop
orti
on o
f sc
hoo
ls w
ith
acce
ss t
o: (
a)
elec
tric
ity;
(b)
th
e In
tern
et f
or p
edag
ogi
cal
pur
pos
es;
(c)
com
put
ers
for
peda
gogi
cal
pur
pos
es;
(d)
adap
ted
infr
astr
uct
ure
and
mat
eria
ls f
or s
tud
ents
wit
h d
isab
ilit
ies;
(e)
bas
ic
dri
nki
ng
wat
er;
(f)
sing
le s
ex b
asic
san
itat
ion
faci
liti
es;
and
(g)
bas
ic h
and
was
hin
g fa
cili
ties
(a
s pe
r th
e W
AS
H i
ndic
ato
r d
efini
tio
ns)
Ele
ctri
city
Pri
mar
y=9
0.7
, Sec
ond
ary=
97.
8,
Hig
h=
99
.4,
Hig
her
=99
.8
Dri
nk
ing
Wat
er P
rim
ary=
99
.5,
Mid
dle=
99.9
8, H
igh=
99.9
8, H
ighe
r S
ec.=
10
0 T
oile
ts P
rim
ary=
98
.92,
Mid
dle
=99
.91
, H
igh
=9
9.5
2, H
ighe
r S
ec.=
100
Bou
nd
ary
Wal
l P
rim
ary=
97,
Sec
on
dary
=9
9.2
, Hig
h=
99.
2, H
igh
er=
99.
6
%
201
5-1
6 P
akis
tan
Ed
ucat
ion
Sta
tist
ics
T4
.c
4.c
.1 P
rop
orti
on o
f te
ache
rs i
n:
(a)
pre-
pri
mar
y;
(b)
pri
mar
y; (
c) l
ow
er s
eco
nda
ry;
and
(d
) up
per
se
cond
ary
educ
atio
n w
ho h
ave
rece
ived
at
leas
t th
e m
inim
um
org
aniz
ed t
each
er t
rain
ing
(e.g
. p
edag
ogic
al t
rain
ing)
pre
-ser
vice
or
in-s
ervi
ce
requ
ired
fo
r te
ach
ing
at t
he r
elev
ant
leve
l in
a
give
n c
oun
try
92.
9 %
2
016
NE
MIS
T4
.c
92.
9 %
2
016
NE
MIS
T4
.c
93.
4 %
2
016
NE
MIS
9
4.4
%
201
6 N
EM
IS
T5
.2
5.2
.1 P
ropo
rtio
n o
f ev
er-p
artn
ered
wo
men
and
gi
rls
aged
15
year
s an
d ol
der
sub
ject
ed t
o
phy
sica
l, s
exua
l o
r p
sych
olo
gica
l vi
olen
ce b
y a
curr
ent
or
form
er i
nti
mat
e p
artn
er i
n t
he
pre
vio
us
12 m
on
ths,
by
form
of
vio
lenc
e an
d b
y ag
e
28.
6, 2
9.6
U, 2
8.1
R
%
201
2-1
3 P
DH
S
T5
.5
5.5
.1 P
ropo
rtio
n o
f se
ats
held
by
wo
men
in
n
atio
nal
par
liam
ents
and
lo
cal
gove
rnm
ents
2
0.5
Per
cen
t 2
017
htt
p:/
/ww
w.p
akp
.go
v.pk
/20
13/m
emb
ers-
dir
ecto
ry/w
om
en-r
eser
ved
-sea
ts/
T5
.5
5.5
.2 P
ropo
rtio
n o
f w
om
en i
n m
anag
eria
l p
osit
ions
1
.8
Per
cen
t 2
014
-15
LF
S
T5
.a
5.a
.1 (
a) P
ropo
rtio
n o
f to
tal
agri
cult
ural
p
opul
atio
n w
ith
ow
ners
hip
or
secu
re r
igh
ts o
ver
agri
cult
ural
lan
d, b
y se
x; a
nd (
b)
shar
e o
f w
om
en a
mo
ng o
wne
rs o
r ri
ghts
-bea
rers
of
agri
cult
ural
lan
d, b
y ty
pe
of t
enur
e
a) 3
.3 F
, 31
.6
%
2/1
2/2
013
P
DH
S
T6
.2
6.2
.1 P
ropo
rtio
n o
f po
pul
atio
n us
ing
safe
ly
man
aged
san
itat
ion
serv
ices
, in
clu
din
g a
han
d-
was
hin
g fa
cili
ty w
ith
soa
p an
d w
ater
79
Per
cen
t 2
014
-15
PS
LM
T7
.1
7.1
.1 P
rop
orti
on
of
pop
ulat
ion
wit
h ac
cess
to
elec
tric
ity
94.
8 %
2
014
-15
PS
LM
T7
.1
7.1
.2 P
ropo
rtio
n o
f po
pul
atio
n w
ith
pri
mar
y re
lian
ce o
n c
lean
fu
els
and
tech
nolo
gy
38.
8 %
2
014
-15
PS
LM
T8
.3
8.3
.1 P
ropo
rtio
n o
f in
form
al e
mpl
oym
ent
in
no
n-ag
ricu
ltur
e em
plo
ymen
t, b
y se
x
Tot
al -
50.
74,
M
ale
- 4
7.93
, Fem
ale
- 2
.81
Per
cen
t 2
014
-15
Lab
our
Fo
rce
Su
rvey
SUSTAINABLE DEVELOPMENT GOALS (SDGs)
PAKISTAN'S PERSPECTIVEDATA
REPORTING GAP
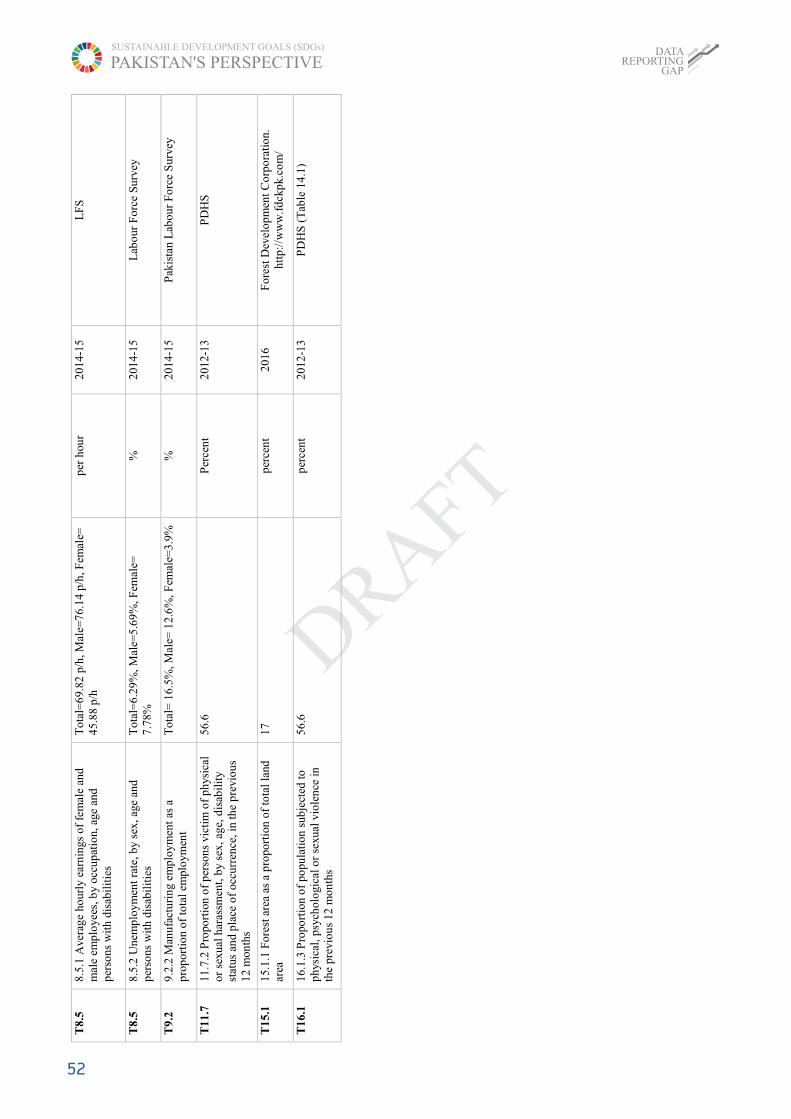
52
T8
.5
8.5
.1 A
vera
ge
hour
ly e
arn
ings
of
fem
ale
and
m
ale
emp
loye
es, b
y oc
cup
atio
n, a
ge a
nd
per
sons
wit
h d
isab
ilit
ies
Tot
al=
69.
82 p
/h, M
ale=
76.
14
p/h
, Fem
ale=
4
5.8
8 p
/h
per
hou
r 2
014
-15
LF
S
T8
.5
8.5
.2 U
nem
plo
ymen
t ra
te,
by s
ex,
age
and
p
erso
ns w
ith
dis
abil
itie
s T
otal
=6
.29
%,
Mal
e=5
.69
%,
Fem
ale=
7
.78
%
%
201
4-1
5 L
abo
ur F
orc
e S
urv
ey
T9
.2
9.2
.2 M
anuf
actu
rin
g em
plo
ymen
t as
a
pro
por
tio
n o
f to
tal
empl
oym
ent
Tot
al=
16.
5%, M
ale=
12
.6%
, F
emal
e=3.
9%
%
201
4-1
5 P
akis
tan
Lab
our
Fo
rce
Sur
vey
T11
.7
11.7
.2 P
ropo
rtio
n o
f pe
rson
s vi
ctim
of
phy
sica
l o
r se
xual
har
assm
ent,
by
sex,
age
, d
isab
ilit
y st
atus
an
d p
lace
of
occu
rren
ce,
in t
he
pre
vio
us
12
mon
ths
56.
6 P
erce
nt
201
2-1
3 P
DH
S
T1
5.1
15.
1.1
For
est
area
as
a p
ropo
rtio
n of
to
tal
land
ar
ea
17
per
cen
t 2
016
Fo
rest
Dev
elo
pm
ent
Co
rpo
rati
on.
htt
p:/
/ww
w.f
dck
pk.
com
/
T1
6.1
16.
1.3
Pro
port
ion
of
popu
lati
on s
ubje
cted
to
phy
sica
l, p
sych
olo
gica
l o
r se
xual
vio
len
ce i
n
the
prev
iou
s 12
mo
nth
s
56.
6 p
erce
nt
201
2-1
3 P
DH
S (
Tab
le 1
4.1
)
SUSTAINABLE DEVELOPMENT GOALS (SDGs)
PAKISTAN'S PERSPECTIVEDATA
REPORTING GAP

53
Pro
vin
cial
– K
hyb
er P
akh
tun
khw
ah2
Tar
get
C
od
e In
dic
ato
r D
escr
ipti
on
V
alu
e
Un
it
Yea
r
Sou
rce
T1
.2
1.2
.2 P
ropo
rtio
n o
f m
en, w
om
en a
nd
chil
dre
n
of
all
ages
liv
ing
in p
over
ty i
n al
l it
s d
imen
sio
ns a
cco
rdin
g to
nat
ion
al d
efin
itio
ns
Tot
al -
49.
2, U
-10.
2, R
- 57
.8
Per
cen
t 2
014
-15
MP
I R
epo
rt 2
015
-16
T1
.4
1.4
.1 P
ropo
rtio
n o
f po
pul
atio
n li
vin
g in
h
ouse
hold
s w
ith
acc
ess
to b
asic
ser
vice
s Im
pro
ved
Wat
er -
73
(U-9
3 &
R-6
9)
Flu
sh T
oil
et -
76 (
U-9
7 &
R-7
1)
Ele
ctri
city
fo
r li
ghit
ng
– 9
6.2
(U
-99.
2 &
R-
95.
5)
Gas
fo
r co
oki
ng
– 2
5.8
7 (
U-8
0.2
9 &
R –
1
3.4
9)
BH
U -
Per
cen
t 2
013
-14
PS
LM
T1
.a
1.a
.1 P
rop
orti
on o
f re
sour
ces
allo
cate
d by
th
e go
vern
men
t d
irec
tly
to p
over
ty r
edu
ctio
n p
rogr
amm
es
59.
93
Per
cen
t 2
014
-15
PR
SP
T1
.a
1.a
.2 P
rop
orti
on o
f to
tal
gove
rnm
ent
spen
din
g o
n es
sen
tial
ser
vice
s (e
duca
tion
, he
alth
an
d so
cial
pro
tect
ion
)
35.
67
Per
cen
t 2
014
-15
PR
SP
T2
.2
2.2
.1 P
reva
lenc
e of
stu
ntin
g (h
eigh
t fo
r ag
e <
-2
sta
nd
ard
dev
iati
on f
rom
th
e m
edia
n o
f th
e W
orl
d H
ealt
h O
rgan
izat
ion
(WH
O)
Chi
ld
Gro
wth
Sta
nda
rds)
am
on
g ch
ildr
en u
nde
r 5
year
s o
f ag
e
Mo
der
ate=
24.
1%
, Sev
ere=
25.1
%
Per
cen
t 2
011
Nat
ion
al N
utri
tion
Su
rvey
T2
.2
2.2
.2 P
reva
lenc
e of
mal
nu
trit
ion
(wei
ght
for
hei
ght
>+
2 o
r <
-2 s
tand
ard
dev
iati
on
fro
m t
he
med
ian
of
the
WH
O C
hild
Gro
wth
Sta
ndar
ds)
amo
ng c
hil
dre
n un
der
5 y
ears
of
age,
by
typ
e (w
asti
ng
and
over
wei
ght)
Stu
ntin
g= 4
8.0%
, Was
tin
g=16
.0%
, U
nder
wei
ght=
24.0
%
Per
cen
t 2
011
Nat
ion
al N
utri
tion
Su
rvey
T3
.1
3.1
.1 M
ater
nal
mo
rtal
ity
rati
o
27
5 p
er 1
00,0
00
200
6-0
7 P
DH
S
T3
.1
3.1
.2 P
ropo
rtio
n o
f bi
rth
s at
tend
ed b
y sk
ille
d h
ealt
h p
erso
nnel
4
8.3
per
cen
t 2
013
-13
PD
HS
T3
.2
3.2
.1 U
nder
-five
mor
tali
ty r
ate
1
00
per
tho
usan
d
200
8 M
ICS
7
7 (U
), 1
04 R
p
er t
hous
and
2
008
MIC
S
T3
.2
95
mal
e, 1
05
fem
ale
per
tho
usan
d
200
8 M
ICS
T3
.2
109
, 10
7, 1
24, 8
3, 6
6
per
tho
usan
d
200
8 M
ICS
2 If
yo
u h
ave
any
com
men
t or
sugg
esti
on o
n th
e re
por
t, d
ata,
dat
a so
urce
or
a ge
nera
l co
mm
ent,
kin
dly
em
ail
it t
o m
.ali
kem
al@
gmai
l.co
m
or
ali.
kem
al@
undp
.org
or
Nad
eem
.ah
med
@und
p.o
rg.p
k
SUSTAINABLE DEVELOPMENT GOALS (SDGs)
PAKISTAN'S PERSPECTIVEDATA
REPORTING GAP

54
T3
.2
3.2
.2 N
eon
atal
mo
rtal
ity
rate
4
1 p
er 1
000
live
bir
ths
201
2-1
3 P
DH
S
T3
.2
34
U, 4
2 R
p
er 1
000
live
bir
ths
201
2-1
3 P
DH
S
T3
.3
3.3
.2 T
ub
ercu
losi
s in
cid
ence
per
1,0
00
pop
ulat
ion
33
per
100
0 po
pula
tion
2
012
-13
PD
HS
T3
.3
3.3
.3 M
alar
ia i
nci
den
ce p
er 1
,000
pop
ula
tio
n 2
7.7
per
100
0 po
pula
tion
2
015
Mal
aria
Con
trol
Pro
gram
T3
.3
3.3
.4 H
epat
itis
B i
nci
den
ce p
er 1
00,0
00
pop
ulat
ion
1.3
P
erce
nt
200
8 P
MR
C R
epo
rt
T3
.7
3.7
.1 P
ropo
rtio
n o
f w
om
en o
f re
pro
duct
ive
age
(age
d 1
5-4
9 y
ears
) w
ho
have
th
eir
need
fo
r fa
mil
y pl
anni
ng
sati
sfied
wit
h m
ode
rn
met
ho
ds
36.
4 P
erce
nta
ge
201
2-1
3 P
DH
S
46.
2 U
rban
, 33
.9 R
ura
l P
erce
nta
ge
201
2-1
3 P
DH
S
T3
.7
3.7
.2 A
dol
esce
nt
bir
th r
ate
(age
d 10
-14
year
s;
aged
15
-19
yea
rs)
per
1,0
00 w
omen
in
th
at a
ge
gro
up
42.
69
Per
Th
ousa
nd
Wo
men
2
008
MIC
S
T3
.7
U-3
3.9
3 an
d R
-44.
62
Per
Th
ousa
nd
Wo
men
2
008
MIC
S
T3
.a
3.a
.1 A
ge-s
tand
ard
ized
pre
vale
nce
of
curr
ent
toba
cco
use
am
ong
per
son
s ag
ed 1
5 ye
ars
and
o
lder
Mal
e -
39.
4 a
nd
Fem
ale
- 1
.0
per
cen
t 2
012
-13
PD
HS
T4
.5
4.5
.1 P
arit
y in
dic
es (
fem
ale/
mal
e, r
ura
l/
urb
an, b
ott
om/
top
wea
lth
qui
nti
le a
nd
oth
ers
such
as
dis
abil
ity
stat
us,
in
dige
nous
peo
ples
an
d c
onfl
ict
affe
cted
, as
data
bec
ome
avai
lab
le)
for
all
edu
cati
on
indi
cato
rs o
n t
his
list
tha
t ca
n b
e di
sagg
rega
ted
P
rim
ary
- 0
.80
, Sec
onda
ry -
0.6
0 U
rban
Pri
mar
y -
0.9
5, R
ura
l P
rim
ary
- 0
.76
Urb
an S
econ
dar
y –
0.8
9, R
ural
Sec
onda
ry
– 0
.52
Pri
mar
y b
y Q
uin
tile
– 0
.57
, 0.7
0, 0
.77
, 0
.91
, 1.0
0
Sec
on
dary
by
Qui
nti
le –
0.1
9, 0
.37,
0.5
3,
0.6
3, 0
.87
Rat
o
201
4 M
ICS
T4
.6
4.6
.1 P
erce
nta
ge o
f p
opu
lati
on
in a
giv
en a
ge
gro
up
achi
evin
g at
lea
st a
fixe
d le
vel
of
pro
fici
ency
in
fun
ctio
nal
(a)
lit
erac
y an
d (
b)
num
erac
y sk
ills
, by
sex
T=
53
%,
M=
71%
, F
=3
5%
%
201
4-1
5 P
SL
M
T4
.a
4.a
.1 P
rop
orti
on o
f sc
hoo
ls w
ith
acce
ss t
o: (
a)
elec
tric
ity;
(b)
th
e In
tern
et f
or p
edag
ogi
cal
pur
pos
es;
(c)
com
put
ers
for
peda
gogi
cal
pur
pos
es;
(d)
adap
ted
infr
astr
uct
ure
and
mat
eria
ls f
or s
tud
ents
wit
h d
isab
ilit
ies;
(e)
b
asic
dri
nkin
g w
ater
; (f
) si
ngl
e se
x b
asic
sa
nit
atio
n fa
cili
ties
; an
d (
g) b
asic
h
andw
ash
ing
faci
liti
es (
as p
er t
he W
AS
H
indi
cato
r d
efin
itio
ns)
Ele
ctri
city
Pri
mar
y=5
8, S
econ
dar
y=7
0,
Hig
h=
89
, Hig
her
=92
D
rin
kin
g W
ater
Pri
mar
y=7
2, M
idd
le=
75,
Hig
h=
88
, Hig
her
Sec
.=92
T
oile
ts P
rim
ary
= 8
6,
Mid
dle
= 9
0, H
igh
=
96,
Hig
her
Sec
. = 9
9
B
oun
dar
y W
all
Pri
mar
y=86
, S
eco
nda
ry=
89
, Hig
h=
93,
Hig
her
=9
6
%
201
5-1
6 P
akis
tan
Ed
ucat
ion
Sta
tist
ics
SUSTAINABLE DEVELOPMENT GOALS (SDGs)
PAKISTAN'S PERSPECTIVEDATA
REPORTING GAP
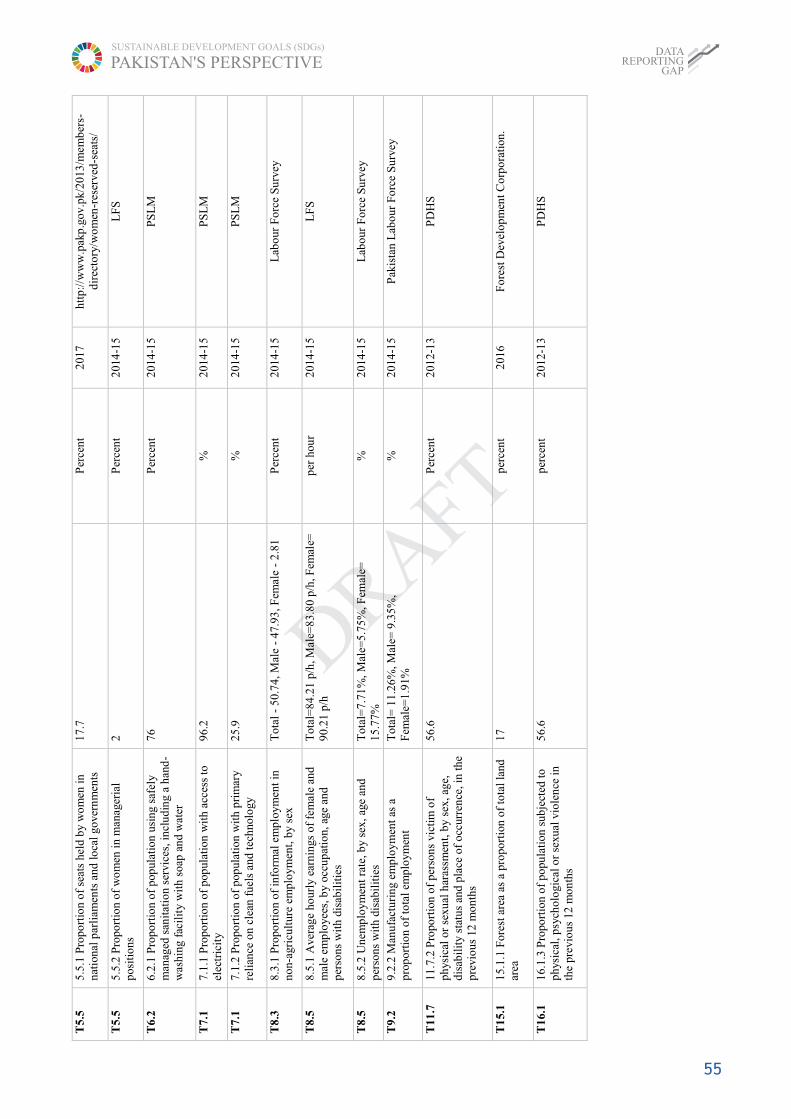
55
T5
.5
5.5
.1 P
ropo
rtio
n o
f se
ats
held
by
wo
men
in
n
atio
nal
par
liam
ents
and
lo
cal
gove
rnm
ents
1
7.7
Per
cen
t 2
017
htt
p:/
/ww
w.p
akp
.go
v.pk
/20
13/m
emb
ers-
dir
ecto
ry/w
om
en-r
eser
ved
-sea
ts/
T5.
5 5
.5.2
Pro
port
ion
of
wo
men
in
man
ager
ial
pos
itio
ns
2
Per
cen
t 2
014
-15
LF
S
T6
.2
6.2
.1 P
ropo
rtio
n o
f po
pul
atio
n us
ing
safe
ly
man
aged
san
itat
ion
serv
ices
, in
clu
din
g a
han
d-
was
hin
g fa
cili
ty w
ith
soa
p an
d w
ater
76
Per
cen
t 2
014
-15
PS
LM
T7
.1
7.1
.1 P
ropo
rtio
n o
f po
pul
atio
n w
ith
acc
ess
to
elec
tric
ity
96.
2 %
2
014
-15
PS
LM
T7
.1
7.1
.2 P
ropo
rtio
n o
f po
pul
atio
n w
ith
pri
mar
y re
lian
ce o
n c
lean
fu
els
and
tech
nolo
gy
25.
9 %
2
014
-15
PS
LM
T8
.3
8.3
.1 P
ropo
rtio
n o
f in
form
al e
mpl
oym
ent
in
no
n-ag
ricu
ltur
e em
plo
ymen
t, b
y se
x
Tot
al -
50.
74,
Mal
e -
47.
93, F
emal
e -
2.8
1 P
erce
nt
201
4-1
5 L
abo
ur F
orc
e S
urv
ey
T8
.5
8.5
.1 A
vera
ge
hour
ly e
arn
ings
of
fem
ale
and
m
ale
emp
loye
es, b
y oc
cup
atio
n, a
ge a
nd
per
sons
wit
h d
isab
ilit
ies
Tot
al=
84.
21 p
/h, M
ale=
83.
80
p/h
, Fem
ale=
9
0.2
1 p
/h
per
hou
r 2
014
-15
LF
S
T8
.5
8.5
.2 U
nem
plo
ymen
t ra
te, b
y se
x, a
ge a
nd
per
sons
wit
h d
isab
ilit
ies
Tot
al=
7.7
1%
, M
ale=
5.7
5%
, F
emal
e=
15.
77%
%
2
014
-15
Lab
our
Fo
rce
Su
rvey
T9
.2
9.2
.2 M
anuf
actu
rin
g em
plo
ymen
t as
a
pro
por
tio
n o
f to
tal
empl
oym
ent
Tot
al=
11.
26%
, Mal
e= 9
.35%
, F
emal
e=1
.91%
%
2
014
-15
Pak
ista
n L
abo
ur F
orc
e S
urv
ey
T11
.7
11.7
.2 P
ropo
rtio
n o
f pe
rson
s vi
ctim
of
phy
sica
l or
sex
ual
har
assm
ent,
by
sex,
age
, d
isab
ilit
y st
atu
s an
d p
lace
of
occ
urre
nce
, in
th
e p
revi
ou
s 12
mo
nth
s
56.
6 P
erce
nt
201
2-1
3 P
DH
S
T1
5.1
15.
1.1
For
est
area
as
a pr
opo
rtio
n of
to
tal
land
ar
ea
17
per
cen
t 2
016
Fo
rest
Dev
elo
pm
ent
Co
rpo
rati
on.
T1
6.1
16.
1.3
Pro
port
ion
of
popu
lati
on s
ubje
cted
to
phy
sica
l, p
sych
olo
gica
l o
r se
xual
vio
len
ce i
n
the
prev
iou
s 12
mo
nth
s
56.
6 p
erce
nt
201
2-1
3 P
DH
S
SUSTAINABLE DEVELOPMENT GOALS (SDGs)
PAKISTAN'S PERSPECTIVEDATA
REPORTING GAP

56
Pro
vin
cial
– S
indh
3
Tar
get
C
od
e In
dic
ato
r D
escr
ipti
on
V
alu
e
Un
it
Yea
r
Sou
rce
T1
.2
1.2
.2 P
ropo
rtio
n o
f m
en, w
om
en a
nd
chil
dre
n o
f al
l ag
es l
ivin
g in
p
over
ty i
n a
ll i
ts d
imen
sio
ns a
ccor
din
g to
nat
ion
al d
efin
itio
ns
Ove
rall
= 4
3.1
%
2
014
-15
Pla
nni
ng
Co
mm
issi
on/
PS
LM
R
ura
l=7
5.5
, Urb
an=
10.6
%
2
014
-15
Pla
nni
ng
Co
mm
issi
on/
PS
LM
T
1.4
1
.4.1
Pro
port
ion
of
pop
ulat
ion
livi
ng
in h
ouse
hol
ds
wit
h ac
cess
to
b
asic
ser
vice
s Im
pro
ved
wat
er s
ourc
e=8
6.0
, F
lush
To
ilet
=6
7, E
lect
rici
ty =
9
1.0
(L
igh
tin
g),
Gas
for
co
oki
ng=
56.0
%
201
4-1
5 P
SL
M
T1
.5
F
lood
and
Rai
n, 2
88 p
eop
le d
ied
in
20
12
Num
ber
201
3 M
ult
i H
azar
d C
onti
genc
y P
lan
20
13
T1
.a
1.a
.1 P
rop
orti
on o
f re
sour
ces
allo
cate
d by
th
e go
vern
men
t d
irec
tly
to
pov
erty
red
ucti
on
pro
gram
mes
6
3.1
%
201
4-1
5 P
RS
P, M
inis
try
of F
inan
ace,
G
OP
T1
.a
1.a
.2 P
rop
orti
on o
f to
tal
gove
rnm
ent
spen
din
g o
n es
sen
tial
ser
vice
s (e
duca
tio
n, h
ealt
h a
nd s
ocia
l pr
ote
ctio
n)
27.
28
%
201
4-1
5 P
RS
P, G
OP
& B
udge
t A
nal
ysis
GO
S
T1
.b
1.b
.1 P
ropo
rtio
n o
f go
vern
men
t re
curr
ent
and
cap
ital
sp
endi
ng
to
sect
ors
th
at d
ispr
opo
rtio
nat
ely
ben
efit
wo
men
, th
e p
oor
and
vu
lner
able
gro
ups
0.9
1 %
2
014
-15
PR
SP
, GO
P &
Bud
get
An
alys
is G
OS
T1
.b
63.
08
%
201
4-1
5 P
RS
P, G
OP
& B
udge
t A
nal
ysis
GO
S
T2
.2
2.2
.1 P
reva
lenc
e of
stu
ntin
g (h
eigh
t fo
r ag
e <
-2 s
tan
dar
d d
evia
tio
n fr
om
th
e m
edia
n o
f th
e W
orld
Hea
lth
Org
aniz
atio
n (
WH
O)
Ch
ild
G
row
th S
tan
dar
ds)
amon
g ch
ildr
en u
nde
r 5
yea
rs o
f ag
e
Mo
der
ate=
20.
8%
, S
ever
e=26
.5%
%
2
011
Nat
ion
al N
utri
tion
Su
rvey
T2
.2
2.2
.2 P
reva
lenc
e of
mal
nu
trit
ion
(wei
ght
for
hei
ght
>+
2 o
r <
-2
stan
dar
d d
evia
tio
n f
rom
th
e m
edia
n of
th
e W
HO
Ch
ild
Gro
wth
S
tan
dard
s) a
mo
ng
chil
dre
n u
nder
5 y
ears
of
age,
by
type
(w
asti
ng
and
o
verw
eigh
t)
Stu
ntin
g= 4
9.0%
, W
asti
ng=
17.
0%,
Und
erw
eigh
t=40
.0%
%
201
1 N
atio
nal
Nut
riti
on S
urv
ey
T3
.1
3.1
.1 M
ater
nal
mo
rtal
ity
rati
o
31
4 P
er 1
00,0
00
live
bir
th
200
6-0
7 P
DH
S
T3.
1 3
.1.2
Pro
port
ion
of
birt
hs
atte
nded
by
skil
led
hea
lth
per
sonn
el
60.
5 %
2
013
-14
PD
HS
T3
.2
3.2
.1 U
nder
-five
mor
tali
ty r
ate
1
04
Per
100
0 li
ve b
irth
2
014
MIC
S
3 If
yo
u ha
ve a
ny
com
men
t or
sug
gest
ion
on
the
rep
ort
, d
ata,
dat
a so
urce
or
a ge
nera
l co
mm
ent,
kin
dly
em
ail
it t
o m
.ali
kem
al@
gmai
l.co
m
or
ali.
kem
al@
undp
.org
or
Nad
eem
.ahm
ed@
undp
.org
.pk
SUSTAINABLE DEVELOPMENT GOALS (SDGs)
PAKISTAN'S PERSPECTIVEDATA
REPORTING GAP
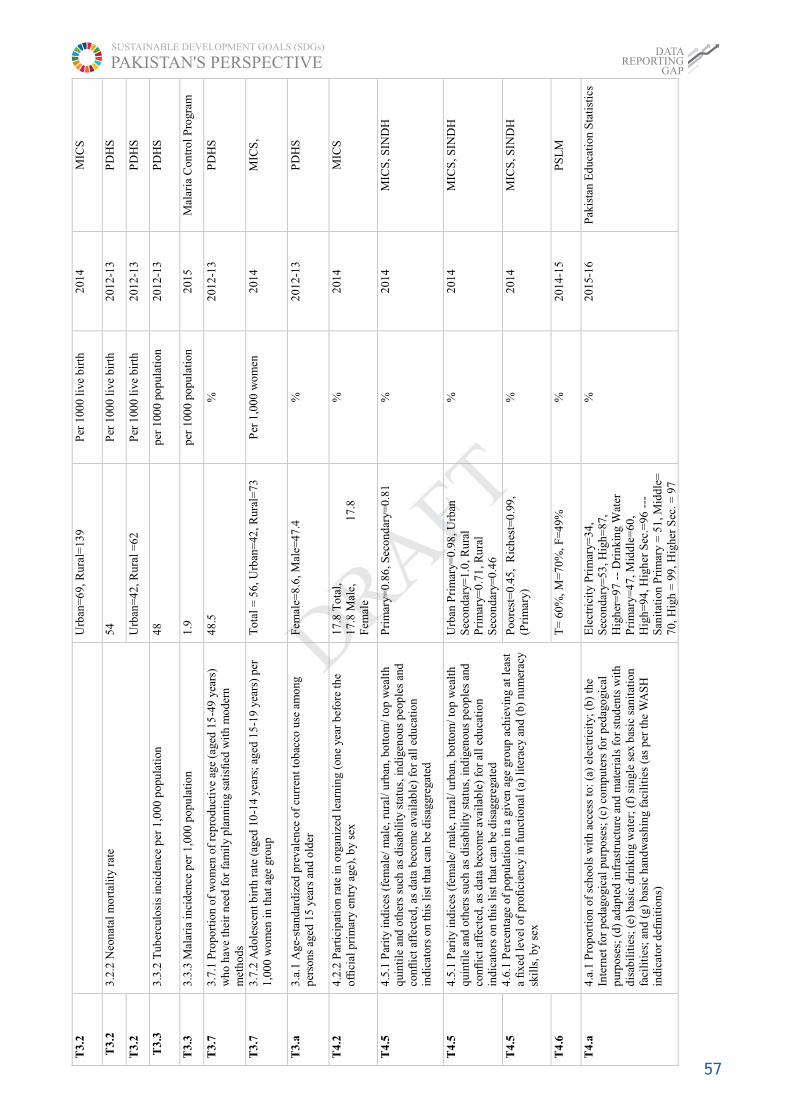
57
T3
.2
Urb
an=
69,
Rur
al=
139
P
er 1
000
live
bir
th
201
4 M
ICS
T3
.2
3.2
.2 N
eon
atal
mo
rtal
ity
rate
5
4 P
er 1
000
live
bir
th
201
2-1
3 P
DH
S
T3
.2
Urb
an=
42,
Rur
al =
62
P
er 1
000
live
bir
th
201
2-1
3 P
DH
S
T3
.3
3.3
.2 T
ub
ercu
losi
s in
cid
ence
per
1,0
00 p
opul
atio
n
48
per
100
0 po
pula
tion
2
012
-13
PD
HS
T3
.3
3.3
.3 M
alar
ia i
nci
den
ce p
er 1
,000
pop
ula
tion
1
.9
per
100
0 po
pula
tion
2
015
Mal
aria
Con
trol
Pro
gram
T3
.7
3.7
.1 P
ropo
rtio
n o
f w
om
en o
f re
pro
duct
ive
age
(age
d 1
5-4
9 y
ears
) w
ho
hav
e th
eir
nee
d f
or
fam
ily
plan
nin
g sa
tisfi
ed w
ith
mo
dern
m
eth
ods
48.
5 %
2
012
-13
PD
HS
T3
.7
3.7
.2 A
dol
esce
nt
bir
th r
ate
(age
d 10
-14
year
s; a
ged
15
-19
year
s) p
er
1,0
00
wo
men
in
th
at a
ge g
rou
p T
otal
= 5
6, U
rban
=42
, Rur
al=
73
Per
1,0
00 w
om
en
201
4 M
ICS
,
T3
.a
3.a
.1 A
ge-s
tand
ard
ized
pre
vale
nce
of
curr
ent
tob
acco
use
am
ong
p
erso
ns a
ged
15 y
ears
and
old
er
Fem
ale=
8.6
, Mal
e=4
7.4
%
2
012
-13
PD
HS
T4
.2
4.2
.2 P
arti
cip
atio
n r
ate
in o
rgan
ized
lea
rnin
g (o
ne
year
bef
ore
th
e o
ffici
al p
rim
ary
entr
y ag
e), b
y se
x
17.
8 T
otal
, 1
7.8
Mal
e,
17.
8
Fem
ale
%
201
4 M
ICS
T4
.5
4.5
.1 P
arit
y in
dic
es (
fem
ale/
mal
e, r
ural
/ u
rban
, bo
ttom
/ to
p w
ealt
h q
uin
tile
and
oth
ers
such
as
dis
abil
ity
stat
us, i
nd
igen
ous
peo
ple
s an
d co
nfl
ict
affe
cted
, as
dat
a b
eco
me
avai
lab
le)
for
all
edu
cati
on
indi
cato
rs o
n th
is l
ist
that
can
be
dis
aggr
egat
ed
Pri
mar
y=0
.86
, Sec
ond
ary=
0.8
1
%
201
4 M
ICS
, SIN
DH
T4
.5
4.5
.1 P
arit
y in
dic
es (
fem
ale/
mal
e, r
ural
/ u
rban
, bo
ttom
/ to
p w
ealt
h q
uin
tile
and
oth
ers
such
as
dis
abil
ity
stat
us, i
nd
igen
ous
peo
ple
s an
d co
nfl
ict
affe
cted
, as
dat
a b
eco
me
avai
lab
le)
for
all
edu
cati
on
indi
cato
rs o
n th
is l
ist
that
can
be
dis
aggr
egat
ed
4.6
.1 P
erce
nta
ge o
f p
opu
lati
on
in a
giv
en a
ge g
roup
ach
ievi
ng
at l
east
a
fix
ed l
evel
of
pro
fici
ency
in
fu
ncti
ona
l (a
) li
tera
cy a
nd
(b)
nu
mer
acy
skil
ls,
by s
ex
Urb
an P
rim
ary=
0.9
8,
Urb
an
Sec
on
dary
=1
.0, R
ura
l P
rim
ary=
0.7
1, R
ura
l S
eco
nda
ry=
0.4
6
%
201
4 M
ICS
, SIN
DH
T4
.5
Po
ore
st=
0.4
5,
Ric
hes
t=0
.99
, (P
rim
ary)
%
2
014
MIC
S, S
IND
H
T4
.6
T=
60
%,
M=
70%
, F
=4
9%
%
201
4-1
5 P
SL
M
T4
.a
4.a
.1 P
rop
orti
on o
f sc
hoo
ls w
ith
acce
ss t
o: (
a) e
lect
rici
ty;
(b)
the
Inte
rnet
for
ped
ago
gica
l pu
rpo
ses;
(c)
co
mpu
ters
fo
r p
edag
ogi
cal
pur
pos
es;
(d)
adap
ted
infr
astr
uct
ure
and
mat
eria
ls f
or
stud
ents
wit
h
dis
abil
itie
s; (
e) b
asic
dri
nki
ng
wat
er;
(f)
sin
gle
sex
bas
ic s
anit
atio
n fa
cili
ties
; an
d (
g) b
asic
han
dw
ashi
ng
faci
liti
es (
as p
er t
he
WA
SH
in
dica
tor
defi
nit
ion
s)
Ele
ctri
city
Pri
mar
y=34
, S
eco
nda
ry=
53
, Hig
h=
87,
Hig
her
=9
7 --
Dri
nki
ng W
ater
P
rim
ary=
47
, Mid
dle
=60
, H
igh
=9
4, H
igh
er S
ec.=
96 -
--
San
itat
ion
Pri
mar
y =
51
, Mid
dle=
7
0, H
igh
= 9
9,
Hig
her
Sec
. = 9
7
%
201
5-1
6 P
akis
tan
Ed
ucat
ion
Sta
tist
ics
SUSTAINABLE DEVELOPMENT GOALS (SDGs)
PAKISTAN'S PERSPECTIVEDATA
REPORTING GAP

58
T5
.5
5.5
.1 P
ropo
rtio
n o
f se
ats
held
by
wo
men
in
nat
iona
l p
arli
amen
ts a
nd
loca
l go
vern
men
ts
18.
5 P
erce
nt
201
7 h
ttp
://w
ww
.pak
p.go
v.p
k/2
01
3/m
emb
ers-
dir
ecto
ry/w
om
en-r
eser
ved
-se
ats/
T5
.5
5.5
.2 P
ropo
rtio
n o
f w
om
en i
n m
anag
eria
l p
osit
ions
0
.97
Per
cen
t 2
014
-15
LF
S
T6
.2
6.2
.1 P
ropo
rtio
n o
f po
pul
atio
n us
ing
safe
ly m
anag
ed s
anit
atio
n se
rvic
es,
incl
udi
ng
a h
and
-was
hing
fac
ilit
y w
ith
soa
p an
d w
ater
6
7 P
erce
nt
201
4-1
5 P
SL
M
T7
.1
7.1
.1 P
ropo
rtio
n o
f po
pul
atio
n w
ith
acc
ess
to e
lect
rici
ty
91.
28
%
201
4-1
5 P
SL
M
T7
.1
7.1
.2 P
ropo
rtio
n o
f po
pul
atio
n w
ith
pri
mar
y re
lian
ce o
n c
lean
fue
ls
and
tec
hno
logy
5
6.3
4 %
2
014
-15
PS
LM
T8
.3
8.3
.1 P
ropo
rtio
n o
f in
form
al e
mpl
oym
ent
in n
on-a
gric
ultu
re
emp
loym
ent,
by
sex
O
vera
ll=
40
.30,
Fem
ale=
38.
12,
Mal
e=2
.18
%
201
4-1
5 L
FS
T8
.5
8.5
.1 A
vera
ge
hour
ly e
arn
ings
of
fem
ale
and
mal
e em
plo
yees
, by
occ
upat
ion
, age
an
d pe
rson
s w
ith
dis
abil
itie
s T
otal
=8
9.85
p/h
, Mal
e=9
1.7
4 p/
h,
Fem
ale=
63
.55
p/h
p
er h
our
201
4-1
5 L
FS
T8
.5
8.5
.2 U
nem
plo
ymen
t ra
te,
by s
ex,
age
and
per
sons
wit
h d
isab
ilit
ies
Tot
al=
4.6
6%
, M
ale=
3.5
7%
, F
emal
e= 1
0.9
4%
%
201
4-1
5 L
FS
T9
.2
9.2
.2 M
anuf
actu
rin
g em
plo
ymen
t as
a p
ropo
rtio
n o
f to
tal
empl
oym
ent
Tot
al=
15.
17%
, Mal
e= 1
3.6
6%
, F
emal
e=1
.51%
%
2
014
-15
LF
S
T11
.7
11.7
.2 P
ropo
rtio
n o
f pe
rson
s vi
ctim
of
phy
sica
l o
r se
xual
har
assm
ent,
b
y se
x, a
ge, d
isab
ilit
y st
atu
s an
d p
lace
of
occ
urr
ence
, in
th
e pr
evio
us
12
mon
ths
25
Per
cen
t 2
012
-13
PD
HS
T1
6.1
16.
1.3
Pro
port
ion
of
po
pula
tio
n s
ub
ject
ed t
o p
hysi
cal,
psy
chol
ogi
cal
or
sexu
al v
iole
nce
in
th
e p
revi
ous
12
mo
nth
s 2
5 p
erce
nt
201
2-1
3 P
DH
S
SUSTAINABLE DEVELOPMENT GOALS (SDGs)
PAKISTAN'S PERSPECTIVEDATA
REPORTING GAP

59
Pro
vin
cial
– B
aloc
his
tan
4
Ta
rget
C
od
e In
dic
ato
r D
escr
ipti
on
V
alu
e
Un
it
Yea
r
Sou
rce
T1
.2
1.2
.2 P
ropo
rtio
n o
f m
en, w
om
en a
nd
chil
dre
n o
f al
l ag
es l
ivin
g in
p
over
ty i
n a
ll i
ts d
imen
sio
ns a
ccor
din
g to
nat
ion
al d
efin
itio
ns
Ove
rall
= 7
1.2
%
2
014
-15
Pla
nni
ng
Co
mm
issi
on
/PS
LM
Ru
ral=
84.
6,
Urb
an=
37.
7
%
201
4-1
5 P
lan
nin
g C
om
mis
sio
n/P
SL
M
T1
.a
1.a
.1 P
rop
orti
on o
f re
sour
ces
allo
cate
d by
th
e go
vern
men
t di
rect
ly t
o p
over
ty r
educ
tio
n p
rogr
amm
es
71.
9 %
2
014
-15
PR
SP
, Min
istr
y of
Fin
anac
e, G
OP
T1
.a
1.a
.2 P
rop
orti
on o
f to
tal
gove
rnm
ent
spen
din
g on
ess
enti
al s
ervi
ces
(edu
cati
on,
hea
lth
and
soc
ial
pro
tect
ion
) 3
2.3
0 %
2
014
-15
PR
SP
, GO
P &
Bud
get
An
alys
is G
OS
T2
.2
2.2
.1 P
reva
lenc
e of
stu
ntin
g (h
eigh
t fo
r ag
e <
-2 s
tan
dar
d d
evia
tio
n fr
om
th
e m
edia
n of
th
e W
orl
d H
ealt
h O
rgan
izat
ion
(WH
O)
Ch
ild
Gro
wth
S
tan
dard
s) a
mo
ng
chil
dre
n u
nder
5 y
ears
of
age
Mo
der
ate=
24.
1%
, S
ever
e=2
5.1
%
Per
cen
t 2
011
Nat
ion
al N
utri
tion
Su
rvey
T2
.2
2.2
.2 P
reva
lenc
e of
mal
nu
trit
ion
(wei
ght
for
hei
ght
>+
2 o
r <
-2 s
tand
ard
d
evia
tio
n f
rom
th
e m
edia
n o
f th
e W
HO
Ch
ild
Gro
wth
Sta
ndar
ds)
am
on
g ch
ildr
en u
nder
5 y
ears
of
age,
by
type
(w
asti
ng a
nd o
verw
eigh
t)
Stu
ntin
g= 4
8.0%
, W
asti
ng=
16.
0%,
Und
erw
eigh
t=24
.0%
Per
cen
t 2
011
Nat
ion
al N
utri
tion
Su
rvey
3
.1.1
Mat
erna
l m
ort
alit
y ra
tio
7
85
Per
100
,00
0 li
ve
bir
th
200
6-0
7 P
DH
S
3
.1.2
Pro
port
ion
of
birt
hs
atte
nded
by
skil
led
heal
th p
erso
nnel
1
7.8
%
201
2-1
3 P
DH
S
3
.2.1
Und
er-fi
ve m
orta
lity
rat
e
111
%
2
012
-13
PD
HS
3
.2.2
Neo
nat
al m
ort
alit
y ra
te
63
Per
100
0 li
ve b
irth
2
012
-13
PD
HS
T3
.3
3.3
.2 T
ub
ercu
losi
s in
cid
ence
per
1,0
00 p
opul
atio
n
63
%
201
2-1
3 P
DH
S
T3
.3
3.3
.3 M
alar
ia i
nci
den
ce p
er 1
,000
pop
ula
tion
9
9.6
per
100
0 p
opul
atio
n 2
015
Mal
aria
Con
trol
Pro
gram
T3
.7
3.7
.1 P
ropo
rtio
n o
f w
om
en o
f re
pro
duct
ive
age
(age
d 1
5-4
9 y
ears
) w
ho
hav
e th
eir
nee
d f
or
fam
ily
plan
ning
sat
isfi
ed w
ith
mo
dern
met
hod
s 3
2.3
%
201
2-1
3 P
DH
S
4 If
yo
u h
ave
any
com
men
t or
sugg
esti
on o
n th
e re
por
t, d
ata,
dat
a so
urce
or
a ge
nera
l co
mm
ent,
kin
dly
em
ail
it t
o
m.a
like
mal
@gm
ail.
com
o
r al
i.ke
mal
@un
dp.o
rg o
r N
adee
m.a
hm
ed@
und
p.o
rg.p
k
SUSTAINABLE DEVELOPMENT GOALS (SDGs)
PAKISTAN'S PERSPECTIVEDATA
REPORTING GAP

60
T3
.a
3.a
.1 A
ge-s
tand
ard
ized
pre
vale
nce
of
curr
ent
tob
acco
use
am
ong
per
son
s ag
ed 1
5 y
ears
and
old
er
Fem
ale=
29
, M
ale=
53
.6
%
201
2-1
3 P
DH
S
T4.
5 4
.5.1
Par
ity
ind
ices
(fe
mal
e/ m
ale,
rur
al/
urb
an, b
ott
om
/ to
p w
ealt
h q
uin
tile
and
oth
ers
such
as
dis
abil
ity
stat
us,
indi
gen
ous
peop
les
and
con
flic
t af
fect
ed, a
s d
ata
bec
om
e av
aila
ble
) fo
r al
l ed
uca
tio
n in
dica
tors
o
n th
is l
ist
that
can
be
dis
aggr
egat
ed
GP
I -
0.8
3, G
PS
- 0
.60
uni
t 2
010
M
ICS
T4
.6
4.6
.1 P
erce
nta
ge o
f p
opu
lati
on
in a
giv
en a
ge g
roup
ach
ievi
ng
at l
east
a
fixe
d l
evel
of
pro
fici
ency
in
func
tio
nal
(a)
lit
erac
y an
d (
b) n
um
erac
y sk
ills
, b
y se
x
T=
44
%,
M=
61%
, F
=2
5%
%
201
4-1
5 P
SL
M
T4
.a
4.a
.1 P
rop
orti
on o
f sc
hoo
ls w
ith
acce
ss t
o: (
a) e
lect
rici
ty;
(b)
the
Inte
rnet
fo
r pe
dago
gica
l p
urpo
ses;
(c)
com
pute
rs f
or
ped
ago
gica
l pu
rpos
es;
(d)
adap
ted
in
fras
truc
ture
an
d m
ater
ials
fo
r st
uden
ts w
ith
dis
abil
itie
s; (
e)
bas
ic d
rink
ing
wat
er;
(f)
sin
gle
sex
bas
ic s
anit
atio
n f
acil
itie
s; a
nd
(g)
bas
ic h
andw
ash
ing
faci
liti
es (
as p
er t
he W
AS
H i
ndi
cato
r de
fini
tion
s)
Ele
ctri
city
P
rim
ary=
15
, Hig
h=
65,
Hig
her
Sec
.=8
1 --
D
rin
kin
g W
ater
P
rim
ary=
52
, Hig
h=
72,
Hig
her
Sec
.=8
6 --
- S
anit
atio
n P
rim
ary
=
13,
Hig
h =
69,
Hig
her
Sec
. =
76
%
201
5-1
6 P
akis
tan
Ed
ucat
ion
Sta
tist
ics
T5
.5
5.5
.1 P
ropo
rtio
n o
f se
ats
held
by
wo
men
in
nat
iona
l p
arli
amen
ts a
nd
loca
l go
vern
men
ts
18.
5 P
erce
nt
201
7 h
ttp
://w
ww
.pak
p.g
ov.
pk/2
013
/mem
ber
s-d
irec
tory
/wo
men
-res
erve
d-s
eats
/
T5
.5
5.5
.2 P
ropo
rtio
n o
f w
om
en i
n m
anag
eria
l p
osit
ions
0
.61
Per
cen
t 2
014
-15
LF
S
T6
.2
6.2
.1 P
ropo
rtio
n o
f po
pul
atio
n us
ing
safe
ly m
anag
ed s
anit
atio
n se
rvic
es,
incl
udin
g a
han
d-w
ashi
ng
faci
lity
wit
h so
ap a
nd w
ater
3
1 P
erce
nt
201
4-1
5 P
SL
M
T7
.1
7.1
.1 P
ropo
rtio
n o
f po
pula
tion
wit
h ac
cess
to
ele
ctri
city
8
0.7
%
201
4-1
5 P
SL
M
T7
.1
7.1
.2 P
ropo
rtio
n o
f po
pul
atio
n w
ith
pri
mar
y re
lian
ce o
n c
lean
fue
ls a
nd
tech
nol
ogy
2
4.7
%
201
4-1
5 P
SL
M
T8
.3
8.3
.1 P
ropo
rtio
n o
f in
form
al e
mpl
oym
ent
in n
on-a
gric
ultu
re
emp
loym
ent,
by
sex
O
vera
ll=
40
.30,
F
emal
e=3
8.1
2,
Mal
e=2
.18
%
201
4-1
5 L
FS
T8
.5
8.5
.1 A
vera
ge
hour
ly e
arn
ings
of
fem
ale
and
mal
e em
plo
yees
, by
occ
upat
ion
, age
an
d pe
rson
s w
ith
dis
abil
itie
s T
otal
=1
03.6
2 p
/h,
Mal
e=1
03.
25
p/h
, F
emal
e= 1
12.
98 p
/h
per
hou
r 2
014
-15
LF
S
T8
.5
8.5
.2 U
nem
plo
ymen
t ra
te, b
y se
x, a
ge a
nd p
erso
ns w
ith
dis
abil
itie
s T
otal
=3
.92
%,
Mal
e=2
.84%
, Fem
ale=
8
.55
%
%
201
4-1
5 L
FS
SUSTAINABLE DEVELOPMENT GOALS (SDGs)
PAKISTAN'S PERSPECTIVEDATA
REPORTING GAP

61
T9
.2
9.2
.2 M
anuf
actu
rin
g em
plo
ymen
t as
a p
ropo
rtio
n o
f to
tal
empl
oym
ent
Tot
al=
11.
34%
, Mal
e=
4.3
9%
, F
emal
e=6.
95
%
%
201
4-1
5 L
FS
T11
.7
11.7
.2 P
ropo
rtio
n o
f pe
rson
s vi
ctim
of
phy
sica
l o
r se
xual
har
assm
ent,
by
sex,
age
, dis
abil
ity
stat
us
and
pla
ce o
f o
ccu
rren
ce,
in t
he p
revi
ous
12
mo
nth
s
42.
8 %
2
012
-13
PD
HS
T1
6.1
16.
1.3
Pro
port
ion
of
popu
lati
on s
ubje
cted
to
phy
sica
l, p
sych
olo
gica
l or
se
xual
vio
lenc
e in
the
pre
viou
s 12
mo
nth
s 4
2.8
%
201
2-1
3 P
DH
S
SUSTAINABLE DEVELOPMENT GOALS (SDGs)
PAKISTAN'S PERSPECTIVEDATA
REPORTING GAP
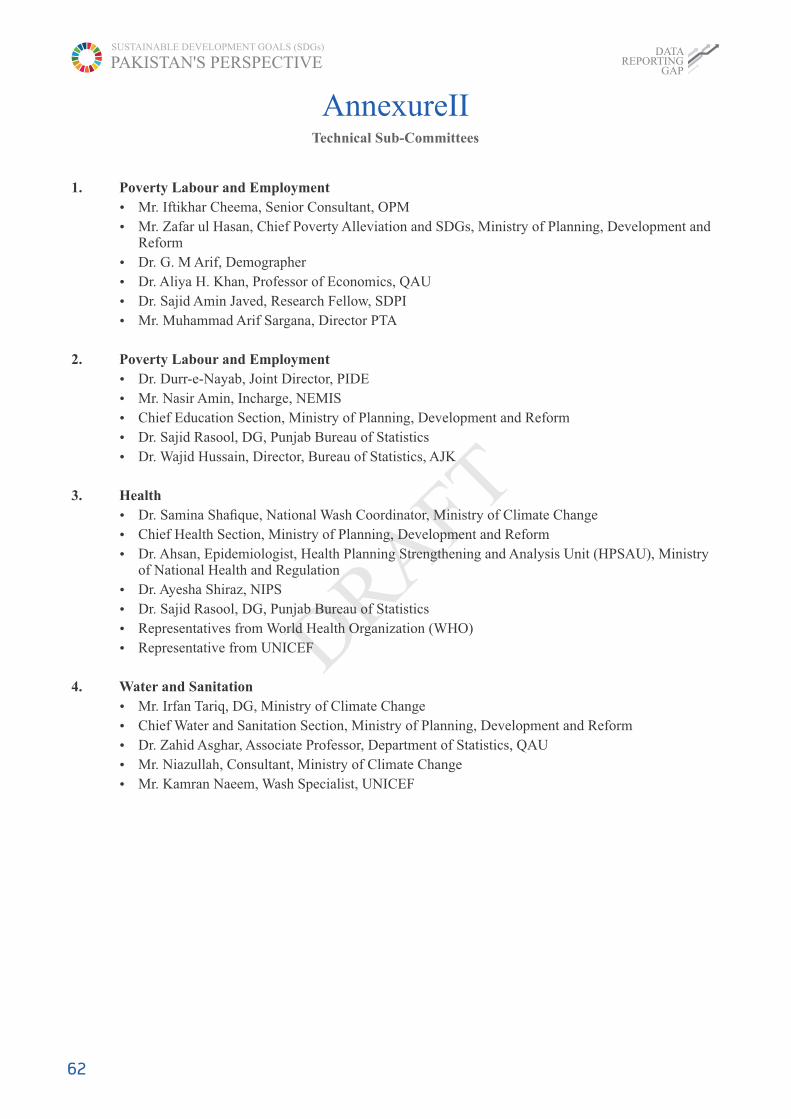
62
AnnexureIITechnical Sub-Committees
1. Poverty Labour and Employment
Ÿ Mr. Iftikhar Cheema, Senior Consultant, OPM
Ÿ Mr. Zafar ul Hasan, Chief Poverty Alleviation and SDGs, Ministry of Planning, Development and Reform
Ÿ Dr. G. M Arif, Demographer
Ÿ Dr. Aliya H. Khan, Professor of Economics, QAU
Ÿ Dr. Sajid Amin Javed, Research Fellow, SDPI
Ÿ Mr. Muhammad Arif Sargana, Director PTA
2. Poverty Labour and Employment
Ÿ Dr. Durr-e-Nayab, Joint Director, PIDE
Ÿ Mr. Nasir Amin, Incharge, NEMIS
Ÿ Chief Education Section, Ministry of Planning, Development and Reform
Ÿ Dr. Sajid Rasool, DG, Punjab Bureau of Statistics
Ÿ Dr. Wajid Hussain, Director, Bureau of Statistics, AJK
3. Health
Ÿ Dr. Samina Shafique, National Wash Coordinator, Ministry of Climate Change
Ÿ Chief Health Section, Ministry of Planning, Development and Reform
Ÿ Dr. Ahsan, Epidemiologist, Health Planning Strengthening and Analysis Unit (HPSAU), Ministry of National Health and Regulation
Ÿ Dr. Ayesha Shiraz, NIPS
Ÿ Dr. Sajid Rasool, DG, Punjab Bureau of Statistics
Ÿ Representatives from World Health Organization (WHO)
Ÿ Representative from UNICEF
4. Water and Sanitation
Ÿ Mr. Irfan Tariq, DG, Ministry of Climate Change
Ÿ Chief Water and Sanitation Section, Ministry of Planning, Development and Reform
Ÿ Dr. Zahid Asghar, Associate Professor, Department of Statistics, QAU
Ÿ Mr. Niazullah, Consultant, Ministry of Climate Change
Ÿ Mr. Kamran Naeem, Wash Specialist, UNICEF
SUSTAINABLE DEVELOPMENT GOALS (SDGs)
PAKISTAN'S PERSPECTIVEDATA
REPORTING GAP
63
AnnexureIIIData Availability in Pakistan
First Cut
October 2016
Introduction:
The Mainstreaming, Acceleration, and Policy Support (MAPS) project for SDGs hinges on the ability of the national statistical system to provide the basis for localization and mainstreaming SDGs in national policies, plans, and investments. While there are several discrete steps in the localization and prioritization process, however, this data gap analysis provides the starting point. The following steps are crucial for operationalizing the MAPS in country context:
1. Strengthening the national data system to report on SDGs;
2. Strengthening the national data system to provide benchmarks, midterm and long term targets;
3. Provide an objective basis of prioritizing SDGs in a global and local context;
4. Create mapping between the earmarked resources and SDG targets; and,
5. Create progress reviews and provide feedback to national and sub national SDG plans.
The whole process of aligning national statistical systems with SDGs begins from taking an objective stocktaking of this system vis-à-vis SDGs. This process has three phases. The first phase consists of a desk review to assess the availability of data and prepare a provisional document for broader stakeholder consultations and validation. The second phase consists of nation-wide stakeholder consultations to match indicators with identified provincial development priorities and local context. The third phase is to establish standards for each indicator at the federal, provincial and district levels. The third phase will produce a report on the main findings of consolations.
This report presents the first part of a three-phased process of analyzing the data gaps for SDG indicators. The report is based on a desk review of all major secondary data sources. The result of this review is a detailed spreadsheet depicting the status of data availability for required disaggregation, and also the level of effort needed to bridge the gaps. The detailed information has been summarized into summary tables depicting data availability for indicators by administrative levels and demographic groups. Finally, the analysis also shows the level of effort and resources, by showing the added coverage of SDG indicators by minor, moderate and major efforts.
Pakistan's reporting needs context on SDGs:
Pakistan has made significant progress within the MDG framework, but a lot more remains to be done. Apart from the MDG target of reducing, by half, the proportion of population living below poverty line, Pakistan has not demonstrated a similar impressive progress on most MDG targets. Of the 16 targets and 41 indicators of the MDGs, time series data available for 33 indicators revealed that Pakistan achieved targets for only three indicators. In total, Pakistan ended up to be on track on 9
17indicators, and off track on 24.
Pakistan's sub optimal performance on MDGs can be attributed to many reasons, but most important is the dichotomous nature of the economy which shows decent progress in income indicators as opposed unsatisfactory growth on social indicators. Adding to these lagging social indicators, is the unpreparedness to localize global environmental and natural resources' goals into the national development agenda. This landscape was clear to the present government which prompted them to create an alignment of the long term development program, Vision 2025, with SDGs. The Vision 2025 has seven pillars and five enablers and these pillars and enablers map nicely to the SDG goals.
MDGs differ from SDGs in several qualitative ways and therefore it is vital to step back from the data system developed to monitor the MDGs, and develop a novel system based on data needs arising from commitment to the SDGs.
The SDGs explicitly recognize that our modes of production and consumption, and resulting prosperity, should not be at the cost of the planet's sustainability. Leaving no one behind and being people centric is a central feature of the SDGs. This requires disaggregation of data by gender, regions, and different kinds of marginalization, subsequently making data collection and reporting needs much bigger than that of the MDGs.
The SDGs is, in essence, a holistic agenda. This means that the division between global and local is, in reality, meant for translating the global agenda into national plans, and not for making convenient, yet wrong, choices.
SUSTAINABLE DEVELOPMENT GOALS (SDGs)
PAKISTAN'S PERSPECTIVEDATA
REPORTING GAP
17. Pakistan progress on MDGs. http://www.pk.undp.org/content/pakistan/en/home/post-2015/mdgoverview/

64
Data Sources and Data Needs:
The desk review considered these aspects while analyzing the data gaps. In Pakistan, there are two broad sources of socioeco-nomic data. First is from surveys conducted by public or private sector organizations, and second is the data available at the institutional level. The desk review considered major available secondary sources of information for analyzing data gaps, including the following:
1. Pakistan social and living standards measurement (PSLM)
2. Household income and expenditure survey (HIES)
3. Labor force survey (LFS)
4. Agriculture census
5. Agriculture statistics
6. National accounts
7. Multiple indicators cluster survey (MICS)
8. Pakistan demographic and health survey (PDHS)
9. National nutrition survey (NNS)
10. Socioeconomic registry of BISP
11. Energy Statistics
12. Public Sector Development Expenditures (PSDP)
13. Annual development Plan (ADP)
14. PIFRA
15. National Disaster Management Authority (NDMA)
16. Provincial Disaster Management Authority (PDMA)
17. Ministry of National Food Security and Research (MoNFSR)
18. Pakistan Agriculture Research Council (PARC)
19. Ministry of Climate Change (MoCC)
20. Economic Affairs Division (EAD)
21. Ministry of National Health Services Regulation and Coordination (MoNHSRC)
22. Ministry of Federal Education and Professional Training (MoFEPT)
23. National Education Assessment System (NEAS)
24. Education Management and Information System (EMIS)
25. Annual Status of Education Report (ASR)
Pakistan bureau of statistics (PBS) is the major organization involved in the collection of socioeconomic data and also for compiling national accounts. At the federal and provincial levels, several ministries/departments are responsible for collect-ing social data at the institutional level. Besides these, there are various other agencies in the public and private sectors
18gathering data on various socioeconomic, natural resources, and climate indicators.
The review process followed the guidance by Inter-agency Expert Group on SDG Indicators. They classify data according to four codes:
1. First code shows the availability of regular data and also availability of standards
2. Second code shows that data is not regular but standards area available
3. Third code shows that neither data nor standards are available and finally
8. Fourth code shows that indicator is not relevant.
In the aforementioned codes, code 1 represents the ideal situation, code 2 pertains to the fact that small changes are required in order to make data available at the respective level, whilst code 3 presents a bigger challenge. With an objective to codify the data availability for all indicators at national and sub national levels, as well as to create additional information on the following, the review process analyzed each indicator for the following:
1. Indicator is mean of implementation (MoI) or output indicator (OI)
2. How many other indicators an indicator is linked with?
3. Levels of disaggregation required
4. Sources of data
SUSTAINABLE DEVELOPMENT GOALS (SDGs)
PAKISTAN'S PERSPECTIVEDATA
REPORTING GAP
18. For further reading, please refer to “Compilation of Metadata for the Proposed Global Indicators for the Review of the 2030 Agenda for Sustainable Development.” Available at https://unstats.un.org/sdgs/iaeg-sdgs/metadata-compilation/
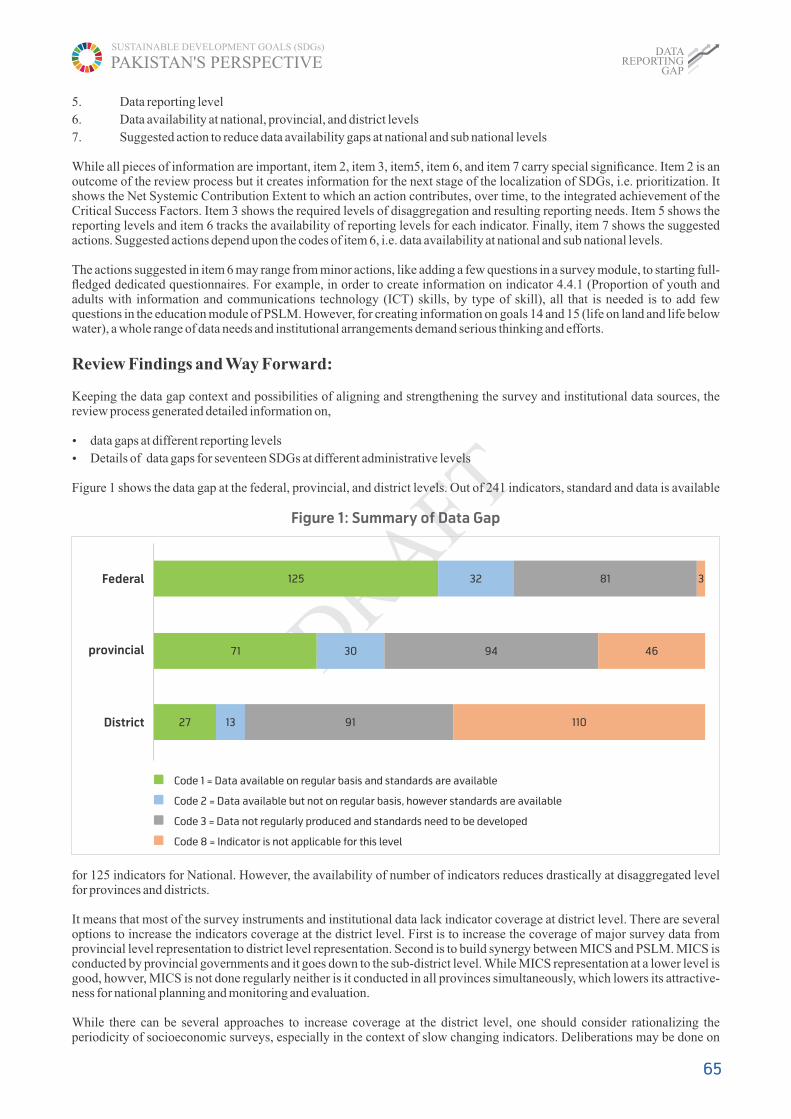
5. Data reporting level
6. Data availability at national, provincial, and district levels
7. Suggested action to reduce data availability gaps at national and sub national levels
While all pieces of information are important, item 2, item 3, item5, item 6, and item 7 carry special significance. Item 2 is an outcome of the review process but it creates information for the next stage of the localization of SDGs, i.e. prioritization. It shows the Net Systemic Contribution Extent to which an action contributes, over time, to the integrated achievement of the Critical Success Factors. Item 3 shows the required levels of disaggregation and resulting reporting needs. Item 5 shows the reporting levels and item 6 tracks the availability of reporting levels for each indicator. Finally, item 7 shows the suggested actions. Suggested actions depend upon the codes of item 6, i.e. data availability at national and sub national levels.
The actions suggested in item 6 may range from minor actions, like adding a few questions in a survey module, to starting full-fledged dedicated questionnaires. For example, in order to create information on indicator 4.4.1 (Proportion of youth and adults with information and communications technology (ICT) skills, by type of skill), all that is needed is to add few questions in the education module of PSLM. However, for creating information on goals 14 and 15 (life on land and life below water), a whole range of data needs and institutional arrangements demand serious thinking and efforts.
Review Findings and Way Forward:
Keeping the data gap context and possibilities of aligning and strengthening the survey and institutional data sources, the review process generated detailed information on,
Ÿ data gaps at different reporting levels
Ÿ Details of data gaps for seventeen SDGs at different administrative levels
Figure 1 shows the data gap at the federal, provincial, and district levels. Out of 241 indicators, standard and data is available
for 125 indicators for National. However, the availability of number of indicators reduces drastically at disaggregated level for provinces and districts.
It means that most of the survey instruments and institutional data lack indicator coverage at district level. There are several options to increase the indicators coverage at the district level. First is to increase the coverage of major survey data from provincial level representation to district level representation. Second is to build synergy between MICS and PSLM. MICS is conducted by provincial governments and it goes down to the sub-district level. While MICS representation at a lower level is good, howver, MICS is not done regularly neither is it conducted in all provinces simultaneously, which lowers its attractive-ness for national planning and monitoring and evaluation.
While there can be several approaches to increase coverage at the district level, one should consider rationalizing the periodicity of socioeconomic surveys, especially in the context of slow changing indicators. Deliberations may be done on
65
Figure 1: Summary of Data Gap
Code 1 = Data available on regular basis and standards are available
Code 2 = Data available but not on regular basis, however standards are available
Code 3 = Data not regularly produced and standards need to be developed
Code 8 = Indicator is not applicable for this level
Federal
provincial
District
125 32 81 3
71 30 94 46
27 13 91 110
SUSTAINABLE DEVELOPMENT GOALS (SDGs)
PAKISTAN'S PERSPECTIVEDATA
REPORTING GAP

the number of surveys between now and 2030, to track Pakistan's progress on SDGs. This number may help in undertaking decisions related with consolidation between surveys, rationalizing periodicity, and increasing indicators' district coverage.
Strengthening data system vis-à-vis SDG indicators will not only help increase regional coverage, but also increase coverage of indicators. Figure 2 presents the goal wise situation of coverage at the federal level.
The overall data availability is decent for social indicators, for e.g. for health goal, there are 50 percent indicators with code 3, for quality education again 50 percent, for inequalities 50. However, for other goals, the situation is more challenging, for e.g. for goal of responsible consumption & production, the number of indicators with code 3 is 80 percent, for life below water it is 90 percent, for life on land 50 percent, and for peace it is 60 percent. The overall summary is that data gap for climate, life on land, and life under ocean goals is bigger than data gap for social indicators.
Figure 3 represents the data availability situation at the provincial level. Compared to the federal level, the data gap gets bigger at the provincial level. This is particularly true for goals 3 (Health), 12 (Consumption & Production), 14 (Life below Water), 15 (Life on Land) and 16 (Peace, Justice). The goals 4 (education), 6 (Water) and 8 (work) are also affected at the provincial level with data availability issues. Second, relevance of indicators to provincial level is also reduced. There are 17 indicators of goal 17 (Partnerships) which become irrelevant at the provincial level. Findings at the provincial level show that the number of indicators with code 3 increases substantially, thus increasing the load on the national data system.
The district level analysis shows that there are serious data gaps at district level (figure 4). There is clear distinction between the comparison between federal and provincial level and between federal and district level. Coverage of sustainable con-sumption/production, peace, climate, ecosystem, and environment was not good at the federal level and it did not improve at the provincial level. Coverage of social indicators also declined, however by not a very high margin. Transition is not the same between provincial and district levels. At the district level, coverage of social side decreases and indicators with green (code 1) become smaller in size, alongside indicators with code 3 increases for same goals. For goals related with Ps of “Planet”, “Peace”, and “Partnership”, either indicators are not relevant at the district level or they are not available. Most of these goals get code of 3 or 4. Apart from PSLM and MICS survey that partially collected MDGs, there is no system available to local governments to capture the indicators of SDGs at the district level. In order to create information on indicators having code 3, substantial effort needs to be done at the national level.
66
SDG 01 : No Poverty (T = 7, i= 12)
SDG 02 : Zero Hunger (T = 8, i = 14)
SDG 03 : Good Health & Well-being (T = 13, i = 26)
SDG 04 : Quality Education (T = 10, i = 11)
SDG 05 : Gender Equality (T = 9, i = 14)
SDG 06 : Clean Water & Sanitation (T = 8, i = 11)
SDG 07: Affordable & Clean Energy (T = 5, i = 6)
SDG 08 : Decent Work & Economic Growth (T = 12, i = 17)
SDG 09 : Industry, Innovation & Infrastructure (T= 8, i = 12)
SDG 10 : Reduce Inequalities (T = 10, i = 11)
SDG 11 : Sustainable Cities & Communities (T = 10, i = 15)
SDG 12 : Responsible Consumption & Production (T = 11, i = 13)
SDG 13 : Climate Action (T = 5, i = 7)
SDG 14 : Life below Water (T = 10, i = 10)
SDG 15 : Life on Land (T = 12, i = 14)
SDG 16 : Peace, Justice & Strong Institutions (T = 12, i = 23)
SDG 17 : Partnerships for the Goals (T = 19, i = 25)
11 1
10 4
12 4 10
5 1 5 0
10 3 10
5 51 0
5 1
14 30
7 4 10
3 3 5 0
4 6 4 1
1 2 10 0
6 01
1 9 0
3 4 7 0
8 1 14 0
20 3 2 0
Code 1 = Data available on regular basis and standards are available
Code 2 = Data available but not on regular basis, however standards are available
Code 3 = Data not regularly produced and standards need to be developed
Code 8 = Indicator is not applicable for this level
Figure 2: Coverage at Federal Level
SUSTAINABLE DEVELOPMENT GOALS (SDGs)
PAKISTAN'S PERSPECTIVEDATA
REPORTING GAP

67
9
6
9
3
9
2
1
7
3
1
4
1
5
1
5
4 1
1
1
1
111
1
1
1
1
1
2
2
3
3
3
4
2
4
17
3
2
2
4
3
6
4
5 12 0
5
0 4
5
30
5
5 0
4
4
80
0
80
1 10
13
3
SDG 01 : No Poverty (T = 7, i= 12)
SDG 02 : Zero Hunger (T = 8, i = 14)
SDG 03 : Good Health & Well-being (T = 13, i = 26)
SDG 04 : Quality Education (T = 10, i = 11)
SDG 05 : Gender Equality (T = 9, i = 14)
SDG 06 : Clean Water & Sanitation (T = 8, i = 11)
SDG 07: Affordable & Clean Energy (T = 5, i = 6)
SDG 08 : Decent Work & Economic Growth (T = 12, i = 17)
SDG 09 : Industry, Innovation & Infrastructure (T= 8, i = 12)
SDG 10 : Reduce Inequalities (T = 10, i = 11)
SDG 11 : Sustainable Cities & Communities (T = 10, i = 15)
SDG 12 : Responsible Consumption & Production (T = 11, i = 13)
SDG 13 : Climate Action (T = 5, i = 7)
SDG 14 : Life below Water (T = 10, i = 10)
SDG 15 : Life on Land (T = 12, i = 14)
SDG 16 : Peace, Justice & Strong Institutions (T = 12, i = 23)
SDG 17 : Partnerships for the Goals (T = 19, i = 25)
Code 1 = Data available on regular basis and standards are available
Code 2 = Data available but not on regular basis, however standards are available
Code 3 = Data not regularly produced and standards need to be developed
Code 8 = Indicator is not applicable for this level
Figure 3: Provincial-Number of indicators by SDG and data availability
2 1 18
3 3 80
5 2 18 1
12 17
70 43
2 1 3 5
1 1 4
1 10 6
12 9
6 5
2 5 4 4
0 6 7
01 6
0 10
2 12
3 1 13 6
2 2 210
SDG 01 : No Poverty (T = 7, i= 12)
SDG 02 : Zero Hunger (T = 8, i = 14)
SDG 03 : Good Health & Well-being (T = 13, i = 26)
SDG 04 : Quality Education (T = 10, i = 11)
SDG 05 : Gender Equality (T = 9, i = 14)
SDG 06 : Clean Water & Sanitation (T = 8, i = 11)
SDG 07: Affordable & Clean Energy (T = 5, i = 6)
SDG 08 : Decent Work & Economic Growth (T = 12, i = 17)
SDG 09 : Industry, Innovation & Infrastructure (T= 8, i = 12)
SDG 10 : Reduce Inequalities (T = 10, i = 11)
SDG 11 : Sustainable Cities & Communities (T = 10, i = 15)
SDG 12 : Responsible Consumption & Production (T = 11, i = 13)
SDG 13 : Climate Action (T = 5, i = 7)
SDG 14 : Life below Water (T = 10, i = 10)
SDG 15 : Life on Land (T = 12, i = 14)
SDG 16 : Peace, Justice & Strong Institutions (T = 12, i = 23)
SDG 17 : Partnerships for the Goals (T = 19, i = 25)
Code 1 = Data available on regular basis and standards are available
Code 2 = Data available but not on regular basis, however standards are available
Code 3 = Data not regularly produced and standards need to be developed
Code 8 = Indicator is not applicable for this level
Figure 4: District-Number of indicators by SDG and data availability
SUSTAINABLE DEVELOPMENT GOALS (SDGs)
PAKISTAN'S PERSPECTIVEDATA
REPORTING GAP

68
Acknowledgments
SUSTAINABLE DEVELOPMENT GOALS (SDGs)
PAKISTAN'S PERSPECTIVEDATA
REPORTING GAP
Ministry of Planning, Development and Reform, Government of Pakistan
Mr. Zafar-ul-Hasan
Dr. Naeem-uz-Zafar
Mr. Nadeem Ahmed
Mr. M. Ali Kemal
Ms. Schanzah Khalid
Dr Asma Hyder
Mr. Azfar Ali
Mr. Khalid Mushtaq
Ms. Fizza Ali
Chief (Poverty and SDGs)
Ex. Social Policy Advisor (Federal SDG Support Unit)
Social Policy Advisor (Federal SDG Support Unit)
Economic Policy Advisor (Federal SDG Support Unit)
Research Analyst (Federal SDG Support Unit)
Member (Social Sector)
Federal SDG Support Unit
Federal SDG Support Unit
Intern (Federal SDG Support Unit
1.
2.
3.
4.
5.
6.
7.
8.
9.
Pakistan Bureau of Statistics, Government of Pakistan
Ms. Rabia Awan Economic Policy Advisor (Federal SDG Support Unit)1.
Department of Health, Government of Pakistan
Dr. Asif Deputy Chief1.
UNDP Pakistan
Mr. Shakeel Ahmed
Ms. Naveeda Nazir
Dr. Rizwan-ul-Haq
Mr. Umer Akhlaq
Mr. Minhaj-ul-Haq
Assistant Country Director
Policy Associate
Statistician
Policy Analyst
Consultant
1.
2.
3.
4.
5.
“Core Team”
“Supporting Team”

United Nations Development ProgrammeDevelopment Policy Unit
4th Floor, Serena Business Complex, Khayaban-e-Suharwardy, Sector G-5/1, P.O. Box 1051, Islamabad, Pakistan
www.pk.undp.org
Planning Commission of PakistanMinistry of Planning, Development and Reform
Poverty Alleviation and SDGs SectionP-Block, Pakistan Secretariat, Islamabad, Pakistan
http://pc.gov.pk/web/sdg
Draft Report – Not to be quotedFor Comments, corrections and suggestions kindly email at


