Technology Evaluation Centers PRODUCT ANALYSIS REPORT DATA VISUALIZATION: When Data Speaks Business IBM COGNOS BUSINESS INTELLIGENCE Jorge García, TEC Senior BI and Data Management Analyst www.technologyevaluation.com
Transcript
Technology Evaluation Centers
PRODUCT ANALYSIS REPORT
DATA VISUALIZATION:When Data Speaks Business
IBM COGNOS BUSINESS INTELLIGENCE
Jorge García,TEC Senior BI and
Data Management Analyst
www.technologyevaluation.com
Contents
About This Report ............................................................................................................... 2
About the Author ................................................................................................................ 2
About Technology Evaluation Centers .............................................................................. 17
Data Visualization: When Data Speaks Business www.technologyevaluation.com 2
About This Report This TEC Product Analysis Report aims to provide an extensive review of the set of data visualization features that form part of the essential core of IBM Cognos Business Intelligence (BI) capabilities. The report contains the following elements:
1. An introduction to IBM Cognos Business Intelligence and data visualization for providing extensive analytics and data discovery services
2. An analyst perspective covering data visualization, its role, importance, and value in the BI lifecycle chain and examining its relationship to other elements in a reliable and best practice scenario for performing BI within an organization
3. A review of IBM Cognos data visualization capabilities 4. A general conclusion and final analyst summary
Note: For this product analysis and evaluation, IBM Business Analytics agreed to conduct a product demonstration and provide the requested information for analysis.
About the Author
Jorge García is a senior business intelligence (BI) and data management analyst for TEC. He has more than 20 years of experience in all phases of application development, database and data warehouse (DWH) design, as well as 9 years in project management, covering best practices and new technologies in the BI/DWH space.
Prior to joining TEC, García was a senior project manager and senior analyst developing BI, DWH, and data integration applications with Oracle, SAP Business Objects, and data integration. He has also worked on projects related to the implementation of BI solutions for the private sector, including the banking and services sectors. He has had the opportunity to work with some of the most important BI and DWH tools on the market. García is a member of the Boulder BI Brain Trust.
Data Visualization: When Data Speaks Business www.technologyevaluation.com 3
Executive Summary The concept of data visualization has historically been related to the field of business intelligence (BI). Recently, it has gained importance as organizations extend their use of BI and ask for improved ways to synthesize large volumes of data to identify and effectively deliver valuable information. The core asset of every organization is its data. For many organizations, data visualization is a practice that involves not only specific tools but also key techniques, procedures, and rules. The objective is to ensure the best use of existing tools for extending discovery, gaining knowledge, and improving the decision-making process at all organizational levels. As such, this report considers the important effects of having good data visualization practices. It then analyzes some of the features, functions, and advantages of IBM Cognos Business Intelligence for improving the data visualization and data delivery process. With comprehensive visualization features for performing explanatory and exploratory tasks, IBM Cognos Business Intelligence can serve as a key solution and integrator agent between the core analytic phase and the delivery of information—to reveal and explain key insights and to promote new questions and answers through the use of visualization techniques. This report also describes some of the results of TEC’s evaluations of IBM Cognos Business Intelligence to measure the level of its coverage and support for organizations in search of an optimal BI solution with flexible and powerful data visualization features.
Data Visualization: When Data Speaks Business www.technologyevaluation.com 4
Data Visualization: When Data Speaks Business
The greatest value of a picture is when it forces us to notice what we never expected to see.
—John Tukey, mathematician
Data Visualization: When Data Speaks Business www.technologyevaluation.com 5
It’s Just Data These are interesting times for the analysis and management of data; more than surviving, the field is thriving. With the emergence of new data and process paradigms, such as “big data” and the Internet of Things, the industry is turning its focus on the issue of managing and processing large sets of data. This is being done with the justified understanding that processing this data accordingly will bring several benefits to business operations as well as to the organization as a whole. The more data we can retrieve, process, and deliver in an optimal way, the more we can increase the efficiency and effectiveness of the business in many ways, from its daily operation to its corporate decision-making process and practice. Data is just data. Its evolution depends on its management. How we present the data, knowledgeably and wisely, is key to adding real business value.
Data Visualization: When Data Speaks Business www.technologyevaluation.com 6
Data Visualization in a BI Context In the context of incorporating new technologies into the business mechanisms and practices of BI and analytics, the basic principles of data management remain unaffected:
Data is the source of information, and therefore of knowledge and wisdom (figure 1). As such, data must be presented appropriately and to good effect to ease decision-making and inspire action.
Maintaining the quality of data throughout the process, from collection to delivery, is key to producing the highest possible value.
BI and analytics success in producing value depends not just on how data is processed but also on how it is delivered and consumed and consumed.
Figure 1. Knowledge pyramid
But as analytics and BI practices evolve, it becomes clear that in delivering data to its final consumer, no matter if it’s an information worker or a decision maker, data visualization increases in importance. Multiformat, multipurpose information must be generated to supply information in the form of the right story to the right people, at the right time.
Data Visualization: When Data Speaks Business www.technologyevaluation.com 7
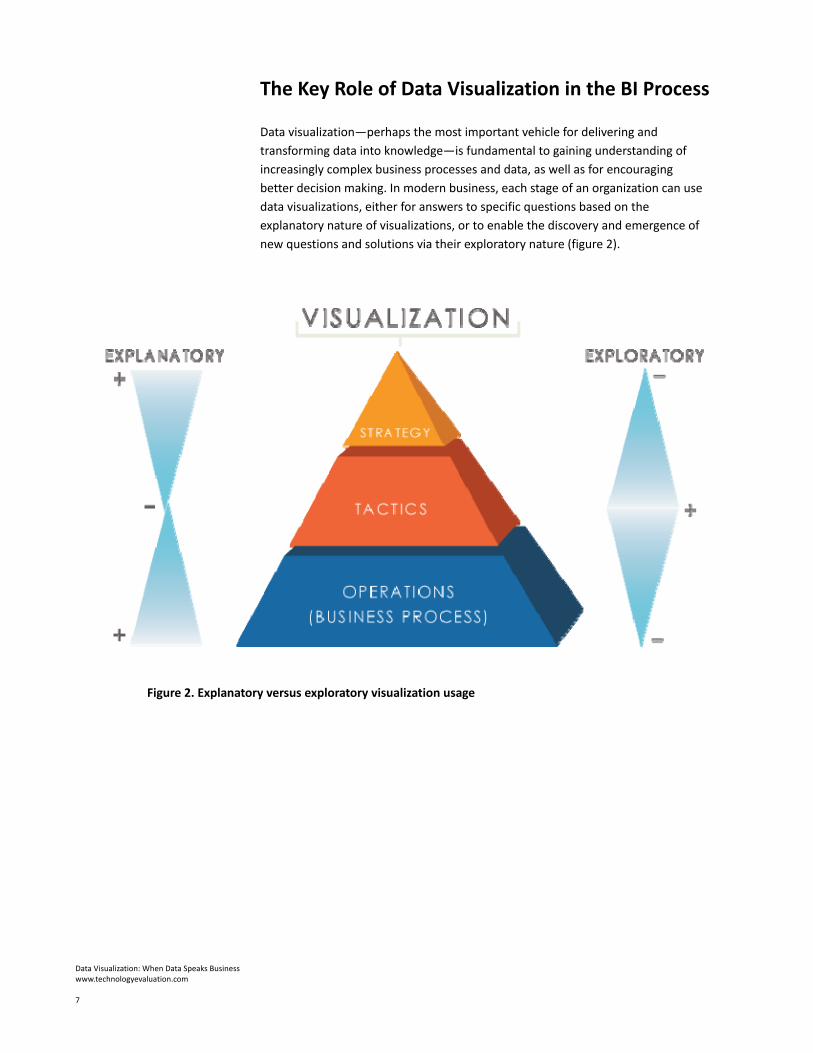
The Key Role of Data Visualization in the BI Process Data visualization—perhaps the most important vehicle for delivering and transforming data into knowledge—is fundamental to gaining understanding of increasingly complex business processes and data, as well as for encouraging better decision making. In modern business, each stage of an organization can use data visualizations, either for answers to specific questions based on the explanatory nature of visualizations, or to enable the discovery and emergence of new questions and solutions via their exploratory nature (figure 2).
Figure 2. Explanatory versus exploratory visualization usage
Data Visualization: When Data Speaks Business www.technologyevaluation.com 8
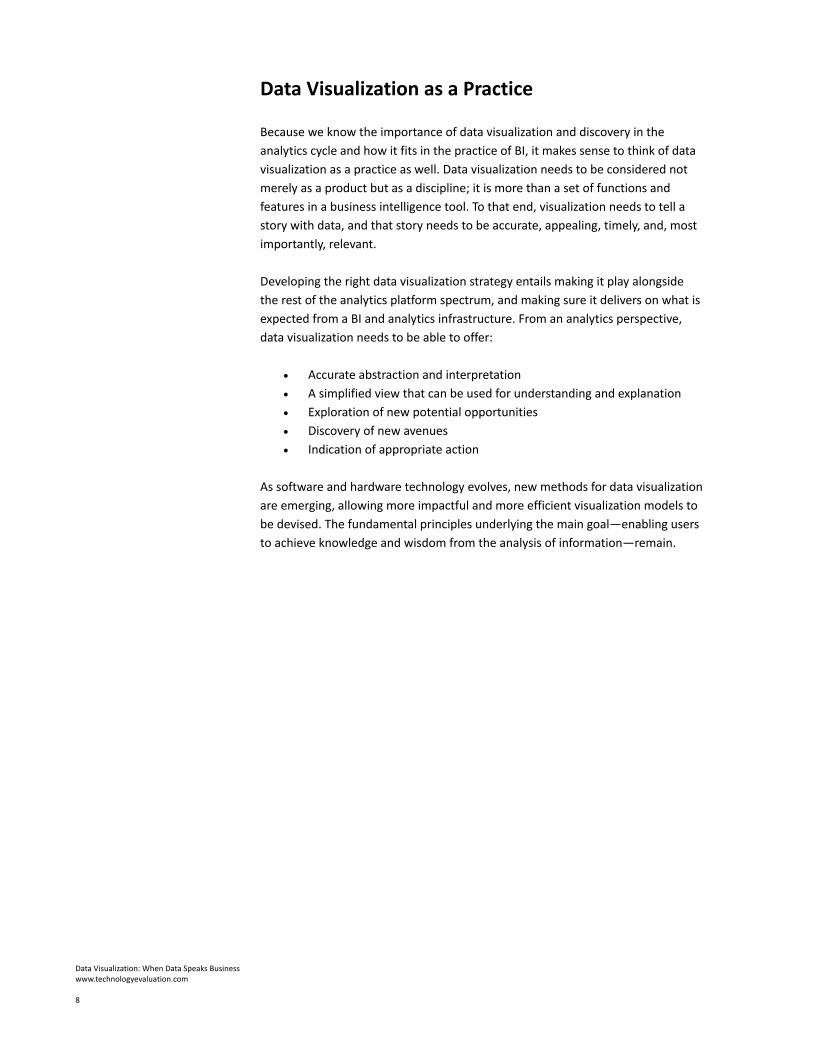
Data Visualization as a Practice Because we know the importance of data visualization and discovery in the analytics cycle and how it fits in the practice of BI, it makes sense to think of data visualization as a practice as well. Data visualization needs to be considered not merely as a product but as a discipline; it is more than a set of functions and features in a business intelligence tool. To that end, visualization needs to tell a story with data, and that story needs to be accurate, appealing, timely, and, most importantly, relevant. Developing the right data visualization strategy entails making it play alongside the rest of the analytics platform spectrum, and making sure it delivers on what is expected from a BI and analytics infrastructure. From an analytics perspective, data visualization needs to be able to offer:
Accurate abstraction and interpretation A simplified view that can be used for understanding and explanation Exploration of new potential opportunities Discovery of new avenues Indication of appropriate action
As software and hardware technology evolves, new methods for data visualization are emerging, allowing more impactful and more efficient visualization models to be devised. The fundamental principles underlying the main goal—enabling users to achieve knowledge and wisdom from the analysis of information—remain.
Data Visualization: When Data Speaks Business www.technologyevaluation.com 9
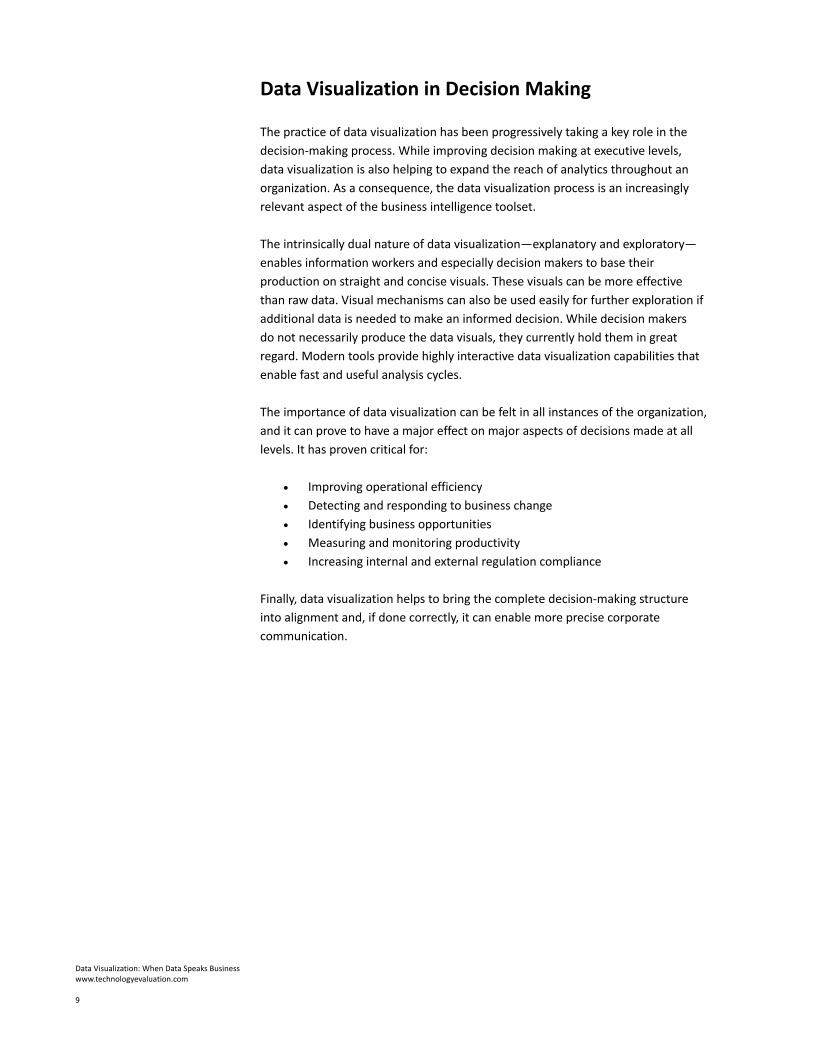
Data Visualization in Decision Making The practice of data visualization has been progressively taking a key role in the decision-making process. While improving decision making at executive levels, data visualization is also helping to expand the reach of analytics throughout an organization. As a consequence, the data visualization process is an increasingly relevant aspect of the business intelligence toolset. The intrinsically dual nature of data visualization—explanatory and exploratory—enables information workers and especially decision makers to base their production on straight and concise visuals. These visuals can be more effective than raw data. Visual mechanisms can also be used easily for further exploration if additional data is needed to make an informed decision. While decision makers do not necessarily produce the data visuals, they currently hold them in great regard. Modern tools provide highly interactive data visualization capabilities that enable fast and useful analysis cycles. The importance of data visualization can be felt in all instances of the organization, and it can prove to have a major effect on major aspects of decisions made at all levels. It has proven critical for:
Improving operational efficiency Detecting and responding to business change Identifying business opportunities Measuring and monitoring productivity Increasing internal and external regulation compliance
Finally, data visualization helps to bring the complete decision-making structure into alignment and, if done correctly, it can enable more precise corporate communication.
Data Visualization: When Data Speaks Business www.technologyevaluation.com 10
Data Visualization Benefits: Having the Right Practices and Tools in Place Encouraging the use of data visualization strategies, practices, and tools is an essential aspect of a modern BI and analytics initiative. Explanatory and exploratory data visualization tasks can greatly help users discover and resolve specific and general problems, as well as to analyze large sets of data easier and faster. Good data visualization practices help not just to solve issues but also to pose new questions, encouraging the discovery and research process to go beyond common tasks to explore new patterns and trends that can potentially boost business efficiency. Data visualization is the final resource of the BI and analytics process and paramount to effective data delivery. Applied properly, data visualization will allow workers at all levels and stages—from BI specialists who need to generate the right report, to data scientists who want to explore the data—to create their own stories. As Chip and Dan Heath, authors of Switch and Made to Stick, have noted, “Data are just summaries of thousands of stories—tell a few of those stories to help make the data meaningful.”1
1 Chip and Dan Heath. Made to Stick: Why Some Ideas Survive and Others Die. New York: Random House; 2007.
Data Visualization: When Data Speaks Business www.technologyevaluation.com 11
IBM Data Visualization Capabilities: A Functional Review IBM Cognos Business Intelligence has been a major player on the BI scene for more than a decade. Used by many important organizations around the world, Cognos Business Intelligence is an important component of IBM's software product portfolio and remains one of the most widely used enterprise BI offerings in the world. Thanks to constant innovation, Cognos Business Intelligence continues to grow and evolve, incorporating functionality that is being developed in-house as well as features from other products that IBM has acquired. As a result, the application has been keeping pace with enterprise needs that arise from new business and technological requirements. Cognos Business Intelligence is built on a comprehensive platform that provides a wide range of capabilities for BI and enterprise performance management. This includes specific applications for forward-looking views of performance, via dominant products in the space such as IBM SPSS. As a major player in BI solutions, Cognos Business Intelligence offers a rich set of capabilities for data visualization. The aim of Cognos Business Intelligence is to ensure that information is delivered correctly, in a timely fashion, and with the best possible impact for users, helping them to obtain knowledge and promoting decision and action. Data visualizations are used to deliver information through a number of Cognos Business Intelligence capabilities. Report developers can leverage standard charts and graphs, choose from a growing library of more advanced customizable visualizations or develop their own visualizations as part of their organization’s complete data visualization practices and solutions.
Data Visualization: When Data Speaks Business www.technologyevaluation.com 12
IBM Cognos Business Intelligence: Visualization Capabilities IBM conducted a series of product demos and briefings for Technology Evaluation Centers (TEC) to establish some of the key features, benefits, and values of IBM Cognos Business Intelligence data visualization capabilities. These capabilities enable:
The development of different data visualization and information delivery solutions—from generating common specific reports, to authoring advanced visualization solutions, such as advanced dashboards and scorecards.
Exploratory discovery via interactive visual analysis and/or rich and dynamic graph capabilities, such as data slice and dice and advanced mapping.
Real-time data analysis and wide data source connectors to multiple types of structured and unstructured data sources such as relational, NoSQL, and big data sources such as Hadoop.
After adjusting TEC’s knowledge base for BI to fully represent data visualization features, TEC Advisor—TEC’s software selection and evaluation tool—was used to compare IBM Cognos Business Intelligence with other solutions on the market. Aside from those business values that were apparent from the briefing, some interesting results emerged. First, IBM Cognos Business Intelligence achieved an outstanding score compared to an average calculated using a number of BI solutions. In the category of reporting and analysis, Cognos Business Intelligence ranks very high, with a score of 99 against TEC’s measure of the industry average at 76 (figure 3).
Figure 3. IBM Cognos Business Intelligence overall reporting and analysis capabilities, TEC Advisor
Data Visualization: When Data Speaks Business www.technologyevaluation.com 13
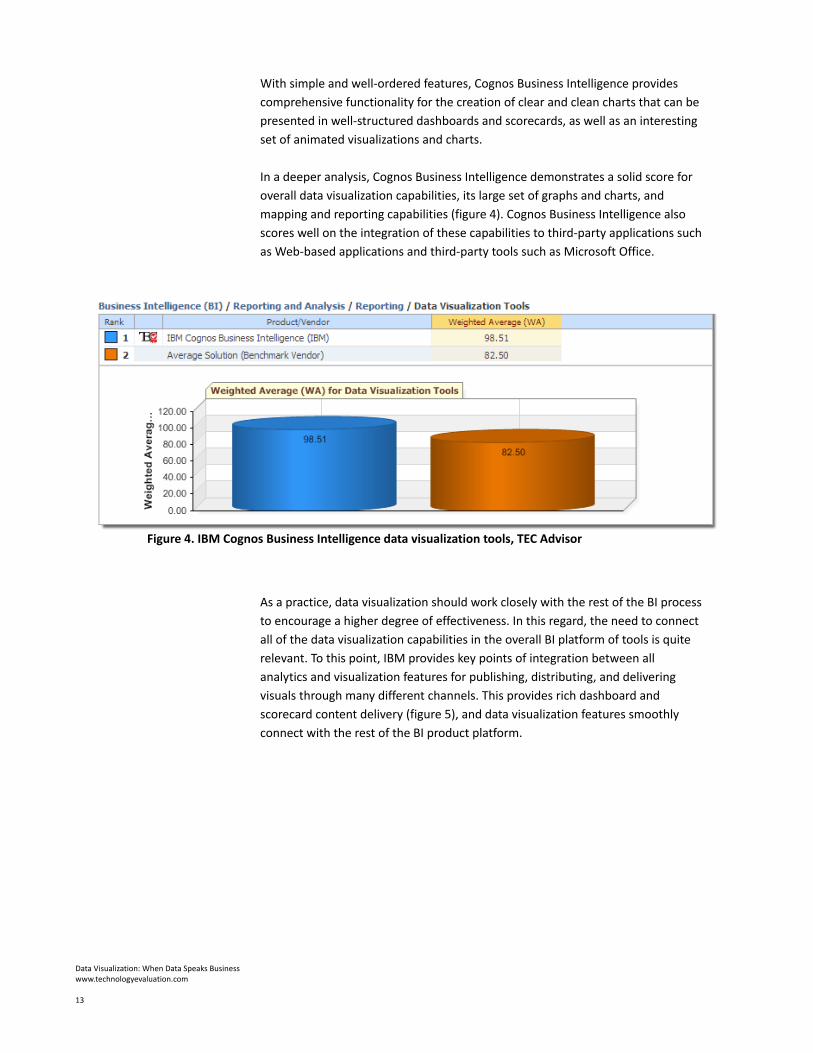
With simple and well-ordered features, Cognos Business Intelligence provides comprehensive functionality for the creation of clear and clean charts that can be presented in well-structured dashboards and scorecards, as well as an interesting set of animated visualizations and charts. In a deeper analysis, Cognos Business Intelligence demonstrates a solid score for overall data visualization capabilities, its large set of graphs and charts, and mapping and reporting capabilities (figure 4). Cognos Business Intelligence also scores well on the integration of these capabilities to third-party applications such as Web-based applications and third-party tools such as Microsoft Office.
Figure 4. IBM Cognos Business Intelligence data visualization tools, TEC Advisor
As a practice, data visualization should work closely with the rest of the BI process to encourage a higher degree of effectiveness. In this regard, the need to connect all of the data visualization capabilities in the overall BI platform of tools is quite relevant. To this point, IBM provides key points of integration between all analytics and visualization features for publishing, distributing, and delivering visuals through many different channels. This provides rich dashboard and scorecard content delivery (figure 5), and data visualization features smoothly connect with the rest of the BI product platform.
Data Visualization: When Data Speaks Business www.technologyevaluation.com 14
Figure 5. IBM Cognos Business Intelligence data dashboard and scorecarding capabilities
Through the added value of data visualization features, the Cognos Business Intelligence platform is reinforced in the following ways:
1. Support for connecting to an increasing number of data sources, especially big data sources such as Hadoop platforms (Cloudera, Hortonworks, AWS Elastic MapReduce, and others) and analytic database sources (such asIBM Netezza, SAP HANA, or Teradata), gives Cognos Business Intelligence a wider spectrum of sources to analyze and from which to generate visual information.
2. Expanded capabilities for in-memory analytics that enable self-service have a direct impact on the ability of Cognos Business Intelligence to provide users with real-time data visualization and analysis capabilities.
3. A richer spectrum for data visualization delivery includes multiple formats such as desktops and various types of mobile devices.
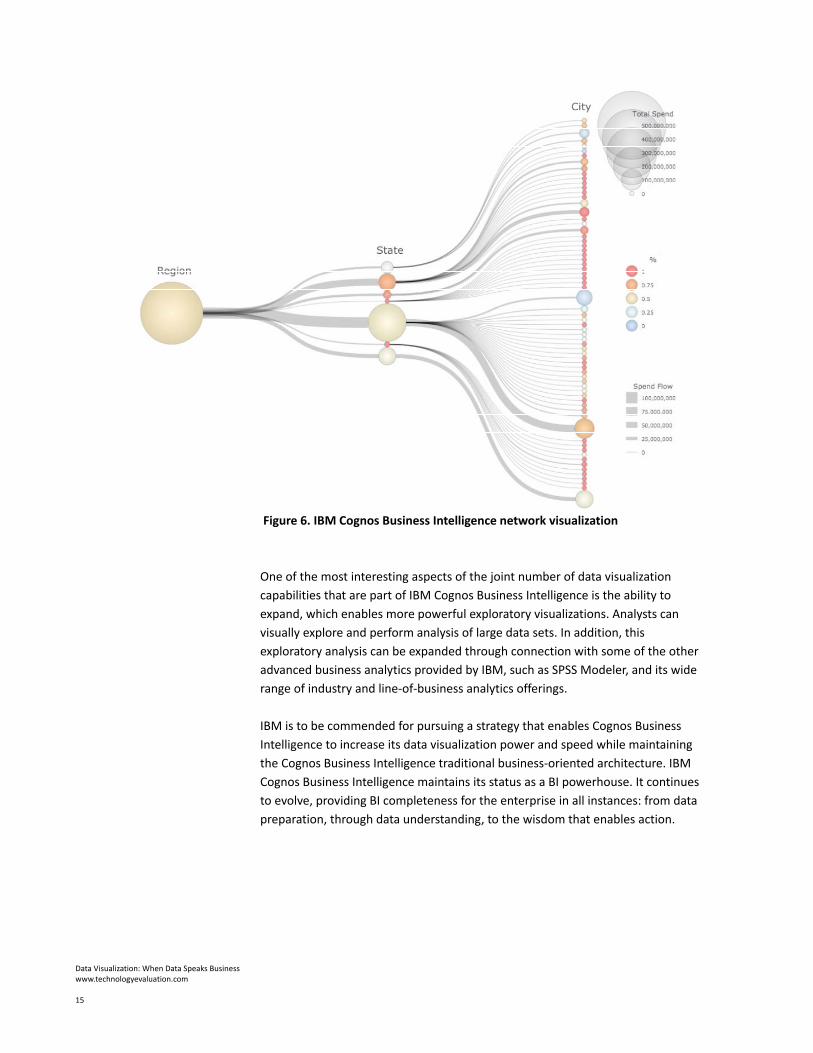
4. An expanded library of visualizations includes heat maps, theme rivers, hierarchy (figure 6), and network visualizations, among others.
Data Visualization: When Data Speaks Business www.technologyevaluation.com 15
Figure 6. IBM Cognos Business Intelligence network visualization One of the most interesting aspects of the joint number of data visualization capabilities that are part of IBM Cognos Business Intelligence is the ability to expand, which enables more powerful exploratory visualizations. Analysts can visually explore and perform analysis of large data sets. In addition, this exploratory analysis can be expanded through connection with some of the other advanced business analytics provided by IBM, such as SPSS Modeler, and its wide range of industry and line-of-business analytics offerings. IBM is to be commended for pursuing a strategy that enables Cognos Business Intelligence to increase its data visualization power and speed while maintaining the Cognos Business Intelligence traditional business-oriented architecture. IBM Cognos Business Intelligence maintains its status as a BI powerhouse. It continues to evolve, providing BI completeness for the enterprise in all instances: from data preparation, through data understanding, to the wisdom that enables action.
Data Visualization: When Data Speaks Business www.technologyevaluation.com 16
Conclusion As organizations grow, evolve, and modernize, their requirements change accordingly, and they develop a need for improved BI and analytics solutions. Organizations are increasingly recognizing that to be competitive, they need to be data-driven, for which they need not only strong analytics and BI capabilities at all decision levels, but also an effective way to transform data into information and ensure its optimal delivery. They need BI and business analytics solutions to deliver the right selection of information in the best package. Organizations use data and its analysis to accomplish different things at different levels. A BI solution that has the power to provide a complete set of data visualization and discovery capabilities can make a huge impact in telling the right story, at the right time, and to best effect. Combined with best practices, a BI initiative with the right data visualization functions and features can greatly improve the science of data analysis and the overall decision-making process. IBM Cognos Business Intelligence has a significant set of capabilities that, combined with the right practices, can provide effective data visualizations at all stages of the business process—from real-time analysis at the operational level to scorecards and dashboards to aid decision making at strategic levels—all in a single enterprise BI platform. IBM Cognos Business Intelligence is a powerhouse and should be considered by organizations evaluating advanced BI solutions able to ensure data visualization effectiveness.
Report sponsored by IBM
Data Visualization: When Data Speaks Business www.technologyevaluation.com 17
About Technology Evaluation Centers
Technology Evaluation Centers (TEC) provides insight and expertise in offering impartial resources and services to minimize the costs, risks, and time associated with software selection. Over 3.5 million technology decision makers visit TEC’s Web sites each month, to find information on hundreds of solutions, and to access articles, white papers, and podcasts.
TEC’s decision support system (DSS) and analyst data assist with the evaluation, comparison, and selection of enterprise solutions and services. TEC’s offerings include in-depth research, detailed product information, and software selection services for any industry or company size.