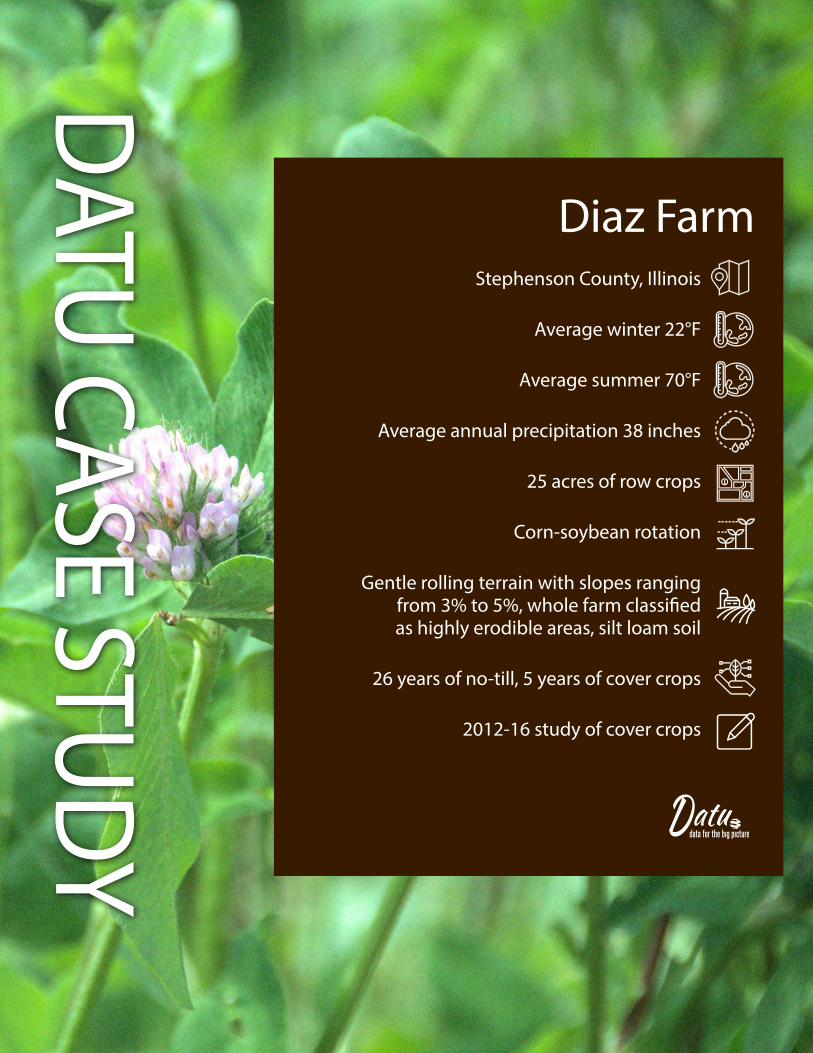
Stephenson County, Illinois Average winter 22°F Average summer 70°F Average annual precipitation 38 inches 25 acres of row crops Corn-soybean rotation Gentle rolling terrain with slopes ranging from 3% to 5%, whole farm classified as highly erodible areas, silt loam soil 26 years of no-till, 5 years of cover crops 2012-16 study of cover crops Diaz Farm DATU CASE STUDY
Transcript
Stephenson County, Illinois
Average winter 22°F
Average summer 70°F
Average annual precipitation 38 inches
25 acres of row crops
Corn-soybean rotation
Gentle rolling terrain with slopes ranging from 3% to 5%, whole farm classified as highly erodible areas, silt loam soil
26 years of no-till, 5 years of cover crops
2012-16 study of cover crops
Diaz Farm
DATU CASE STUDY
A B O U T T H I S C A S E S T U D YThis case study was prepared in cooperation with the National Association of Conservation Districts for a 2014 USDA-NRCS Conservation Innovation Grant with generous support from the Walton Family Foundation.
A B O U T D AT U R E S E A R C HDatu Research is an international consulting firm that provides the right data to leading foundations, NGOs and governments working to solve humanity’s most important challenges.
A C K N O W L E D G M E N T S The authors are grateful to Dan Diaz for generously contributing his time and expertise to this project. Additional thanks to Bruce Baumgartner, John Pearson, Mike Vincent, and Steve Moest for sharing their perspectives. We also thank Rich Duesterhaus, Bill Berry, Dorn Cox, Bryon Kirwan, David Lamm, Lauren Cartwright, Lynn Knight, Olya Sydorovych, and Ron Nichols for their insights and support, including comments on early drafts.
D I S C L A I M E RErrors of fact or interpretation remain exclusively with the authors. We welcome comments and suggestions.
Year-by-Year Farm Data .......................................................................................................................................................4
Year 1 (2012): Upfront Costs, Unexpected Benefits ...................................................................................................5
Year 2 (2013): More Experience, Less Cost .................................................................................................................6
Box 1: Sharing Information .................................................................................................................................6
Year 3 (2014): Cover Crops Start Paying Off ..............................................................................................................7
Year 4 (2015): Significant Economic Returns ............................................................................................................7
Year 5 (2016): Continued Economic Benefits .............................................................................................................8
The Bottom Line ......................................................................................................................................................................9
Role of Conservation Incentive Programs ..................................................................................................................9
Changes in Yields Over Five Years ............................................................................................................................10
Soil Health and the Environment ..............................................................................................................................10
Figure 4. 2001-16 Yield Comparisons: Diaz Farm vs. Stephenson County Average, bu/acre ....................................11
LIST OF TABLES
Table 1. 2012-16 Cover Crops and Subsequent Cash Crops Planted on Diaz Farm, Stephenson County, Illinois .............. 3
Table 2. 2012 Changes in Income Attributed to Cover Crops, Diaz Farm, $/acre...........................................................5
Table 3. 2013 Changes in Income Attributed to Cover Crops, Diaz Farm, $/acre...........................................................6
Table 4. 2014 Changes in Income Attributed to Cover Crops, Diaz Farm, $/acre...........................................................7
Table 5. 2015 Changes in Income Attributed to Cover Crops, Diaz Farm, $/acre...........................................................8
Table 6. 2016 Changes in Income Attributed to Cover Crops, Diaz Farm, $/acre...........................................................8
2 DATURESEARCH.COM
This case study presents budget effects during the first five years of planting cover crops on the Diaz Farm from 2012 to 2016. This northern Illinois farm has 25 acres of corn and soybeans in rotation. In 2012, after 14 years of participation in the Conservation Reserve Program and nine years of no-till, Dan Diaz began to experiment with cover crops, primarily to reduce erosion. This study establishes the average of the five previous years’ budgets as the baseline, and traces the budget impact of cover crop adoption by year and category.
Following three years of investment, the budgets in the fourth and fifth years showed positive results. Over thewhole five years, cover crops—together with conservation incentive programs—impacted the farm’s budgetpositively, bringing an annual average of $19.14 per acre increase from the pre-adoption baseline. Economies of scale and the initially steep learning curve increasedsavings in erosion-related repairs from zero to $16.33 peracre per year, and reduced expenditure on additional learning from the peak of $29.34 per acre in 2013 to $6.40 per acre in 2016. Dan’s cash crop yields improved in four out of five of the years studied. He estimates that the portion of those yield improvements that wasattributable to cover crops ranged from $0.15 per acre in Year 1, to $76.29 per acre in Year 4.
Dan is pleased with the economic benefits of using cover crops, but his emphasis is on their contribution to the health of the soil. These initial five years reduced soil compaction and runoff, increased water infiltration, and promoted biodiversity on the Diaz Farm. In reviewing his experience, Dan concluded that willingness to experiment on your farm and see what works best is a key to long-term success.
Key Lessons from Dan’s Experiment
• The initial investment in learning paid off.
• The variety of cover crop seed used can dramatically alter both the budget and benefits.
• In three years, cover cropping cut the need for erosion-related repairs.
• Routine use of cover crops increases overall farm resilience.
SUMM
ARY
Dan Diaz and son, Zack
DIAZ FARM CASE STUDY 3
DIAZ FARM DESCRIPTION
Dan Diaz and his family own a 52-acre farm in Stephenson County, Illinois, where the average farm size is 324 acres.1 When they purchased it as part of an estate sale, the farm had been in a Conservation Reserve Program (CRP) for 14 years. Under their ownership, 25 acres are dedicated to a yearly rotation of corn and soybeans. The remaining acres are covered with pine and oak trees, contour buffer strips, filter strips and waterways.
The farm has been in no-till operation since its purchase. Dan made this choice because he was aware of the labor and machinery savings no-till entailed, and because his farm operator had been no-till farming for years and was recognized locally for his land stewardship.
When Dan took over management of the farm’s daily operations in 2005, he realized erosion was a problem. In 2007, while looking for answers, he learned about cover crops as a potential conservation practice. He called Cover Crop Solutions, a Pennsylvania seed company, for more information, followed their website, and continued with more online research. In his hobby of planting wildlife food plots, he had noticed that using turnips had positive impact on soil tilth in his oak acres, and thought cover crops could help break up the soggy soil in low yielding areas of his production acreage. He also read how nitrogen and phosphorus pollution led to a decreasing fish population in the Gulf of Mexico. Knowing that his farm eventually drained into the Mississippi River watershed and impacted the dead zone there, he wanted his farming practices to promote conservation and biodiversity, and reduce nutrient runoff.
As Dan read about the benefits of various cover crops, he discovered information was lacking for most cover crops except for cereal rye. So, in 2012, he started his own small cover crop experiment on 2.5 acres. He expanded the testing to 10 acres in the second year, then applied what he was learning to all 25 of his cash crop acres in the third year. Each year, he experimented with different cover crop species to determine the most affordable and low-risk method of adoption. Table 1 illustrates which cover crops Dan chose for each field of cash crops.
The following analysis lays out Dan’s budget numbers year by year. It breaks down the budget effects by category of expenditure and year, describes the process of integrating cover crops into each year’s planting rotations on the fields studied, and discusses what Dan learned along the way.
1 United States Department of Agriculture-National Agricultural Statistics Service (USDA-NASS), 2012 Census of Agriculture (United States Department of Agriculture, 2014), https://www.agcensus.usda.gov/Publications/2012/Online_Resources/Watersheds/um07.pdf.
ILLINOIS
TABLE 1. 2012-16 Cover Crops and Subsequent Cash Crops Planted on Diaz Farm, Stephenson County, Illinois
Note: Each year documented in this study begins in the fall of the preceding year, when cover crops were planted; e.g., 2012 begins in the fall of 2011.
2015 Tillage radish, Mix of radish, annual rye grass, and crimson clover, Mixed brassicas, Soybean Mix of radish and oats
2016 Tillage radish, Crimson clover, Mix of radish and oats Corn
4 DATURESEARCH.COM
This case study shows how five years of cover crops affected Dan’s financial outcomes, calculating each year’s budget changes by category of expenditure related to the adoption of this practice. The analysis also includes Dan’s decision-making process and the lessons he learned.
YEAR-BY-YEAR FARM DATA
We averaged the budgets for the pre-adoption years from 2005 to 2011 as the baseline, and traced the changes from the baseline in each category by year from 2012 to 2016.
Cover crop-related budget categories analyzed:
• Planting
• Termination
• Fertilizer application
• Erosion-related repairs
• Learning activities
• Additional scouting
• Yield
• Conservation incentive programs
The annual rye grass and the radishes broke the compaction up, and they allowed the soil to drain better and dry out more effectively…I believed in cover crops right from the start, thanks to my years of dabbling. I was confident I would get a return on it.”
—Dan
DIAZ FARM CASE STUDY 5
Year 1 (2012): Upfront Costs, Unexpected Benefits In this first year, Dan purchased cover crop seeds for only 2.5 acres, planted them via a hand-broadcast seeder, and scouted the fields carefully in fall. Cover crops helped increase corn yields, but without the benefit of economy of scale, the adoption reduced the farm’s income by $83.23 per acre from the baseline. With only a small increase in crop yield, the net change in income was negative (see Table 2).
Dan started with a small area of cover crops to reduce risk while learning new technologies. To limit costs, Dan selected tillage radish, a winter-terminated cover crop species that would eliminate extra spending on termination. From September to November, he added 15 minutes to his weekly scouting to observe the soils and the growth of the cover crop.
Dan reduced fertilizer this year, but not because of cover crops; rather, because it was a drought year and soil test results indicated less fertilizer was needed. He recognized the necessity of adjusting his cover crop practices to the specific conditions on his farm, so he spent 20 hours calling specialist seed companies and doing online research. He also continued his cover crop education by participating in the Pro Harvest Seed Dealer training.
Dan had decided to plant a hybrid corn variety with a shorter maturity time of 90 days to enable an earlier inter-seeding of the cover crop with the cash crop, and to decrease drying time. The choice proved wise, as this corn’s earlier maturity better resisted the drought that occurred in the summer of 2012, and yielded 103 bushels per acre. Dan attributed 50% of the higher than usual yield to this round of cover crop adoption.
Because this cover crop trial was restricted to such a small area, Dan continued his usual routine of erosion-related repairs. He had already seen some immediate soil improvements. Soil compaction in the plot seeded with cover crops was visibly different from neighboring plots. “You could step on a spade and drive that spade almost down to the hilt. But just 20 feet over, in an area that was not planted with radishes, you had to jump on the spade to get it halfway down.”
You could step on a spade and drive that spade almost down to the hilt. But just 20 feet over, in an area that was not planted with radishes, you had to jump on the spade to get it halfway down.”
—Dan
Note: This table represents average income and yield changes on the Diaz Farm. For further detail, please refer to methodology notes on inside back cover.
TABLE 2. 2012 Changes in Income Attributed to Cover Crops, Diaz Farm, $/acre
Category $/acre
Planting -37.78
Termination 0.00
Fertilizer Application 0.00
Erosion-Related Repairs 0.00
Learning Activities -25.60
Additional Scouting -20.00
Change in Corn Yield 0.15
2012 NET CHANGE IN INCOME -83.23
6 DATURESEARCH.COM
Year 2 (2013): More Experience, Less Cost
In 2013, Dan expanded his cover crop operation to 10 acres. He used tillage radish together with cereal rye, which was much less expensive than tillage radish alone, helping reduce planting cost. This time, economy of scale factored in, and so additional scouting activities cost less compared to the previous year. Cover crops started to reduce erosion-related repairs. Dan’s net changes in income attributed to cover crops were -$60.00 per acre in this second year (see Table 3), compared to -$83.23 in the first year. On the ten acres of cover crops, Dan seeded nine acres of radishes and one acre of cereal rye where he had erosion control issues he could not manage with tillage. “I was hoping to build the soil back up, utilizing the rye to slow water movement and trap soil in previously eroded areas,” he says. Cereal rye did prove to have a positive effect on erosion in these problematic areas, and the cover crops saved Dan 20% of the usual pre-adoption erosion-related repairs on the 10 acres.
As in 2012, the radishes were winter terminated. To terminate the one acre of cereal rye, Dan added 12 additional ounces of glyphosate to his termination mix, but the rye still grew too tall (about three feet). It also took Dan some time to determine the best crop height and time of day for effective burndownof the cover crop. The thick rye residue made planting more difficult, and Dan’s custom operator struggled, working more hours to open and close the furrows. The rye residue also had a negative effect on corn emergence and yields. Throughout this learning process, Dan’s social network of fellow farmers was helpful in discussing ideas and solving issues (see Box 1). Dan also stayed up to date oncurrent cover crop information through online research and attending a conference in January.
Note: See note for Table 2.
TABLE 3. 2013 Changes in Income Attributed to Cover Crops, Diaz Farm, $/acre
Category $/acre
Planting -33.48
Termination -0.19
Fertilizer Application 0.00
Erosion-Related Repairs 3.27
Learning Activities -24.60
Additional Scouting -5.00
Change in Soybean Yield 0.00
2013 NET CHANGE IN INCOME -60.00
BOX 1: Sharing Information Mike Vincent, who runs a cattle and grain operation in Galena, Illinois, started planting rye on some of his fields seven years ago. He did not consider himself a real cover crop user until two years ago when he started working with Dan. To make cover crops work on his farm, Mike feels there is no substitute for trial and error. “It’s like learning to walk. You can’t just say, ‘pick up your feet.’”
Sharing experience and trading information with Dan has helped Mike get another perspective on what he could be doing with cover crops. “Dan sends emails and information about coming down and doing test plots. He is in the learning stage also— we are sharing our information.”
Thanks to the communication with Dan, Mike tried new cover crop varieties on his farm. “Dan has talked to me about different things. I experiment with it a little. I expanded into different kinds of cover crops when I started to work with Dan.”
Mike believes that Dan has influenced the community. “People are curious. They are watching Dan and want to learn from what he is doing.”
DIAZ FARM CASE STUDY 7
Year 3 (2014): Cover Crops Start Paying Off
In 2014, Dan made the transition to cover crops onall 25 of his acres. He started to see positive incomechanges from reductions in fertilizer application and erosion-related repairs, and increases in corn yield. Factoring in the year’s additional expenditures on cover crop planting and termination, his research, and the additional time spent scouting, Dan’s net income change related to cover crops in 2014 was -$9.96 per acre (see Table 4).
Dan divided his 25-acre farm into four 6.5-acre fields, and seeded a different cover crop variety on each. His choices included tillage radish, crimson clover, oats, and annual rye. “I wanted to see what worked best,” he says. He chose some species that were less expensive than tillage radish, which cut the 2014 planting cost to less than half of what he spent in previous years.
Dan added 12 additional ounces of glyphosate per acre to his usual pre-emergent herbicide mix on the whole 25 producing acres. At the same time, he reduced nitrogen fertilizer by 37 pounds per acre, and switched the application from fall to spring to prevent leaching. He applied phosphorus and potassium in furrows at corn planting.
After three years of cover crop adoption, the Diaz Farm did not need any erosion-related repairs. Improved soil conditions translated into higher corn yields, which increased by a total of 35 bushels across the whole 25 acres, with some spots returning particularly noticeable yield improvements. While that number may seem insignificant on a per-acre basis, Dan stresses that this increase reflects considerable improvement in formerly low-yielding areas, and signals a positive trend for the future. “2014 was the first year that I got concrete data saying it’s a dramatic improvement.”
The 2014 crop year was also a year of important on-the-job learning for Dan. Seeding cover crops gradually from early-September to October of 2013 enabled Dan to confirm that, when cover crops were seeded into the soybean fields, their earlier planting resulted in better soil contact and germination rates. Because Dan considered that staying up to date on cover crop research was important, he dedicated time worth $733.50 in this third year to attend conferences and read publications, which was a larger investment than in previous years.
Year 4 (2015): Significant Economic Returns
In 2015, Dan’s cover crops increased the farm’s resilience to the effects of heavy rains. This soil health practice helped to save expenses of termination, fertilizer, and erosion-related repairs. It also brought him an increased soybean yield, outweighing the cost of planting, continued learning, and time spent in scouting by a considerable margin. In the fourth year of adoption, cover crops led to a positive net change in income of $109.91 per acre (see Table 5).
Dan continued experimenting with different cover crop mixes this year. Based on his research, Dan reduced glyphosate by eight ounces per acre according to the selected cover crop species. Tissue tests of corn revealed improved macronutrient levels, particularly for phosphorus, so he reduced the fertilizer application and used only starter fertilizer.
Cover crops mitigated the effects of difficult weather conditions in 2015. “The annual rye grass and the radishes broke the compaction up,” Dan explains, “and they allowed the soil to drain better
TABLE 4. 2014 Changes in Income Attributed to Cover Crops, Diaz Farm, $/acre
Category $/acre
Planting -14.59
Termination -1.92
Fertilizer Application 16.28
Erosion-Related Repairs 16.33
Learning Activities -29.34
Additional Scouting -2.00
Change in Corn Yield 5.28
2014 NET CHANGE IN INCOME -9.96
Note: See note for Table 2.
8 DATURESEARCH.COM
and dry out more effectively.” This improvement in the condition of the fields made it possible for him to seize a planting window lasting only one day to seed his soybean crop.
Despite the weather and poor planting conditions, yields improved. Dan credited the cover crops for increasing his soybean yield by seven bushels per acre. Since he had noticed that a lot of this yield improvement occurred in wet spots, he concluded that the cover crops had protected many of those plants from drowning in the rain. The high returns in 2015 did not surprise Dan. “I believed in cover crops right from the start, thanks to my years of dabbling. I was confident I would get a return on it.”
Year 5 (2016): Continued Economic Benefits
By 2016, five years of cover cropping had clearly demonstrated the positive income changes attributed to this soil health practice on the Diaz Farm. The evidence appeared in earthworm populations, soil health, and economic returns. Dan did not change the fertilizer application from baseline levels this year, but he still experienced increasing yields, savings in erosion-related repairs, and reduced herbicide application, which compensated for the expenditures in planting and additional learning and scouting activities. This year’s cover cropping brought a positive net income change of $19.00 per acre to Dan’s bottom line (see Table 6). This year Dan inter-seeded crimson clover and tillage radish by using a hand broadcast seeder on 20 acres, and seeded Dover mix on the other fields via aerial seeding. Dan had discovered aerial seeding through his seed business research, and learned that it could shorten seeding time and give cover crops more time to grow between cash crop harvest and the end of the growing season. Experimenting with aerial seeding on parts of the farm increased this year’s planting machinery cost—so planting cover crops resulted in an income change of -$27.91 per acre, compared to -$26.02 the previous year.
As in 2015, Dan spent eight hours in online research and 2.5 hours in additional scouting. In response to his research, he reduced glyphosate from a baseline of 32 to 24 ounces per acre based on his choice of cover crop varieties. This meant that both the cost and process of termination were similar to the previous year. Following two years of fertilizer reduction, Dan did not see a direct income change caused by cover cropping in 2016. But, he believes, “I’m capturing adequate P and K and redistributing it up to the surface through my use of cover crops.”
This was the third year that cover crops saved Dan from all erosion-related repairs on his farm. Before adopting cover crops, he had to spend 16 hours per year tilling to clean up wet
spots. Since he planted cover crops on the entire farm in 2014, Dan had not needed to conduct any repairs, which saved him a total of $408.25 on the farm each year. The weather was excellent in 2016, and Dan harvested 153 bushels of corn per acre, 20 more bushels than the baseline. He attributed half the increase to his adoption of cover crops.
TABLE 5. 2015 Changes in Income Attributed to Cover Crops, Diaz Farm, $/acre
Category $/acre
Planting -26.02
Termination 1.28
Fertilizer Application 50.43
Erosion-Related Repairs 16.33
Learning Activities -6.40
Additional Scouting -2.00
Change in Soybean Yield 76.29
2015 NET CHANGE IN INCOME 109.91
Note: See note for Table 2.
TABLE 6. 2016 Changes in Income Attributed to Cover Crops, Diaz Farm, $/acre
Note: The yearly income analysis in this case study does not include incentives from conservation programs; however, these incentives did have a positive impact on the Diaz Farm’s budget, as shown here.
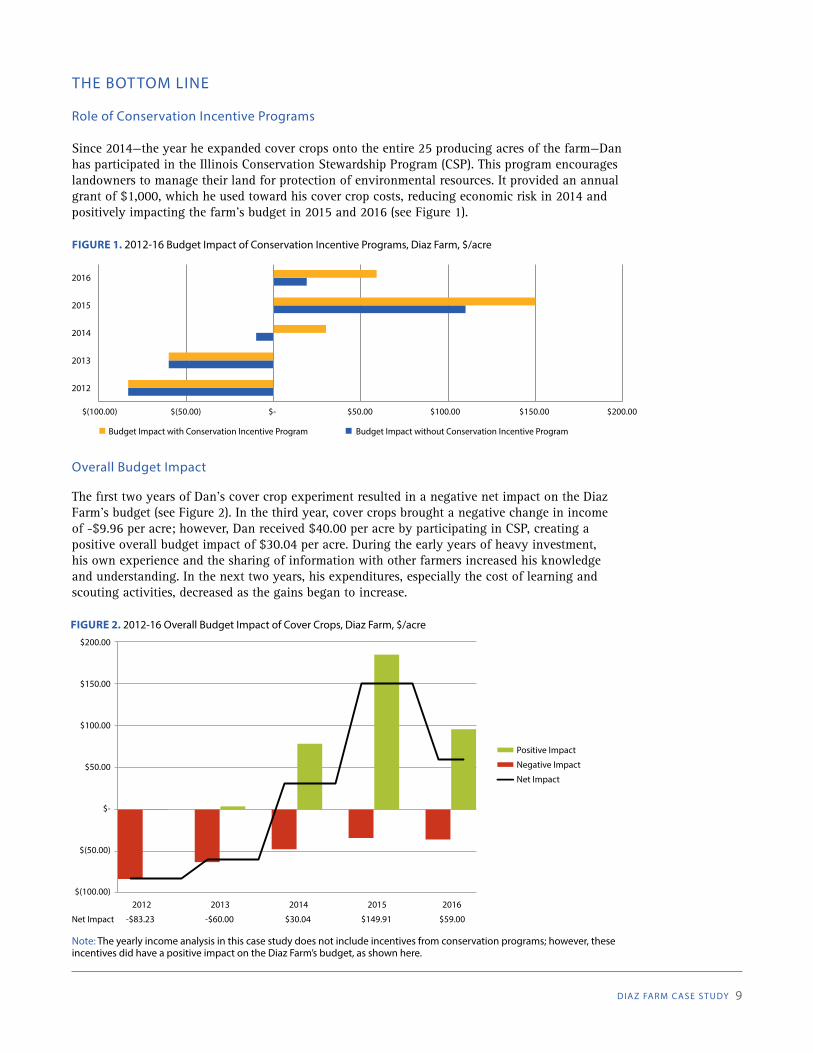
Since 2014—the year he expanded cover crops onto the entire 25 producing acres of the farm—Dan has participated in the Illinois Conservation Stewardship Program (CSP). This program encourages landowners to manage their land for protection of environmental resources. It provided an annual grant of $1,000, which he used toward his cover crop costs, reducing economic risk in 2014 and positively impacting the farm’s budget in 2015 and 2016 (see Figure 1).
Budget Impact with Conservation Incentive Program Budget Impact without Conservation Incentive Program
Overall Budget Impact
The first two years of Dan’s cover crop experiment resulted in a negative net impact on the Diaz Farm’s budget (see Figure 2). In the third year, cover crops brought a negative change in income of -$9.96 per acre; however, Dan received $40.00 per acre by participating in CSP, creating a positive overall budget impact of $30.04 per acre. During the early years of heavy investment, his own experience and the sharing of information with other farmers increased his knowledge and understanding. In the next two years, his expenditures, especially the cost of learning and scouting activities, decreased as the gains began to increase.
10 DATURESEARCH.COM
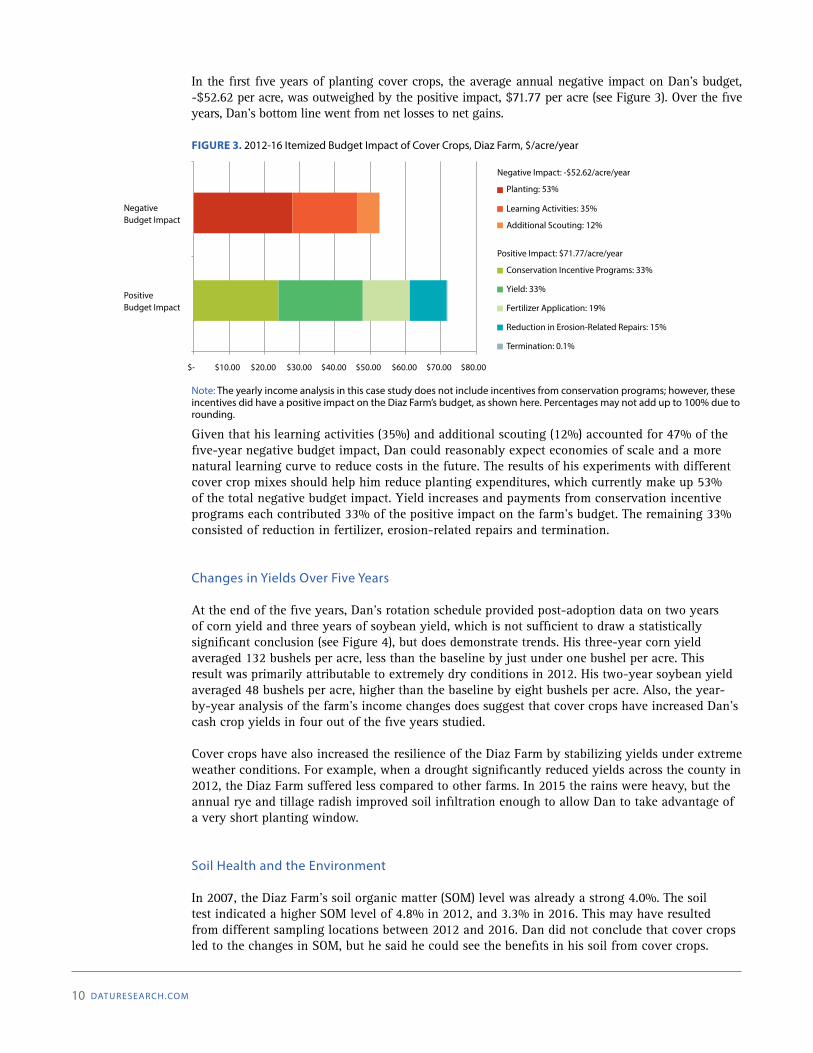
In the first five years of planting cover crops, the average annual negative impact on Dan’s budget, -$52.62 per acre, was outweighed by the positive impact, $71.77 per acre (see Figure 3). Over the five years, Dan’s bottom line went from net losses to net gains.
Note: The yearly income analysis in this case study does not include incentives from conservation programs; however, these incentives did have a positive impact on the Diaz Farm’s budget, as shown here. Percentages may not add up to 100% due to rounding.
Given that his learning activities (35%) and additional scouting (12%) accounted for 47% of the five-year negative budget impact, Dan could reasonably expect economies of scale and a more natural learning curve to reduce costs in the future. The results of his experiments with different cover crop mixes should help him reduce planting expenditures, which currently make up 53% of the total negative budget impact. Yield increases and payments from conservation incentive programs each contributed 33% of the positive impact on the farm’s budget. The remaining 33% consisted of reduction in fertilizer, erosion-related repairs and termination.
Changes in Yields Over Five Years
At the end of the five years, Dan’s rotation schedule provided post-adoption data on two years of corn yield and three years of soybean yield, which is not sufficient to draw a statistically significant conclusion (see Figure 4), but does demonstrate trends. His three-year corn yield averaged 132 bushels per acre, less than the baseline by just under one bushel per acre. This result was primarily attributable to extremely dry conditions in 2012. His two-year soybean yield averaged 48 bushels per acre, higher than the baseline by eight bushels per acre. Also, the year-by-year analysis of the farm’s income changes does suggest that cover crops have increased Dan’s cash crop yields in four out of the five years studied.
Cover crops have also increased the resilience of the Diaz Farm by stabilizing yields under extreme weather conditions. For example, when a drought significantly reduced yields across the county in 2012, the Diaz Farm suffered less compared to other farms. In 2015 the rains were heavy, but the annual rye and tillage radish improved soil infiltration enough to allow Dan to take advantage of a very short planting window.
Soil Health and the Environment
In 2007, the Diaz Farm’s soil organic matter (SOM) level was already a strong 4.0%. The soil test indicated a higher SOM level of 4.8% in 2012, and 3.3% in 2016. This may have resulted from different sampling locations between 2012 and 2016. Dan did not conclude that cover crops led to the changes in SOM, but he said he could see the benefits in his soil from cover crops.
DIAZ FARM CASE STUDY 11
FIGURE 4. 2001-16 Yield Comparisons: Diaz Farm vs. Stephenson County Average, bu/acre
Note: The Diaz Farm baseline refers to average annual yields in 2005-2010, when the Diaz farm did not use cover crops.
250
200
150
100
50
0
2002 2004 2006 2008 2010 2012 2014 2016
60
50
40
30
20
10
0
CORN
SOYBEAN
70
60
50
40
30
20
10
0
60
50
40
30
20
10
0
bu/acrebu/acre
inchesinches
Diaz Farm Average Yields County Average Yields Diaz Farm Baseline Yearly Precipitation
2002 2004 2006 2008 2010 2012 2014 2016
He says, “after these years of cover crops, I can see better soil structure, less compaction, and better water infiltration.”
Dan has also observed the effects of these improvements on wildlife diversity on his land. Wild turkeys, American woodcock, and many species of songbirds came back to the farm. “I have observed wildlife heavily using the cover crops in addition to the cash crops throughout the year,” Dan explains. “Specifically, I saw wild turkeys using fields where I planted radishes, and whitetail deer more heavily utilizing the farm in fall and winter grazing stands of oats and winter rye. Worm activity is more noticeable as well. The combination of no-till, cover crops and CRP all works together. That’s one of my big successes.”
12 DATURESEARCH.COM
DAN’S RECOMMENDATION: “TRY SOMETHING”
After five years of cover crop operation on the Diaz Farm, Dan is seeing his initial investment pay off. In addition to economic benefits from cover crops, Dan is glad to see improved soil health and more wildlife on his land. He expects these benefits to continue in the future.
Using cover crops has given Dan the opportunity to be thoroughly engaged with fellow farmers, and to stay involved in promoting soil health practices in his community. His experience with different crop varieties proved beneficial, as it has enabled Dan to give valuable and concrete advice to other producers (see Box 2).
These mutually encouraging relationships have been deepened by the launch of Dan’s seed business in 2013. For farmers wanting to begin using cover crops, he stresses the importance of figuring out what you want to accomplish before selecting the cover crop species. For example, annual rye would be a good option for a coming planting of soybeans, while a corn cash crop in the following year might require a nitrogen fixing crop such as clover. If a producer prefers not to terminate cover crops, oats could be a suitable choice.
“Cover cropping is a great program for starters of no-till,” says Dan. This recommendation comes after he observed improvements in his farm’s soil health over five years of implementing the practice. Local soil and water conservation districts and natural resource conservation services can usually provide producers useful information about cover crops for those interested in starting to plant cover crops.
BOX 2: Seeing is Believing
Bruce Baumgartner, a dairy and grain producer in Lena who had tried cover crops but was not satisfied with the outcome, decided to try cover crops again after he saw pictures of Dan’s standing crops. “The guy that I get my seed from sent me articles about inter-seeding in standing crop,” says Bruce. “He sent me pictures, so I said I would try that a little bit.” Bruce also found attending Dan’s field days helpful. “Dan had set up his farm to showcase cover crops really well. He dug some holes so people could see rooting zones, and he laid out a number of different strips of various covers. I was very interested in seeing what had grown that fall, and then I saw the differences in the spring.”
Seeing the different cover crop mixes inspiredBruce to experiment with his own cover crops. He now uses them on silage acreage. “Now I’m just trying to figure out how to makesomething like that work for my situation.”
Bruce believes Dan is influencing the community through his business of selling seeds, and Dan’s participation in the Soil and Water Conservation District (SWCD) tours promotes cover crops in the area. He gives this example: “The man that rented my ground asked me where I got my cover crops. I told him about Dan, and he also tried some. A lot of people who have been on the tours are doing cover crops now.”
Do a bit of research and give it a chance. All in all, the most important thing is just to try something.”
—Dan
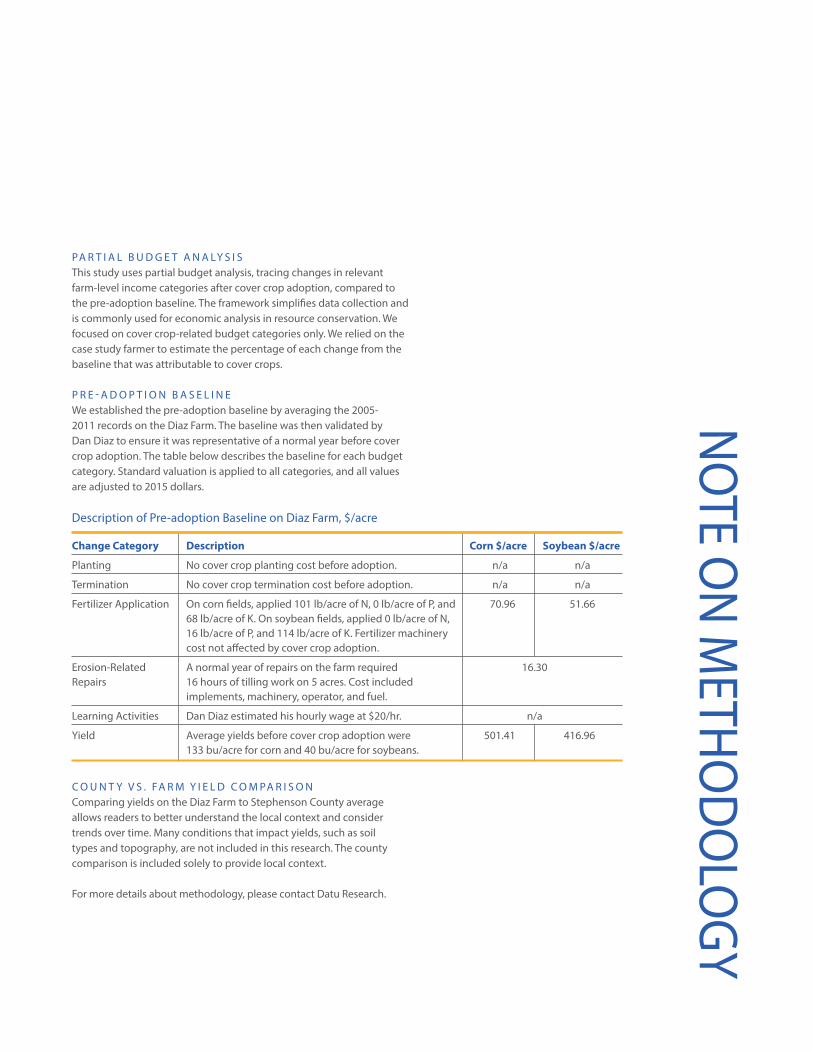
PA R T I A L B U D G E T A N A LY S I SThis study uses partial budget analysis, tracing changes in relevant farm-level income categories after cover crop adoption, compared to the pre-adoption baseline. The framework simplifies data collection and is commonly used for economic analysis in resource conservation. We focused on cover crop-related budget categories only. We relied on the case study farmer to estimate the percentage of each change from the baseline that was attributable to cover crops. P R E - A D O P T I O N B A S E L I N EWe established the pre-adoption baseline by averaging the 2005-2011 records on the Diaz Farm. The baseline was then validated by Dan Diaz to ensure it was representative of a normal year before cover crop adoption. The table below describes the baseline for each budget category. Standard valuation is applied to all categories, and all values are adjusted to 2015 dollars.
C O U N T Y V S . FA R M Y I E L D C O M PA R I S O N Comparing yields on the Diaz Farm to Stephenson County average allows readers to better understand the local context and consider trends over time. Many conditions that impact yields, such as soil types and topography, are not included in this research. The county comparison is included solely to provide local context.
For more details about methodology, please contact Datu Research.
Planting No cover crop planting cost before adoption. n/a n/a
Termination No cover crop termination cost before adoption. n/a n/a
Fertilizer Application On corn fields, applied 101 lb/acre of N, 0 lb/acre of P, and 70.96 51.66 68 lb/acre of K. On soybean fields, applied 0 lb/acre of N, 16 lb/acre of P, and 114 lb/acre of K. Fertilizer machinery cost not affected by cover crop adoption.
Erosion-Related A normal year of repairs on the farm required 16.30 Repairs 16 hours of tilling work on 5 acres. Cost included implements, machinery, operator, and fuel.
Learning Activities Dan Diaz estimated his hourly wage at $20/hr. n/a
Yield Average yields before cover crop adoption were 501.41 416.96 133 bu/acre for corn and 40 bu/acre for soybeans.
Description of Pre-adoption Baseline on Diaz Farm, $/acre