34
Zhao Lei, Mo Yu, Chen Chia-Lung, Amy, Wang Jing-Yuan (R3C) R3C-IWWG-NEA International Symposium 14 & 15 Nov 2011 Presented by Pyrolysis for Waste Plastics Recycling
| Date post: | 05-Jul-2015 |
| Category: |
Engineering |
| Upload: | perezg55 |
| View: | 126 times |
| Download: | 0 times |
Zhao Lei, Mo Yu, Chen Chia-Lung, Amy, Wang Jing-Yuan
(R3C)
R3C-IWWG-NEA International Symposium 14 & 15 Nov 2011
Presented by
Pyrolysis for Waste Plastics Recycling

Agenda
• The advantages and limitations of plastics
pyrolysis process.
• Thermal degradation characteristics of different
waste plastics.
• Lab scale pyrolysis experiments and products
analysis.
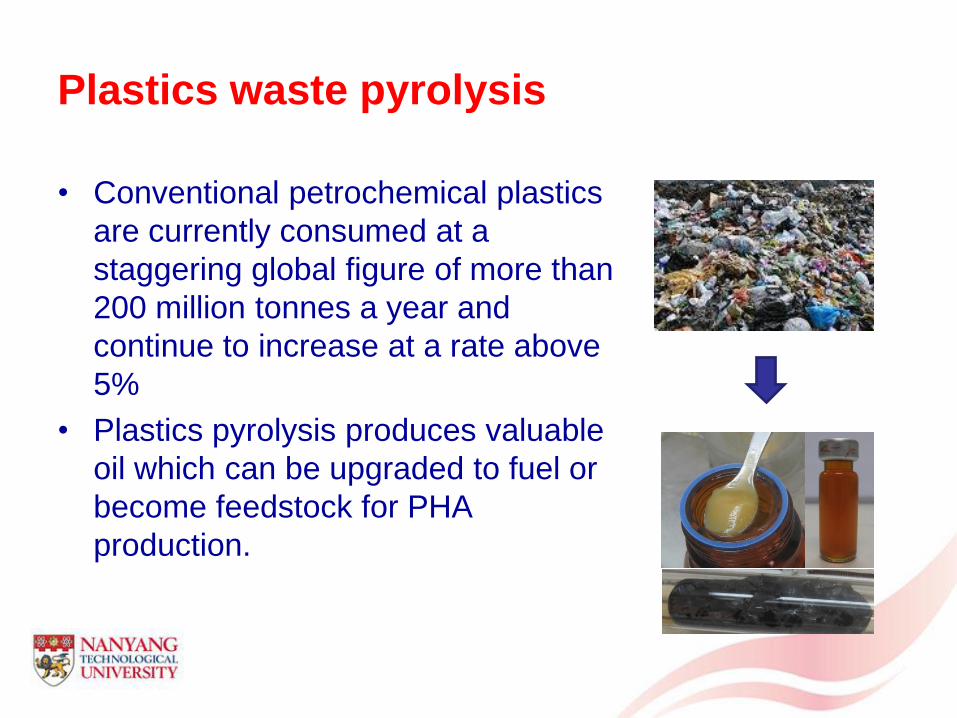
Plastics waste pyrolysis
• Conventional petrochemical plastics
are currently consumed at a
staggering global figure of more than
200 million tonnes a year and
continue to increase at a rate above
5%
• Plastics pyrolysis produces valuable
oil which can be upgraded to fuel or
become feedstock for PHA
production.

Waste Plastic
The waste plastics category
Domestic waste
polyethylene (PE)
polystyrene (PS)
polypropylene (PP)
polrvinyl chloride (PVC)
polyethylene terephthalate (PET)

Fast disposal of plastic waste without flying ash and
TCDD;
Flexible utilization of the products;
Energy self-sustain.
Advantages of Pyrolysis method

Current pyrolysis technologies
• Pyrolysis of plastics had been intensively studied from 1970s,
and the technology was applied to fuel production in different
scales.
• There are successful pyrolysis process like Veba process
(hydro cracking ), and BP process (fluidized bed pyrolysis ).
• The first plastic pyrolyis plant in China was built in 1993 in
Shan Xi.

• Pretreatment of the plastic substrates is an essential step for
following pyrolysis process.
• For BP pyrolysis process, it is required that the impurities
shouldn’t not exceed 4%,the ash content should be no more
than 4.5%,Cl content below 2.5%,and moisture within 1%;
• The substrate should be crushed, and the metal content and
impurities need to be removed in BASF pyrolysis process.
The pretreatment of plastic substrates

Table 1 Summary of the main products of pyrolytic oil with and without catalyst
Plastic Feed Dominant Products Source Remarks
Without catalyst
Polystyrene (PS) 82.80% styrene, <0.10% benzene, 1.70% toluene, 0.80%
ethylbenzene, 5.80% alpha-methylstyrene, < 0.10% 1-ethyl-2-methyl-
benzene, 0.30% biphenyl, 0.30% alpha-methyl-phenyl,1.30% styrene
dimer, 1.60% alpha-methyl-stilbene, 1.40% 1-butene-1,3-diphenyl,
3.80% unidentified
(Ward et al.,
2006)
Styrene produced as dominant
product (>50.00%) and BTEX as
minor products. This is consistent
with our previous experimental
data.
0.07% benzene, 1.70% toluene, 0.40% xylenes and ethylbenzene,
76.80% styrene
(Kaminsky,
Predel, & Sadiki,
2004)
Polyethylene (PE) 19.20% benzene, 3.90% toluene, 0.08% xylenes and ethylbenzene,
0.50% styrene
(Kaminsky,
Predel, & Sadiki,
2004)
About 17.00 to 20.00% BTXS can
be produced. These products are
not detected in our previous
experiments.
16.10 – 23.58% methane, 19.84 - 25.40% ethene, 12.20 – 19.07%
benzene, 3.60 – 3.86% toluene, 0.08 - 1.10% xylene, 0.48 - 1.10%
styrene
(Kaminsky,
1985)
Polypropylene (PP) 18.20% benzene, 6.60% toluene, 0.40% xylenes and ethylbenzene,
1.00% styrene
(Kaminsky,
Predel, & Sadiki,
2004)
About 25.00% of BTEXS can be
produced. 2,4-dimethyl-1-heptene
is also a dominant product and this
is consistent with our previous
experimental data. 18.90% 2-pentene, 12.30% 2-methyl-1-pentene, 33.60% 2,4-dimethyl-
1-heptene, 7.80% 2,4,6-trimethyl-1-nonene
(Kiang, Uden, &
Chien, 1980)
PE/PS mixture 0.12% benzene, 1.09% toluene, 0.64% ethylbenzene, 9.
00% styrene, 0.03% xylene
(Miskolczi,
Bartha, &
Deák, 2006)
Low amount of target products
(<15.00% BTEX)
0.18 – 0.24% benzene, 0.25 - 0.48% toluene, 0.32 - 0.54%
naphthalene, 0 - 1.33% methylnaphthalenes
(Williams &
Williams, 1999)
PP/PS mixture 0.02% benzene, 0.08% toluene, 0.04% p-xylene (Williams &
Williams, 1999)
Low amount of target products
(<2.00% BTEX)
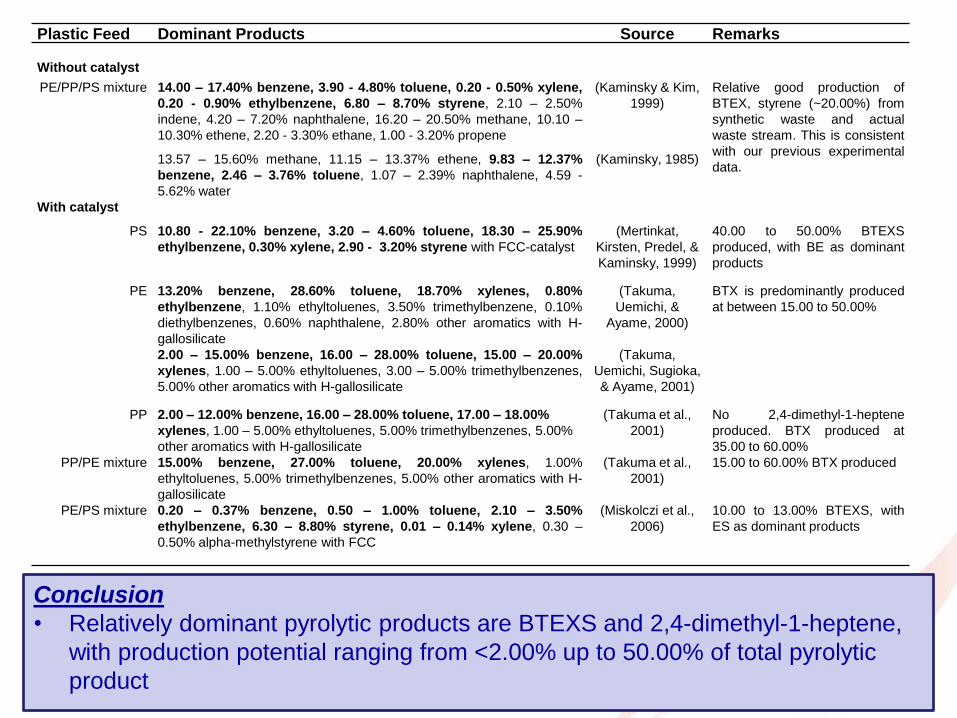
Conclusion
• Relatively dominant pyrolytic products are BTEXS and 2,4-dimethyl-1-heptene,
with production potential ranging from <2.00% up to 50.00% of total pyrolytic
product
Plastic Feed Dominant Products Source Remarks
Without catalyst
PE/PP/PS mixture 14.00 – 17.40% benzene, 3.90 - 4.80% toluene, 0.20 - 0.50% xylene,
0.20 - 0.90% ethylbenzene, 6.80 – 8.70% styrene, 2.10 – 2.50%
indene, 4.20 – 7.20% naphthalene, 16.20 – 20.50% methane, 10.10 –
10.30% ethene, 2.20 - 3.30% ethane, 1.00 - 3.20% propene
(Kaminsky & Kim,
1999)
Relative good production of
BTEX, styrene (~20.00%) from
synthetic waste and actual
waste stream. This is consistent
with our previous experimental
data. 13.57 – 15.60% methane, 11.15 – 13.37% ethene, 9.83 – 12.37%
benzene, 2.46 – 3.76% toluene, 1.07 – 2.39% naphthalene, 4.59 -
5.62% water
(Kaminsky, 1985)
With catalyst
PS 10.80 - 22.10% benzene, 3.20 – 4.60% toluene, 18.30 – 25.90%
ethylbenzene, 0.30% xylene, 2.90 - 3.20% styrene with FCC-catalyst
(Mertinkat,
Kirsten, Predel, &
Kaminsky, 1999)
40.00 to 50.00% BTEXS
produced, with BE as dominant
products
PE 13.20% benzene, 28.60% toluene, 18.70% xylenes, 0.80%
ethylbenzene, 1.10% ethyltoluenes, 3.50% trimethylbenzene, 0.10%
diethylbenzenes, 0.60% naphthalene, 2.80% other aromatics with H-
gallosilicate
(Takuma,
Uemichi, &
Ayame, 2000)
BTX is predominantly produced
at between 15.00 to 50.00%
2.00 – 15.00% benzene, 16.00 – 28.00% toluene, 15.00 – 20.00%
xylenes, 1.00 – 5.00% ethyltoluenes, 3.00 – 5.00% trimethylbenzenes,
5.00% other aromatics with H-gallosilicate
(Takuma,
Uemichi, Sugioka,
& Ayame, 2001)
PP 2.00 – 12.00% benzene, 16.00 – 28.00% toluene, 17.00 – 18.00%
xylenes, 1.00 – 5.00% ethyltoluenes, 5.00% trimethylbenzenes, 5.00%
other aromatics with H-gallosilicate
(Takuma et al.,
2001)
No 2,4-dimethyl-1-heptene
produced. BTX produced at
35.00 to 60.00%
PP/PE mixture 15.00% benzene, 27.00% toluene, 20.00% xylenes, 1.00%
ethyltoluenes, 5.00% trimethylbenzenes, 5.00% other aromatics with H-
gallosilicate
(Takuma et al.,
2001)
15.00 to 60.00% BTX produced
PE/PS mixture 0.20 – 0.37% benzene, 0.50 – 1.00% toluene, 2.10 – 3.50%
ethylbenzene, 6.30 – 8.80% styrene, 0.01 – 0.14% xylene, 0.30 –
0.50% alpha-methylstyrene with FCC
(Miskolczi et al.,
2006)
10.00 to 13.00% BTEXS, with
ES as dominant products

Objectives
• To study thermogravimetric analysis (TGA): weight loss vs. temperature
• To determine reaction temperature range and energy consumption
Materials and Methods
Sample preparation 1) Different products of the PS ,PE, PP and PET 2) Homogenization by grinding
TGA analysis
1) 30 °C to 900 °C
2) 10 °C/min
3) N2: 20 mL/min
TGA study of different plastic products

Thermodegradation of the mixture of the pure plastic chemicals
The TG and DTG profiles and reaction characteristics of the mixture of pure
plastics
Fig. 3 TG profiles of pure plastic mixture with equal weight proportions. (a) PE, PP and the mixture of PE & PP in 1:1 weight
proportion. (b) PE, PS and the mixture of PE & PS in 1:1 weight proportion. (c) PP, PS and the mixture of PP & PS in 1:1 weight
proportion. (d) PE, PP, PS and the mixture of PE, PP & PS in 1:1:1 weight proportion.
(a) (b)
(c) (d)
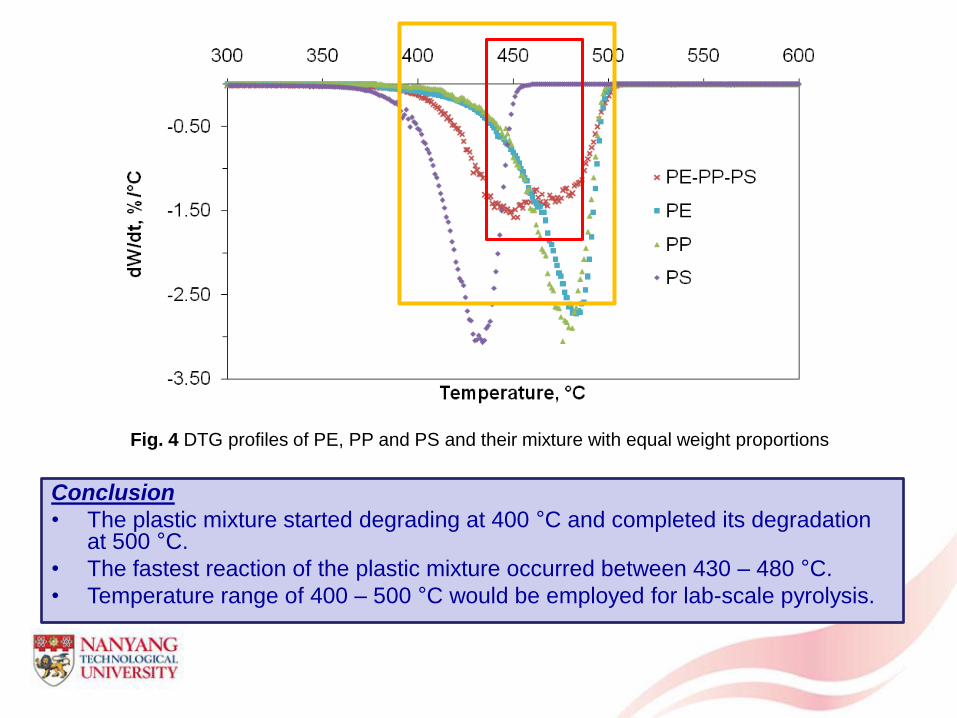
Conclusion
• The plastic mixture started degrading at 400 °C and completed its degradation at 500 °C.
• The fastest reaction of the plastic mixture occurred between 430 – 480 °C.
• Temperature range of 400 – 500 °C would be employed for lab-scale pyrolysis.
Fig. 4 DTG profiles of PE, PP and PS and their mixture with equal weight proportions

Objectives
• Online analysis for the volatile products
• Offline analysis for solid and semi-solid products
Materials and Methods
1 Online analysis
2 Offline analysis (solid sample)
On-line product analysis
FTIR signal
analysis
Volatile products
transit TGA
Transfer Line
FTIR
Temperature program control
Sample preparation 1)Homogenization by grinding
Pelleting
1) Mix with KBr powder
2) Pelleting with vacuum press
FTIR analysis
1) Resolution: 4 cm-1
2) Spectrum range: 500-4000 cm-1
TGA-FTIR analysis for the pyrolysis products

Conclusion • Aliphatic hydrocarbon & CO2 was produced • Wax had longer carbon chain, more carbon-carbon double bonds and
branches
Functional group Vibrational mode Assigned (cm-
1)
-CH=CH2 or
>C=CH2
C-H stretching 3076
-CH3 C-H asymmetrical stretching 2951
-CH2- C-H asymmetrical and
symmetrical stretching
2929, 2916,
2855, 2849
CO2 CO2 stretching 2359, 668
-CH=CH2 or
>C=CH2 or -
CH=CH-
C=C stretching 1645
-CH2- C-H scissoring 1456
-CH3
C-H asymmetrical and
symmetrical bending 1456, 1376
-CH=CH2 C-H bending 990, 910
-CH=C< C-H bending 781
-(CH2)n- (n>4) CH2 plane rocking 719
CO2 C=C -CH2- -CH2- -CH3
C=C -CH2- -CH3 FTIR spectrum of pyrolysis products of LDPE pyrolysis products
LDPE pyrolysis
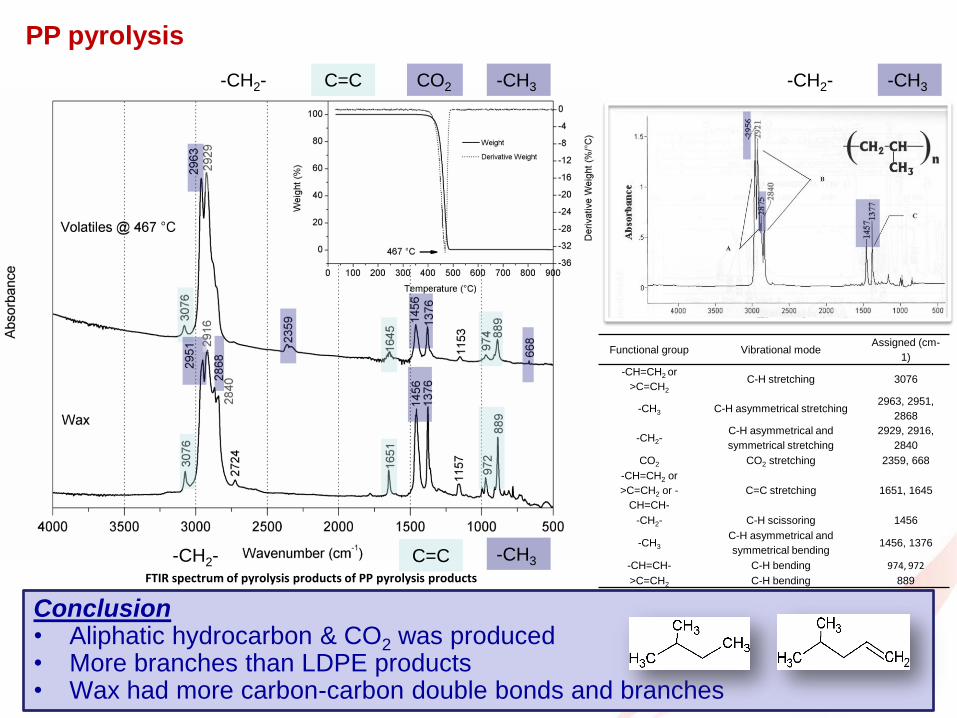
Conclusion • Aliphatic hydrocarbon & CO2 was produced • More branches than LDPE products • Wax had more carbon-carbon double bonds and branches
Functional group Vibrational mode Assigned (cm-
1)
-CH=CH2 or
>C=CH2
C-H stretching 3076
-CH3 C-H asymmetrical stretching 2963, 2951,
2868
-CH2- C-H asymmetrical and
symmetrical stretching
2929, 2916,
2840
CO2 CO2 stretching 2359, 668
-CH=CH2 or
>C=CH2 or -
CH=CH-
C=C stretching 1651, 1645
-CH2- C-H scissoring 1456
-CH3
C-H asymmetrical and
symmetrical bending 1456, 1376
-CH=CH- C-H bending 974, 972
>C=CH2 C-H bending 889
CO2 C=C -CH3 -CH2-
-CH3 -CH2- C=C
-CH3 -CH2-
FTIR spectrum of pyrolysis products of PP pyrolysis products
PP pyrolysis

Conclusion • Aromatic hydrocarbon was produced • Mono-substituted benzene ring • Carbon-carbon double bonds
Functional group Vibrational mode Assigned (cm-
1)
Aromatic rings C-H stretching 3074, 3031
-CH3 directly attached
to benzene rings
C-H asymmetric and
symmetric stretching 2937
-CH3 C-H symmetrical stretching 2869
Aromatic rings Summation bands 2000-1700
--CH=CH2 or >C=CH2
or -CH=CH- C=C 1637
Aromatic rings Ring mode 1620-1400
-CH3
C-H asymmetrical and
symmetrical bending 1450
Aromatic rings In-plane C-H bending 1200-1000
-CH=CH2 C-H bending 991, 915
Meta-substituted or
mono-substituted
benzene ring
Out of plane C-H bending 770
Meta-substituted or
mono-substituted
benzene ring
C-C ring bending 694
C=C -CH3
-CH2-
FTIR spectrum of pyrolysis products of PS pyrolysis products
PS pyrolysis
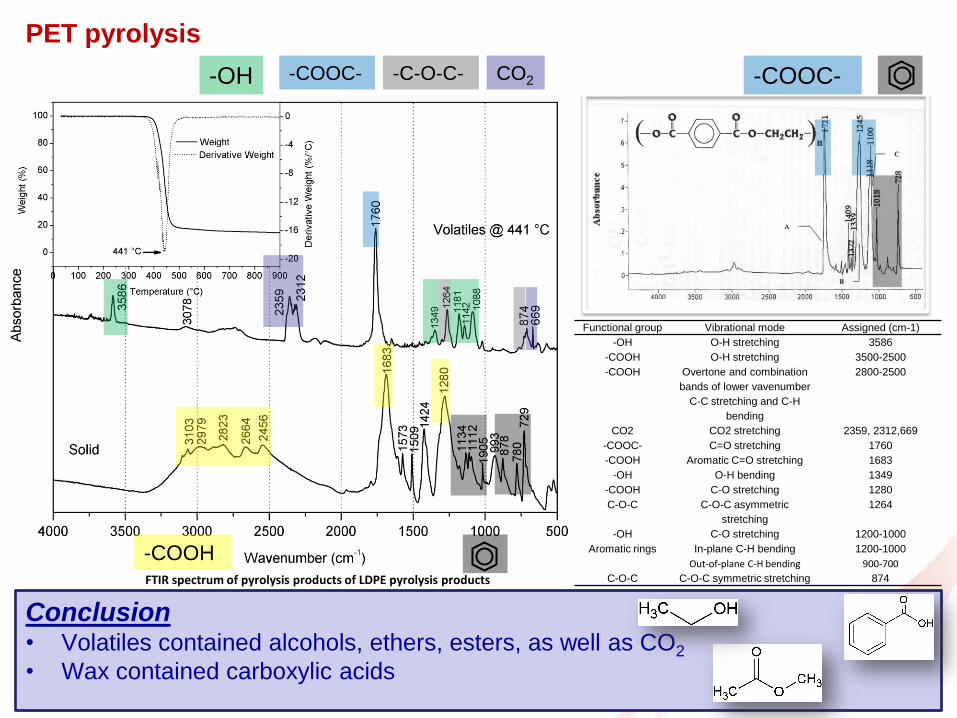
Conclusion • Volatiles contained alcohols, ethers, esters, as well as CO2
• Wax contained carboxylic acids
Functional group Vibrational mode Assigned (cm-1)
-OH O-H stretching 3586
-COOH O-H stretching 3500-2500
-COOH Overtone and combination
bands of lower vavenumber
C-C stretching and C-H
bending
2800-2500
CO2 CO2 stretching 2359, 2312,669
-COOC- C=O stretching 1760
-COOH Aromatic C=O stretching 1683
-OH O-H bending 1349
-COOH C-O stretching 1280
C-O-C C-O-C asymmetric
stretching
1264
-OH C-O stretching 1200-1000
Aromatic rings In-plane C-H bending 1200-1000
Out-of-plane C-H bending 900-700
C-O-C C-O-C symmetric stretching 874
CO2 -OH -COOC- -C-O-C-
-COOH
-COOC-
FTIR spectrum of pyrolysis products of LDPE pyrolysis products
PET pyrolysis

Pyrolysis set-up
N2 supply
Furnace Gas bag
Furnace temperature controller
Silicon-gel trap
DI water trap
Chiller
Glass wool trap
Cold trap (10°C) Cold
trap (0°C)
Flow meter
Objective
To test effects of different operating conditions on pyrolysis products, and the
difference between pyrolysis products from pure and waste plastics.
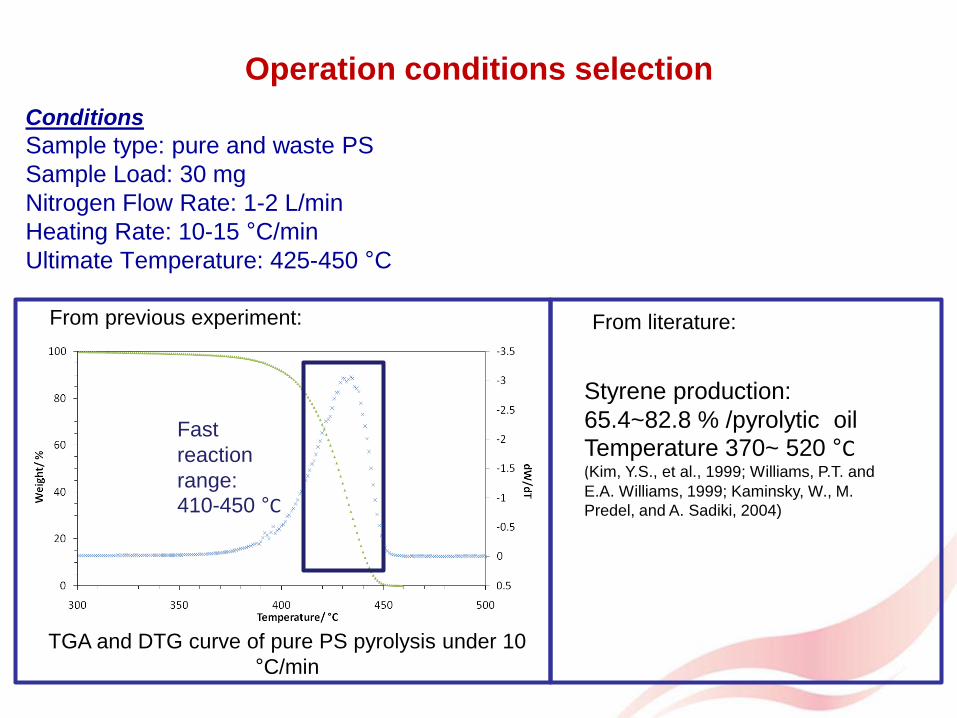
Conditions
Sample type: pure and waste PS
Sample Load: 30 mg
Nitrogen Flow Rate: 1-2 L/min
Heating Rate: 10-15 °C/min
Ultimate Temperature: 425-450 °C
Operation conditions selection
TGA and DTG curve of pure PS pyrolysis under 10
°C/min
Styrene production:
65.4~82.8 % /pyrolytic oil
Temperature 370~ 520 °C (Kim, Y.S., et al., 1999; Williams, P.T. and
E.A. Williams, 1999; Kaminsky, W., M.
Predel, and A. Sadiki, 2004)
From previous experiment: From literature:
Fast
reaction
range:
410-450 °C

Pyrolysis were carried out at a heating rate of 15 °C/min, and hold
on for 30 mins at 425 °C on pure PS and two different PS waste.
Pure PS PS cap PS foam
Pure and waste PS pyrolysis
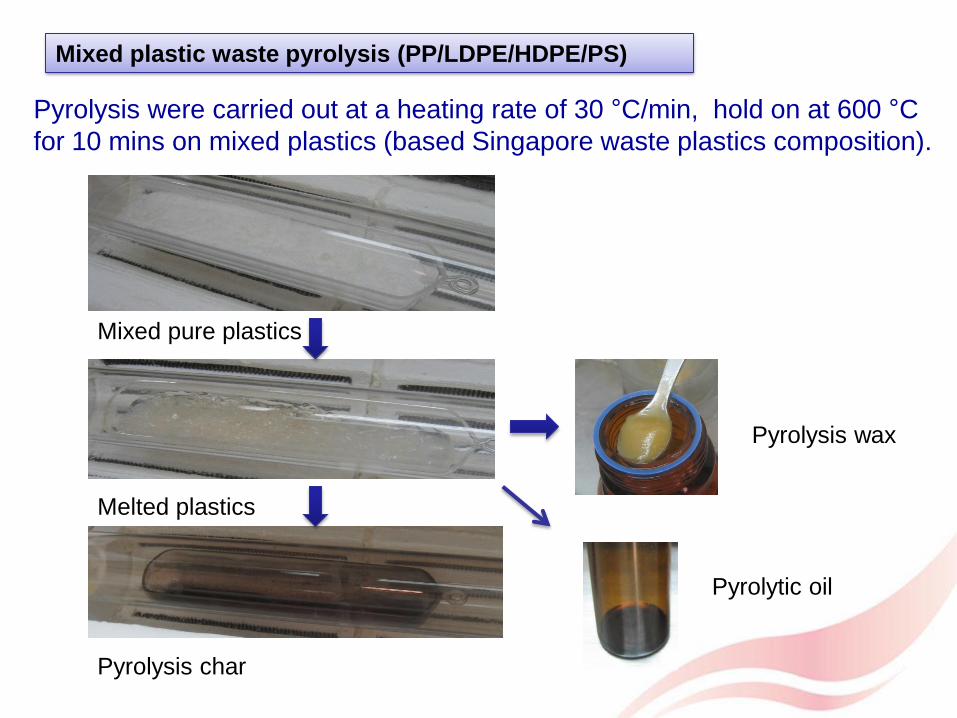
Mixed pure plastics
Melted plastics
Pyrolysis char
Pyrolysis wax
Pyrolysis were carried out at a heating rate of 30 °C/min, hold on at 600 °C
for 10 mins on mixed plastics (based Singapore waste plastics composition).
Pyrolytic oil
Mixed plastic waste pyrolysis (PP/LDPE/HDPE/PS)
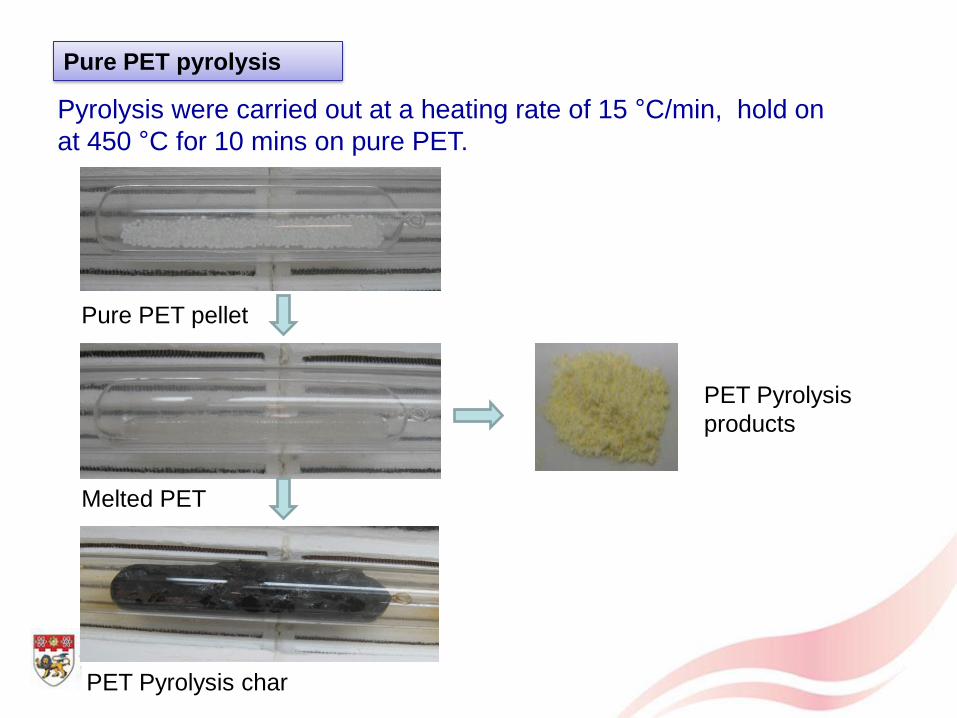
Pure PET pellet
Melted PET
PET Pyrolysis char
PET Pyrolysis
products
Pyrolysis were carried out at a heating rate of 15 °C/min, hold on
at 450 °C for 10 mins on pure PET.
Pure PET pyrolysis

PET pyrolysis products
Water
NaOH
Solid products from PET pyrolysis can fully dissolve in water by
adjusting PH to above 12.
PET pyrolysis products distribution is listed below
Solid products Solid char Gas
PET pure 44.3% 13.8% 41.8%

Objective
The oil products from PS pyrolysis were analyzed by the GC-MS system to
identify their components Materials and Methods
Equipment: The HP6890 GC & 5975I MS, Agilent, USA
Column: HP-5MS (30 m, I.D. 0.25 mm, film thickness 0.1
µm)
Conditions: The injection port, interface, quadruple and
ion source was set at 250, 260, 120 and 250
°C, respectively. High-purity helium as used
as a carrier gas (1.6 mL/min).
MS parameter: electron impact mode, EI; ionization
energy, 70 eV in the positive-ion mode;
repel voltage, 25 V; analytical mode,
full scan (mass range of m/z 50-150
a.m.u. with mass accuracy of 0.1
a.m.u.)
Injection volume: 1 µL
Temperature program: initial temperature at 40 °C for 2
min, then increased to 100 °C at
a rate of 20 °C/min. The total
time for each GC run was 5 min.
Sample preparation: Standards and samples are
prepared in dichloromathane
Gas chromatogram of BTEXS standard. (Peak: 1 benzene, 2 toluene, 3
ethylbenzene, 4 p-xylene, 5 styrene)
GC-MS analysis of pyrolytic oil

Gas chromatogram of PS pure chemical pyrolytic oil.
(Peak: 1 toluene, 2 ethylbenzene, 3 styrene, 4 α-Methylstyrene, 5 1,3-ditertbutyl-benzene
Gas chromatogram of PS cap chemical pyrolytic oil.
(Peak: 1 toluene, 2 styrene, 3 1,3-ditertbutyl-benzene
Gas chromatogram of PS foam pyrolyticoil. (Peak: 1
toluene, 2 ethylbenzene, 3 styrene, 4 1,3-ditertbutyl-benzene
Conclusion •A reliable GC-MS procedure was developed of aromatics separation and identification •And the components of the PS pyrolytic oil were identified •Pyrolytic oil components of different PS products were similar

Objective
To determine that amount of main products we learned form the GC-MS
system
Materials and Methods
Equipment: The HP7890 GC & FID detector, Agilent,
USA,
Column: 30-m HP-5MS
Conditions: 250 °C; helium carrier gas flow rate: 4
mL/min.
FID parameter: 300 °C; H2 flow 30 mL/min/; make up gas
flow 22 mL/min
Injection volume: 1 µL
Temperature program: Initial temperature at 40 °C for 1
min, then increased to 90 °C at
a rate of 40 °C/min, and then to
110 °C at a rate of 10°C/min.
The total time for each GC run
was 4 min
Sample preparation: Standards and samples are
prepared in dichloromathane
Gas chromatogram of BTEXS standard. (Peak: 1 benzene, 2 toluene, 3
ethylbenzene, 4 p-xylene, 5 styrene)
GC-FID analysis of the pyrolytic oil

Sample
ID Feed stock Pyrolysis conditions
Toluene
yield, %
Ethylbenzene
yield, %
Styrene
yield, % Total
4-6 PS pure
chemical
450 °C, 10 °C/min 3.9 5.6 86 .4 95.8
4-8 425 °C, 10 °C/min 3.8 5.9 72 .7 82.3
4-9 425 °C, 15 °C/min 3.2 4.2 60.9 68.3
4-10 PS foam 425 °C, 15 °C/min 3.6 0 96.3 99.0
4-11 PS cap 425 °C, 15 °C/min 0 0 88.9 88.9
The amount of the main products in the PS pyrolytic oil
GC-FID analysis results

Feedstock Reactor Reaction
Temperature Styrene yield, %
Note Source
PS pure chemical
Tube reactor 450 68.3 /all products Present study
PS foam Tube reactor 425 76.1 /all products Present study PS cap Tube reactor 425 70.2 /all products Present study PS pure
chemical stirred vessel batch 370 65.40 / volatile products Kim et al. 1999
PS pure chemical
stirred vessel batch 380 70.91 / volatile products Kim et al. 1999
PS pure chemical
stirred vessel batch 390 71.63 / volatile products Kim et al. 1999
PS pure chemical
stirred vessel batch 400 71.56 / volatile products Kim et al. 1999
PS pure chemical
Fluidized bed Continuous
520 82.8 / oil with boiling point under
300 °C Ward et al. 2006
PS Waste Fluidized bed continuous
520 76.8 /all product Kaminsky et al.
2004 PS pure chemical
Py-GC/MS 600 79.53 /all product Audisio et al.
1992 PS pure chemical
Py-GC/MS 750 70.17 /all product Audisio et al.
1992
Styrene yield from PS pyrolysis from different studies
Conclusion • A reliable GC-FID procedure was developed for aromatics quantitative
analysis • Styrene was the most notable product of PS pyrolysis

Conclusions
• The main pyrolysis temperature zones for different
plastics are obtained;
• Main functional groups of pyrolysis products are
identified;
• A serial of reliable analytical methods were developed
for pyrolysis oil;
• High production rate of BETXS from different waste PS
pyrolysis provides suitable feedstock for high value PHA
production.

Future directions
• Maximizing the production rate of valuable chemicals like
BTEXS and TPA by adjusting the operation condition
and utilizing catalyst.
• Integrated applications of oil products from mixed
plastics pyrolysis including PHA feedstock supply and
fuel production.

Thank you
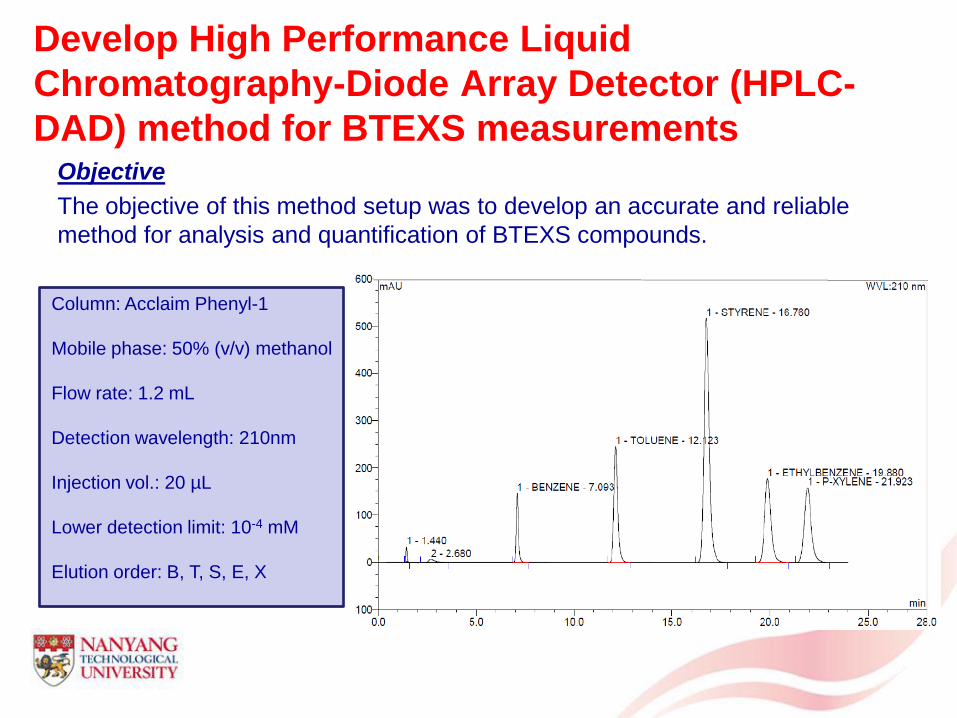
Develop High Performance Liquid
Chromatography-Diode Array Detector (HPLC-
DAD) method for BTEXS measurements Objective
The objective of this method setup was to develop an accurate and reliable
method for analysis and quantification of BTEXS compounds.
Column: Acclaim Phenyl-1
Mobile phase: 50% (v/v) methanol
Flow rate: 1.2 mL
Detection wavelength: 210nm
Injection vol.: 20 µL
Lower detection limit: 10-4 mM
Elution order: B, T, S, E, X

Calibration curves of BTEXS in GC-FID • High correlations (>0.999) were obtained

Feedstock Activation Energy,
KJ/mol
Pre-exponential Factor,
s-1
Correlation
Coefficient
PS pure 255 4.6E+18 0.99
PS foam 194 1.9E+14 0.99
PS bottle cap 265 6.2E+18 0.99
Average 238 - -
PET pure 221 1.7E+15 0.99
PET bottle 231 2.2E+16 0.99
PET card 233 3.5E+16 0.99
Average 228 - -
Coats-Redfern method :
• Activation energy (Ea) indicates the energy consumption during pyrolysis
• Ea for different PS products vary
• Ea for different PET products have similar value
Kinetic parameters of PS and PET pyrolysis
Conclusion • The energy consumption for PET products pyrolysis was lower than PS products
• The energy required for different PS products varied, and PS foam required least
• The energy required for different PET products were similar


