De-mystifying managed futures – why first class research and innovation are key to stay ahead of the game 01 November 2007 Managed futures have historically provided excellent diversification, strong returns and good downside protection Continuous shifts in risk premiums create new trends New derivative instruments, persistent research into trading and more efficient execution mean that the opportunity set is growing Research, Analysis and Strategy Group Thomas Della Casa Mark Rechsteiner Ayako Lehmann A member of Man Group
Transcript
De-mystifying managed futures – why first class research and innovation are key to stay ahead of the game
01 November 2007
Managed futures have historically provided excellent
diversification, strong returns and good downside protection
Continuous shifts in risk premiums create new trends
New derivative instruments, persistent research into trading
and more efficient execution mean that the opportunity set is
growing Research, Analysis and Strategy Group Thomas Della Casa Mark Rechsteiner Ayako Lehmann
A member of Man Group
De-mystifying managed futures – why first class research and innovation are key to stay ahead of the game 2 / 27
Table of contents
Executive summary 3
Introduction to managed futures 4
Growth of the global futures and forwards market 5
History of managed futures 6
Sub-strategies within managed futures 13
Systematic trend following strategies 14
Discretionary trend following strategies 15
CTAs benefit from changes in market perception of risk and return 15
Risk management plays a crucial role for CTA traders 16
CTAs provide downside protection due to low correlation 21
Managed futures in a diversified fund of hedge fund portfolio 23
Managed futures versus traditional investments 24
Will managed futures be able to protect capital going forward? 26
Conclusion 26
De-mystifying managed futures – why first class research and innovation are key to stay ahead of the game 3 / 27
Executive summary Managed futures traders – also called Commodity Trading Advisors (CTA) - mostly gain market exposures
through global futures, forwards, and option contracts. They typically have a strong directional bias, i.e. net long
or short exposures and can apply leverage. While there are a number of trading strategies among CTAs, some
of the most popular ones focus on systematic trading rules which use technical data to anticipate future price
movements.
CTA funds are a compelling choice for investors seeking to improve the risk-adjusted performance of both
traditional portfolios (stocks and bonds) and funds of hedge funds. Such funds offer a low correlation to almost
all other investments and can thus enhance the risk-adjusted performance of a diversified portfolio. Stress
testing and a favourable distribution of returns are also a strong argument for allocating to managed futures.
Institutional investors will be attracted by the transparency and the cash efficiency they offer. And the fact that
most managed futures managers are well regulated, and have always been so, is an additional argument for
investors demanding regulatory oversight.
Most managed futures strategies seek to benefit from trends. These trends are a persistent price phenomenon
that stem from changes in risk premiums – the amount of return investors will demand to compensate the risks
they are taking. Risk premiums vary massively over time in response to new market information, changes in
economic environment or even intangible factors like shifts in investor sentiment. When risk premiums decrease
or increase, underlying assets will have to be re-priced. Since investors typically have different expectations,
large shifts in markets result over several months or even years as expectations are gradually adjusted. As long
as there is uncertainty about the future, there will be trends for CTAs to capture.
Managed futures managers continuously research new technologies and trading approaches in order to identify
and profit from these trends. This scientific approach to managed futures trading has spawned a wide variety of
different trading strategies which today allow traders to capture even small trends. In addition, the introduction
of electronic trading allows managed futures managers to execute their trades and, if needed, reduce their
positions more quickly and with less cost, making even shorter-term and smaller scale opportunities accessible
and thereby expanding the investable universe for the investment approach.
This combination of market growth, persistent trends and ongoing research means that there is still substantial
room for development in the managed futures industry. However, as strategies become more sophisticated and
the race to develop new techniques and trade infrastructure heats up, the gap between the most developed
trading managers and the following pack will widen further.
Please note that in this research paper, the terms managed futures and CTAs are used interchangeably.
Introduction to managed futures As with many trading approaches, managed futures trading came to prominence in the US in the 1980s
following the liberalisation of financial markets. Global assets under management in managed futures has risen
from around USD 5 billion at the end of the 1980s to over USD 150 billion at the end of the second quarter of
2007, according to Barclay Trading Group. The growth of the futures markets in the 1970s and the explosive
development of technology have helped transform managed futures into one of the fastest growing hedge fund
strategies.
Figure 1: Growth of the managed futures industry 1985 to 30 June 2007
Source: Barclay Group. Latest data available.
Managed futures funds are pools of futures or forward contracts managed by professional money managers.
They are similar to a mutual fund in that individual or institutional investors have a share, though the investments
in this case are mainly futures and forwards contracts.
Unlike basic securities such as stocks and bonds which are held within mutual funds, a future or forward
contract is a derivative instrument, the value of which depends on the value of an underlying instrument. While
the notion of using derivatives to generate returns may create some associations with excessive leverage and
risky investment, managed futures managers apply strict risk control and mostly trade with high quality
counterparties on risk averse exchanges. Furthermore, futures can also be less risky than the underlying
investments.
Futures markets have a number of properties that make them an attractive investment medium. First, they tend
to be highly regulated by government appointed bodies, such as the Commodity Futures Trading Commission
(CFTC) and the National Futures Association (NFA) in the US. They also use clearing houses which guarantee
transactions, thus removing counterparty risk. The high liquidity of futures markets is an added benefit –
transaction costs are typically only a fraction of those charged in corresponding cash markets.
De-mystifying managed futures – why first class research and innovation are key to stay ahead of the game 4 / 27
Growth of the global futures and forwards market
Until the late 1970s, the futures industry was dominated by agricultural markets, whereby market participants
acted either as hedgers or speculators. Trading was referred to as “commodity trading” and this is also where
the term “Commodity Trading Adviser (CTA”) comes from.
Organised futures markets began in the US with the opening of the Chicago Board of Trade (CBOT) in 1848 as
American Midwest farmers trading with east coast merchants sought to establish a future value for their goods
so they could ensure that the value they received offset their capital investment.
CBOT was founded by 82 grain merchants and the first exchange floor was above a flour store. The exchange
was originally a cash market, where grain traders came to buy and sell supplies of flour, timothy seed and hay.
The earliest futures contract in the US was recorded in 1851 for the forward delivery of 3,000 bushels of corn.
Two years later, CBOT established the first standard futures contract on corn as a mechanism for farmers to
reduce volatility of earnings and increase predictability of cash flows.
The farmers sold their positions to shrewd market participants that had the knowledge and financial resources
to withstand the increase in their own volatility while being compensated for the extra risk they were assuming.
This represents the very basic risk transfer mechanism from commercial interest to non-commercial interests
and is the very foundation upon which all managed futures managers base their returns on. Today, a range of
sophisticated strategies are used to identify the risk transfer and risk premium,.
In 1975 CBOT introduced the first financial futures contract in the form of mortgage-backed certificates on the
Governmental National Mortgage Association. Today, the forwards and futures market is dominated by financial
futures offered around the globe. According to the Futures Industry Association (FIA), the total number of futures
and options traded on exchanges around the world reached 11.859 billion contracts by the end of 2006, up
19% from the previous year. In fact, the pace of growth has been accelerating in recent years.
Figure 2: Growth in volume of global futures contracts
Source: Futures Industry Association (FIA).
De-mystifying managed futures – why first class research and innovation are key to stay ahead of the game 5 / 27
As the chart above shows, more than 90% of all trade in exchange-traded derivatives is tied to interest rates or
equity prices today and this situation is expected to persist over the next few years. Trading volumes have
exploded in recent years as more and more exchanges introduced electronic trading and the cost of trading has
fallen significantly. Today, trading advisors are active in over 150 different markets worldwide.
History of managed futures The evolution of the Commodities Futures Trading Commission in 1974 was the catalyst for the rapid evolution
of CTAs and the futures industry as a whole. In the beginning, the strategies were more fundamentally driven
because the quantitative approaches and techniques that exist today had not yet been formalised. Computers,
data providers such as Bloomberg and Reuters as well as quantitative/ statistical models did not yet exist.
Figure 3: Managed futures track record (January 1985 to September 2007)
Source: Stark & Co., Inc. Performance in USD.
1970s – classical trading patterns The first managed futures managers used classical technical trading patterns that were fairly simple in nature
including “head and shoulders”, “support and resistance”, and “break-out” which have become less important
and are now being combined with more scientific approaches.
• “Head and shoulders” is a chart formation, that rises to a peak and subsequently declines, then rises above
the former peak and declines again and finally rises again, but not as high as the second peak and declines
once more. The first and third peaks are seen as shoulders, whereas the second peak forms the head.
• “Support and resistance” is a chart formation that shows prices oscillating between upper and/or lower
boundaries on more than one occasion.
• “Break-out strategy” looks for instances where the price breaks through support or resistance levels. When it
breaks through a level of resistance, a long position is initiated; the opposite is true when it breaks through a
support level. To implement such a strategy, the manager programmes computer algorithms saying that if
the last close is higher than the highest close of the previous 100 days, then this creates a buy signal. Figure
4 shows an example of a break-out strategy.
De-mystifying managed futures – why first class research and innovation are key to stay ahead of the game 6 / 27
Figure 4: Break-out strategy
Source: RMF Investment Management.
Although simple, these charts provided a rough, but good tool to detect the direction of changes in risk premia
and hence movements in market sentiment. Today, some discretionary traders still rely on interpretations of
these chart patterns, while most systematic managers have formalised the patterns that they seek to detect.
Beginning of 1980s – the age of the turtle traders In 1983, two famous commodity traders, Richard Dennis and William Eckhardt ran an experiment to determine
whether trading ability was genetically inherited or whether it could be learned and taught. Eckhardt thought it
was an innate skill, while Dennis believed that any person could be trained. To test the idea, they recruited 23
people screened for particular qualities from over 1000 applicants and trained them to be extraordinary traders
in just two weeks. They ended up earning an average return of over 80 percent per year and generating profits
of more than USD 100 million, proving Dennis right. This test also proved that successful trading can be
achieved through the use of mechanical rules, i.e. markets can be profitably traded in a rule-based manner so
long as those rules are applied consistently.
In 1989, the Wall Street Journal quoted Dennis as saying “We are going to grow traders just like they grow
turtles in Singapore” and the group was nicknamed “turtle traders” from that day forward. They became one of
the industry’s leading pioneers of mechanical trading systems and software.
Although the underlying “break-out” system was still chart based and traders bought when prices broke to new
highs and sold when prices broke to new lows, it was possible to replicate it successfully because of the
systematic nature of the strategy. The strategies that were once used gradually declined in profitability and
those managers who did not evolve and adapt to the ever changing markets have gradually fallen by the
wayside. The original rules of the “turtle traders” have been widely published but, while they were a highly
sophisticated approach in the 1980s, technological and scientific progress since then have massively increased
the spectrum of strategies available to managed futures traders.
Mid/end 1980s – computerised chart analyses By mid 1980s, strategies such as “breakouts” or “simple moving averages” were being supplemented by using
a 10-day look-back window, as it was easy to calculate them by hand. A simple or arithmetic moving average
(SMA) is calculated by adding the closing price of a security for a certain number of time periods and then
De-mystifying managed futures – why first class research and innovation are key to stay ahead of the game 7 / 27
dividing this total by the number of time periods, i.e. it is the average price over a certain time period. For the
calculation, each daily price is given equal weighting. Moving averages are typically used to identify the direction
of price trends. When a short-term average (i.e. 15-day period SMA) crosses above a longer-term average (i.e.
50-day period SMA), this indicates upward momentum, whereas the opposite would indicate downward
movement.
Figure 5: Simple moving averages
Source: RMF Investment Management.
During that period, managed futures traders started to use computers to analyse historical market prices. As a
consequence, trading signals were defined algorithmically resulting in the automatic generation of both long and
short signals. Although still simple, these programmes began to use variable inputs (parameters), ranging from
time periods of just a few days to up to 200 days. This was the beginning of the AHL1 success story, which by
1990 was already making good use of the diverse range of available futures markets. By then, many of today’s
most liquid financial futures contracts had been introduced, but computer-driven trading was still in its infancy
and was only practiced by a small minority.
Early 1990s – technological revolution
By early 1990s, new analytical software such as TradeStation, and more importantly the technological
revolution, had brought entire libraries of technical indicators to the trading floor. Many simple indicators (often
with misleading names such as Stochastics, Momentum, RSI, Exponential Moving Average and MAC) had
become readily available and were offered by most financial data vendors. This sparked a wave of strategy
testing and development among aspiring system traders. Computerisation allowed traders to sample more data
in a far shorter time period. This increased the scope of their trading, allowing them to perform such tasks as
finding the most profitable moving average length for a price series.
2000 – CTAs as a science By 2000, the success of systematically driven CTAs such as AHL was attracting researchers from a variety of
scientific fields. They started researching continuous trading, price forecasting and portfolio optimisation, which
contributed to the continuing success and sophistication of managed futures traders.
De-mystifying managed futures – why first class research and innovation are key to stay ahead of the game 8 / 27
1 AHL, one of the world’s leading managed futures programme is an investment manager of Man Investments and part of the Man Group plc.
De-mystifying managed futures – why first class research and innovation are key to stay ahead of the game 9 / 27
2004 – Europe overtakes the US
2004 was a difficult year for managed futures traders. As a result, it was the year that separated the wheat from
the chaff. While European managed futures houses massively increased their research teams from roughly ten
to 50-70 people on average and improved electronic trading, their US equivalents were left behind. Different
from Europe, managed futures traders in the US were mainly global macro traders that ran a managed futures
portfolio on the side. Hence their expertise lay more in trading financial markets and was less quantitatively
driven. As a result, most of the top class managed futures traders can nowadays be found in Europe, where
CTA traders keep integrating the latest research findings from Universities such as AHL working with the Oxford
University in order to stay ahead of the game. This development is quite amazing, considering the fact that
some of the first trading methodologies such as moving averages were invented in the US. But while the
Europeans kept on researching new trading methods, the US traders decided to stick to their set strategies,
arguing that while a strategy might not be successful now, time will change and the strategy will again be
successful. This shows that technology plays a crucial role for managed futures trading.
Today – first class research Today, CTAs are investment companies which need multi-billion dollar assets under management to fund
their technology and research teams. System-driven trading represents the lion’s share of futures trading
volume and CTA managers use a vast range of different trading techniques. The table below is not intended to
be exhaustive, but gives a snapshot of some of the techniques used today.
Table 1: A sample of CTA trading methods: CTA trading techniques Description
Serial correlation analysis Correlation of a variable with itself over successive time intervals. Managed futures traders use serial correlation to check to what degree past prices predict future prices
Trading of volatility break-out When the percentage price move of an asset exceeds a certain threshold
Position measuring based on volatility Positions are sized as a function of volatility. In a high volatility market environment, positions are scaled down and vice versa
Conditional execution Trading signals are placed in the market with pre-defined conditions attached to them, i.e. “buy at market” if “volatility is below x and price above 100”.
Term structure trading Analysis of interest rate differentials as well as term structure premia in the markets. One implementation of this is the ever popular carry trade in the currency markets.
Reversal pattern trading Predictive strategy that tries to time significant market reversals.
Probability signals: position weighting If statistically favourable probabilities of a directional move are measured, then position sizes are increased
Algorithmic trading/ high frequency trading/ execution robots
Traders are replaced by computers which execute the trades automatically, often generating very short-term (intra-day) trading
Non-parametric approaches Reduce the reliance on a particular time frame in order to derive more stable performance. Trading is also spread out to a larger time frame in order to reduce market footprint.
Dynamic sector allocation Allocation to different market sectors such as commodities or currencies are adjusted in size, depending on opportunities and/or trends.
CTA trading techniques (continued) Description
Behavioural finance Strategies that rely on persistent errors in the market place driven by biases of the human behaviour.
Fundamental methods Econometric models that value certain markets in relationship to the economic cycle.
Below are some of the above mentioned strategies in more detail.
Figure 6: Serial correlation analysis
• Moving averages respond to serial correlation which are visible as trends
• Short-term moving averages that are higher than long-term moving averages trigger buying signals
Source: RMF Investment Management.
Figure 7: Trading of volatility break-out
• The green line is the “expected drift”, i.e. assuming no volatility. That is where the manager should end up in
one, two or three months assuming average performance every month
• The cone, i.e. the two lines in orange and blue, show one standard deviation from the expected path, both
positive and negative. A performance of one standard deviation above the mean in one, two or three months
would lift the manager to the upper line
• Conclusion: by calculating the cone, the manager can estimate the expected return of the trade by judging
what the probability of a positive result versus a negative result would be.
80
100
120
140
160
180
200
Dec
-01
Jun-
02
Dec
-02
Jun-
03
Dec
-03
Jun-
04
Dec
-04
Jun-
05
Dec
-05
Jun-
06
Dec
-06
Jun-
07
Dec
-07
Jun-
08
Dec
-08
Jun-
09
Dec
-09
Jun-
10
Source: RMF Investment Management.
De-mystifying managed futures – why first class research and innovation are key to stay ahead of the game 10 / 27
Figure 8: Position measuring based on volatility
• Risk averse position sizing
• If short-term (red) volatility is higher, 100 contracts are traded
• If short-term volatility is lower, 200 contracts are traded
Source: RMF Investment Management.
Figure 9: Reversal pattern trading
• Buy and sell signals follow the same pattern
• Reversal refers to the trade opposing the price direction
Source: RMF Investment Management.
De-mystifying managed futures – why first class research and innovation are key to stay ahead of the game 11 / 27
De-mystifying managed futures – why first class research and innovation are key to stay ahead of the game 12 / 27
The competitive pressure in financial markets forces CTAs to continuously develop stronger strategies so as to
stay ahead of the competition and the gradual erosion of returns that applies to all statistically driven trading
systems.
Some people call managed futures black box trading. As the above description of the evolution of managed
futures shows, this is misleading. A black box is an input/output device such as a transistor. Most users are not
familiar with the logic inside that black box. The term black box suggests that CTAs trade strategies investors
cannot understand. This is not the case. Within the investment world, CTAs have an unusually high degree of
rule based (no ad hoc decision making) investment strategies. Profitable trading strategies are hard coded and
often programmed in computer algorithms, such as the one mentioned for the break-out strategy.
Managers will be reluctant to divulge the exact composition of their trading models to prevent their proprietary
ideas from being stolen. However, while a managed futures manager will not be asked to reveal the exact
programming for his trades when being screened by a fund of hedge fund manager, it is crucial that the
developer understands and explains his trading strategy and the associated risks. Only when the managed
futures manager is adhering to a predefined strategy can he give the investors more comfort in evaluating past
performance and in estimating future risk and returns.
In contrast to other investment styles, managed futures have almost no ad hoc trading decision. Compared to
managed futures managers most traditional equity portfolio advisors such as mutual funds conclude their
investment decisions from a changing mix of fundamentals, news and technical data. To this end, their cause
and effect are much more unpredictable than the CTA models.
Research is key
The increasing liquidity of new instruments and markets such as credit derivatives, emerging markets, ETFs and
swaps has generated many more trading opportunities for CTA managers, emphasising the importance of
strong research capabilities. The research race is continuing and the entry level cost for new CTAs has become
very high due to the institutional standard of computing and analytics. Fully automated trading systems have
continued to develop since the introduction of electronic futures exchanges. As the list above shows, today’s
systems are complex and use different techniques to analyse the vast amount of data available. The zero sum
game of futures trading forces all participants to continuously research the behaviour of their peers and to adapt
their strategy in an effort to stay ahead in the pursuit of excess returns.
Exposure across a wide range of sectors helps to smooth returns, as they often tend to exhibit different
behavioural characteristics. The factors affecting the world commodity markets, for example, differ from those
influencing financial futures. While long-term trends are usually driven by economic growth and stability in both
cases, short or medium term movements in the commodity markets are sensitive to seasonal effects as well as
sudden changes in supply or demand resulting from environmental or political factors. Commodities futures
trading allows investors to reap gains from the sometimes fervent upward and downward price movements that
result from the consequent uncertainty that frequently drives these markets.
The significant growth in the number and diversity of futures markets in recent years has facilitated a broadly
diversified approach across geographical regions and asset classes. This approach aims to control risk by
avoiding over-concentration within particular markets.
Sub-strategies within managed futures The managed futures universe can be broadly divided into systematic and discretionary strategies. Systematic
strategies make use of historical price data and/or historical relationship that can be tested to anticipate future
price movements and rely heavily on computer generated, technical trading signals. Conversely, discretionary
traders rely on the judgement of the manager and their expertise in a particular market to make investment
decisions. Both methods have their advantages and disadvantages, however, they are complementary as they
tend to make errors (i.e. lose money) at different points in time.
The more prevalent systematic approach relies on the application of statistical analysis to evaluate the
movements of markets. Such information may include daily, weekly or monthly price fluctuations, volume
variations, and changes in open interest. They rely heavily on computer generated trading signals to maintain a
systematic and disciplined approach and can construct widely diversified portfolios by combining multiple
systems and time frames to reduce overall volatility.
A number of sub-strategies can be identified within systematic trend-following strategies. The following focuses
on three of them:
• Trend following – seek to capitalise on medium to long-term trends in a variety of markets
• Trend reversal – seek to capitalise on key turning points in liquid futures markets
• Contrarian (counter-trend) – aim to sell near market tops and buy at market bottoms
The chart below shows the entry points for the three different systematic trading strategies.
Figure 10: Entry points of three different systematic trading strategies
Trend reversal (sell)
Contrarian (buy)
Trend reversal (buy)
Trend following (buy)
Trend reversal (sell)
Contrarian (buy)
Trend reversal (buy)
Trend following (buy)
Source: Man Investments. Schematic illustration.
Systematic trading is based on computerised quantitative models that use moving average prices, break-outs of
price ranges or other technical rules to generate buy and sell signals for a set of markets. With the emergence of
electronic trading, execution of these strategies is becoming increasingly automated.
De-mystifying managed futures – why first class research and innovation are key to stay ahead of the game 13 / 27
Systematic trend-following strategies
Systematic trend followers are a sub-category within systematic strategies. They can pursue opportunities
across many different time periods. Short-term trades typically last between three to five days, but they can be
as short as intraday or as long as a month. These trades try to capture rapid moves and the managers base
their activity on swift fluctuations in prices. They rely heavily on liquidity and high volatility for returns, and
typically have a low correlation to long-term CTA managers. Unlike long-term CTAs, shorter term traders are
often hampered by strong, persistent trends as these periods tend to offer fewer short-term price fluctuations.
The time horizon for medium-term trades lasts on average twelve weeks and long-term trades typically exceed
nine months.
The following is an example of how a managed futures trade implemented by a long-term systematic trend-
follower might work. It demonstrates a simple channel breakout strategy applied to the gold futures market. The
chart below shows a price channel created using 30 day high and low prices as represented by the blue and
grey lines respectively. Long and short trading signals are generated as the price reaches the upper or lower
boundaries.
Figure 11: 30-day price channel in the gold futures market
Source: Bloomberg. Performance in USD.
Managers will typically use a number of different signals in combination to determine trade entry and exit points.
Furthermore, it is unlikely that allocation size will remain constant during the life of the trade as managers may
vary the size and degree of leverage of their position based on contract volatility. In addition managers have to
roll the contracts, which results in small additional transaction costs being incurred.
AHL, one of the world’s leading systematic managed futures traders, runs programmes that are quantitative and
primarily directional in nature. Trading takes place around-the-clock and real-time price information is used to
respond to price movements across a diverse range of global markets encompassing stock indices, bonds,
currencies, short-term interest rates and commodities. The instruments traded are primarily futures contracts
and foreign exchange and metal forwards. Investment rules are executed within a systematic framework.
De-mystifying managed futures – why first class research and innovation are key to stay ahead of the game 14 / 27
Figure 12 below shows the systematic directional strategy applied to the Euro/US-dollar currency pair. One can
see that this strategy is able to generate returns from both long and short positions. AHL scales down positions
when market volatility rises and vice versa as part of its risk management process. In addition, portfolio risk is
monitored on a daily basis to ensure that instrument, sector and regional exposures are within predefined limits.
Figure 12: Example of active trading in a single market – EUR/USD currency pair
Source: Man database/AHL. The illustration is based on simulated rather than actual positions and returns. It does not represent the actual
performance AHL has achieved in this market. Date range: 1 January 2000 to 31 July 2007.
Discretionary strategies
Discretionary managed futures managers apply opportunistic strategies drawing on both fundamental and
technical market analysis. They rely less on computer generated signals and more on their experience and
trading skills. Discretionary traders rely on fundamental analysis by studying factors that affect supply and
demand of a particular commodity to predict future prices. These may cover issues as diverse as economic
strength, governmental policies, domestic and foreign political events or the weather. Fundamental analysts
believe that markets have a fair value to which they must converge over the medium term and seek to identify
and profit from periods of over/under-valuation. As discretionary traders rely on human input, the number of
opportunities that can be traded is smaller compared to systematic trading strategies.
CTAs benefit from changes in market perception of risk and return
In general, most managed futures managers tend to view price trends as a function of supply and demand for a
particular commodity or financial instrument or as shifts in risk premium for different asset classes. There are a
large number of factors that can lead to such shifts in risk premiums, such as the changing state of the
economy, specific events, market news, or the emergence of information not yet incorporated in the current
price. Market participants have different expectations of the future, so adjustments to expectations and the
inclusion of new information in the price tends to be a gradual process.
CTAs often employ strategies that are constructed to take advantage of such movements. In most cases the
strategies do not seek to identify the source of the change but rather to take advantage of the change in the
prices themselves. This is an important factor regarding the long term profitability of managed futures, since
De-mystifying managed futures – why first class research and innovation are key to stay ahead of the game 15 / 27
De-mystifying managed futures – why first class research and innovation are key to stay ahead of the game 16 / 27
drivers and events continuously change over time and trying to identify an unknown source for an unknown
event is a strategy that eventually becomes less stable as a forecasting tool. However, by identifying changes in
risk premiums through prices, the strategy becomes more robust over time. Trend followers, for example, take
advantage of the emergence of trends and dynamically manage exposure to such movements. In short, trend
following strategies attempt to identify the beginning of a trend, take a position and exit it as it ends. Some
managers apply stop-loss limits to limit losses. Positions can be built up for days, weeks or months and can be
reduced quickly during adverse/highly volatile periods.
Risk management plays a crucial role for CTA traders
Managed futures managers – whether systematic or discretionary – allocate a significant amount of their time to
risk management. The major risk monitoring measures and focus areas are the following:
• Value-at-Risk (VaR) - measures the expected maximum loss from an investment portfolio when future market
conditions are similar to those in the model. The value is determined for a specific time interval and certain
level of confidence.
• Stress testing - measures current market positions against historical price data. This allows the CTA
manager to see how his current position sizes would have performed historically, especially during periods of
market stress.
• Implied volatility - is a forward-looking measure of potential risk that is analysed for each market
• Leverage - if levels approach certain multiples of prevailing net asset value, a review is triggered
• Margin-to-equity ratios – if initial margin requirements relative to prevailing net asset value reach predefined
levels, a review is undertaken that may result in a reduction in positions
• Net exposures to sectors and different currencies
But at the end of the day the infrastructure of the managed futures manager is relevant. Only managers that stay
at the forefront of new research and trading ideas will be able to cope with the more and more difficult risk
monitoring challenges that exist today.
Electronic trading and slippage
The introduction of electronic trading technology is having a positive impact on industry liquidity. Trades are
being executed within couple of minutes of price sampling and the issuance of trade instructions nowadays and
costs are falling. In recent years, this has helped managers to increase their assets under management while
controlling slippage costs (the difference between the price at which trades are first identified and ultimately
executed), as shown for AHL in figure 13 below. Temporary slippage fluctuations in a particular market are
normal and can occur as a result of variations in liquidity or execution quality. However, a sustained and
significant increase in overall slippage across all markets is a warning sign that the weight of capital being placed
behind trades cannot be sustained without degrading returns. Consequently, CTA managers monitor slippage
closely in order to assess execution quality as well as gauge capacity, which is a crucial consideration for any
alternative investment approach premised on the exploitation of a recurrent market inefficiency. Despite a steady
increase in assets under management over the years, AHL has successfully contained overall slippage within a
relatively tight band. As assets under management have increased, AHL has been able to extend trading
opportunities by taking advantage of the steady proliferation in futures markets and contracts, and by
developing and diversifying its systems. For example the introduction of an order streaming process improved
order placement and execution and has helped in managing slippage. AHL is able to draw on extensive
slippage data, analysis and experience to determine capacity limits. The manager’s assessment is that there is
quite considerable headroom to manage greater assets, even discounting the potential for systems
development and the addition of new markets to its portfolios.
Figure 13: Electronic trading enables reduction of slippage per lot
Source: Man database/AHL. All data have been extracted from the underlying AHL trading system. The rolling 3 month slippage per lot
figures are based upon daily dollar slippage per lot and the daily absolute number of lots traded. Prior to 13 October 1993 the data were
stored in a different format and so may not be as reliable as the data after that date. ¹Please note that the funds under management is at
30 June 2007 and that slippage data are as at 31 August 2007. Latest data available.
Trading on margin, leverage and notional funding – a cash efficient trading methodology
Trading on margin
Futures and forwards are traded on margin – meaning that only a small deposit is required to take a position.
Depending on the volatility of a commodity, margins can vary between 0.05% and 5% of the notional value of
the commodity. One can therefore achieve 100% investment exposure with just a fraction of the capital required
through the inherent leverage of futures contracts. This frees up capital which can be invested elsewhere or
used to adjust the leverage of one’s portfolio to match the client’s risk appetite. Hedge funds and CTAs who
have no interest in the delivery of the physical commodities, but who use offsetting trades, make active use of
the cash efficiency of futures contracts through leveraging.
Leverage
The leverage is the ratio between the actual notional contract value and the deposited cash in the broking
account. An investor in T-Bond futures who chooses to deposit 10% of the actual underlying commodity has
the following leverage. One T-bond contract has a notional value of USD 100’000 and can be purchased based
on a deposit of USD 10’000 at the broker. If the USD 100’000 bond moves by 1% equalling USD 1000, the
futures investor has earned or lost 10% on his USD 10’000 deposit, which reflects 10 times leverage. If the
trader had decided to purchase two contracts with the USD 10’000 deposit the leverage would have been 20-
fold.
De-mystifying managed futures – why first class research and innovation are key to stay ahead of the game 17 / 27
De-mystifying managed futures – why first class research and innovation are key to stay ahead of the game 18 / 27
Notional funding
Notional funding is a structure predominantly used in the hedge fund sector, and in particular applied by CTA
investors, to make the most efficient use of the capital invested. The concept suggests replacing some of the
equity invested with supplemental funding that is neither cash nor other assets, such as trading on margin. The
model was further enhanced when managed accounts became a common tool in the hedge fund sector,
helping investors to take advantage of the benefits of levering up low-risk assets. The investment is effectively
the margin assets plus a security cash cushion. The margin to equity ratio measures how much of an investor's
money is tied up to meet margin requirements. A margin to equity ratio of 20% indicates that only a fifth of the
investor's investment or managed account balance is tied up in margin. Most managers target an annual return
volatility of between 10 and 15% per annum. This translates to a gross leverage for the average manager of
around 300-800% of NAV, or a margin to equity ratio (ME ratio) of 5-15%. These will fluctuate in accordance to
prevailing market conditions. For example, in turbulent markets characterised by high volatility and sudden
reversals (such as July and August 2007), directional managers significantly reduced their market exposures.
It is important that investors understand the approach and consequences of notional funding as it may change
the return on an investment. If a hedge fund has a minimum account size of USD 5 million and only USD 2
million is used as margin, the client will often wish to merely deposit USD 2.5 million and instruct the managers
to trade the account as though it were fully funded at USD 5 million. Notional funding may however be a double-
edged sword.
During a drawdown, accounts that are notionally funded will always suffer larger percentage declines than fully
funded accounts. Notional funding increases the volatility of the returns in percentage of the invested capital. A
cash investment of USD 2.5 million with another USD 2.5 million as notional funding effectively doubles the
amount invested for a total trading level of USD 5 million. So, a gain of USD 1 million would represent a 40%
return on the notional capital while a loss of USD 1 million would represent a negative return of -40%.
Technically, there are two ways to incorporate the notional funding concept. The first is called ‘cash free-up’,
which applies when an existing trading level is maintained while cash is withdrawn and replaced by a notional
amount. The withdrawn capital may then be reinvested in order to increase total exposure but levered up by the
ratio between the trading level and the notional capital. If the notional funding concept uses capital free-up then
one should keep in mind that there are always opportunity costs, and this freed cash should at least outperform
the risk-free rate (i.e. T-bills). The other method would be to boost the trading level by increasing the notional
amount. Both methods are accepted in the industry and are widely used. The hedge fund will accept notional
funding depending on the assessment of the availability of market opportunities for the fund.
With the concept of notional funding, an investor may increase his exposure considerably and thus enhance
profits. Notional funding is superior to traditional ways of levering a portfolio from a cost perspective, as it does
not require credit lines. Financing is in fact free without reducing the profit opportunities. With this approach a
fund of hedge funds provider may substantially enhance its cash management, as the cash saved with notional
funding can be invested into other strategies, which is beneficial as long as its return is higher than the return of
T-bills. Nevertheless, if such an approach is run by a single hedge fund or a fund of hedge funds, a state-of-the-
art risk management system is essential for monitoring the account on a daily basis, the margin-to-equity ratio
and the exposure in order to assess the risk properly and intervene according to pre-defined risk parameters.
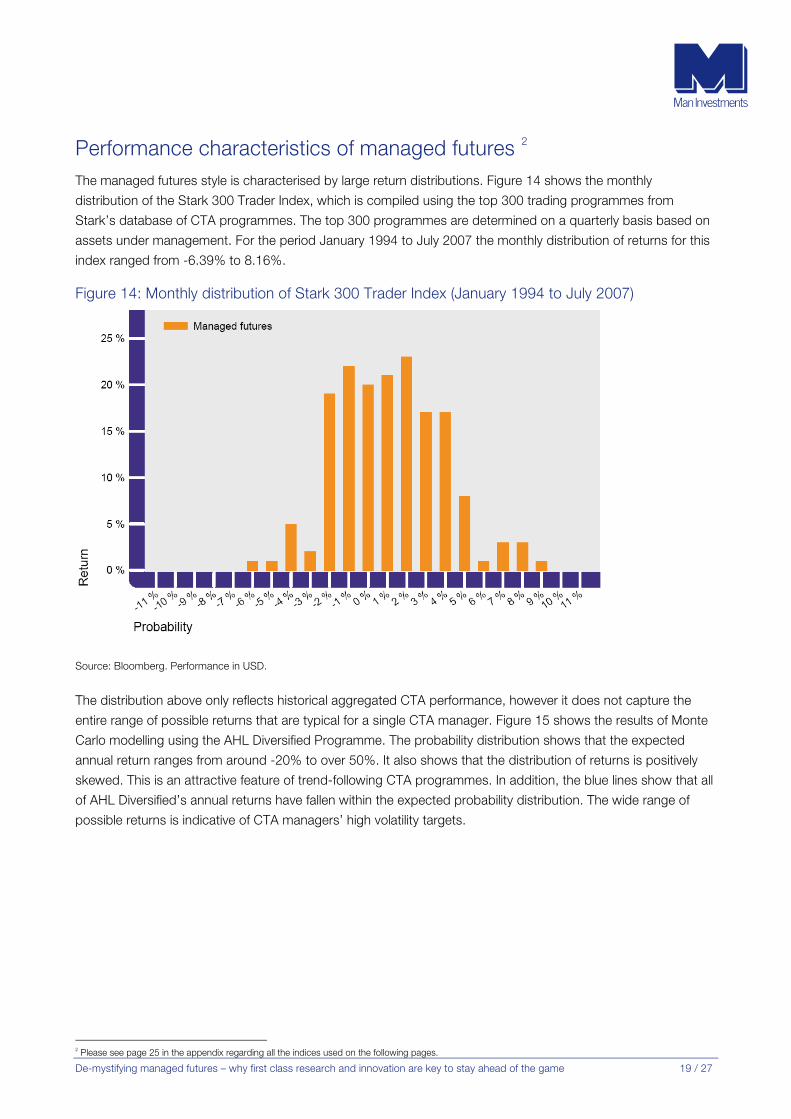
Performance characteristics of managed futures 2
The managed futures style is characterised by large return distributions. Figure 14 shows the monthly
distribution of the Stark 300 Trader Index, which is compiled using the top 300 trading programmes from
Stark’s database of CTA programmes. The top 300 programmes are determined on a quarterly basis based on
assets under management. For the period January 1994 to July 2007 the monthly distribution of returns for this
index ranged from -6.39% to 8.16%.
Figure 14: Monthly distribution of Stark 300 Trader Index (January 1994 to July 2007)
Source: Bloomberg. Performance in USD.
The distribution above only reflects historical aggregated CTA performance, however it does not capture the
entire range of possible returns that are typical for a single CTA manager. Figure 15 shows the results of Monte
Carlo modelling using the AHL Diversified Programme. The probability distribution shows that the expected
annual return ranges from around -20% to over 50%. It also shows that the distribution of returns is positively
skewed. This is an attractive feature of trend-following CTA programmes. In addition, the blue lines show that all
of AHL Diversified’s annual returns have fallen within the expected probability distribution. The wide range of
possible returns is indicative of CTA managers’ high volatility targets.
2 Please see page 25 in the appendix regarding all the indices used on the following pages.
De-mystifying managed futures – why first class research and innovation are key to stay ahead of the game 19 / 27
Figure 15: Probability distribution of AHL Diversified Programme¹
Source: Man database/AHL. ¹AHL Diversified Programme - represented by the performance of Athena Guaranteed Futures Limited from 20
December 1990 to 31 May 2007 (prior to 1 October 1997, actual trading results have been adjusted to reflect the current guaranteed public
fee structure). Performance in USD.
Compared to other hedge fund styles, managed futures have the highest return potential but also high volatility
and downside deviation. They also have lower Sharpe and Sortino ratios than other hedge fund styles, reflecting
their greater volatility. However, as managed futures typically have a low correlation to these hedge fund styles,
the strategy tends to enhance the overall Sharpe and Sortino ratio of a diversified fund of hedge fund portfolio.
(see section “Diversification benefits of managed futures” below where the correlation and long term benefits of
managed futures will be explored in greater detail).
Investors should also be reminded that Sharpe and Sortino ratios are not the only statistical measures one
should look at. As managed futures are not normally distributed, these statistical figures may not correctly
capture the complete risk/return profile of this style. Hence higher moments such as skewness and kurtosis
should also be taken into account.
Diversification benefits of managed futures The developments over the last twenty years have made managed futures a specialised but increasingly
significant asset class. Importantly, high quality managed futures funds are capable of achieving attractive
returns with risks comparable to those of a traditional stock investment. Furthermore, managed futures can
enhance the diversification of a portfolio and therefore play an important role in improving the risk and reward
characteristics of that portfolio, whether traditional or alternative.
De-mystifying managed futures – why first class research and innovation are key to stay ahead of the game 20 / 27
CTAs provide downside protection due to low correlation
CTAs are a worthwhile addition to a portfolio. Because managed futures provide an opportunity to profit from
both upward and downward moves in the underlying assets and cover a wide range of commodity and financial
contracts, it is possible to achieve a low level of correlation with both alternative and traditional forms of
investment, as can be seen in the figures below.
Figure 16: Correlation of hedge fund styles and FoF (January 1994 to September 2007)
Source: Man Investments and Bloomberg. Performance in USD.
Figure 17: Correlation of stocks and bonds (January 1994 to September 2007)
Source: Man Investments and Bloomberg. Performance in USD.
Optimal diversification can be achieved when there is no, or only low, correlation between the constituent
elements of a diversified portfolio. The less correlated to other hedge fund styles and traditional investments the
returns of a CTA fund are when these struggle, the more value the CTA can add in a diversified portfolio. Figure
18 below shows that managed futures generated returns quite independently from fund of hedge funds
consisting of equity hedge, relative value, event driven and global macro during the ten worst months for them.
De-mystifying managed futures – why first class research and innovation are key to stay ahead of the game 21 / 27
Figure 18: During worst months for funds of hedge funds (January 1994 to September 2007)
Source: Man Investments, Bloomberg, and Stark & Co., Inc. Performance in USD.
Furthermore, managed futures have proven that they are able to protect capital during market shocks, such as
when the Internet Computer Technology (ICT) bubble burst or during the Russian credit crisis.
Figure 19: Correlation to managed futures during the bursting of the ICT bubble, including 9/11 (30 August 2000 to 30 March 2003)
Source: Man Investments and Bloomberg. Performance in USD.
The high correlation of managed futures to global macro shown in the figures above is due to the fact that the
differentiation between global macro and managed futures is sometimes blurred. Within the HFRI Macro Index
roughly 20% can be considered systematic managed futures managers, whereas the remaining 80% are
discretionary traders. But as they also rely on models to a certain extent, their performance can be fairly similar
to managed futures performance.
De-mystifying managed futures – why first class research and innovation are key to stay ahead of the game 22 / 27
Figure 20: Monthly returns during the Russian credit crisis (1 July 1998 to 30 September 1998)
Source: Man Investments and Bloomberg. Performance in USD.
The above shows that managed futures have the potential to provide significant downside protection during
periods of market turbulence.
Managed futures in a diversified fund of hedge fund portfolio
The below table shows that adding 20% managed futures to a diversified fund of hedge fund portfolio consisting
of four hedge fund styles (i.e. equity hedge, relative value, event driven, and global macro) can have a positive
impact on the distribution of monthly returns and significantly reduce fat tail risk.
Table 2: Diversified fund of hedge fund portfolio with/without managed futures January 1994 to September 2007
HFRI Fund of Funds Composite Index 80% FoF/ 20% MF Change
Source: Bloomberg and Stark & Co., Inc. Performance in USD. Please note that green represents favourable changes, whereas red reflects
unfavourable changes.
Managed futures also provided protection during the worst months for world bonds, although to a lesser degree
than for worst equity months.
De-mystifying managed futures – why first class research and innovation are key to stay ahead of the game 25 / 27
De-mystifying managed futures – why first class research and innovation are key to stay ahead of the game 26 / 27
Will managed futures be able to protect capital going forward?
It is expected that managed futures will also be able to protect capital during adverse market conditions in the
future. Whenever there are market panics, strong trends in markets emerge, thereby creating profitable trading
opportunities for CTA managers. While stock corrections can be protected with long bond positions (flight to
quality reaction), protection also comes from other sectors such as currencies and commodities which offer
offsetting opportunities during volatile markets.
However, one should not forget that managed futures cannot protect against adverse market conditions within
a short period of time. If markets suddenly sell off after a strong rally, managed futures funds will lose money. It
usually takes them between one and two weeks to reposition themselves. However, if a bear market lasts for
several months, managed futures can benefit from this situation by building up short positions. Nevertheless,
fast reversals can be partially protected with exposures into other markets or with short-term strategies. Quite
often, managed futures systems are already positioned short in crisis scenarios, even before the final price
collapses.
Conclusion Managed futures have a proven long term performance track record. This, alongside with features such as high
liquidity, strong regulations, low or no counterparty risk, transparency and cash efficiency, combine to create an
appealing investment proposition on a standalone basis.
However, while managed futures may be of interest as a stand alone investment, they really add value as a
portfolio diversifier. When combined to a fund of hedge fund portfolio or to equities and bonds, managed futures
substantially reduce downside deviation and worst drawdown, thereby smoothing the overall risk/return profile.
Additionally, the futures industry is evolving as new technologies and trading approaches are continuously
developed. This process is driven by continuous research and requires persistent investment in infrastructure
and systems. As a result, it is creating clear economies of scale and constantly widening the gap between the
largest and most established players and the rest of the industry while creating massive barriers to entry to new
players.
An investor considering an allocation to managed futures should view them as a long-term investment, with a
holding period of at least three to five years. A manager’s track record, reputation and experience should all be
considered when selecting a CTA manager. Alternatively, investors can obtain a CTA allocation by investing into
a fund of hedge fund portfolio that includes managed futures.
De-mystifying managed futures – why first class research and innovation are key to stay ahead of the game 27 / 27
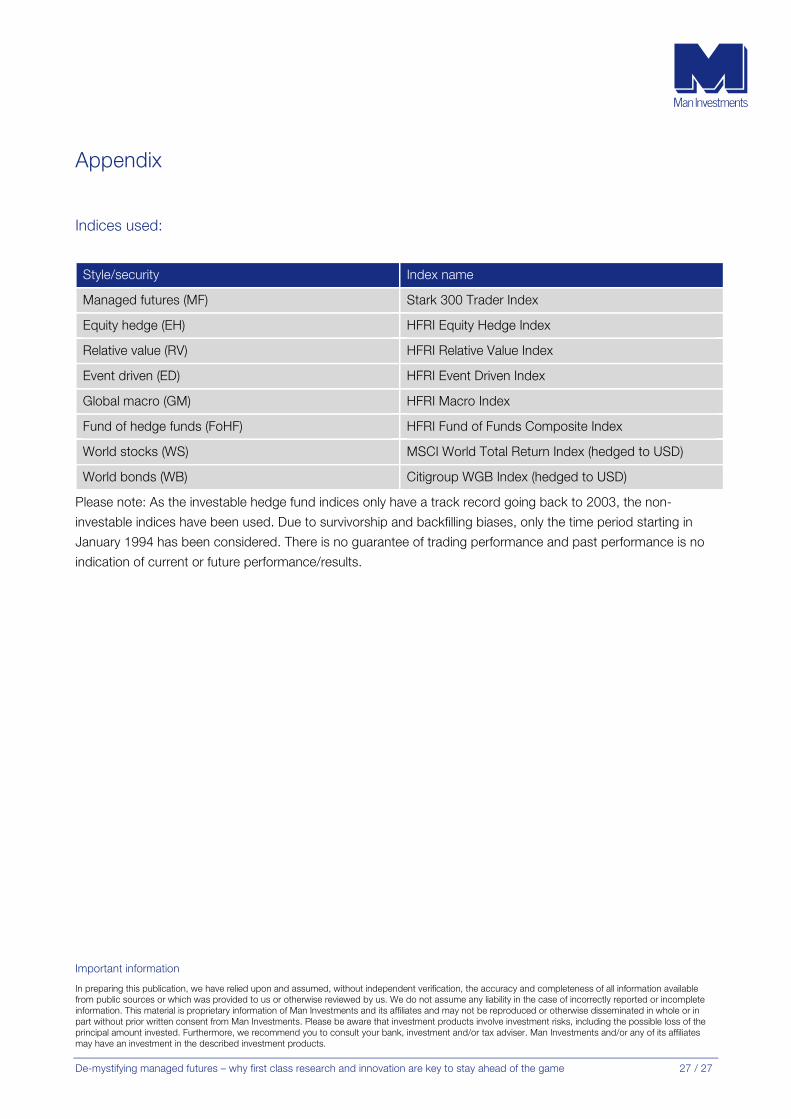
Appendix
Indices used:
Style/security Index name
Managed futures (MF) Stark 300 Trader Index
Equity hedge (EH) HFRI Equity Hedge Index
Relative value (RV) HFRI Relative Value Index
Event driven (ED) HFRI Event Driven Index
Global macro (GM) HFRI Macro Index
Fund of hedge funds (FoHF) HFRI Fund of Funds Composite Index
World stocks (WS) MSCI World Total Return Index (hedged to USD)
World bonds (WB) Citigroup WGB Index (hedged to USD)
Please note: As the investable hedge fund indices only have a track record going back to 2003, the non-
investable indices have been used. Due to survivorship and backfilling biases, only the time period starting in
January 1994 has been considered. There is no guarantee of trading performance and past performance is no
indication of current or future performance/results.
Important information
In preparing this publication, we have relied upon and assumed, without independent verification, the accuracy and completeness of all information available from public sources or which was provided to us or otherwise reviewed by us. We do not assume any liability in the case of incorrectly reported or incomplete information. This material is proprietary information of Man Investments and its affiliates and may not be reproduced or otherwise disseminated in whole or in part without prior written consent from Man Investments. Please be aware that investment products involve investment risks, including the possible loss of the principal amount invested. Furthermore, we recommend you to consult your bank, investment and/or tax adviser. Man Investments and/or any of its affiliates may have an investment in the described investment products.