54
Debugging Andrew Emerson, Paride Dagna and others SCAI, Cineca 29/10/2014 1 Intro to HPC programming: tools and techniques
| Date post: | 25-Apr-2018 |
| Category: |
Documents |
| Upload: | vuongthuan |
| View: | 226 times |
| Download: | 1 times |

Debugging
Andrew Emerson, Paride Dagna and others
SCAI, Cineca
29/10/2014 1Intro to HPC programming: tools and
techniques

Contents
• Introduction
• Before using the debugger– compiler options
– analysing core files on BG/Q
• Preparing for the debugger– IBM BG/Q– IBM BG/Q
– Other architectures
• Debugging a serial program with gdb
• Parallel Program debugging with gdb, PMPI and Totalview
29/10/2014 2Intro to HPC programming: tools and techniques
Introduction
• One of the most widely used methods to find out the reason of a strange behaviour in a program is the insertion of “printf” or “write” statements in the supposed critical area.
• However this kind of approach has a lot of limits and requires frequent code recompiling and becomes hard to implement for complex programs, above all if parallel. Moreover sometimes the error may not be obvious or hidden. error may not be obvious or hidden.
• Debuggers are very powerful tools able to provide, in a targeted manner, a high number of information facilitating the work of the programmer in research and in the solution of instability in the application.
• For example, with simple debugging commands you can have your program run to a certain line and then pause. You can then see what value any variable has at that point in the code.
29/10/2014 3Intro to HPC programming: tools and techniques

Debugging process
The debugging process can be divided into four main steps:
1. Start your program.
2. Make your program stop on specified conditions.
3. Examine what has happened, when your program has stopped.stopped.
4. Change things in your program, or its compilation, so you can experiment with correcting the effects of one bug and go on to learn about another.
29/10/2014 4Intro to HPC programming: tools and techniques
Before starting the debugger
• Before starting the debugger, check your compiler documentation to see what compile or run-time checks are available.
• Some compiler options to try
– switch down the optimisation level (e.g. from –O3). High or “aggressive” optimisations can cause code changes and introduce bugs.
– turn on compiler options such as –C or –check-bounds to look for incorrect array indices.incorrect array indices.
– for xlf try options such as –qflttrap=enable:zerodivide
– use options for uninitialised variable detection, etc.
• For performance reasons many run-time checks are switched off by default. Remember to switch them off again when debugging is complete.
• If possible also worth using a different compiler to see if the problem persists, or more useful error or warning messages are obtained.
29/10/2014 5Intro to HPC programming: tools and techniques

Debugging on the IBM BG/Q
• Because of its particular architecture (cannot login directly on the compute nodes) debugging is more complex on BG/Q.
• IBM provides a number of utilities which can be used without invoking a debugger.
• For further information check out the Cineca HPC • For further information check out the Cineca HPC user guide:
http://www.hpc.cineca.it/sites/default/files/Debug%20guide_0.pdf
29/10/2014 6Intro to HPC programming: tools and techniques
IBM BG/Q
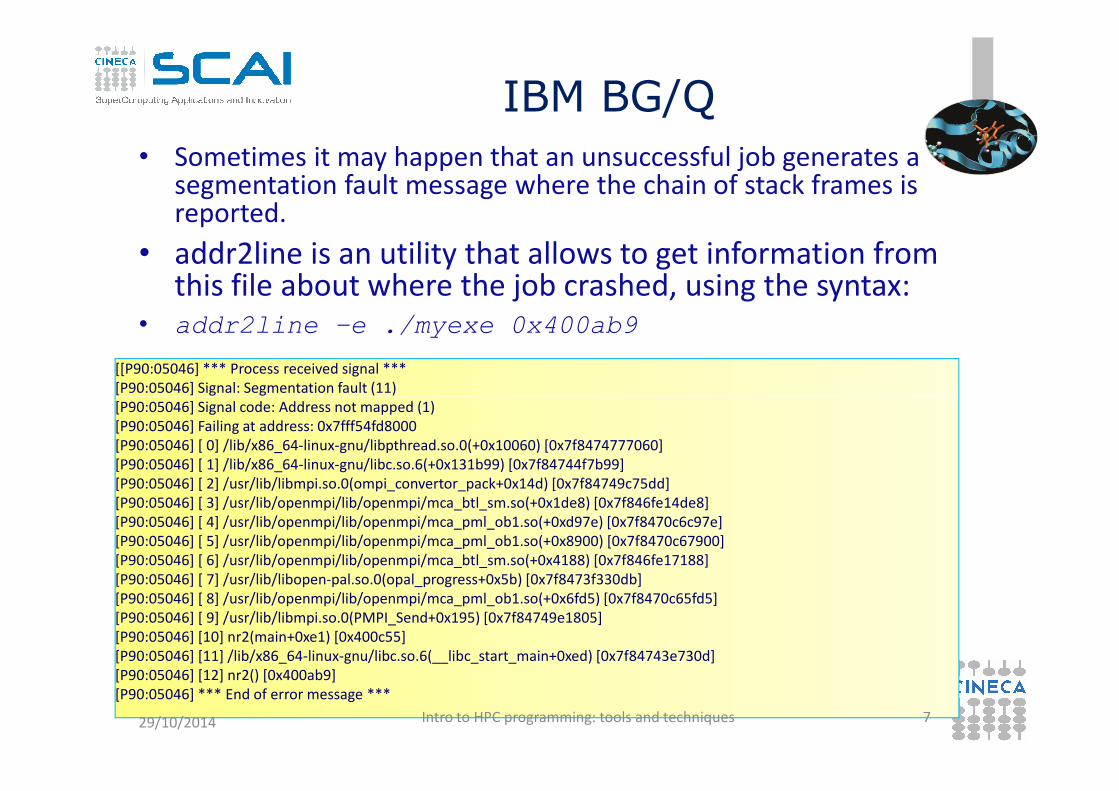
• Sometimes it may happen that an unsuccessful job generates a segmentation fault message where the chain of stack frames is reported.
• addr2line is an utility that allows to get information from this file about where the job crashed, using the syntax:
• addr2line –e ./myexe 0x400ab9
[[P90:05046] *** Process received signal ***
[P90:05046] Signal: Segmentation fault (11)[P90:05046] Signal: Segmentation fault (11)
[P90:05046] Signal code: Address not mapped (1)
[P90:05046] Failing at address: 0x7fff54fd8000
[P90:05046] [ 0] /lib/x86_64-linux-gnu/libpthread.so.0(+0x10060) [0x7f8474777060]
[P90:05046] [ 1] /lib/x86_64-linux-gnu/libc.so.6(+0x131b99) [0x7f84744f7b99]
[P90:05046] [ 2] /usr/lib/libmpi.so.0(ompi_convertor_pack+0x14d) [0x7f84749c75dd]
[P90:05046] [ 3] /usr/lib/openmpi/lib/openmpi/mca_btl_sm.so(+0x1de8) [0x7f846fe14de8]
[P90:05046] [ 4] /usr/lib/openmpi/lib/openmpi/mca_pml_ob1.so(+0xd97e) [0x7f8470c6c97e]
[P90:05046] [ 5] /usr/lib/openmpi/lib/openmpi/mca_pml_ob1.so(+0x8900) [0x7f8470c67900]
[P90:05046] [ 6] /usr/lib/openmpi/lib/openmpi/mca_btl_sm.so(+0x4188) [0x7f846fe17188]
[P90:05046] [ 7] /usr/lib/libopen-pal.so.0(opal_progress+0x5b) [0x7f8473f330db]
[P90:05046] [ 8] /usr/lib/openmpi/lib/openmpi/mca_pml_ob1.so(+0x6fd5) [0x7f8470c65fd5]
[P90:05046] [ 9] /usr/lib/libmpi.so.0(PMPI_Send+0x195) [0x7f84749e1805]
[P90:05046] [10] nr2(main+0xe1) [0x400c55]
[P90:05046] [11] /lib/x86_64-linux-gnu/libc.so.6(__libc_start_main+0xed) [0x7f84743e730d]
[P90:05046] [12] nr2() [0x400ab9]
[P90:05046] *** End of error message ***
29/10/2014 7Intro to HPC programming: tools and techniques

IBM BG/Q – core files
• By default Fermi IBM BG/Q produces text
core files but not necessarily very readable
29/10/2014 8Intro to HPC programming: tools and techniques
IBM BG/Q core files
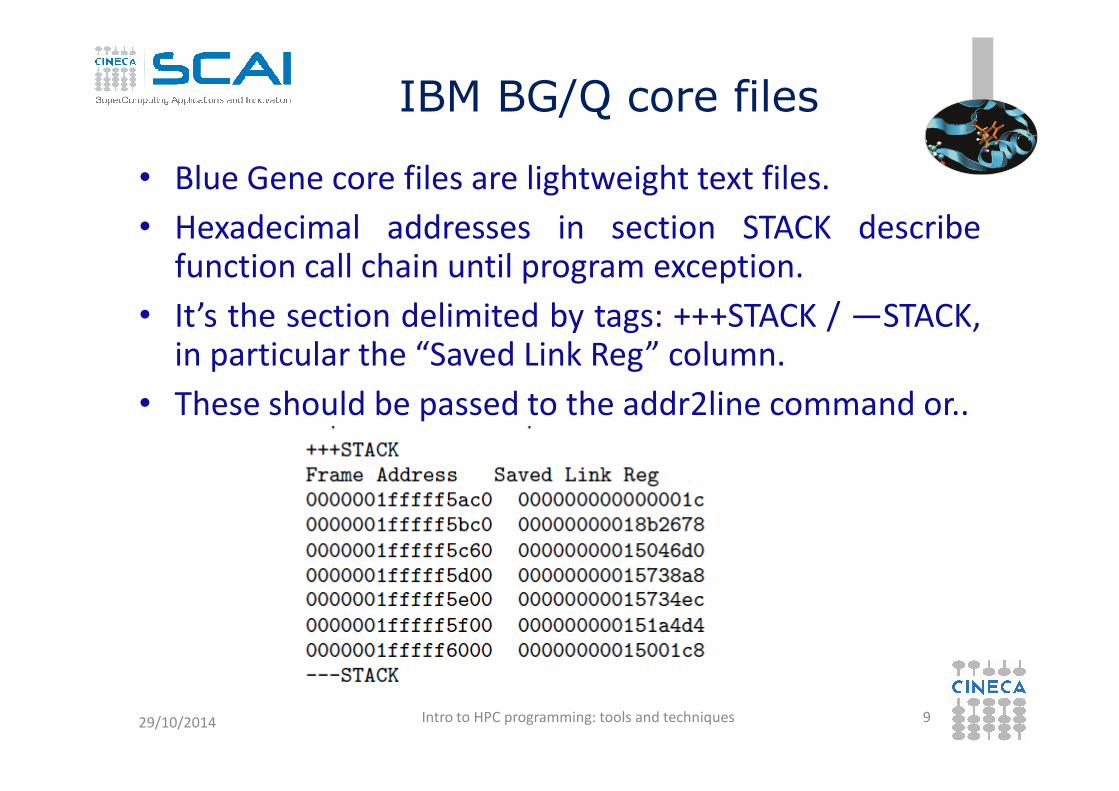
• Blue Gene core files are lightweight text files.
• Hexadecimal addresses in section STACK describefunction call chain until program exception.
• It’s the section delimited by tags: +++STACK / —STACK,in particular the “Saved Link Reg” column.
• These should be passed to the addr2line command or..• These should be passed to the addr2line command or..
29/10/2014 9Intro to HPC programming: tools and techniques
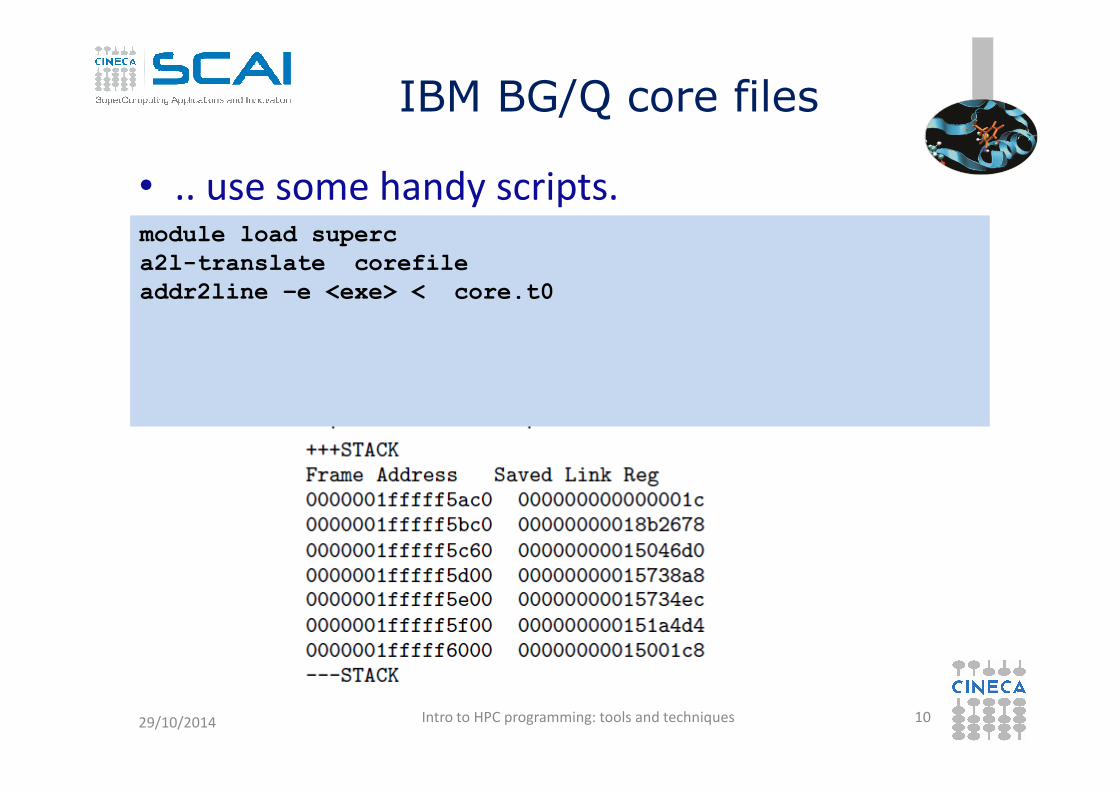
IBM BG/Q core files
• .. use some handy scripts.module load superca2l-translate corefileaddr2line –e <exe> < core.t0
29/10/2014 10Intro to HPC programming: tools and techniques

Most popular debuggers
• Some debuggers are distributed with the compiler suite:– Commercial
• Portland pgdbg
• Intel idb
– FreeGnu gdb• Gnu gdb
• There are also some powerful, commercial debuggers from independent vendors:– DDT (Allinea)
– Totalview (Rogue Wave Software)
– Valgrind (particularly for Memory problems)
29/10/2014 11Intro to HPC programming: tools and techniques
Debugger capabilities
• The purpose of a debugger is to allow you to see what is going on “inside” another program while it executes or what another program was doing at the moment it crashed.
• Using specific commands, debuggers allow real-time visualization of variable values, static and dynamic memory state (stack, heap) and registers state.
• Common errors include:• Common errors include:
• pointer errors
• array indexing
• memory allocation
• argument and parameter mismatches
• communication deadlocks in parallel programming
• I/O
• ...
29/10/2014 12Intro to HPC programming: tools and techniques

Compiling rules for debugging
• In order to debug a program effectively, the debugger needs debugging information which is produced compiling the program with the “-g” flag.
• This debugging information is stored in the object files fused in the executable; it describes the data type of each variable or function and the correspondence between source line numbers and addresses in the executable code.
• Opimization should be at –O0, -O1 or –O2 level.
• GNU compiler:
• gcc/g++/gfortran –g [other flags] source –o executable
• INTEL compiler:
• icc/icpc/ifort –g [other flags] source –o executable
• BGQ - IBM compiler
• bgxlc/bgxlc++/bgxlf90 –g –qfullpath qkeepparm source –o executable
29/10/2014 13Intro to HPC programming: tools and techniques

Execution
• The standard way to run the debugger is:
• debugger executable name or
• debugger exe corefile
• Otherwise it’s possible to first run the debugger and then point to the executable to debug:
GNU gdb:
gdbgdb
> file executable
• It’s also possible to debug an already-runnnig program started outside the debugger attaching to the process id of the program.
• Syntax:
• GNU gdb:
gdb
> attach process_id
gdb attach process_id29/10/2014 14Intro to HPC programming: tools and techniques

GDB command list
run: start debugged program
list: list specified function or line. Two arguments with commabetween specify starting and ending lines to list.
list begin,endbreak <line> <function> : set breakpoint at specified lineor function, useful to stop execution before a critical point.
break filename:linebreak filename:functionbreak filename:function
It’s possible to insert a boolean expression with the sintax:
break <line> <function> conditionWith no <line> <function>, uses current execution address ofselected stack frame. This is useful for breaking on return to a stackframe.
29/10/2014 15Intro to HPC programming: tools and techniques
GDB command list /2
• clear <line> <func> : Clear breakpoint at specified line or function.
• delete breakpoints [num] : delete breakpoint number “num”. With no argument delete all breakpoints.
• If : Set a breakpoint with condition; evaluate the condition each time the breakpoint is reached, and stop only if the value is nonzero. Allowed logical operators: > , < , >= , <= , ==
• Example :• Example :
break 31 if i >= 12
• condition <num> < expression> : As the “if” command associates a logical condition at breakpoint number “num”.
• next <count>: continue to the next source line in the current (innermost) stack frame, or count lines.
29/10/2014 16Intro to HPC programming: tools and techniques
GDB command list/3
continue: continue program being debugged, after signal orbreakpoint
where : print backtrace of all stack frames, or innermost “count”frames.
step : Step program until it reaches a different source line. If usedbefore a function call, allow to step into the function. The debuggerstops at the first executable statement of that function
step count : executes count lines of code as the nextstep count : executes count lines of code as the nextcommand
finish : execute until selected stack frame or function returnsand stops at the first statement after the function call. Upon return,the value returned is printed and put in the value history.
set args : set argument list to give program being debugged whenit is started. Follow this command with any number of args, to bepassed to the program.
set var variable = <EXPR>: evaluate expression EXPR andassign result to variable variable, using assignment syntaxappropriate for the current language29/10/2014 17Intro to HPC programming: tools and techniques

GDB Command list/4
search <expr>: search for an expression from last line listed
reverse-search <expr> : search backward for an expression fromlast line listed
display <exp>: Print value of expression exp each time the programstops.
print <exp>: Print value of expression exp
This command can be used to display arrays:
displays elementprint array[num_el]displays element num_el
print *array@len displays the whole array
watch <exp>: Set a watchpoint for an expression. A watchpoint stopsexecution of your program whenever the value of an expression changes.
info locals: print variable declarations of current stack frame.
show values <number> : shows number elements of value historyaround item number or last ten.
29/10/2014 18Intro to HPC programming: tools and techniques

GDB command list/5
• backtrace <number,full> : shows one line per frame, for
many frames, starting with the currently executing frame (frame
zero), followed by its caller (frame one), and on up the stack. Withthe number parameter print only the innermost number frames.
With the full parameter print the values of the local variables also.
– #0 squareArray (nelem_in_array=12, array=0x601010) at
variable_print.c:67
– #1 0x00000000004005f5 in main () at variable_print.c:34– #1 0x00000000004005f5 in main () at variable_print.c:34
• frame <number> : select and print a stack frame.
• up <number> : allow to go up number stack frames
• down <number> : allow to go up number stack frames
• info frame : gives all informations about current stack frame
• detach: detach a process or file previously attached.
• quit: quit the debugger
29/10/2014 19Intro to HPC programming: tools and techniques
Using Core dumps for Postmortem Analysis
•In computing, a core dump, memory dump, or storage dump consistsof the recorded state of the working memory of a computerprogram at a specific time, generally when the program hasterminated abnormally.
• Core dumps are often used to assist in diagnosingand debugging errors in computer programs.
• In most Linux Distributions core file creation is disabled by default fora normal user but it can be enabled using the following command :• In most Linux Distributions core file creation is disabled by default fora normal user but it can be enabled using the following command :
� ulimit -c unlimited
• Once “ulimit –c” is set to “unlimited” run the program and the corefile will be created
• The core file can be analyzed with gdb using the following syntax:
� gdb -c core executable
29/10/2014 20Intro to HPC programming: tools and techniques

Debugging a serial program – case study
Example program that:
1. constructs an array of 10 integers in the variable array1
2. gives the array to a function squareArray that executes the square of each element of the array and stores the result in a second array named array2 in a second array named array2
3. After the function call, it’s computed the difference between array2 and array1 and stored in array del. The array del is then written on standard output
4. Code execution ends without error messages but the elements of array del printed on standard output are all zeros.
29/10/2014 21Intro to HPC programming: tools and techniques

Debugging a serial program
#include <stdio.h>
#include <stdlib.h>
int indx;
void initArray(int nelem_in_array, int *array);
void printArray(int nelem_in_array, int *array);
int squareArray(int nelem_in_array, int *array);
int main(void) {
const int nelem = 12; const int nelem = 12;
int *array1, *array2, *del;
array1 = (int *)malloc(nelem*sizeof(int));
array2 = (int *)malloc(nelem*sizeof(int));
del = (int *)malloc(nelem*sizeof(int));
initArray(nelem, array1);
printf("array1 = "); printArray(nelem, array1);
array2 = array1;
squareArray(nelem, array2);
29/10/2014 22Intro to HPC programming: tools and techniques

Debugging a serial program/2
for (indx = 0; indx < nelem; indx++)
{
del[indx] = array2[indx] - array1[indx];
}
printf(“La difference fra array2 e array1 e’: ");
printArray(nelem, del);
free(array1);
free(array2);free(array2);
free(del);
return 0;}
void initArray(const int nelem_in_array, int *array)
{
for (indx = 0; indx < nelem_in_array; indx++)
{
array[indx] = indx + 2;}
}
29/10/2014 23Intro to HPC programming: tools and techniques
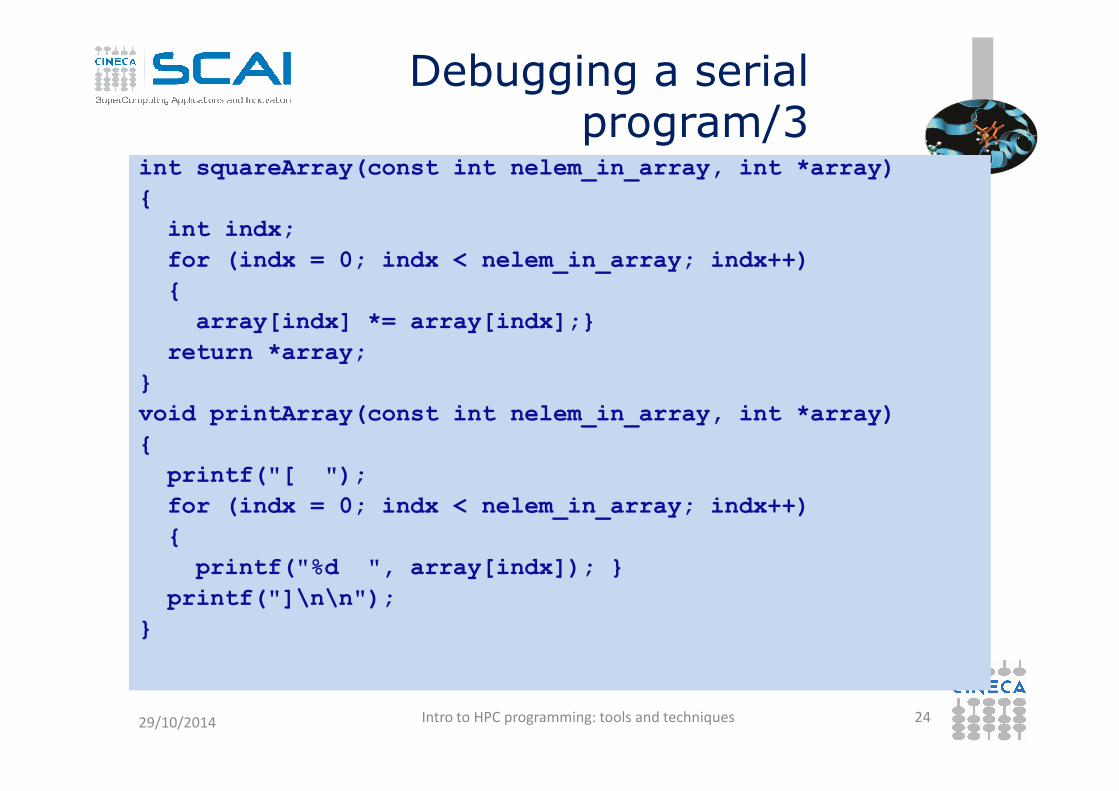
Debugging a serial program/3
int squareArray(const int nelem_in_array, int *array)
{
int indx;
for (indx = 0; indx < nelem_in_array; indx++)
{
array[indx] *= array[indx];}
return *array;
}}
void printArray(const int nelem_in_array, int *array)
{
printf("[ ");
for (indx = 0; indx < nelem_in_array; indx++)
{
printf("%d ", array[indx]); }
printf("]\n\n");
}
29/10/2014 24Intro to HPC programming: tools and techniques

Debugging a serial program/4
• Compiling: gcc –g –o ar_diff ar_diff.c
• Execution: ./arr_diff
• Expected result:
– del = [ 2 6 12 20 30 42 56 72 90 110 132 156 ]– del = [ 2 6 12 20 30 42 56 72 90 110 132 156 ]
• Real result
– del = [ 0 0 0 0 0 0 0 0 0 0 0 0 ]
29/10/2014 25Intro to HPC programming: tools and techniques

Debugging a serial program/5
• Run the debugger gdb -> gdb ar_diff
• Step1: possible coding error in function squareArray()
• Procedure:
– list the code with the list command and insert a breakpoint at line 35 “break 35” where there is the call to list the code with the list command and insert a breakpoint at line 35 “break 35” where there is the call to squareArray(). Let’s start the code using the command run. Execution stops at line 35.
– Let’s check the correctness of the function squareArray() displaying the elements of the array array2 using the command disp, For example (disp array2[1] = 9) produces the expected value
29/10/2014 26Intro to HPC programming: tools and techniques

Debugging a serial program
• Step2: check of the difference between the element valuesin the two arrays
– For loop analysis:#35: for (indx = 0; indx < nelem; indx++)
(gdb) next
37 del[indx] = array2[indx] - array1[indx];37 del[indx] = array2[indx] - array1[indx];
(gdb) next
35 for (indx = 0; indx < nelem; indx++)
– Visualize array after two steps in the for loop:(gdb) disp array2[1]
array2[1]=9
(gdb) disp array1[1]
array1[1]=9
29/10/2014 27Intro to HPC programming: tools and techniques

Debugging a serial program
• As highlighted in the previous slide the values of theelements of array1 and array2 are the same. But this is notcorrect because array, array1, was never passed to thefunction squareArray(). Only array2 was passed in line 38 ofour code. If we think about it a bit, this sounds very muchlike a “pointer error”.
• To confirm our suspicion, we compare the memory address• To confirm our suspicion, we compare the memory addressof both arrays:
– (gdb) disp array1
– 1: array1 = (int *) 0x607460– (gdb) disp array2
– 2: array2 = (int *) 0x607460
• We find that the two addresses are identical.
29/10/2014 28Intro to HPC programming: tools and techniques

Debugging a serial program
The error occurs in the statement: array2 = array1 because inthis way the first element in array2 points to the address ofthe first element in array1.
Solution:
To solve the problem we just have to change the statement
array2 = array1;
infor (indx = 0; index < nelem; indx++)
{
array2[ k ] = array1[ k ]
}
29/10/2014 29Intro to HPC programming: tools and techniques

Parallel debugging
• Parallel debugging is more complex than serial because multiple processes need to be debugged simultaneously.
• Normally debuggers can be applied to multi-threaded parallel codes, containing OpenMP or MPI directives, or even OpenMP and MPI hybrid solutions.
• For OpenMP, the threads of a single program are akin to multiple processes except that they share one address multiple processes except that they share one address space (that is, they can all examine and modify the same variables). On the other hand, each thread has its own registers and execution stack, and perhaps private memory.
• GDB provides some facilities for debugging OpenMP and MPI programs but usually a dedicated debugger such as Totalview is employed.
29/10/2014 30Intro to HPC programming: tools and techniques

Debugging OpenMPApplications
GDB facilities for debugging multi-threaded programs :
– automatic notification of new threads
– thread <thread_number> command to switch among threads
– info threads command to inquire about existing threads(gdb) info threads
* 2 Thread 0x40200940 (LWP 5454) MAIN__.omp_fn.0 (.omp_data_i=0x7fffffffd280)at serial_order_bug.f90:27
1 Thread 0x2aaaaaf7d8b0 (LWP 1553) MAIN__.omp_fn.0(.omp_data_i=0x7fffffffd280) at serial_order_bug.f90:27(.omp_data_i=0x7fffffffd280) at serial_order_bug.f90:27
thread apply <thread_number> <all> args allow to apply a command to apply acommand to a list of threads.
• When any thread in your program stops, for example, at a breakpoint, all other threads in the program are also stopped by GDB.
• GDB cannot single-step all threads in lockstep. Since thread scheduling is up to your debugging target’s operating system (not controlled by GDB), other threads may execute more than one statement while the current thread completes a single step unless you use the command :set scheduler-locking on.
• GDB is not able to show the values of private and shared variables in OpenMP parallel regions.
29/10/2014 31Intro to HPC programming: tools and techniques
Debugging OpenMPApplications
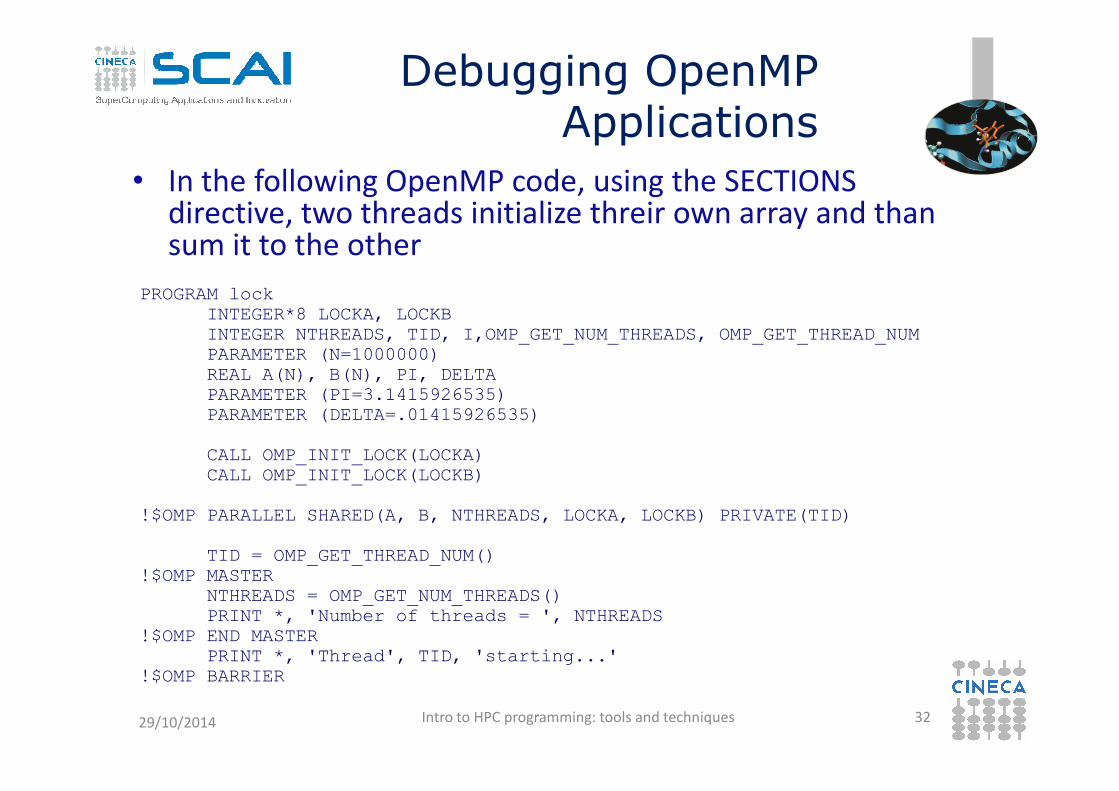
• In the following OpenMP code, using the SECTIONS directive, two threads initialize threir own array and than sum it to the other
PROGRAM lockINTEGER*8 LOCKA, LOCKBINTEGER NTHREADS, TID, I,OMP_GET_NUM_THREADS, OMP_GET_THREAD_NUMPARAMETER (N=1000000)REAL A(N), B(N), PI, DELTAPARAMETER (PI=3.1415926535)PARAMETER (PI=3.1415926535)PARAMETER (DELTA=.01415926535)
CALL OMP_INIT_LOCK(LOCKA)CALL OMP_INIT_LOCK(LOCKB)
!$OMP PARALLEL SHARED(A, B, NTHREADS, LOCKA, LOCKB) PRIVATE(TID)
TID = OMP_GET_THREAD_NUM()!$OMP MASTER
NTHREADS = OMP_GET_NUM_THREADS()PRINT *, 'Number of threads = ', NTHREADS
!$OMP END MASTERPRINT *, 'Thread', TID, 'starting...'
!$OMP BARRIER
29/10/2014 32Intro to HPC programming: tools and techniques

Debug openMP applications
!$OMP SECTIONS
!$OMP SECTION
PRINT *, 'Thread',TID,' initializing A()'
CALL OMP_SET_LOCK(LOCKA)
DO I = 1, N
A(I) = I * DELTA
ENDDO
CALL OMP_SET_LOCK(LOCKB)
!$OMP SECTION
PRINT *, 'Thread',TID,' initializing B()'
CALL OMP_SET_LOCK(LOCKB)
DO I = 1, N
B(I) = I * PI
ENDDO
CALL OMP_SET_LOCK(LOCKA)
PRINT *, 'Thread',TID,' adding B() toA()'
DO I = 1, NPRINT *, 'Thread',TID,' adding A() to B()'
DO I = 1, N
B(I) = B(I) + A(I)
ENDDO
CALL OMP_UNSET_LOCK(LOCKB)
CALL OMP_UNSET_LOCK(LOCKA)
DO I = 1, N
A(I) = A(I) + B(I)
ENDDO
CALL OMP_UNSET_LOCK(LOCKA)
CALL OMP_UNSET_LOCK(LOCKB)
!$OMP END SECTIONS NOWAIT
PRINT *, 'Thread',TID,' done.'
!$OMP END PARALLEL
END
29/10/2014 33Intro to HPC programming: tools and techniques

Debugging OpenMPApplications
• Compiling:
gfortran –fopenmp –g –o omp_debug omp_debug.f90
• Execution:
– export OMP_NUM_THREADS=2
– ./omp_debug
– The program produces the following output before– The program produces the following output before
hanging:
Number of threads = 2
Thread 0 starting...
Thread 1 starting...
Thread 0 initializing A()
Thread 1 initializing B()
29/10/2014 34Intro to HPC programming: tools and techniques

Debugging OpenMP Applications
• In the debugger:
– List the source code from line 10 to 50:
– Insert breakpoint at beginning of parallel region and run:list 10,50b 20run
2 Thread 0x40200940 (LWP 8533) MAIN__.omp_fn.0
(.omp_data_i=0x7fffffffd2b0) at
openmp_bug2_nofix.f90:20
• The print statements aren’t executed so insert breakpoints in the two sections:
thread apply 2 b 35
thread apply 1 b 49
openmp_bug2_nofix.f90:20
1 Thread 0x2aaaaaf7d8b0 (LWP 8530) MAIN__.omp_fn.0
(.omp_data_i=0x7fffffffd2b0) at
openmp_bug2_nofix.f90:20
29/10/2014 35Intro to HPC programming: tools and
techniques

Debugging OpenMP Applications
• Restart execution:
thread apply all cont
• Execution hangs so ctrl-c and check where threads are:are:
thread apply all where
Thread 2 (Thread 0x40200940 (LWP 8533)):
0x00000000004010b5 in MAIN__.omp_fn.0 (.omp_data_i=0x7fffffffd2b0) at openmp_bug2_nofix.f90:29
Thread 1 (Thread 0x2aaaaaf7d8b0 (LWP 8530)):
0x0000000000400e6d in MAIN__.omp_fn.0 (.omp_data_i=0x7fffffffd2b0) at openmp_bug2_nofix.f90:43
29/10/2014 36Intro to HPC programming: tools and
techniques

Debugging OpenMPApplications
• Thread number 2 is stopped at line 29 on the statement:
CALL OMP_SET_LOCK(LOCKB)
• Thread number 1 is stopped at line 43 on the statement :
CALL OMP_SET_LOCK(LOCKA)
• So it’s clear that the bug is in the calls to routines OMP_SET_LOCK that cause execution stopping
• Looking at the order of the routine calls to OMP_SET_LOCK and OMP_UNSET_LOCK it is clear there is an error.
• The correct order provides that the call to OMP_SET_LOCK must be followed by the corresponding OMP_UNSET_LOCK
• Arranging the order the code finishes successfully
29/10/2014 37Intro to HPC programming: tools and techniques

Debugging MPI applications
• Even more difficult than OpenMP since in principle could involve many thousands of tasks.
• Many MPI errors are possible including: invalid arguments, type matching, race conditions, deadlocks etc.
• Debugging communications is not easy. Some • Debugging communications is not easy. Some communication-related bugs may be hidden by MPI buffering such that they occur only for certain numbers of tasks or program inputs.
• Generally best to use the minimum no. of tasks necessary to reproduce the unexpected behaviour.
29/10/2014 38Intro to HPC programming: tools and techniques

Debugging MPI Applications
• There are two common ways to use serial debuggers such GDB to debug MPI applications
1. Attach to individual MPI processes after they are running using the “attach” method available for serial codes launching instances of the debugger to attach to the different MPI processes.attach to the different MPI processes.
2. Open a debugging session for each MPI process through the command “mpirun”.
29/10/2014 39Intro to HPC programming: tools and techniques

Debugging MPI Applications
Attach method
– Run the application in the usual way.
mpirun –np 4 executable
– From another shell, use the top command to find
the MPI processes which bind to the executable:the MPI processes which bind to the executable:
PID executable MPI
processes
29/10/2014 40Intro to HPC programming: tools and techniques
Debugging MPI Applications
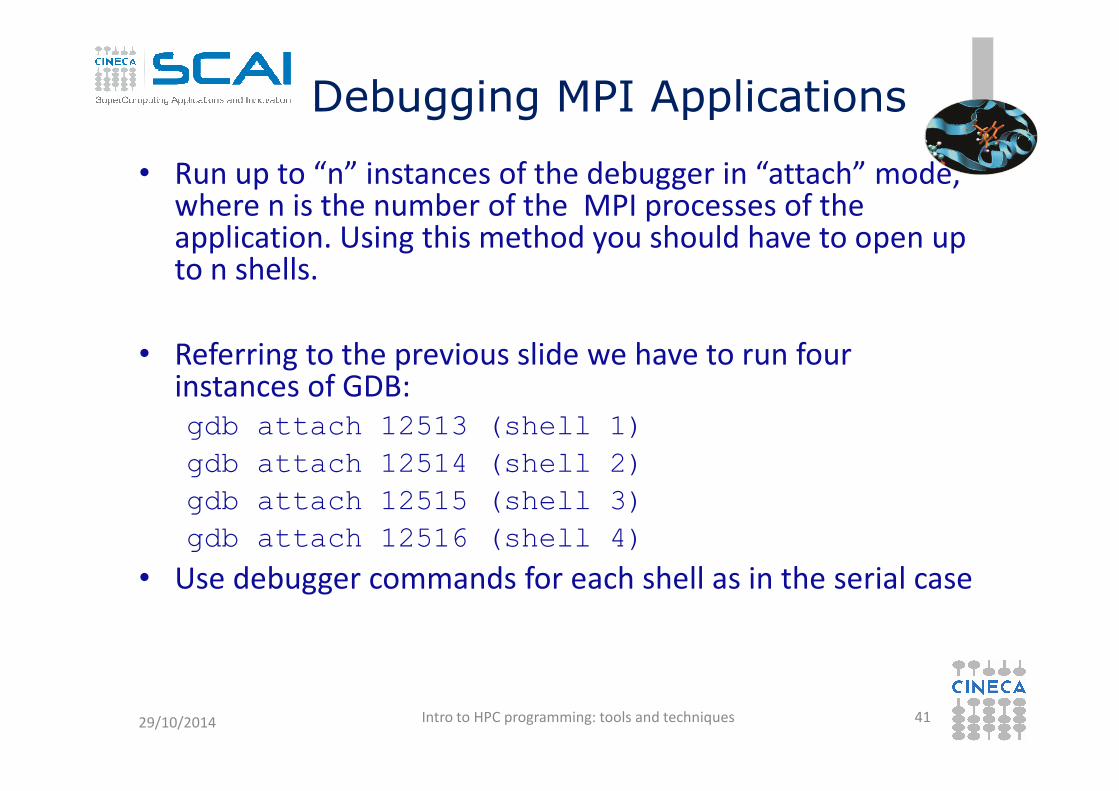
• Run up to “n” instances of the debugger in “attach” mode, where n is the number of the MPI processes of the application. Using this method you should have to open up to n shells.
• Referring to the previous slide we have to run four instances of GDB:instances of GDB:gdb attach 12513 (shell 1)
gdb attach 12514 (shell 2)
gdb attach 12515 (shell 3)
gdb attach 12516 (shell 4)
• Use debugger commands for each shell as in the serial case
29/10/2014 41Intro to HPC programming: tools and techniques

Debugging MPI Applications
• mpirun method
– This technique launches a separate window for each MPI process in MPI_COMM_WORLD, each one running a serial instance of GDB that will launch and run your MPI application.
mpirun -np 2 xterm -e gdb nome_eseguibilempirun -np 2 xterm -e gdb nome_eseguibile
29/10/2014 42Intro to HPC programming: tools and techniques

Debugging MPI – case study
#include <stdio.h>#include <stdlib.h>#include <mpi.h>void main(int argc, char *argv[]){
int nvals, *array, myid, i;MPI_Status status;MPI_Init(&argc, &argv);MPI_Comm_rank(MPI_COMM_WORLD, &myid);nvals = atoi(argv[1]);array = (int *) malloc(nvals*sizeof(int));for(i=0; i<nvals/2; i++);for(i=0; i<nvals/2; i++);
array[i] = myid;if(myid==0){MPI_Send(array,nvals/2,MPI_INT,1,1,MPI_COMM_WORLD);
MPI_Recv(array+nvals/2,nvals/2,MPI_INT,1,1,MPI_COMM_WORLD,&status);}else
{MPI_Send(array,nvals/2,MPI_INT,0,1,MPI_COMM_WORLD);MPI_Recv(array+nvals/2,nvals/2,MPI_INT,0,1,MPI_COMM_WORLD,&status);}
printf("myid=%d:array[nvals-1]=%dn",myid,array[nvals-1]);MPI_Finalize();
29/10/2014 43Intro to HPC programming: tools and techniques
Debugging MPI Applications – case study
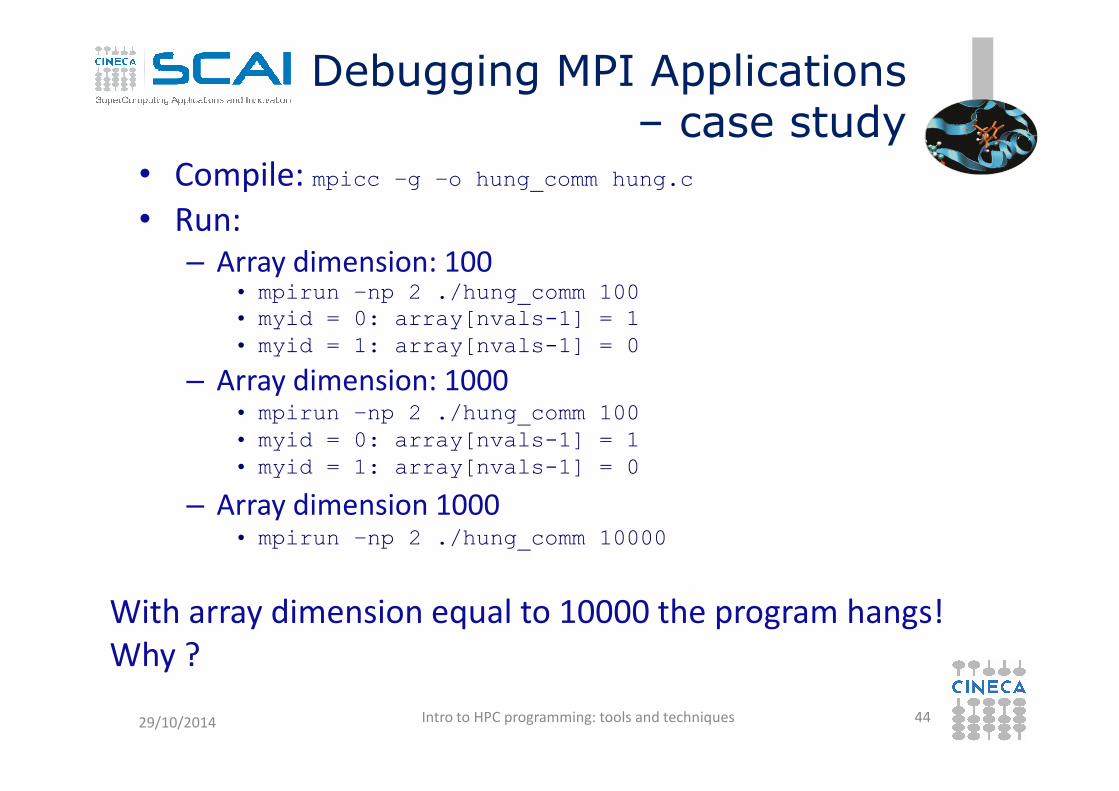
• Compile: mpicc –g –o hung_comm hung.c
• Run:– Array dimension: 100
• mpirun –np 2 ./hung_comm 100• myid = 0: array[nvals-1] = 1
• myid = 1: array[nvals-1] = 0
– Array dimension: 1000– Array dimension: 1000• mpirun –np 2 ./hung_comm 100
• myid = 0: array[nvals-1] = 1
• myid = 1: array[nvals-1] = 0
– Array dimension 1000• mpirun –np 2 ./hung_comm 10000
With array dimension equal to 10000 the program hangs!
Why ?
29/10/2014 44Intro to HPC programming: tools and techniques

Debugging MPI Applications – case study
• Debugging hints:
– use gdb and two processes
– insert breakpoint at first MPI_SEND
– set program arguments with set args
10000001000000
– when program hangs, CTRL-C and where
29/10/2014 45Intro to HPC programming: tools and techniques
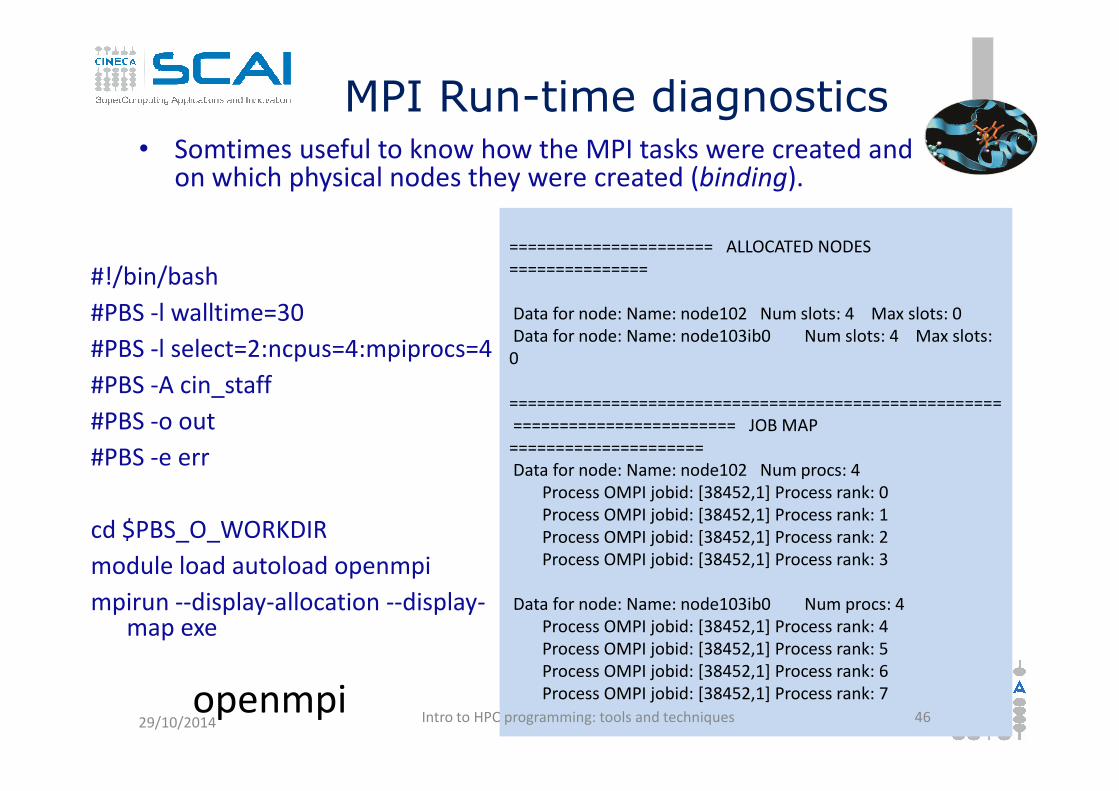
MPI Run-time diagnostics• Somtimes useful to know how the MPI tasks were created and
on which physical nodes they were created (binding).
====================== ALLOCATED NODES
===============
Data for node: Name: node102 Num slots: 4 Max slots: 0
Data for node: Name: node103ib0 Num slots: 4 Max slots:
0
=====================================================
#!/bin/bash
#PBS -l walltime=30
#PBS -l select=2:ncpus=4:mpiprocs=4
#PBS -A cin_staff=====================================================
======================== JOB MAP
=====================
Data for node: Name: node102 Num procs: 4
Process OMPI jobid: [38452,1] Process rank: 0
Process OMPI jobid: [38452,1] Process rank: 1
Process OMPI jobid: [38452,1] Process rank: 2
Process OMPI jobid: [38452,1] Process rank: 3
Data for node: Name: node103ib0 Num procs: 4
Process OMPI jobid: [38452,1] Process rank: 4
Process OMPI jobid: [38452,1] Process rank: 5
Process OMPI jobid: [38452,1] Process rank: 6
Process OMPI jobid: [38452,1] Process rank: 7openmpi
#PBS -A cin_staff
#PBS -o out
#PBS -e err
cd $PBS_O_WORKDIR
module load autoload openmpi
mpirun --display-allocation --display-map exe
29/10/2014 46Intro to HPC programming: tools and techniques

MPI Run-time diagnostics
#!/bin/bash
#PBS -l walltime=30
#PBS -l select=2:ncpus=4:mpiprocs=4
#PBS -A cin_staff
#PBS -o out
#PBS -e err
cd $PBS_O_WORKDIR
[0] MPI startup(): Rank Pid Node name Pin cpu
[0] MPI startup(): 0 18836 node102 {0,1,2}
[0] MPI startup(): 1 18837 node102 {3,4,5}
[0] MPI startup(): 2 18838 node102 {6,7,8}
[0] MPI startup(): 3 18839 node102 {9,10,11}
[0] MPI startup(): 4 32649 node103 {0,1,2}
[0] MPI startup(): 5 32650 node103 {3,4,5}
[0] MPI startup(): 6 32651 node103 {6,7,8}cd $PBS_O_WORKDIR
module load autoload intelmpi
export I_MPI_DEBUG=5
mpirun ./spawnexample
[0] MPI startup(): 6 32651 node103 {6,7,8}
[0] MPI startup(): 7 32652 node103 {9,10,11}
Intel mpi
Also possible via the MPI_Get_processor_namefunction call
29/10/2014 47Intro to HPC programming: tools and techniques

Debugging MPI with PMPI
• MPI implementations also provide a profiling interface called PMPI.
• In PMPI each standard MPI function (MPI_) has an equivalent function with prefix PMPI_ (e.g. PMPI_Send, PMI_RECV, etc).
• With PMPI it is possible to customize normal MPI commands to provide extra information useful for commands to provide extra information useful for profiling or debugging.
• Not necessary to modify source code since the customized MPI commands can be linked as a separate library during debugging. For production the extra library is not linked and the standard MPI behaviour is used.
29/10/2014 48Intro to HPC programming: tools and techniques
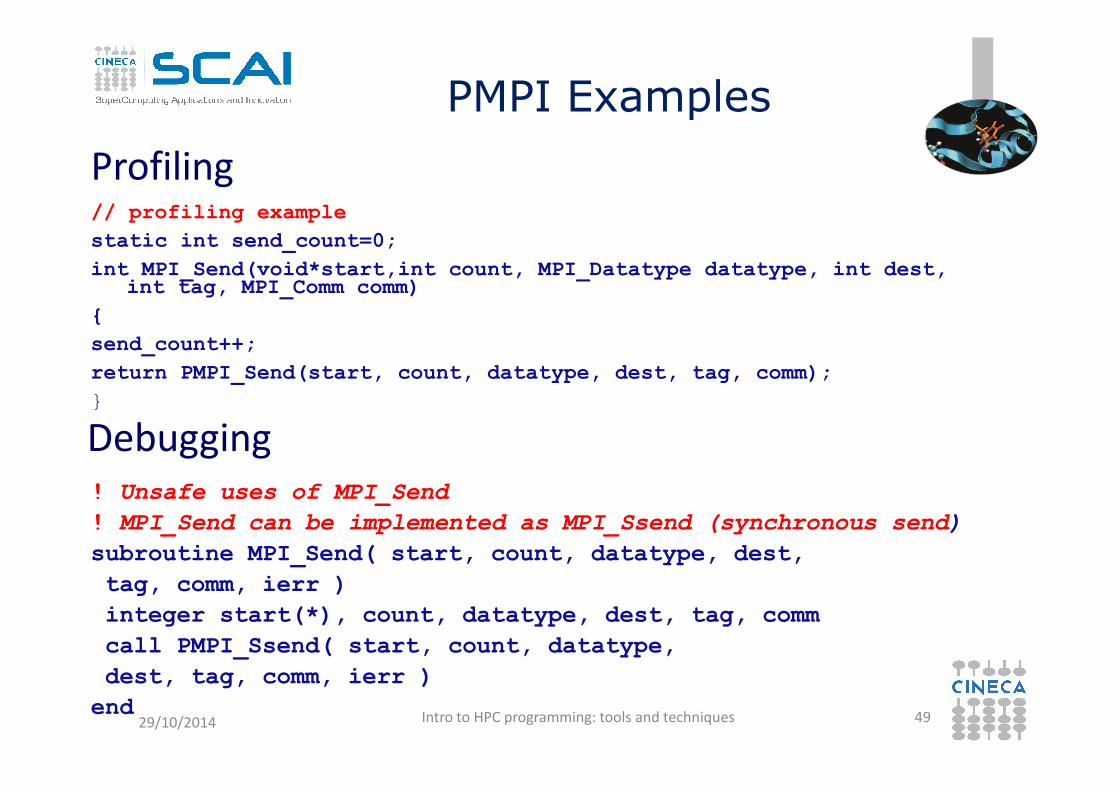
PMPI Examples
// profiling example
static int send_count=0;
int MPI_Send(void*start,int count, MPI_Datatype datatype, int dest, int tag, MPI_Comm comm)
{
send_count++;
return PMPI_Send(start, count, datatype, dest, tag, comm);
}
Profiling
}
! Unsafe uses of MPI_Send
! MPI_Send can be implemented as MPI_Ssend (synchronous send)
subroutine MPI_Send( start, count, datatype, dest,
tag, comm, ierr )
integer start(*), count, datatype, dest, tag, comm
call PMPI_Ssend( start, count, datatype,
dest, tag, comm, ierr )
end
Debugging
29/10/2014 49Intro to HPC programming: tools and techniques

Debugging MPI with totalview and RCM
• Totalview is a powerful, sophisticated, programmable tool for debugging serial or parallel programs.
• Being a graphical tool, for best results recommended to use a remote visualization tool such as RCM (Remote Connection Manager), such as RCM (Remote Connection Manager), rather than just an X-display (slow).
• It is also a commercial product, so licenses are limited!
29/10/2014 50Intro to HPC programming: tools and techniques

Debugging MPI withTotalview and RCM
1. Download and install RCM on workstation: http://www.hpc.cineca.it/content/remote-visualization-rcm
2. Launch RCM and log on to PLX/Fermi. You will be given a Linux-style desktop.
3. Open a terminal and prepare a PBS/Loadleveler3. Open a terminal and prepare a PBS/Loadlevelerjob script. Insert the DISPLAY number in the job script. Or open an interactive PBS session (not BG/Q).
29/10/2014 51Intro to HPC programming: tools and techniques
Debugging MPI with totalviewand RCM
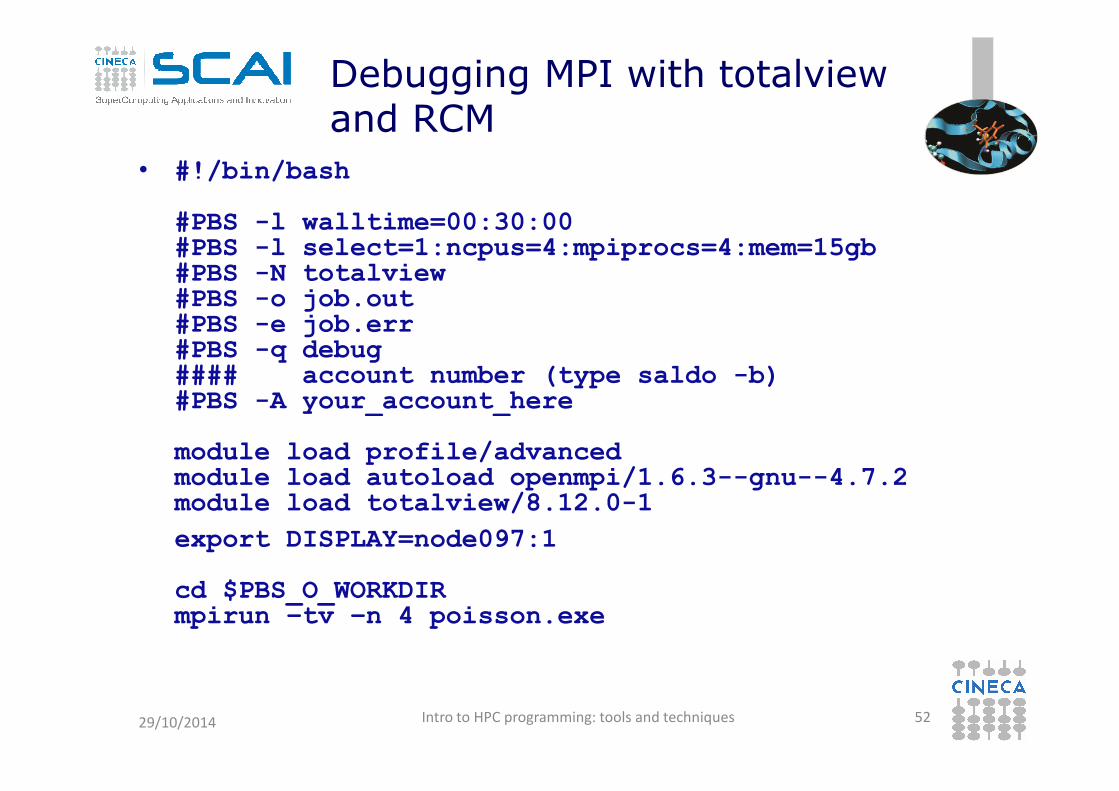
• #!/bin/bash
#PBS -l walltime=00:30:00#PBS -l select=1:ncpus=4:mpiprocs=4:mem=15gb#PBS -N totalview#PBS -o job.out#PBS -e job.err#PBS -q debug#### account number (type saldo -b)#PBS -A your_account_here#PBS -A your_account_here
module load profile/advancedmodule load autoload openmpi/1.6.3--gnu--4.7.2module load totalview/8.12.0-1
export DISPLAY=node097:1
cd $PBS_O_WORKDIRmpirun –tv –n 4 poisson.exe
29/10/2014 52Intro to HPC programming: tools and techniques
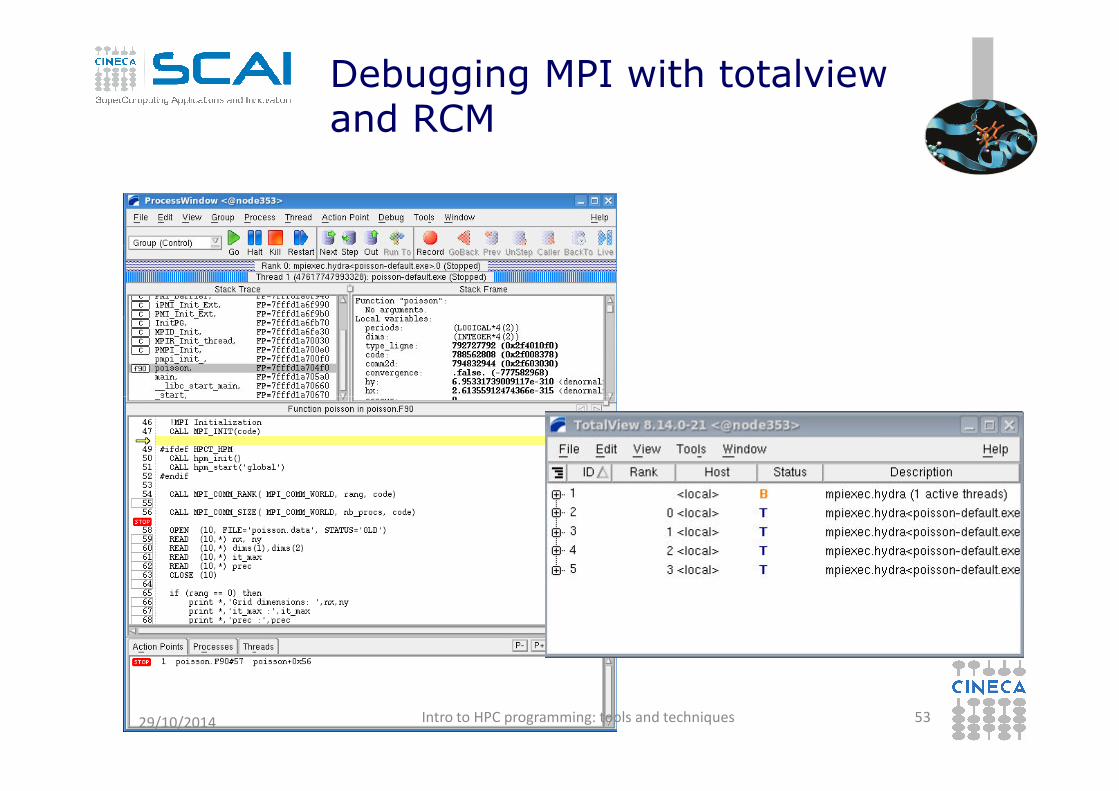
Debugging MPI with totalviewand RCM
29/10/2014 53Intro to HPC programming: tools and techniques
Summary
• All programs have bugs.
• Parallel programs are particularly difficult because of the need to debug multiple processes and possibly, complex communication patterns.
• A debugging strategy should include:– compiler options to lower side-effects of optimisation and
increase the level of compile-time and run-time checking.increase the level of compile-time and run-time checking.
– post-mortem analysis of stack traces and core files
– run-time diagnostic options
– the use of debuggers such as gdb or Totalview
– in tandem with profilers or similar tools to understand better what the program is doing
29/10/2014 54Intro to HPC programming: tools and techniques


