32
Decarbonisation thru low temperature grids Presented by Carl-Johan Falk, Head of Asset Performance, E.ON [email protected]
Decarbonisation thru low temperature grids
Presented by
Carl-Johan Falk, Head of Asset Performance, E.ON
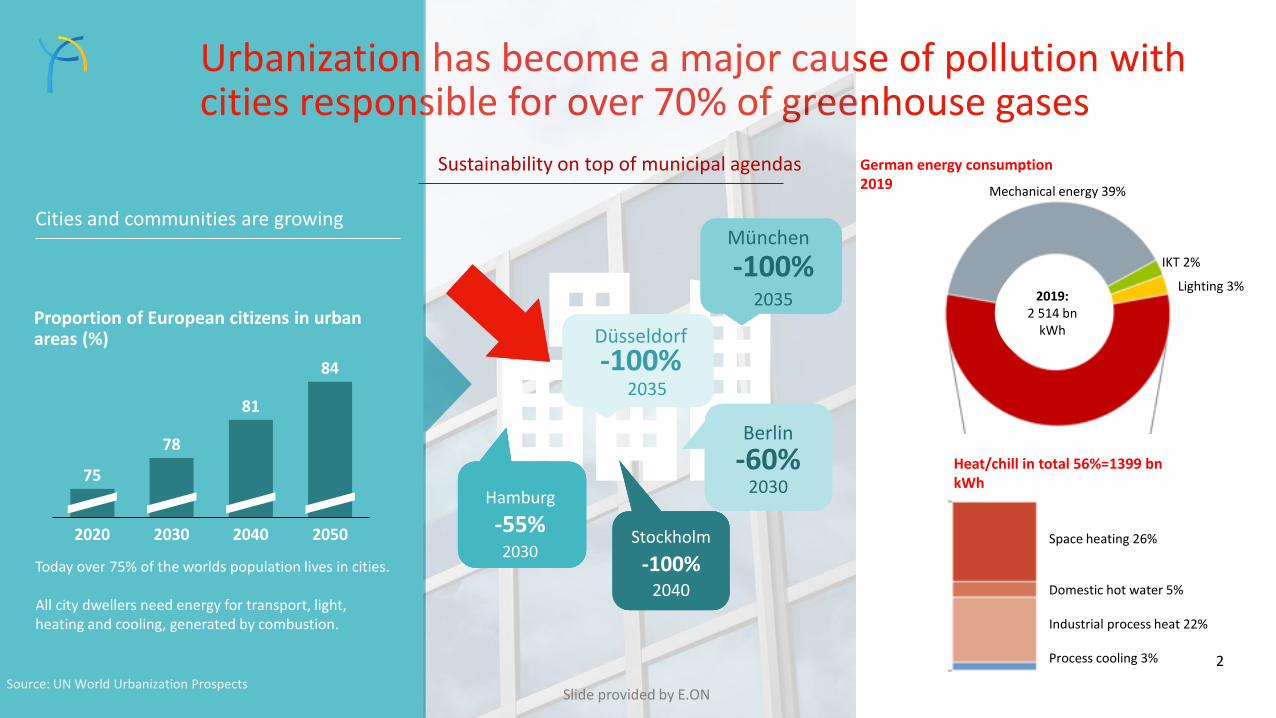
Proportion of European citizens in urban areas (%)
78
20402020 2030 2050
75
81
84
Cities and communities are growing
Source: UN World Urbanization Prospects
Urbanization has become a major cause of pollution with cities responsible for over 70% of greenhouse gases
Today over 75% of the worlds population lives in cities.
All city dwellers need energy for transport, light, heating and cooling, generated by combustion.
CO2
BerlinBerlin
-60%-60%20302030
Berlin
-60%2030
München
-100%2035
StockholmStockholm
-100%-100%20402040
Stockholm
-100%2040
DüsseldorfDüsseldorf
-100%-100%20352035
Düsseldorf
-100%2035
HamburgHamburg
-55%-55%20302030
Hamburg
-55%2030
Sustainability on top of municipal agendas
2019:2 514 bn
kWh
Mechanical energy 39%
German energy consumption 2019
Space heating 26%
Domestic hot water 5%
Industrial process heat 22%
Process cooling 3%
IKT 2%
Lighting 3%
Heat/chill in total 56%=1399 bn kWh
Slide provided by E.ON
2
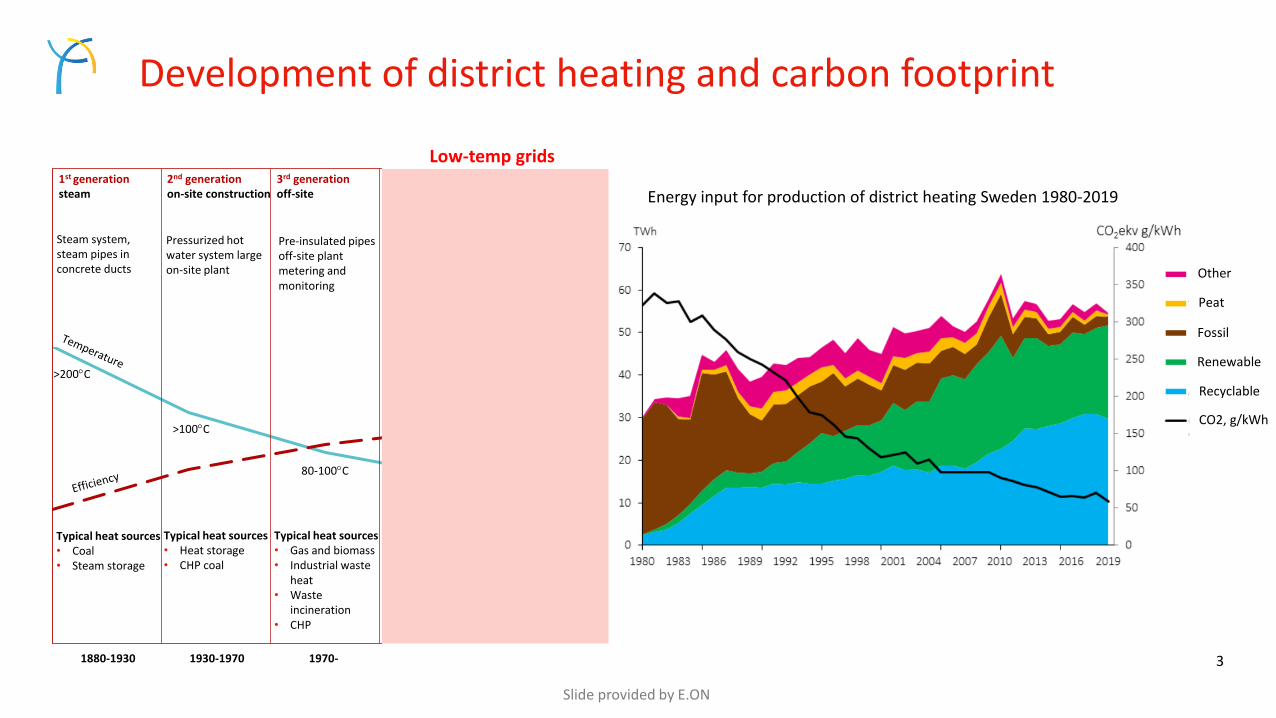
Development of district heating and carbon footprint
1st generationsteam
2nd generationon-site construction
3rd generationoff-site
4th generationmulti vector
5th generationambient temperature
Steam system, steam pipes in concrete ducts
Pressurized hot water system large on-site plant
Pre-insulated pipesoff-site plant metering and monitoring
1880-1930 1930-1970 1970- 2010- 2018-
>200C
>100C
80-100C50-60C 5-20C
Improved controlsLower energy demand
Heating & cooling balancingDecentralized energy generation
Typical heat sources• Coal• Steam storage
Typical heat sources• Heat storage• CHP coal
Typical heat sources• Gas and biomass• Industrial waste
heat• Waste
incineration• CHP
Typical heat sources• Biomass and
geothermal• Industrial waste
heat• Heat pumps
Typical heat sources Heat pumps Waste heat Geothermi
Energy input for production of district heating Sweden 1980-2019
Other
Peat
Fossil
Renewable
Recyclable
CO2, g/kWh
Low-temp grids
Slide provided by E.ON
3

Low temp grids makes decarbonised heat competitive
556065707580
3GDH generation portfolio acc. savings 4GDH generation portfolio acc. savings
OP
EX s
avin
g in
M€
Supply temperature °C
• Offer lower operational costs for producing & distributing heat
• Ability to utilize renewable and recycled heat from low-temperature sources including small scale prosumers.
• Reduce the need for top up of competitive low temp sources and reduced heat losses in distribution.
• Reduced environmental impact
• Recycled heat contributes to little or no environmental foot print.
• Less combustion, less CO2 and ideal circumstances for heat pumps.
• Increased security of supply and customer engagement
• Decentralised and diversified production portfolio offers resilience.
• Tailor-made and digitalised customer solutions including prosumption increases customer engagement.
• Prepare customers for low temp
• Identify customers real heat requirement, consumption patterns and customer experience.
• Improve existing building stock energy performance and domestic hot water requirements.
• Smart grids to enable heat sources of tomorrow
• Grids to distribute large- & small scale heat- & chill production from prosumers and energy storages.
• Online monitoring and grid optimization to cut peak load & temperatures.
• Recycable heat is fundamental in future heat mix
• Invent and explore all local low temp and intermittent large scale heat sources.
• Heterogenic generation mix of various temperatures, size, source and location.
How to prepare for low temp grids
Slide provided by E.ON
4
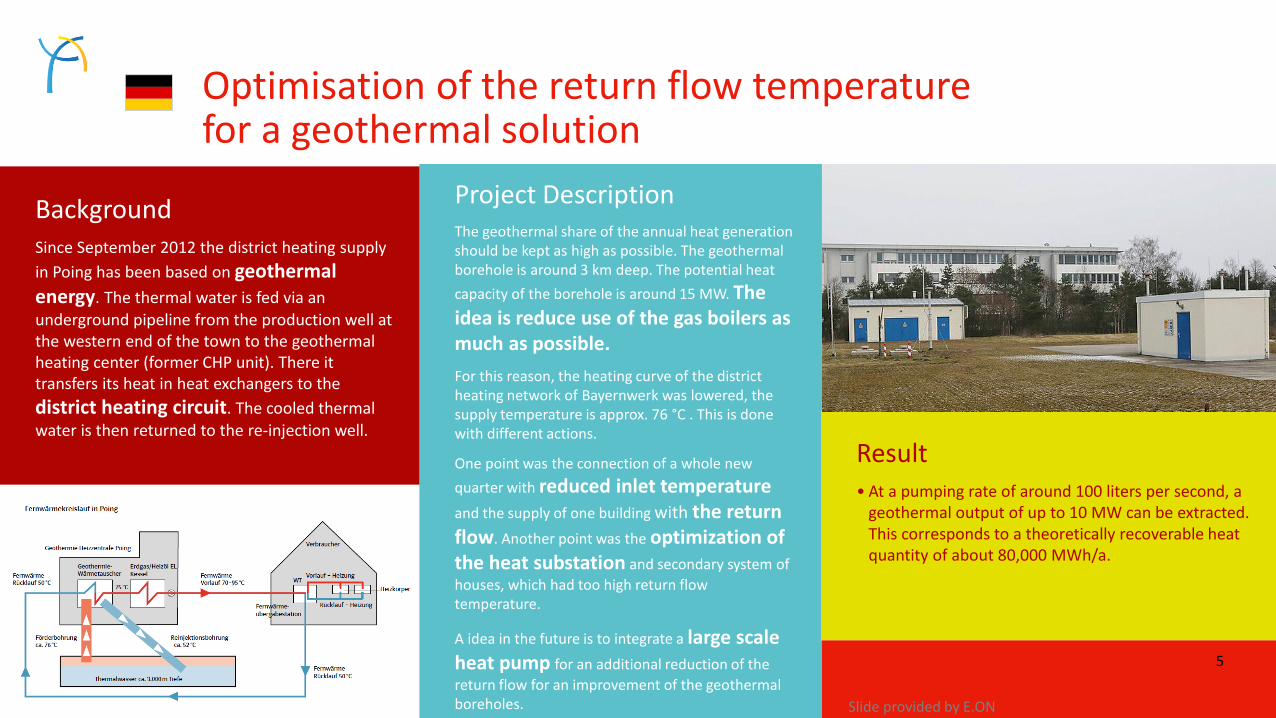
Project DescriptionThe geothermal share of the annual heat generation should be kept as high as possible. The geothermal borehole is around 3 km deep. The potential heat
capacity of the borehole is around 15 MW. The idea is reduce use of the gas boilers as much as possible.
For this reason, the heating curve of the district heating network of Bayernwerk was lowered, the supply temperature is approx. 76 °C . This is done with different actions.
One point was the connection of a whole new
quarter with reduced inlet temperatureand the supply of one building with the return flow. Another point was the optimization of the heat substation and secondary system of
houses, which had too high return flow temperature.
A idea in the future is to integrate a large scale heat pump for an additional reduction of the
return flow for an improvement of the geothermal boreholes.
Result• At a pumping rate of around 100 liters per second, a
geothermal output of up to 10 MW can be extracted. This corresponds to a theoretically recoverable heat quantity of about 80,000 MWh/a.
Optimisation of the return flow temperature for a geothermal solution
BackgroundSince September 2012 the district heating supply
in Poing has been based on geothermal energy. The thermal water is fed via an
underground pipeline from the production well at the western end of the town to the geothermal heating center (former CHP unit). There it transfers its heat in heat exchangers to the
district heating circuit. The cooled thermal
water is then returned to the re-injection well.
Bild/Illustration/Foto für Beschreibung/Ergebnis
Slide provided by E.ON
5

Heat in the pulp & paper industry
Presented by
Małgosia Rybak, Climate Change & Energy Director, Cepi

7
Slide provided by Cepi

8
Coal3%
Gas33%
Fuels Oil2%
Other Fossil1%
Biomass60%
Other1%
Combustion of fuels
Energy mix in the pulp and paper industry
Source: Cepi statistics 2018
Total: 319 TWh
269 TWh for steam production
50 TWh for electricity production
Around 70% of the energy
needs in pulp and papermaking
is used to generate heat for drying
processes
45 TWh net bought electricity
Slide provided by Cepi

9
Decoupling economic growth from carbon emissions
103,4%
89,3%
96,6%
93,3% 93,3%
105,3%
92,7%
99,2%
86,9% 87,7%
99,9%
83,8%
87,8%
74,3%
71,2%
65,0%
70,0%
75,0%
80,0%
85,0%
90,0%
95,0%
100,0%
105,0%
110,0%
2005 2006 2007 2008 2009 2010 2011 2012 2013 2014 2015 2016 2017 2018 2019
Changes in % since 2005 for production, energy and CO2
t prod TJ tCO2
-29% CO2
emissions
reduction
since 2005
Slide provided by Cepi
10
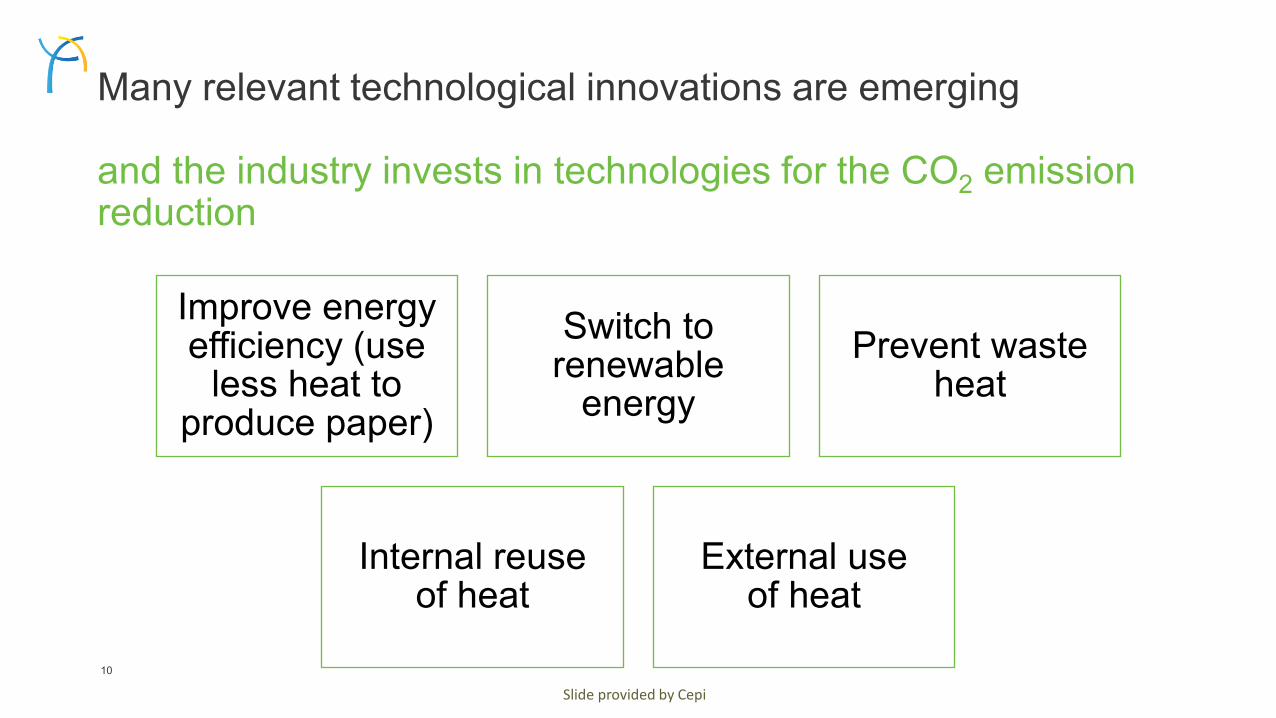
Many relevant technological innovations are emerging
and the industry invests in technologies for the CO2 emission reduction
Improve energy efficiency (use
less heat to produce paper)
Switch to renewable
energy
Prevent waste heat
Internal reuse of heat
External use of heat
Slide provided by Cepi
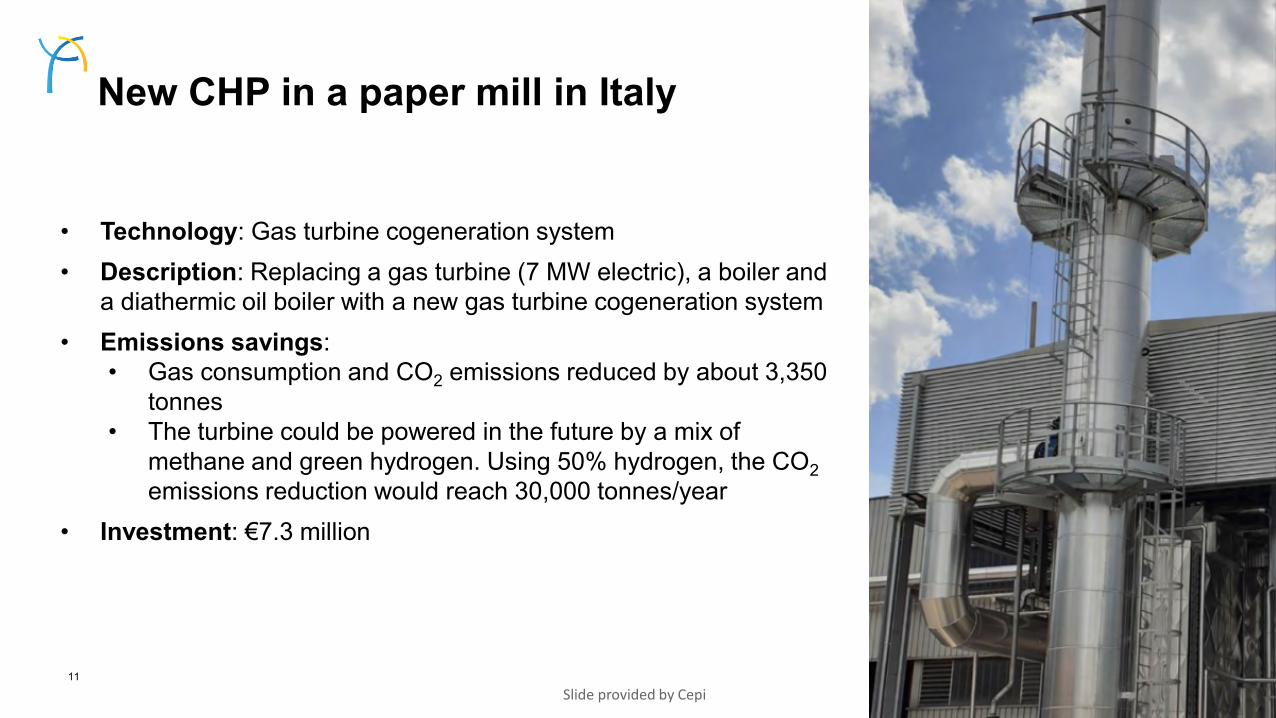
New CHP in a paper mill in Italy
• Technology: Gas turbine cogeneration system
• Description: Replacing a gas turbine (7 MW electric), a boiler and
a diathermic oil boiler with a new gas turbine cogeneration system
• Emissions savings:
• Gas consumption and CO2 emissions reduced by about 3,350
tonnes
• The turbine could be powered in the future by a mix of
methane and green hydrogen. Using 50% hydrogen, the CO2
emissions reduction would reach 30,000 tonnes/year
• Investment: €7.3 million
11
Slide provided by Cepi

• Technology: Solar thermal
• Description: Building France’s largest solar thermal installation
producing heat, supplying the paper mill with hot water for its
paper production process
• Emissions savings:
• Reduce the consumption of fossil energy (about 3,900 MWh/
year of renewable heat produced)
• Decrease of fossil use in steam boilers (equivalent to a
reduction of CO2 emissions of 1,000 t/year)
• Improve steam management at the paper mill thanks to
higher flexibility of steam production facilities
• Investment: €2.2 million
Solar thermal integration project in France
12
Slide provided by Cepi

Innovation for reducing waste heat
• Main sources of waste heat in the paper industry: dryer exhaust, effluent water
• Projects are focused on the development of innovative drying technologies that allow
efficient heat recovery
• Technologies such as mechanical vapour recompression and other kinds of heat
pumps may realise a significant reduction of energy required for steam production
• The integration of these technologies in the paper industry requires a complex
individual case-dependent redesign of the production process and its energy supply
The regulatory framework needs to promote, re-risk, support
and reward investments in energy efficiency
13
Slide provided by Cepi

Waste heat recovery in Poland
• Technology: Evaporator plant
• Description: The concept was to reduce steam consumption in
the evaporation process. More water was removed at the
evaporator stage. In addition, a reduced feed of water mixed with
fuel into the recovery boiler increases heat generation from
carbon-neutral fuel (black liquor)
• Emissions savings:
• Use less heat in the evaporation process – about 300,000
GJ/year
• Additional thermal green energy from the recovery boiler –
about 190,000 GJ/year
• Reduce coal consumption by 25,000 tonnes a year
• Investment: €6.5 million
14
Slide provided by Cepi
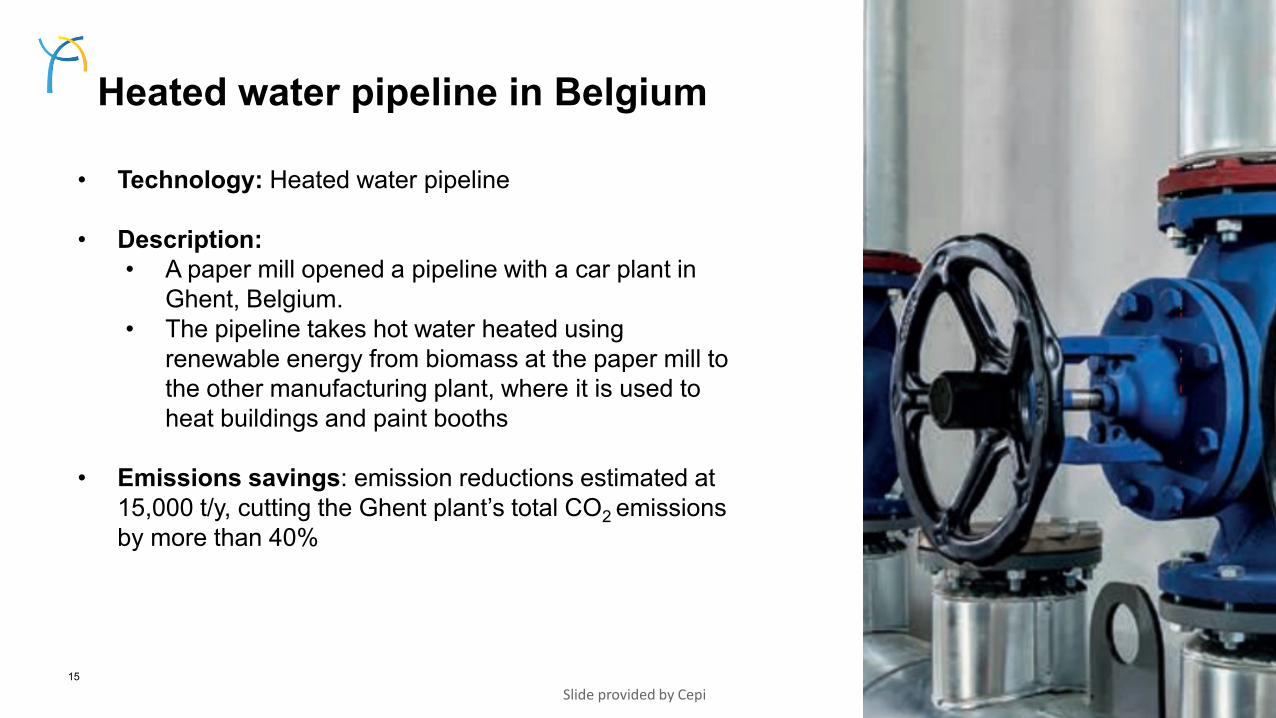
• Technology: Heated water pipeline
• Description:
• A paper mill opened a pipeline with a car plant in
Ghent, Belgium.
• The pipeline takes hot water heated using
renewable energy from biomass at the paper mill to
the other manufacturing plant, where it is used to
heat buildings and paint booths
• Emissions savings: emission reductions estimated at
15,000 t/y, cutting the Ghent plant’s total CO2 emissions
by more than 40%
Heated water pipeline in Belgium
15
Slide provided by Cepi

A paper mill heats a Dutch city
• A paper mill uses a Combined Heat and Power (CHP) plant in the Netherlands
• The mill delivers waste heat to several building complexes in the city of Maastricht
• Residual heat is used as a source of energy for heating and cooling of these buildings
16
Slide provided by Cepi

17
Decisions depend on a variety of factors
Availability, size and lay-out of
energy conversion onsite
Energy infrastructure
Age of the equipment
Legislation, regulation and
targets
Technologies available and
under development
Regional support schemes
Location of the mills
Regional initiatives
Local cooperation and an integral systems approach are needed to design
and achieve the most sustainable solutions
Slide provided by Cepi
Waste-to-Energy contributions
in heating and cooling systemsPresented by
Fabio Poretti, Technical & Scientific Officer, CEWEP

Waste-to-Energy in Europe in 2018
WtE Plants operating in Europe (not including hazardous waste incineration plants) : 492
Residual, no-recyclable waste thermally treated in European WtE plants (in million tonnes): 96
Data supplied by CEWEP membersand national sources
* Includes plant in Andorra and SAICA plant
Finland9 1.62Norway
18 1.66
Sweden37 5.92
Estonia1 0.21
Lithuania1 0.26
Poland7 0.95
Czech Republic4 0.67 Slovakia
2 0.23Hungary1 0.37
Romania
Bulgaria
Greece
Italy38 6.33
France121 14
Spain*12 3.01
Portugal4 1.13
Austria11 2.6Switzerland
30 4.04
Netherlands12 7.48
Belgium17 3.39
Germany96 26.3
Luxembourg1 0.17
Denmark26 3.4
United Kingdom42 11.49
Ireland2 0.72
Slide provided by CEWEP 19
Waste-to-Energy (WtE): waste incineration plants with energy recovery of municipal and similar commercial and industrial waste
Slide provided by CEWEP
20
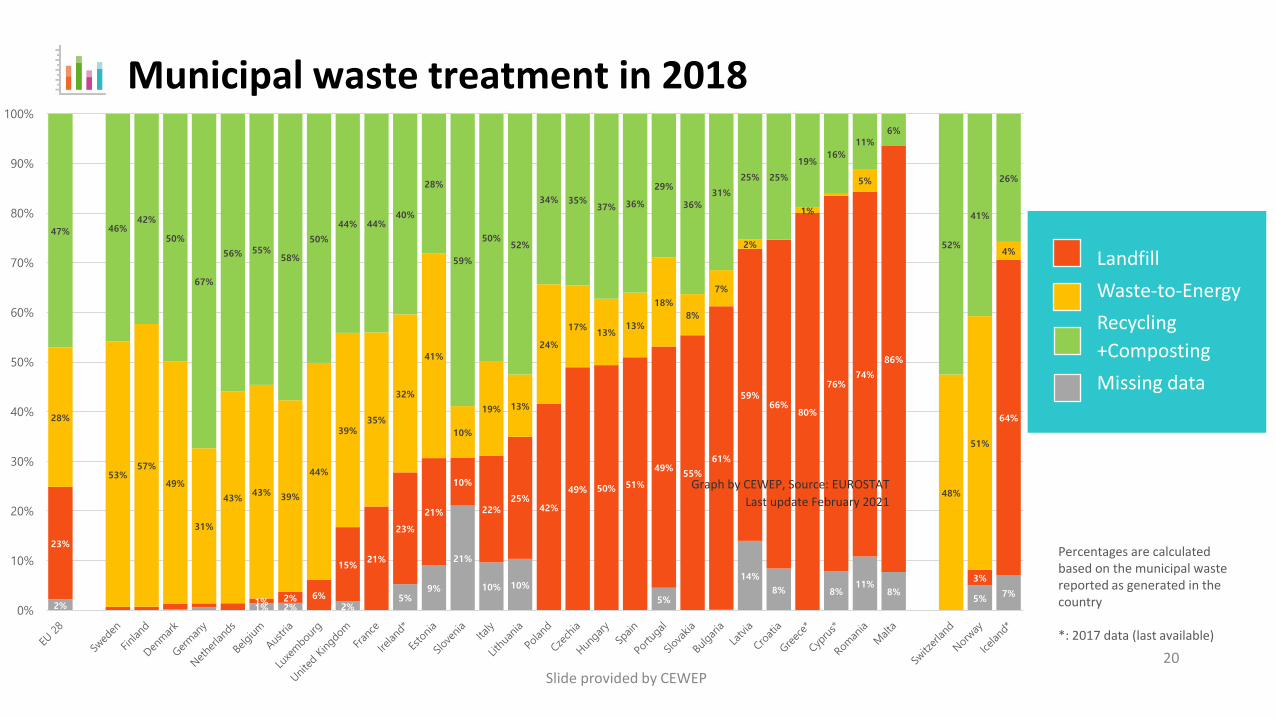
Municipal waste treatment in 2018
Landfill
Waste-to-Energy
Recycling
+Composting
Missing data
2% 1% 2% 2%5%
9%
21%
10% 10%
5%
14%
8% 8%11%
8%5%
7%
23%
1% 2% 6%
15%21%
23%
21%
10%
22%25%
42%
49% 50% 51%
49%55%
61%
59%66%
80%
76%74%
86%
3%
64%28%
53%57%
49%
31%
43%43% 39%
44%
39%35%
32%
41%
10%
19% 13%
24%
17%13%
13%
18%
8%
7%
2%
1%
5%
48%
51%
4%
47% 46%42%
50%
67%
56% 55%58%
50%
44% 44%40%
28%
59%
50%52%
34% 35%37% 36%
29%
36%
31%
25% 25%
19%16%
11%6%
52%
41%
26%
0%
10%
20%
30%
40%
50%
60%
70%
80%
90%
100%
Graph by CEWEP, Source: EUROSTAT
Last update February 2021
Percentages are calculated based on the municipal waste reported as generated in the country
*: 2017 data (last available)
Slide provided by CEWEP 21
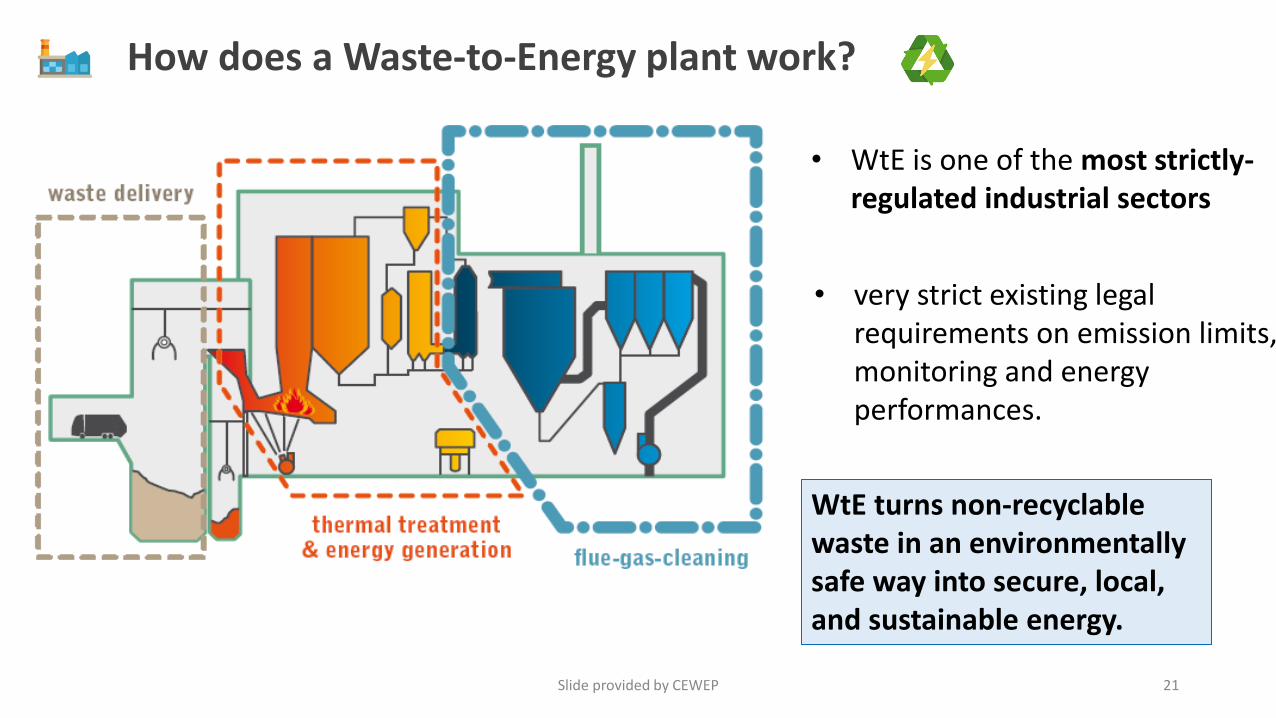
How does a Waste-to-Energy plant work?
WtE turns non-recyclable waste in an environmentally safe way into secure, local, and sustainable energy.
• very strict existing legal requirements on emission limits, monitoring and energy performances.
• WtE is one of the most strictly-regulated industrial sectors
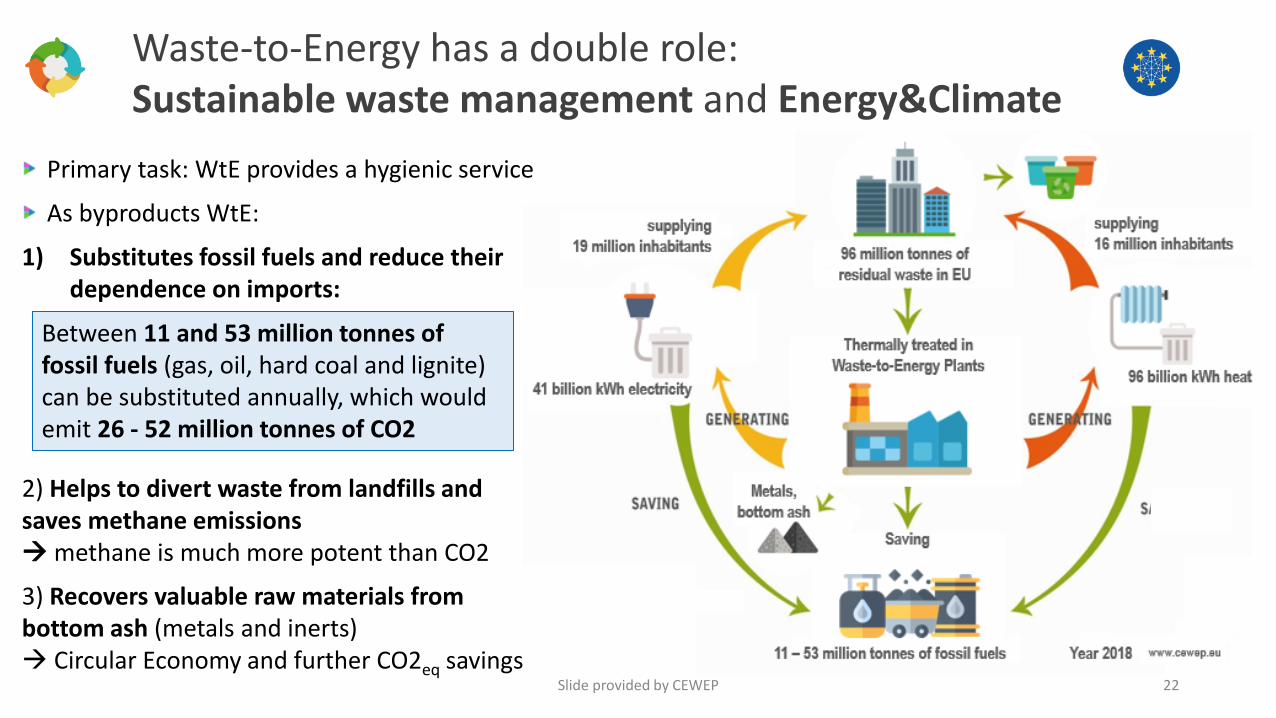
Waste-to-Energy has a double role:Sustainable waste management and Energy&Climate
Primary task: WtE provides a hygienic service
As byproducts WtE:
1) Substitutes fossil fuels and reduce their dependence on imports:
2) Helps to divert waste from landfills and saves methane emissions→ methane is much more potent than CO2
3) Recovers valuable raw materials from bottom ash (metals and inerts)→ Circular Economy and further CO2eq savings
Slide provided by CEWEP 22
Between 11 and 53 million tonnes of fossil fuels (gas, oil, hard coal and lignite) can be substituted annually, which would emit 26 - 52 million tonnes of CO2
Slide provided by CEWEP 23
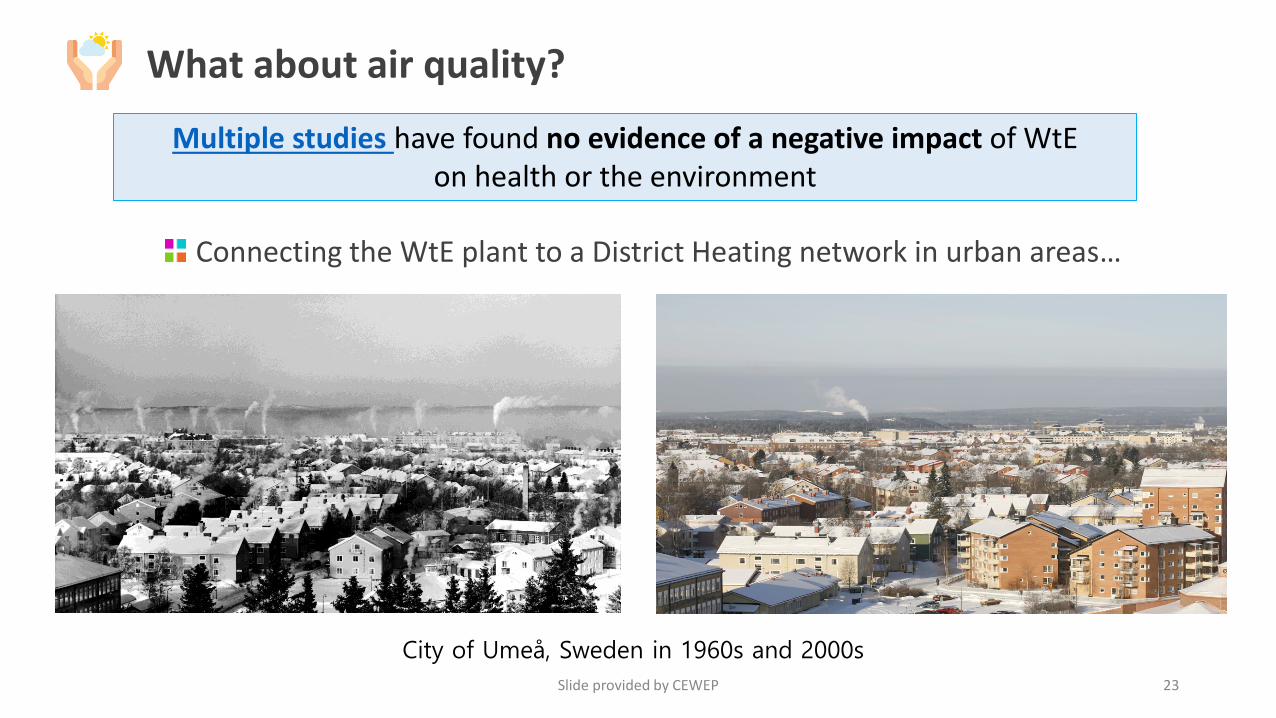
What about air quality?
Multiple studies have found no evidence of a negative impact of WtEon health or the environment
Connecting the WtE plant to a District Heating network in urban areas…
City of Umeå, Sweden in 1960s and 2000s

Slide provided by CEWEP 24
Waste-to-Energy as an effective CHP and renewable Heating&Cooling technology
▪ 2/3 of Europe’s WtE plants are Combined Heat & Power (CHP) producers.
▪ 10% of Europe’s energy to District Heating comes from WtE;→ On a local level WtE supplies sometimes more than 50% of the heat demand (EU average is much lower as not all Member States have WtE plants)
▪ WtE can rely on programmability and flexibility of energy production, delivering energy vectors through various forms (electricity, heat, steam) + many other possibilities of sector coupling and industrial symbiosis.
▪ Waste is a very heterogeneous type of fuel but, on average, around 55% of the energy produced by a WtE facility is renewable (biodegradable/organic fraction of residual waste)
▪ Recent Report by the European Commission – JRC (2021):Integrating renewable and waste heat and cold sources into district heating and cooling systems - Case studies analysis, replicable key success factors and potential policy implications
Some WtE Success Stories from JRC Report – MILANO
Slide provided by CEWEP 25
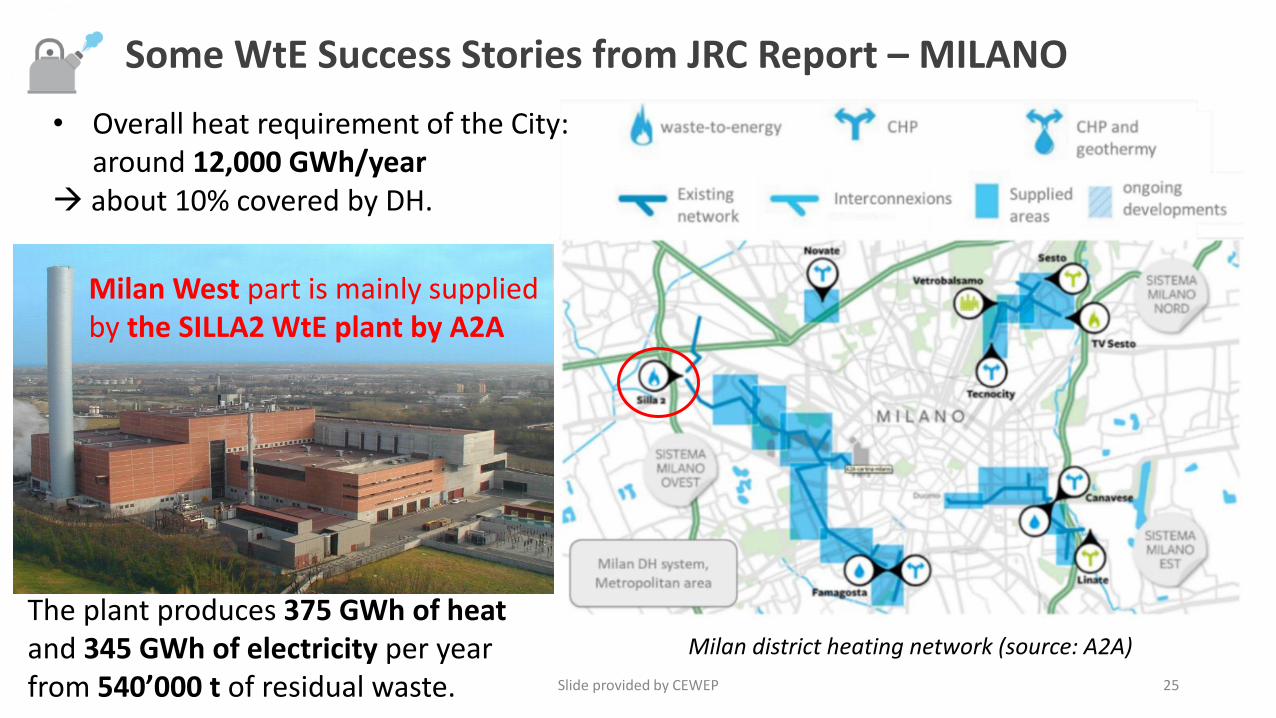
The plant produces 375 GWh of heat and 345 GWh of electricity per year from 540’000 t of residual waste.
Milan district heating network (source: A2A)
• Overall heat requirement of the City: around 12,000 GWh/year
→ about 10% covered by DH.
Milan West part is mainly supplied by the SILLA2 WtE plant by A2A
Slide provided by CEWEP 26
Some WtE Success Stories from JRC Report – BARCELONA
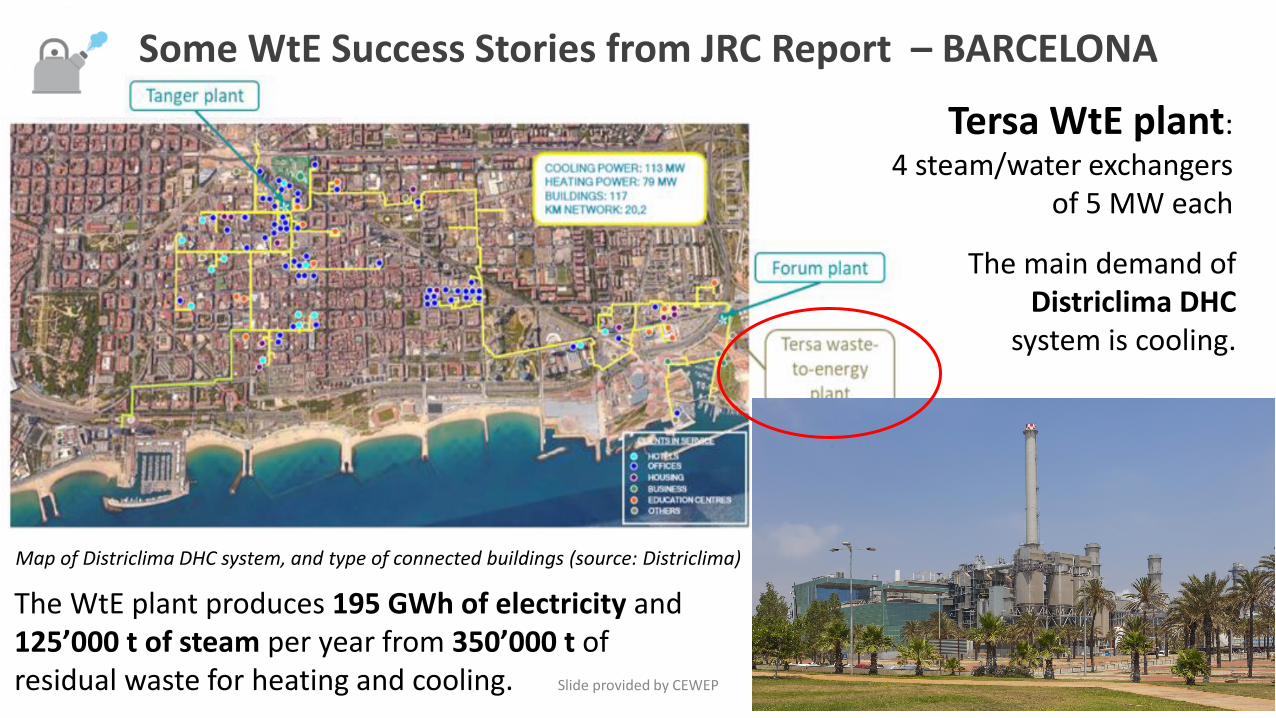
Tersa WtE plant:
4 steam/water exchangers of 5 MW each
The WtE plant produces 195 GWh of electricity and125’000 t of steam per year from 350’000 t of residual waste for heating and cooling.
Map of Districlima DHC system, and type of connected buildings (source: Districlima)
The main demand of Districlima DHC
system is cooling.
Slide provided by CEWEP 27
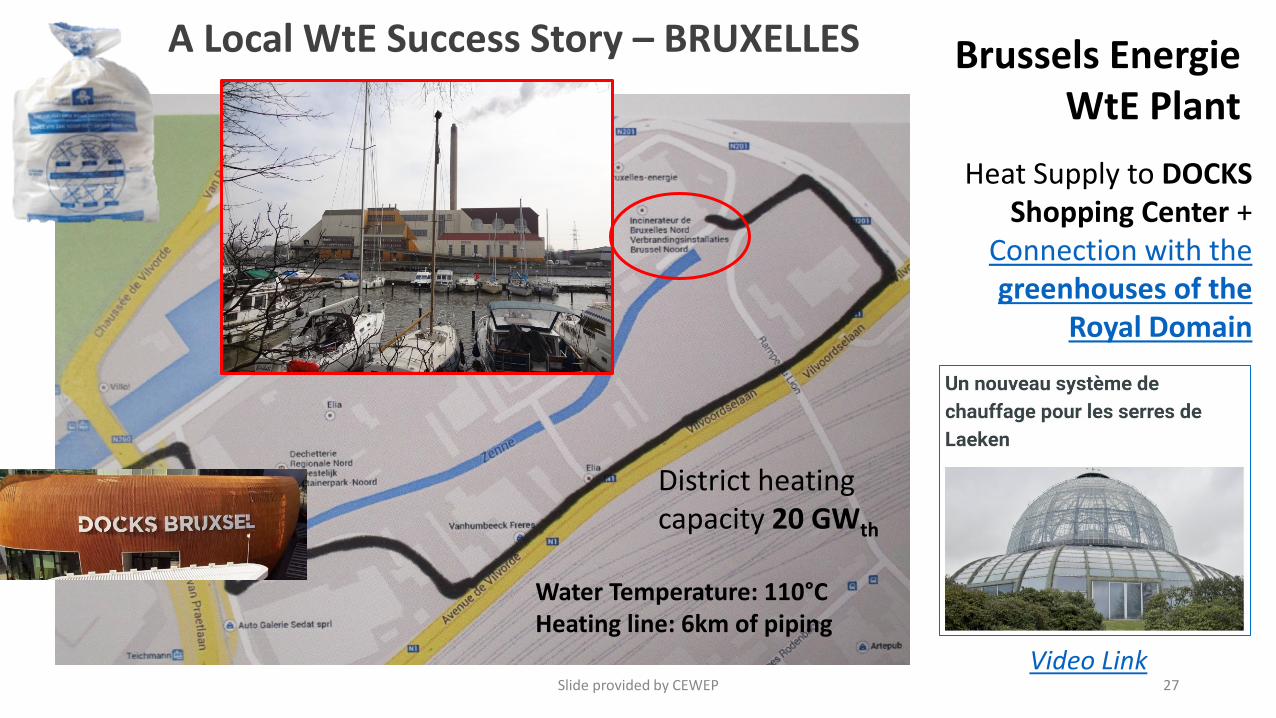
A Local WtE Success Story – BRUXELLES
Heat Supply to DOCKSShopping Center +
Connection with the greenhouses of the
Royal Domain
Brussels EnergieWtE Plant
District heating capacity 20 GWth
Water Temperature: 110°CHeating line: 6km of piping
Video Link

Belgium: Industrial symbiosis in the port of Antwerp
Slide provided by CEWEP 28Source: www.ecluse.be
• Energy cluster: steam from Waste-to-Energy to chemical companies
• Sustainable and reliable energy supply for industry
• Important pillar in energy and competitiveness policy of the Flemish government
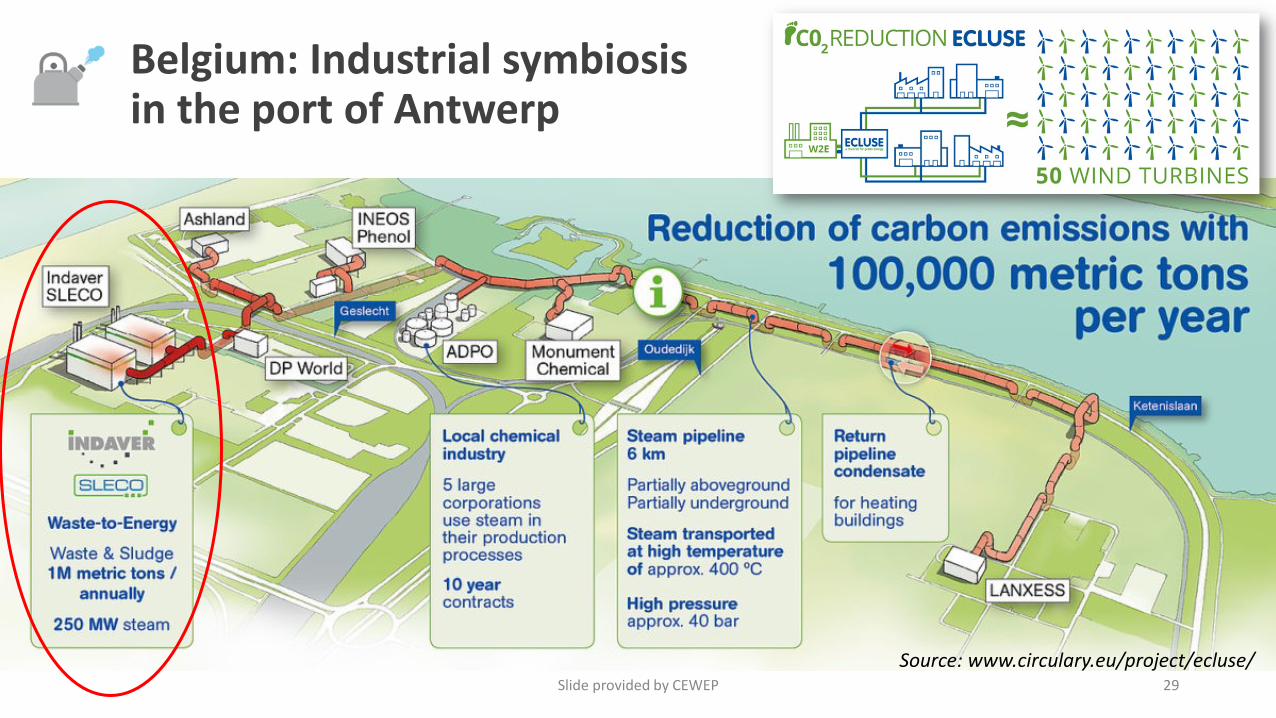
Belgium: Industrial symbiosis in the port of Antwerp
Slide provided by CEWEP 29
Source: www.circulary.eu/project/ecluse/
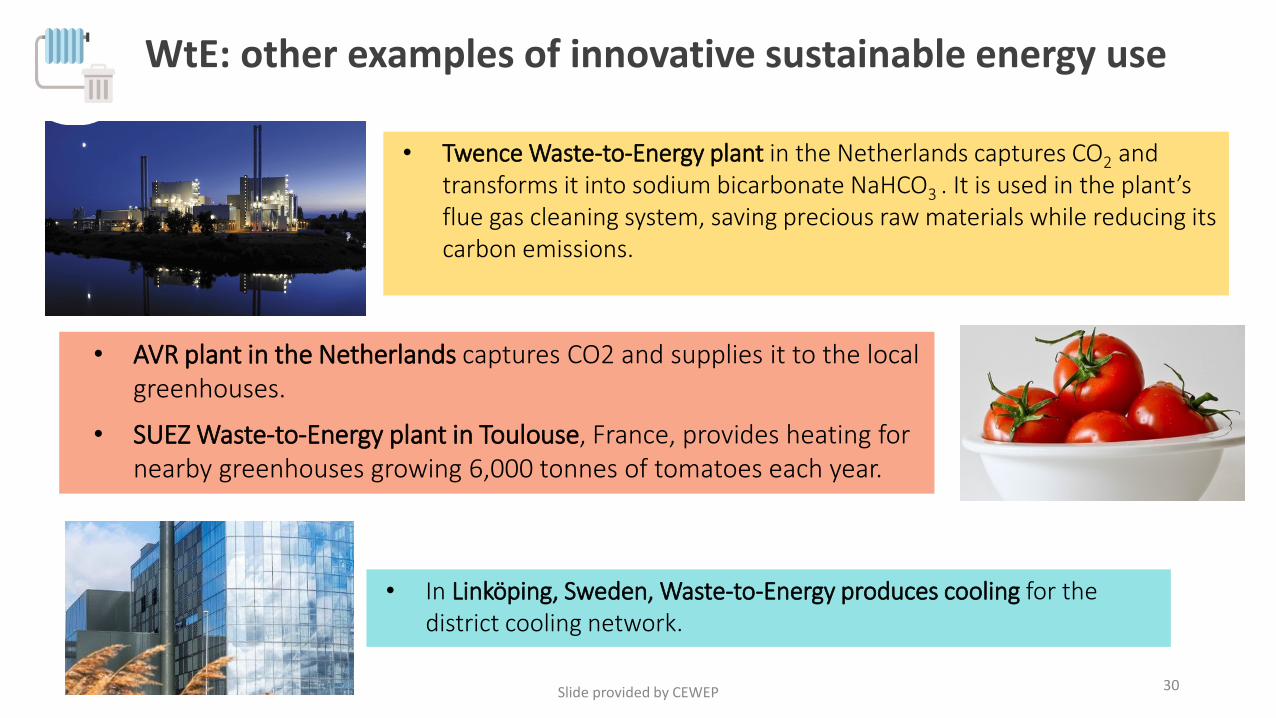
WtE: other examples of innovative sustainable energy use
• AVR plant in the Netherlands captures CO2 and supplies it to the local greenhouses.
• SUEZ Waste-to-Energy plant in Toulouse, France, provides heating for nearby greenhouses growing 6,000 tonnes of tomatoes each year.
• Twence Waste-to-Energy plant in the Netherlands captures CO2 and transforms it into sodium bicarbonate NaHCO3 . It is used in the plant’s flue gas cleaning system, saving precious raw materials while reducing its carbon emissions.
• In Linköping, Sweden, Waste-to-Energy produces cooling for the district cooling network.
Slide provided by CEWEP 30

Back-up slide
Slide provided by CEWEP32


