24
Cordell Building Indices Cordell Housing Index Price (CHIPS) December 2017

Cordell Building IndicesCordell Housing Index Price (CHIPS)December 2017

© Copyright 2018. CoreLogic and its licensors are the sole and exclusive owners of all rights, title and interest (including intellectual property rights) the CoreLogic Data contained in this publication.All rights reserved.
CoreLogic Housing Index Prices December 2017 | 2
Introduction to the Cordell Building Indices 3
Key Components 3
Cordell Housing Index Price 4
National CHIP vs National CPI 6
NSW CHIP vs NSW CPI 8
VIC CHIP vs VIC CPI 10
QLD CHIP vs QLD CPI 12
SA CHIP vs SA CPI 14
WA CHIP vs WA CPI 16
CHIP & Consumer Price Index (CPI) figures 18
Contents

© Copyright 2018. CoreLogic and its licensors are the sole and exclusive owners of all rights, title and interest (including intellectual property rights) the CoreLogic Data contained in this publication.All rights reserved.
CoreLogic Housing Index Prices December 2017 | 3
Introduction to Cordell Building IndicesThe Cordell Building Indices (CBI) are a series of construction industry index figures that are used to monitor the movement in costs associated with building work within particular segments of the industry.
The CBI indicate the rate of change in prices within particular segments of the Australian construction industry. The changes in prices are measured daily through the use of detailed cost surveys, and are reported on a quarterly basis. This ensures the most current and comprehensive industry information available.
Each index is based on a combination of labour, material, plant hire and subcontract services required to construct buildings within the particular segment being measured. The CBI measure the change in the cost of constructing buildings, and as such do not provide the actual costs.
Key Components
The indices are based on a comprehensive collection of labour, material, plant hire and subcontract costs covering all major trade categories within the segment being measured.
Each of the trade categories contains labour, material and plant hire costs combined in typical proportions required to construct the various types of buildings commonly found within each segment.

© Copyright 2018. CoreLogic and its licensors are the sole and exclusive owners of all rights, title and interest (including intellectual property rights) the CoreLogic Data contained in this publication.All rights reserved.
CoreLogic Housing Index Prices December 2017 | 4
The Cordell Housing Index Price (CHIP) measures the rate of change of construction costs within the residential market and covers freestanding and semi-detached single and two storey dwelling homes.
The key categories within the CHIP index include:
�� Preliminaries �� Excavation and Concrete Work
�� Brickwork �� Carpentry and Joinery
�� Roofing Insulation and Roof Plumbing �� Windows and Glazing
�� Doors and Hardware �� Plastering
�� Painting and Tiling �� Plumbing and Drainage
�� Electrical Services �� Sundry Appliances
Cordell Housing Price Index
CHIP Trade Breakup
Pre
limin
arie
s
Bri
ckw
ork
Ro
ofi
ng
Insu
lati
on
and
R
oo
f P
lum
bin
g
Do
ors
&
Har
dw
are
Pai
ntin
g &
Ti
ling
Ele
ctri
cal
Ser
vice
s &
Sun
dry
A
pp
lianc
es
Exc
avat
ion
&
Co
ncre
te W
ork
Car
pen
try
&
Join
ery
Win
do
ws
&
Gla
zing
Pla
ster
ing
Plu
mb
ing
&
Dra
inag
e
20%
15%
25%
10%
5%
0%

In construction, you need a constant supply of work coming through the pipe to keep your team busy, and know your business is on track.
CoreLogic is Australia’s largest provider of property, building and construction data and analytics. Our products make sure you know exactly what is going on in your market – from information about who is moving in and out, through to renovations, new builds and major projects. We even supply you with contact details and the leads to win more business.
6 ways big data can help you win more work
Our Insights. Your Story.
Contact us today on 1300 734 318 or visit corelogic.com.au
RP Data ProfessionalRP Data Professional provides the construction industry with unparalleled insights into the location, positioning, access and building age and quality of existing properties, together with property value and ownership insights.
Cordell ConnectCordell Connect provides real time access to qualified sales leads across all types of construction projects, including residential, commercial, retail, and industrial.
Save money on advertising
Build relationships and generate leads
Market directly to prospective customers
Understand property size, location and age before you visit the site
Prospect more effectively
Create quotes for jobs more quickly and accurately
Six ways we’re seeing the construction industry use data to win new work and grow their profits using our key products Cordell Connect and RP Data Professional
© Copyright 2018. CoreLogic and its licensors are the sole and exclusive owners of all rights, title and interest (including intellectual property rights) the CoreLogic Data contained in this publication.All rights reserved.
CoreLogic Housing Index Prices December 2017 | 6
National
Q4
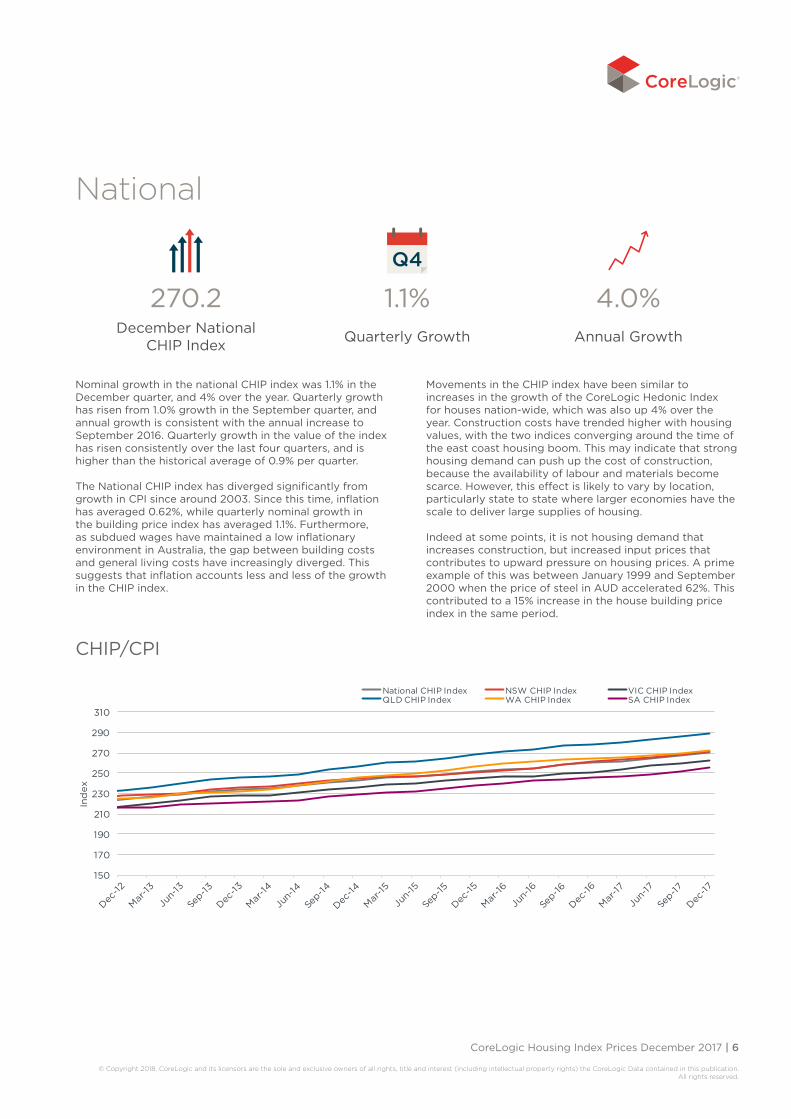
270.2 1.1% 4.0%December National
CHIP Index Quarterly Growth Annual Growth
Nominal growth in the national CHIP index was 1.1% in the December quarter, and 4% over the year. Quarterly growth has risen from 1.0% growth in the September quarter, and annual growth is consistent with the annual increase to September 2016. Quarterly growth in the value of the index has risen consistently over the last four quarters, and is higher than the historical average of 0.9% per quarter.
The National CHIP index has diverged significantly from growth in CPI since around 2003. Since this time, inflation has averaged 0.62%, while quarterly nominal growth in the building price index has averaged 1.1%. Furthermore, as subdued wages have maintained a low inflationary environment in Australia, the gap between building costs and general living costs have increasingly diverged. This suggests that inflation accounts less and less of the growth in the CHIP index.
Movements in the CHIP index have been similar to increases in the growth of the CoreLogic Hedonic Index for houses nation-wide, which was also up 4% over the year. Construction costs have trended higher with housing values, with the two indices converging around the time of the east coast housing boom. This may indicate that strong housing demand can push up the cost of construction, because the availability of labour and materials become scarce. However, this effect is likely to vary by location, particularly state to state where larger economies have the scale to deliver large supplies of housing.
Indeed at some points, it is not housing demand that increases construction, but increased input prices that contributes to upward pressure on housing prices. A prime example of this was between January 1999 and September 2000 when the price of steel in AUD accelerated 62%. This contributed to a 15% increase in the house building price index in the same period.
CHIP/CPI
150
170
190
210
230
250
270
290
310
Ind
ex
National CHIP Index NSW CHIP Index VIC CHIP IndexQLD CHIP Index WA CHIP Index SA CHIP Index

© Copyright 2018. CoreLogic and its licensors are the sole and exclusive owners of all rights, title and interest (including intellectual property rights) the CoreLogic Data contained in this publication.All rights reserved.
CoreLogic Housing Index Prices December 2017 | 7
0
50
100
150
200
250
300
Ind
ex
Quarterly Growth National CHIP Index Quarterly Growth National CPI
Percentage Cost Change - National
CHIP/CPI - National
National CHIP Index National CPI
-2.0%
-1.0%
0.0%
1.0%
2.0%
3.0%
4.0%
% C
ost
Cha
nge

© Copyright 2018. CoreLogic and its licensors are the sole and exclusive owners of all rights, title and interest (including intellectual property rights) the CoreLogic Data contained in this publication.All rights reserved.
CoreLogic Housing Index Prices December 2017 | 8
New South Wales
Q4
271.0 1.1% 4.0%December National
CHIP Index Quarterly Growth Annual Growth
Growth in the NSW CHIP index was 1.1% in the December quarter, virtually steady on the previous quarter. Annual growth, as with the national rate, was 4% in December 2017 and December 2016.
Despite the rapid increase in NSW housing values, a similar acceleration was not seen in the rate of growth in construction costs. The CoreLogic Hedonic Home Value index for NSW houses has surged 62.5% from December 2012. Meanwhile, the CHIP Index increased just 19% in the same period. The building cost actually maintained a higher average quarterly growth rate over the last 10 years (1.02%) than in the last 5 years during the housing boom (0.98%).
Furthermore, price gains in NSW construction costs have not accelerated as much as in WA and Qld, where price sales price growth and demand has been relatively weak. The large scale of dwelling creation across NSW may have increased efficiencies, and maintained relatively low growth in the NSW CHIP index over time.
Over the past 10 years, the CHIP index has grown 0.36% faster than inflation at each quarter. As a result, the indices are moving further apart over time.

© Copyright 2018. CoreLogic and its licensors are the sole and exclusive owners of all rights, title and interest (including intellectual property rights) the CoreLogic Data contained in this publication.All rights reserved.
CoreLogic Housing Index Prices December 2017 | 9
0
50
100
150
200
250
300
Ind
ex
NSW CHIP Index NSW CPI
Percentage Cost Change - New South Wales
CHIP/CPI - New South Wales
NSW CHIP Index NSW CPI
-2.0%
-1.0%
0.0%
1.0%
2.0%
3.0%
4.0%
% C
ost
Cha
nge

© Copyright 2018. CoreLogic and its licensors are the sole and exclusive owners of all rights, title and interest (including intellectual property rights) the CoreLogic Data contained in this publication.All rights reserved.
CoreLogic Housing Index Prices December 2017 | 10
Victoria
Q4
262.7 1.3% 5.0%December National
CHIP Index Quarterly Growth Annual Growth
Although the VIC CHIP index is lower than the national figure (270.2), the quarterly nominal increase in Victoria’s building price index (1.3%) is currently higher than building costs across Australia (1.1%). The annual increase in Victoria’s CHIP index was 5%, which was the highest annual growth rate of all the states and territories. Such a substantial increase over the year is likely to impact the value of new homes, or narrow profit margins for developers.
As well as increases in building input values and labour, Cordell development data indicates that 11.1% of residential subdivision commencements across Victoria were in regional parts of the state in 2017. Furthermore, a further 48.6% of residential subdivisions commenced on the fringes of the Melbourne metropolitan, such as in Hume, Whittlesea and Wyndham. This may see higher freight costs built into the delivery of materials to regional sites. Real increases in the VIC CHIP index were particularly high in the year to December 2014, as state inflation fell as low as 0.2%.

© Copyright 2018. CoreLogic and its licensors are the sole and exclusive owners of all rights, title and interest (including intellectual property rights) the CoreLogic Data contained in this publication.All rights reserved.
CoreLogic Housing Index Prices December 2017 | 11
0
50
100
150
200
250
300
Ind
ex
VIC CHIP Index VIC CPI
Percentage Cost Change - Victoria
CHIP/CPI - Victoria
VIC CHIP Index VIC CPI
-3.0%
-2.0%
-1.0%
0.0%
1.0%
2.0%
3.0%
4.0%
% C
ost
Cha
nge
© Copyright 2018. CoreLogic and its licensors are the sole and exclusive owners of all rights, title and interest (including intellectual property rights) the CoreLogic Data contained in this publication.All rights reserved.
CoreLogic Housing Index Prices December 2017 | 12
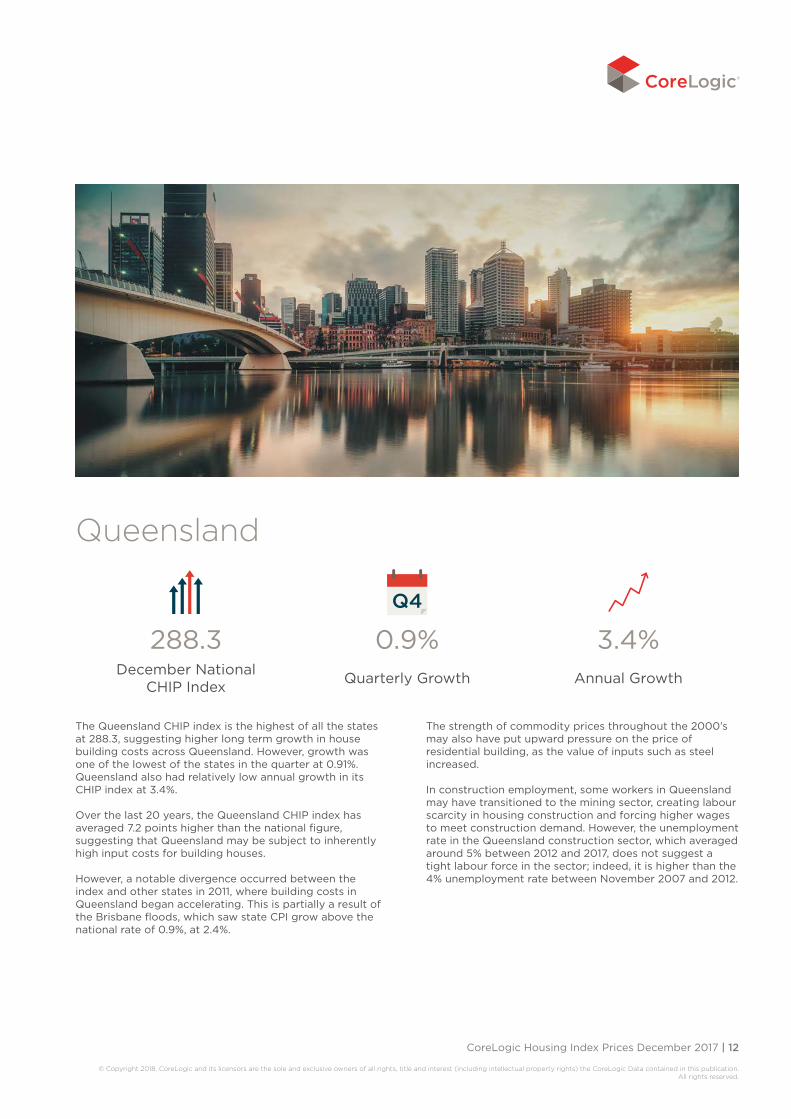
Queensland
Q4
288.3 0.9% 3.4%December National
CHIP Index Quarterly Growth Annual Growth
The Queensland CHIP index is the highest of all the states at 288.3, suggesting higher long term growth in house building costs across Queensland. However, growth was one of the lowest of the states in the quarter at 0.91%. Queensland also had relatively low annual growth in its CHIP index at 3.4%.
Over the last 20 years, the Queensland CHIP index has averaged 7.2 points higher than the national figure, suggesting that Queensland may be subject to inherently high input costs for building houses.
However, a notable divergence occurred between the index and other states in 2011, where building costs in Queensland began accelerating. This is partially a result of the Brisbane floods, which saw state CPI grow above the national rate of 0.9%, at 2.4%.
The strength of commodity prices throughout the 2000’s may also have put upward pressure on the price of residential building, as the value of inputs such as steel increased.
In construction employment, some workers in Queensland may have transitioned to the mining sector, creating labour scarcity in housing construction and forcing higher wages to meet construction demand. However, the unemployment rate in the Queensland construction sector, which averaged around 5% between 2012 and 2017, does not suggest a tight labour force in the sector; indeed, it is higher than the 4% unemployment rate between November 2007 and 2012.

© Copyright 2018. CoreLogic and its licensors are the sole and exclusive owners of all rights, title and interest (including intellectual property rights) the CoreLogic Data contained in this publication.All rights reserved.
CoreLogic Housing Index Prices December 2017 | 13
0
50
100
150
200
250
300
Ind
ex
QLD CHIP Index QLD CPI
Percentage Cost Change - Queensland
CHIP/CPI - Queensland
QLD CHIP Index QLD CPI
-2.0%
-1.0%
0.0%
1.0%
2.0%
3.0%
4.0%
% C
ost
Cha
nge

© Copyright 2018. CoreLogic and its licensors are the sole and exclusive owners of all rights, title and interest (including intellectual property rights) the CoreLogic Data contained in this publication.All rights reserved.
CoreLogic Housing Index Prices December 2017 | 14
South Australia
Q4
255.0 1.2% 3.8%December National
CHIP Index Quarterly Growth Annual Growth
South Australia saw the second highest growth in the CHIP index behind Victoria, at 1.2% in the December 2017 quarter. This is a bounce back from the September quarter, where growth in the index was just 0.1%. While there may be seasonal factors at play, annual growth in the index has also risen from 3.4% at 2016, to 3.8% at 2017.
The highest growth rate of the CHIP index in 10 years for South Australia was in the September 2012 quarter, when the index rose 3.1%. This was a high inflationary period for the state, driven largely by a surge in electricity prices and utilities. This would have affected residential projects and material inputs at the time.
However, at an index of 255.0, South Australia has had the lowest growth in household construction costs of the states. This is largely a reflection of the local economy. Low incomes and persistently high unemployment have kept inflation and prices low. The increase in the CoreLogic hedonic value indices for South Australia suggest that house values are still experiencing soft growth. The CoreLogic home value index for South Australian houses increased 2.8% at December 2017 down from 3.1% at December 2016.

© Copyright 2018. CoreLogic and its licensors are the sole and exclusive owners of all rights, title and interest (including intellectual property rights) the CoreLogic Data contained in this publication.All rights reserved.
CoreLogic Housing Index Prices December 2017 | 15
0
50
100
150
200
250
300
Ind
ex
SA CHIP Index SA CPI
Percentage Cost Change - South Australia
CHIP/CPI - South Australia
SA CHIP Index SA CPI
-3.0%
-2.0%
-1.0%
0.0%
1.0%
2.0%
3.0%
4.0%
% C
ost
Cha
nge

© Copyright 2018. CoreLogic and its licensors are the sole and exclusive owners of all rights, title and interest (including intellectual property rights) the CoreLogic Data contained in this publication.All rights reserved.
CoreLogic Housing Index Prices December 2017 | 16
Western Australia
Q4
271.6 0.9% 2.6%December National
CHIP Index Quarterly Growth Annual Growth
Growth in house price building for Western Australia rose sharply over the December 2017 quarter at 0.93%, up from 0.49% in the previous quarter. Over the year, the state saw the lowest annual growth rate in the CHIP index, at just 2.6%. This is partially because inflation in Western Australia has been so low; growth in CPI averaged just 0.15% between January and September 2017.
However, real growth in the index has also been low relative to the other states. Between January and September 2017, real growth in the WA CHIP index was 0.4% per quarter, as opposed to 0.5% nationwide.

© Copyright 2018. CoreLogic and its licensors are the sole and exclusive owners of all rights, title and interest (including intellectual property rights) the CoreLogic Data contained in this publication.All rights reserved.
CoreLogic Housing Index Prices December 2017 | 17
0
50
100
150
200
250
300
Ind
ex
WA CHIP Index WA CPI
Percentage Cost Change - Western Australia
CHIP/CPI - Western Australia
WA CHIP Index WA CPI
-3.0%
-2.0%
-1.0%
0.0%
1.0%
2.0%
3.0%
4.0%
% C
ost
Cha
nge
© Copyright 2018. CoreLogic and its licensors are the sole and exclusive owners of all rights, title and interest (including intellectual property rights) the CoreLogic Data contained in this publication.All rights reserved.
CoreLogic Housing Index Prices December 2017 | 18
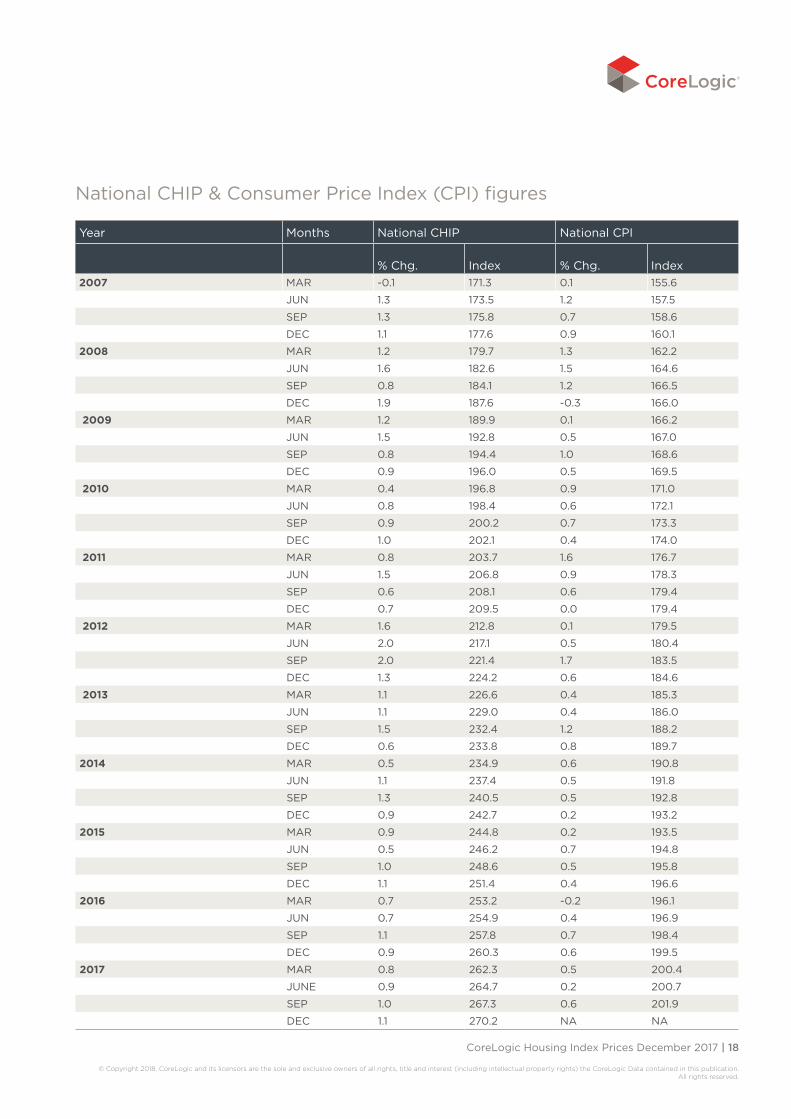
National CHIP & Consumer Price Index (CPI) figures
Year Months National CHIP National CPI
% Chg. Index % Chg. Index2007 MAR -0.1 171.3 0.1 155.6
JUN 1.3 173.5 1.2 157.5
SEP 1.3 175.8 0.7 158.6
DEC 1.1 177.6 0.9 160.1
2008 MAR 1.2 179.7 1.3 162.2
JUN 1.6 182.6 1.5 164.6
SEP 0.8 184.1 1.2 166.5
DEC 1.9 187.6 -0.3 166.0
2009 MAR 1.2 189.9 0.1 166.2
JUN 1.5 192.8 0.5 167.0
SEP 0.8 194.4 1.0 168.6
DEC 0.9 196.0 0.5 169.5
2010 MAR 0.4 196.8 0.9 171.0
JUN 0.8 198.4 0.6 172.1
SEP 0.9 200.2 0.7 173.3
DEC 1.0 202.1 0.4 174.0
2011 MAR 0.8 203.7 1.6 176.7
JUN 1.5 206.8 0.9 178.3
SEP 0.6 208.1 0.6 179.4
DEC 0.7 209.5 0.0 179.4
2012 MAR 1.6 212.8 0.1 179.5
JUN 2.0 217.1 0.5 180.4
SEP 2.0 221.4 1.7 183.5
DEC 1.3 224.2 0.6 184.6
2013 MAR 1.1 226.6 0.4 185.3
JUN 1.1 229.0 0.4 186.0
SEP 1.5 232.4 1.2 188.2
DEC 0.6 233.8 0.8 189.7
2014 MAR 0.5 234.9 0.6 190.8
JUN 1.1 237.4 0.5 191.8
SEP 1.3 240.5 0.5 192.8
DEC 0.9 242.7 0.2 193.2
2015 MAR 0.9 244.8 0.2 193.5
JUN 0.5 246.2 0.7 194.8
SEP 1.0 248.6 0.5 195.8
DEC 1.1 251.4 0.4 196.6
2016 MAR 0.7 253.2 -0.2 196.1
JUN 0.7 254.9 0.4 196.9
SEP 1.1 257.8 0.7 198.4
DEC 0.9 260.3 0.6 199.5
2017 MAR 0.8 262.3 0.5 200.4
JUNE 0.9 264.7 0.2 200.7
SEP 1.0 267.3 0.6 201.9
DEC 1.1 270.2 NA NA

© Copyright 2018. CoreLogic and its licensors are the sole and exclusive owners of all rights, title and interest (including intellectual property rights) the CoreLogic Data contained in this publication.All rights reserved.
CoreLogic Housing Index Prices December 2017 | 19
New South Wales CHIP & Consumer Price Index (CPI) figures
Year Months National CHIP National CPI
% Chg. Index % Chg. Index2007 MAR -0.6 178.0 -0.1 155.6
JUN 1.5 180.7 1.2 157.4
SEP 0.5 181.7 0.4 158.1
DEC 1.5 184.4 0.9 159.5
2008 MAR 1.3 186.8 1.4 161.7
JUN 1.0 188.6 1.5 164.1
SEP 0.8 190.1 1.1 165.9
DEC 1.6 193.0 -0.2 165.5
2009 MAR 0.9 194.8 0.1 165.6
JUN 2.4 199.5 0.4 166.3
SEP 0.5 200.5 1.1 168.1
DEC 0.8 202.0 0.6 169.1
2010 MAR 0.5 203.1 0.8 170.5
JUN 1.0 205.1 0.4 171.1
SEP 0.8 206.7 0.8 172.5
DEC 0.7 208.2 0.3 173.1
2011 MAR 0.6 209.4 1.6 175.9
JUN 1.4 212.3 1.0 177.6
SEP 0.4 213.1 0.7 178.8
DEC 0.5 214.3 -0.1 178.7
2012 MAR 1.6 217.7 0.1 178.8
JUN 1.6 221.2 0.6 179.9
SEP 1.7 225.0 1.7 183.0
DEC 1.1 227.4 0.1 183.1
2013 MAR 0.7 229.0 0.4 183.9
JUN 0.4 230.0 0.4 184.6
SEP 1.7 233.9 1.2 186.8
DEC 1.0 236.3 0.7 188.1
2014 MAR 0.4 237.2 0.6 189.2
JUN 1.1 239.7 0.4 189.9
SEP 1.2 242.6 0.6 191.0
DEC 0.6 244.1 0.2 191.4
2015 MAR 0.7 245.8 0.5 192.3
JUN 0.5 247.0 0.9 194.0
SEP 0.7 248.7 0.3 194.6
DEC 1.0 251.2 0.3 195.2
2016 MAR 0.4 252.2 -0.2 194.8
JUN 0.9 254.5 0.6 195.9
SEP 1.4 258.1 1.0 197.8
DEC 1.1 260.9 0.50 198.7
2017 MARCH 0.9 263.3 0.40 199.5
JUNE 0.7 265.1 0.40 200.1
SEP 1.1 268.0 0.7 201.6
DEC 1.1 271.0 NA NA

© Copyright 2018. CoreLogic and its licensors are the sole and exclusive owners of all rights, title and interest (including intellectual property rights) the CoreLogic Data contained in this publication.All rights reserved.
CoreLogic Housing Index Prices December 2017 | 20
Year Months National CHIP National CPI
% Chg. Index % Chg. Index2007 MAR -0.1 160.6 0.2 153.8
JUN 0.9 162.0 1.2 155.6
SEP 2.3 165.7 0.8 156.9
DEC 0.7 166.9 1.0 158.5
2008 MAR 1.0 168.6 1.3 160.6
JUN 2.3 172.4 1.2 162.5
SEP 0.9 174.0 1.2 164.4
DEC 2.3 178.0 -0.5 163.5
2009 MAR 1.7 181.0 0.2 163.9
JUL 1.2 183.1 0.3 164.4
SEP 1.1 185.2 0.6 165.4
DEC 1.0 187.1 0.6 166.4
2010 MAR 0.2 187.5 1.3 168.5
JUN 1.0 189.4 0.6 169.5
SEP 0.9 191.2 0.6 170.5
DEC 1.1 193.2 0.6 171.5
2011 MAR 0.9 195.0 1.7 174.4
JUN 1.7 198.3 0.7 175.6
SEP 0.7 199.6 0.6 176.7
DEC 0.8 201.3 0.1 176.8
2012 MAR 1.6 204.4 0.0 176.8
JUN 2.5 209.6 0.5 177.7
SEP 1.9 213.5 1.8 180.9
DEC 1.7 217.2 0.7 182.2
2013 MAR 1.3 220.0 0.4 182.9
JUN 1.4 223.2 0.2 183.2
SEP 1.7 227.0 1.4 185.8
DEC 0.2 227.5 0.8 187.2
2014 MAR 0.3 228.1 0.5 188.2
JUN 1.0 230.4 0.6 189.2
SEP 1.6 234.1 0.2 189.6
DEC 1.0 236.4 0.2 190.0
2015 MAR 0.9 238.5 0.1 190.1
JUN 0.4 239.5 0.7 191.4
SEP 1.1 242.1 0.5 192.3
DEC 1.0 244.5 0.7 193.6
2016 MAR 0.6 246.0 -0.1 193.4
JUN 0.6 247.5 0.4 194.2
SEP 0.8 249.5 0.5 195.1
DEC 0.6 250.9 0.7 196.5
2017 MAR 1.1 253.7 0.9 198.3
JUNE 1.3 257.0 0.1 198.4
SEP 0.9 259.3 0.5 199.3
DEC 1.3 262.7 NA NA
Victoria CHIP & Consumer Price Index (CPI) figures

© Copyright 2018. CoreLogic and its licensors are the sole and exclusive owners of all rights, title and interest (including intellectual property rights) the CoreLogic Data contained in this publication.All rights reserved.
CoreLogic Housing Index Prices December 2017 | 21
Queensland CHIP & Consumer Price Index (CPI) figures
Year Months National CHIP National CPI
% Chg. Index % Chg. Index2007 MAR 0.4 176.6 0.4 158.0
JUN 1.7 179.7 1.4 160.2
SEP 1.2 181.8 0.9 161.7
DEC 0.9 183.5 1.1 163.4
2008 MAR 1.1 185.4 1.3 165.6
JUN 1.3 187.9 1.7 168.4
SEP 1.0 189.7 1.4 170.8
DEC 2.3 194.1 -0.2 170.4
2009 MAR 1.7 197.5 0.2 170.8
JUN 1.0 199.4 0.6 171.8
SEP 0.8 201.1 1.3 174.1
DEC 0.7 202.4 0.3 174.7
2010 MAR 0.4 203.1 0.7 176.0
JUN 0.4 203.9 0.7 177.3
SEP 0.9 205.8 1.0 179.1
DEC 1.0 207.8 0.5 180.0
2011 MAR 0.9 209.8 1.3 182.3
JUN 2.1 214.2 1.0 184.1
SEP 0.9 216.2 0.3 184.7
DEC 0.8 217.9 -0.2 184.4
2012 MAR 2.0 222.3 0.2 184.7
JUN 1.6 225.9 0.6 185.8
SEP 2.1 230.7 1.7 189.0
DEC 1.2 233.5 0.7 190.3
2013 MAR 1.2 236.3 0.1 190.5
JUN 1.3 239.4 0.5 191.4
SEP 1.7 243.4 1.3 193.9
DEC 0.6 244.9 0.8 195.4
2014 MAR 0.8 246.9 0.6 196.5
JUN 1.0 249.3 0.6 197.6
SEP 1.7 253.6 0.7 198.9
DEC 1.2 256.6 0.2 199.3
2015 MAR 1.2 259.7 0.0 199.3
JUN 0.7 261.5 0.7 200.6
SEP 1.2 264.6 0.7 201.9
DEC 1.5 268.6 0.4 202.7
2016 MAR 1.0 271.3 0.0 202.7
JUN 0.7 273.2 0.46 203.6
SEP 1.3 276.8 0.64 204.9
DEC 0.7 278.7 0.5 205.9
2017 MAR 0.7 280.7 0.3 206.5
JUNE 0.9 283.2 0.5 207.4
SEP 0.9 285.7 0.4 208.2
DEC 0.9 288.3 NA NA

© Copyright 2018. CoreLogic and its licensors are the sole and exclusive owners of all rights, title and interest (including intellectual property rights) the CoreLogic Data contained in this publication.All rights reserved.
CoreLogic Housing Index Prices December 2017 | 22
Year Months National CHIP National CPI
% Chg. Index % Chg. Index2007 MAR -0.05 165.5 -0.3 158.4
JUN 1.1 167.4 1.2 160.3
SEP 1.4 169.7 0.7 161.5
DEC 1.2 171.7 1.0 163.1
2008 MAR 1.0 173.4 1.5 165.6
JUN 1.6 176.3 1.2 167.6
SEP 1.0 178.0 1.3 169.8
DEC 2.0 181.6 -0.3 169.3
2009 MAR 0.8 183.1 0.0 169.3
JUN 0.9 184.7 0.6 170.3
SEP 1.7 187.9 1.1 172.1
DEC 0.6 189.0 0.3 172.7
2010 MAR 0.4 189.8 0.6 173.7
JUN 0.8 191.4 0.7 175.0
SEP 0.7 192.7 0.9 176.6
DEC 0.7 194.0 0.3 177.1
2011 MAR 0.7 195.3 1.6 180.0
JUN 1.6 198.5 1.0 181.8
SEP 0.7 199.8 1.0 183.6
DEC 0.3 200.4 -0.1 183.5
2012 MAR 1.2 202.9 -0.1 183.3
JUN 2.5 208.0 0.3 183.9
SEP 3.1 214.4 2.0 187.6
DEC 0.9 216.5 0.6 188.7
2013 MAR 0.2 216.9 0.0 188.7
JUN 1.2 219.6 0.2 189.1
SEP 0.4 220.4 1.4 191.7
DEC 0.3 221.1 0.7 193.0
2014 MAR 0.3 221.8 0.7 194.3
JUN 0.7 223.3 0.4 195.1
SEP 1.7 227.1 0.4 195.8
DEC 0.6 228.5 0.3 196.4
2015 MAR 1.1 231.0 0.1 196.5
JUN 0.6 232.4 0.5 197.5
SEP 1.1 234.9 0.3 198.0
DEC 1.2 237.7 0.2 198.4
2016 MAR 1.0 240.1 -0.3 197.8
JUN 0.8 242.1 0.47 198.8
SEP 0.7 243.8 0.84 200.4
DEC 0.8 245.7 0.3 201.0
2017 MAR 0.3 246.4 0.4 201.8
JUNE 0.8 248.5 0.1 201.9
SEP 1.4 252.0 1.1 204.1
DEC 1.9 255.0 NA NA
South Australia CHIP & Consumer Price Index (CPI) figures

© Copyright 2018. CoreLogic and its licensors are the sole and exclusive owners of all rights, title and interest (including intellectual property rights) the CoreLogic Data contained in this publication.All rights reserved.
CoreLogic Housing Index Prices December 2017 | 23
Western Australia CHIP & Consumer Price Index (CPI) figures
Year Months National CHIP National CPI
% Chg. Index % Chg. Index2007 MAR 1.1 176.1 0.2 155.8
JUN 0.7 177.3 1.4 158.0
SEP 1.7 180.2 0.6 158.9
DEC 0.5 181.1 0.8 160.2
2008 MAR 1.6 184.0 1.4 162.5
JUN 2.2 188.0 1.6 165.1
SEP 0.5 189.0 1.0 166.7
DEC 1.3 191.5 -0.3 166.2
2009 MAR 0.4 192.3 -0.1 166.0
JUN 0.8 193.8 0.8 167.4
SEP 0.6 194.9 0.8 168.7
DEC 1.3 197.4 0.6 169.7
2010 MAR 0.3 198.0 1.1 171.6
JUN 0.5 198.9 1.2 173.6
SEP 1.2 201.3 0.2 174.0
DEC 1.8 204.9 0.1 174.1
2011 MAR 0.7 206.4 1.1 176.1
JUN 0.8 208.1 1.3 178.4
SEP 0.7 209.5 0.2 178.8
DEC 0.8 211.2 0.2 179.1
2012 MAR 1.2 213.8 0.2 179.5
JUN 2.0 218.1 0.5 180.4
SEP 2.2 222.9 1.7 183.5
DEC 1.0 225.2 0.7 184.7
2013 MAR 0.1 225.5 0.5 185.7
JUN 1.6 229.2 0.6 186.8
SEP 0.7 230.9 1.2 189.0
DEC 0.7 232.5 0.7 190.3
2014 MAR 0.9 234.6 0.7 191.6
JUN 1.5 238.1 0.8 193.0
SEP 1.6 241.9 0.5 193.9
DEC 1.2 244.8 0.1 194.1
2015 MAR 1.4 248.2 0.1 194.3
JUN 0.7 249.9 0.6 195.4
SEP 1.0 252.4 0.4 196.1
DEC 1.5 256.2 0.5 197.1
2016 MAR 1.1 259.0 -0.6 195.8
JUN 1.1 261.9 0.3 196.4
SEP 0.6 263.5 0.4 197.1
DEC 0.5 264.8 0.4 197.8
2017 MAR 0.4 265.8 0.0 197.8
JUNE 0.7 267.8 0.0 197.8
SEP 0.5 269.1 0.5 198.7
DEC 0.9 271.6 NA NA

Toll Free: 1300 952 560Email: [email protected]
This publication reproduces materials and content owned or licenced by RP Data Pty Ltd trading as CoreLogic Asia Pacific (CoreLogic) and may include data, statistics, estimates, indices, photographs, maps, tools, calculators (including their outputs), commentary, reports and other information (CoreLogic Data).
www.corelogic.com.au/cordell


