40
Best of the Best Report 2017

2 | CoreLogic Best of the Best 2017
© Copyright 2018 | RP Data Pty Ltd trading as CoreLogic Asia Pacific (CoreLogic) and its licensors are the sole and exclusive owners of all rights, title and interest (including intellectual property rights) subsisting in this publication including any data, analytics, statistics and other information. All rights reserved.
The best of the bestThe Best of the Best report takes a suburb level deep dive into a variety of measures used by CoreLogic to determine property market performance across the year, ranging from capital growth to rental yields.
National Top Performing Suburbs 2017
Houses Units
Highest Median Value Darling Point, Sydney NSW
$5,682,520 Dawes Point, Sydney NSW
$3,176,621
Lowest Median Value Mount Magnet, Central WA
$68,605 Elizabeth Vale, Adelaide SA
$128,118
Lowest Median Value within 10km of a Capital City
Claredon Vale, Hobart TAS
$158,246 Montrose, Hobart TAS
$211,518
Greatest 12 month Change in Median Values
McMahons Point, Sydney NSW
45.0% Queenscliffe, Barwon VIC
47.0%
Greatest 5 year Change in Median Values
St Leonards, Sydney, NSW
207.0% Thurgoona, Murray NSW
167.2%
Highest Gross Rental Yields Ouyen, Mallee VIC
9.9% Port Douglas, Far North QLD
9.3%
Highest Gross Rental Yields within 10kms of a Capital City
Risdon Vale, Hobart TAS
8.5% Carlton, Melbourne VIC
7.2%
Highest Median Weekly Advertised Rents
Bellevue Hills, Sydney NSW
$1,875 The Rocks, Sydney NSW
$1,050
Lowest Median Weekly Advertised Rents
Barney Point, Fitzroy QLD
$150 South Gladstone, Fitzroy QLD
$120
Highest Total Value of Sales
Mosman, Sydney NSW
$1,178,766,474 Melbourne, Melbourne VIC
$817,683,937

CoreLogic Best of the Best 2017 | 3
© Copyright 2018 | RP Data Pty Ltd trading as CoreLogic Asia Pacific (CoreLogic) and its licensors are the sole and exclusive owners of all rights, title and interest (including intellectual property rights) subsisting in this publication including any data, analytics, statistics and other information. All rights reserved.
In summing up the 2017 housing market, CoreLogic research analyst, Cameron Kusher described it as a market in transition but still quite diverse and where we continued to see dwelling values rise over the 12 months to November 2017. Albeit, with a slowing growth trend throughout the year; towards the end of this year, we saw a levelling out of national dwelling values.
The sharpest transition occurred in Sydney which was previously the strongest housing market over recent years. Sydney dwelling values were -1.3% lower than their August 2017 peak at the end of November. Most other capital cities have also seen their rates of growth slow recently with Perth the exception. Although Perth dwelling values are lower over the year, there has been a subtle transition towards growth in late 2017 with values 0.3% higher over the three months ending November 2017; the strongest rate of quarterly growth since June 2014.
The diversity of the market was most evident in the double-digit values rise over the past 12 months in Hobart (+11.5%) and Melbourne (+10.1%) while values continued to fall over the year in Perth (-2.6%) and Darwin (-5.5%). Although the heat is now clearly coming out of the housing market, Sydney and Adelaide are the only capital cities to see the annual change in dwelling values now lower in November 2017 relative to November 2016.
The transition has been largely driven by significant shifts in the lending environment; credit growth limits for investors were already in place however, origination limits were introduced for interest-only mortgages at the end of March ‘17. As a result of these changed regulatory policies, lenders have begun to charge premiums on the interest rate for investor and interest-only mortgage products. Recall that investors have been the key driver of mortgagedemand in New South Wales and a substantial source of demand in Victoria.
Throughout 2018, we’re expecting to see: ► A further slowdown in national housing market conditions. ► Credit policies likely to remain tight as regulators keep a watchful eye out for a rebound in investment
credit growth or, a reversal in the trend towards fewer mortgages with a loan to valuation ratio of more than 80%.
► Interest rates are likely to remain on hold in 2018. Higher interest rates would stifle household consumption and business investment and could cause financial distress amongst a highly indebted household sector, however rates aren’t likely to fall due to concerns of refueling the controlled slowdown in the housing market.
► National dwelling values will fall further in 2018, driven lower by falls across Sydney and to a lesser extent, Melbourne. After values surged 75% higher over Sydney’s growth cycle and 59% higher across Melbourne, it’s rational to expect some slippage in dwelling values across these cities.
Previous downturns have seen the annual number of sales fall by around 20-25% from peak to trough; considering the cyclical peak in transactional activity occurred over the twelve months ending August 2015, year on year transactional activity is already 13.2%lower than the most recent peak.
While our outlook for 2018 may not be as positive as it was in 2017, there are plenty of factors that will work to keep a floor under housing demand. We’re likely to see regulators and policy makers looking to encourage households with high levels of debt to reduce their exposure while rates remain low. Why?
Because currently, household debt levels are at record highs, a factor which has been called out by the Reserve Bank repeatedly, as well as international institutions such as the OECD, BIS and IMF. With interest rates remaining low, the opportunity for households to pay down debt could come at the expense of broader spending on retail and discretionary items.
Note: The accompanying tables indicate the top performing suburbs nationally and across the capital cities over the 12 months to November 2017. Specifically the analysis looks at:
► Highest median value ► Lowest median value ► Lowest median value within 10km of a capital city ► Highest gross rental yield ► Highest gross rental yield within 10km of a capital
city ► Greatest 12 month change in median values ► Greatest 5 year change in median values ► Highest median weekly advertised rent ► Lowest median weekly advertised rent ► Highest gross value of sales (12 months to September
17).

4 | CoreLogic Best of the Best 2017
© Copyright 2018 | RP Data Pty Ltd trading as CoreLogic Asia Pacific (CoreLogic) and its licensors are the sole and exclusive owners of all rights, title and interest (including intellectual property rights) subsisting in this publication including any data, analytics, statistics and other information. All rights reserved.
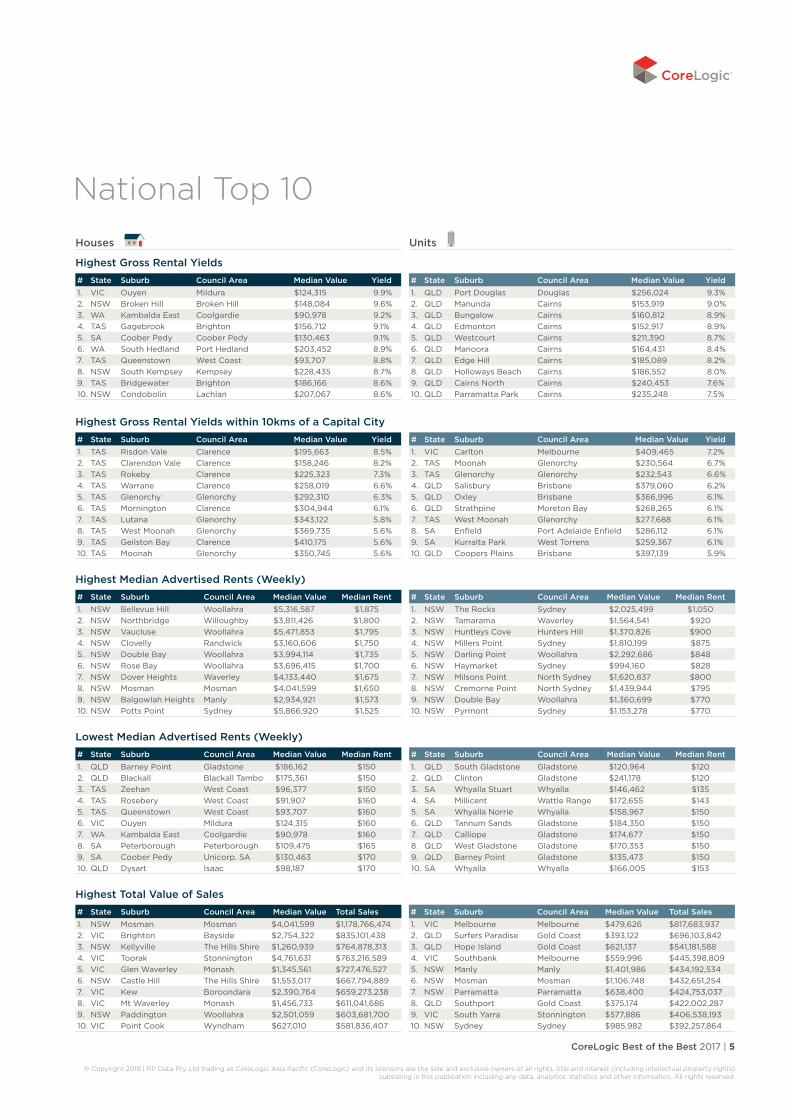
National Top 10
Highest Median Value# State Suburb Council Area # Sold Median value1. NSW Darling Point Woollahra 12 $5,682,5202. NSW Vaucluse Woollahra 86 $5,471,8533. NSW Bellevue Hill Woollahra 68 $5,316,5874. VIC Toorak Stonnington 124 $4,761,6315. NSW Longueville Lane Cove 37 $4,259,6446. NSW Tamarama Waverley 14 $4,254,6667. NSW Dover Heights Waverley 36 $4,133,4408. NSW Mosman Mosman 259 $4,041,5999. NSW Double Bay Woollahra 12 $3,994,11410. NSW McMahons Point North Sydney 20 $3,980,169
Lowest Median Value
Lowest Median Value within 10kms of a Capital City
Greatest 12 month Change# State Suburb Council Area # Sold Median Value Change1. NSW McMahons Point North Sydney 20 $3,980,169 45.0%2. ACT Red Hill ACT 31 $1,725,012 43.8%3. NSW Mossy Point Eurobodalla 16 $636,348 43.7%4. ACT Griffith ACT 38 $1,847,803 41.7%5. VIC North Melbourne Melbourne 53 $1,260,431 41.6%6. VIC Frankston North Frankston 145 $470,013 37.6%7. VIC Ardeer Brimbank 47 $602,128 37.1%8. NSW Berrima Wingecarribee 16 $1,344,638 36.9%9. NSW North Sydney North Sydney 19 $2,545,310 36.5%10. NSW Kemps Creek Penrith 13 $2,604,268 36.4%
Greatest 5 year Change# State Suburb Council Area # Sold Median Value Change1. NSW St Leonards Willoughby 25 $2,359,584 207.0%2. NSW Waverton North Sydney 13 $2,834,942 182.7%3. NSW Llandilo Penrith 13 $2,103,144 170.0%4. NSW McMahons Point North Sydney 20 $3,980,169 169.1%5. NSW Homebush Strathfield 28 $2,255,321 157.2%6. NSW Bringelly Camden 17 $2,407,561 152.1%7. VIC Ashburton Boroondara 96 $2,056,490 145.0%8. NSW Austral Liverpool 54 $2,438,725 143.8%9. NSW Maraylya Hawkesbury 14 $2,171,046 142.6%10. NSW Woolloomooloo Sydney 11 $1,766,122 137.2%
# State Suburb Council Area # Sold Median value1. NSW Dawes Point Sydney 13 $3,176,6212. NSW Barangaroo Sydney 12 $3,119,3293. NSW Point Piper Woollahra 25 $2,989,2164. NSW Darling Point Woollahra 85 $2,292,6865. NSW The Rocks Sydney 30 $2,025,4996. NSW Millers Point Sydney 41 $1,810,1997. NSW Cabarita Canada Bay 15 $1,766,7198. NSW Seaforth Manly 18 $1,672,2139. NSW Palm Beach Pittwater 11 $1,626,91110. NSW Milsons Point North Sydney 42 $1,620,837
# State Suburb Council Area # Sold Median value1. WA Mount Magnet Mount Magnet 12 $68,6052. WA Norseman Dundas 19 $80,3143. WA Kambalda East Coolgardie 15 $90,9784. TAS Rosebery West Coast 40 $91,9075. TAS Queenstown West Coast 73 $93,7076. TAS Zeehan West Coast 18 $96,3777. QLD Dysart Isaac 44 $98,1878. VIC Rupanyup Yarriambiack 11 $99,2999. SA Pinnaroo Southern Mallee 12 $103,92810. VIC Sea Lake Buloke 11 $105,235
# State Suburb Council Area # Sold Median value1. SA Elizabeth Vale Playford 12 $128,1182. QLD Beachmere Moreton Bay 11 $135,9813. WA South Hedland Port Hedland 44 $136,2274. QLD Woree Cairns 54 $142,7805. VIC Moe Latrobe 33 $143,0146. SA Whyalla Stuart Whyalla 37 $146,4627. QLD Kooralbyn Scenic Rim 14 $146,8398. QLD Edmonton Cairns 10 $152,9179. QLD Manunda Cairns 63 $153,91910. NSW North Albury Albury 13 $154,580
# State Suburb Council Area # Sold Median Value Change1. VIC Queenscliff Queenscliffe 10 $661,281 47.0%2. NSW McMahons Point North Sydney 33 $1,255,132 45.6%3. NSW The Rocks Sydney 30 $2,025,499 45.1%4. NSW Birchgrove Leichhardt 17 $1,354,415 37.7%5. NSW Lake Cathie Port Macq-Hastings 14 $392,533 37.0%6. VIC Watsonia Banyule 31 $618,848 36.7%7. VIC Ardeer Brimbank 14 $436,832 34.0%8. VIC Clarinda Kingston 10 $691,979 33.8%9. NSW Crackenback Snowy River 19 $619,732 33.6%10. VIC Fitzroy Yarra 84 $786,872 33.3%
# State Suburb Council Area # Sold Median Value Change1. NSW Thurgoona Albury 12 $279,257 167.2%2. NSW Belrose Warringah 22 $925,768 140.5%3. NSW McMahons Point North Sydney 33 $1,255,132 124.1%4. NSW Ramsgate Rockdale 25 $762,153 120.9%5. NSW Balmain East Leichhardt 19 $1,520,361 120.3%6. WA Floreat Cambridge 20 $818,848 116.1%7. NSW The Rocks Sydney 30 $2,025,499 115.0%8. NSW Bella Vista The Hills Shire 12 $1,193,677 112.5%9. NSW Waverton North Sydney 51 $1,394,350 109.7%10. NSW St Clair Penrith 10 $676,491 109.6%
Houses Units
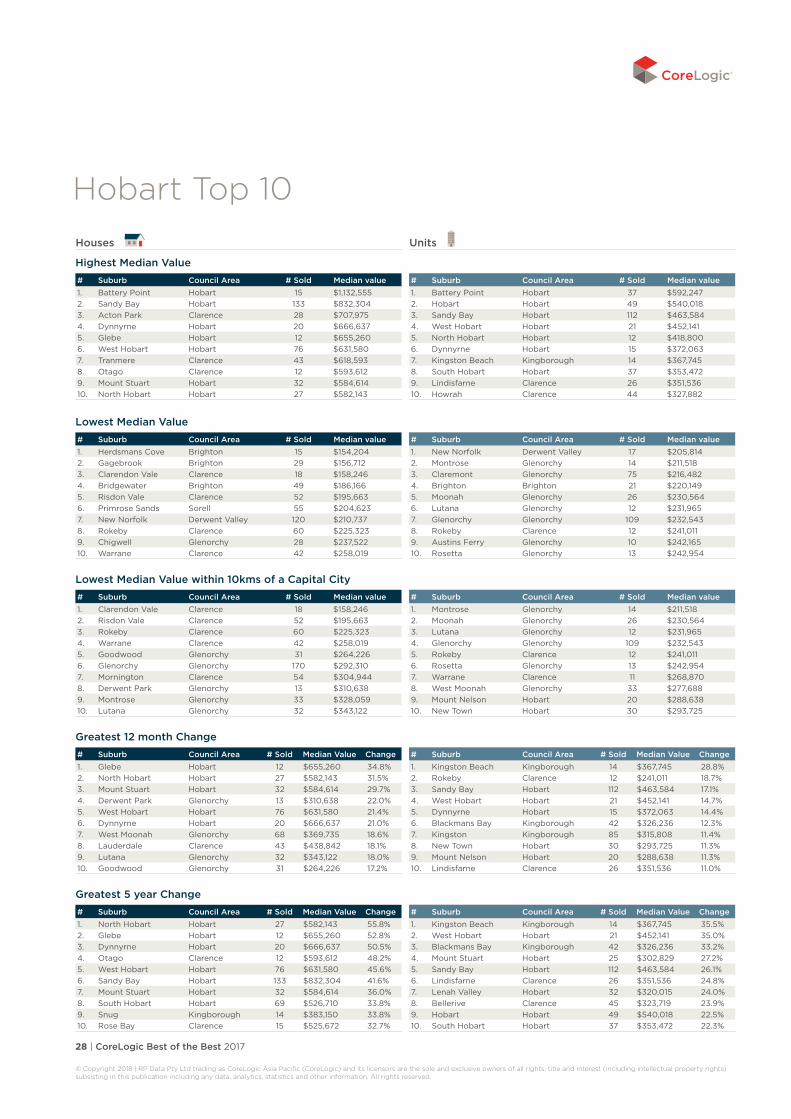
# State Suburb Council Area # Sold Median value1. TAS Clarendon Vale Clarence 18 $158,2462. TAS Risdon Vale Clarence 52 $195,6633. TAS Rokeby Clarence 60 $225,3234. TAS Warrane Clarence 42 $258,0195. TAS Goodwood Glenorchy 31 $264,2266. TAS Glenorchy Glenorchy 170 $292,3107. TAS Mornington Clarence 54 $304,9448. TAS Derwent Park Glenorchy 13 $310,6389. TAS Montrose Glenorchy 33 $328,05910. TAS Lutana Glenorchy 32 $343,122
# State Suburb Council Area # Sold Median value1. TAS Montrose Glenorchy 14 $211,5182. TAS Moonah Glenorchy 26 $230,5643. TAS Lutana Glenorchy 12 $231,9654. TAS Glenorchy Glenorchy 109 $232,5435. SA Greenacres Port Adelaide Enfield 12 $238,6586. TAS Rokeby Clarence 12 $241,0117. SA Windsor Gardens Port Adelaide Enfield 19 $241,3868. TAS Rosetta Glenorchy 13 $242,9549. SA Mansfield Park Port Adelaide Enfield 18 $243,25810. SA Saint Marys Mitcham 27 $244,008
CoreLogic Best of the Best 2017 | 5
© Copyright 2018 | RP Data Pty Ltd trading as CoreLogic Asia Pacific (CoreLogic) and its licensors are the sole and exclusive owners of all rights, title and interest (including intellectual property rights) subsisting in this publication including any data, analytics, statistics and other information. All rights reserved.
Houses
Highest Gross Rental Yields# State Suburb Council Area Median Value Yield1. VIC Ouyen Mildura $124,315 9.9%2. NSW Broken Hill Broken Hill $148,084 9.6%3. WA Kambalda East Coolgardie $90,978 9.2%4. TAS Gagebrook Brighton $156,712 9.1%5. SA Coober Pedy Coober Pedy $130,463 9.1%6. WA South Hedland Port Hedland $203,452 8.9%7. TAS Queenstown West Coast $93,707 8.8%8. NSW South Kempsey Kempsey $228,435 8.7%9. TAS Bridgewater Brighton $186,166 8.6%10. NSW Condobolin Lachlan $207,067 8.6%
Highest Gross Rental Yields within 10kms of a Capital City
Highest Median Advertised Rents (Weekly)# State Suburb Council Area Median Value Median Rent1. NSW Bellevue Hill Woollahra $5,316,587 $1,8752. NSW Northbridge Willoughby $3,811,426 $1,8003. NSW Vaucluse Woollahra $5,471,853 $1,7954. NSW Clovelly Randwick $3,160,606 $1,7505. NSW Double Bay Woollahra $3,994,114 $1,7356. NSW Rose Bay Woollahra $3,696,415 $1,7007. NSW Dover Heights Waverley $4,133,440 $1,6758. NSW Mosman Mosman $4,041,599 $1,6509. NSW Balgowlah Heights Manly $2,934,921 $1,57310. NSW Potts Point Sydney $5,866,920 $1,525
Lowest Median Advertised Rents (Weekly)
Highest Total Value of Sales# State Suburb Council Area Median Value Total Sales1. NSW Mosman Mosman $4,041,599 $1,178,766,4742. VIC Brighton Bayside $2,754,322 $835,101,4383. NSW Kellyville The Hills Shire $1,260,939 $764,878,3134. VIC Toorak Stonnington $4,761,631 $763,216,5895. VIC Glen Waverley Monash $1,345,561 $727,476,5276. NSW Castle Hill The Hills Shire $1,553,017 $667,794,8897. VIC Kew Boroondara $2,390,764 $659,273,2388. VIC Mt Waverley Monash $1,456,733 $611,041,6869. NSW Paddington Woollahra $2,501,059 $603,681,70010. VIC Point Cook Wyndham $627,010 $581,836,407
Units
# State Suburb Council Area Median Value Yield1. QLD Port Douglas Douglas $256,024 9.3%2. QLD Manunda Cairns $153,919 9.0%3. QLD Bungalow Cairns $160,812 8.9%4. QLD Edmonton Cairns $152,917 8.9%5. QLD Westcourt Cairns $211,390 8.7%6. QLD Manoora Cairns $164,431 8.4%7. QLD Edge Hill Cairns $185,089 8.2%8. QLD Holloways Beach Cairns $186,552 8.0%9. QLD Cairns North Cairns $240,453 7.6%10. QLD Parramatta Park Cairns $235,248 7.5%
# State Suburb Council Area Median Value Yield1. TAS Risdon Vale Clarence $195,663 8.5%2. TAS Clarendon Vale Clarence $158,246 8.2%3. TAS Rokeby Clarence $225,323 7.3%4. TAS Warrane Clarence $258,019 6.6%5. TAS Glenorchy Glenorchy $292,310 6.3%6. TAS Mornington Clarence $304,944 6.1%7. TAS Lutana Glenorchy $343,122 5.8%8. TAS West Moonah Glenorchy $369,735 5.6%9. TAS Geilston Bay Clarence $410,175 5.6%10. TAS Moonah Glenorchy $350,745 5.6%
# State Suburb Council Area Median Value Yield1. VIC Carlton Melbourne $409,465 7.2%2. TAS Moonah Glenorchy $230,564 6.7%3. TAS Glenorchy Glenorchy $232,543 6.6%4. QLD Salisbury Brisbane $379,060 6.2%5. QLD Oxley Brisbane $366,996 6.1%6. QLD Strathpine Moreton Bay $268,265 6.1%7. TAS West Moonah Glenorchy $277,688 6.1%8. SA Enfield Port Adelaide Enfield $286,112 6.1%9. SA Kurralta Park West Torrens $259,367 6.1%10. QLD Coopers Plains Brisbane $397,139 5.9%
# State Suburb Council Area Median Value Median Rent1. NSW The Rocks Sydney $2,025,499 $1,0502. NSW Tamarama Waverley $1,564,541 $9203. NSW Huntleys Cove Hunters Hill $1,370,826 $9004. NSW Millers Point Sydney $1,810,199 $8755. NSW Darling Point Woollahra $2,292,686 $8486. NSW Haymarket Sydney $994,160 $8287. NSW Milsons Point North Sydney $1,620,837 $8008. NSW Cremorne Point North Sydney $1,439,944 $7959. NSW Double Bay Woollahra $1,360,699 $77010. NSW Pyrmont Sydney $1,153,278 $770
# State Suburb Council Area Median Value Median Rent1. QLD Barney Point Gladstone $186,162 $1502. QLD Blackall Blackall Tambo $175,361 $1503. TAS Zeehan West Coast $96,377 $1504. TAS Rosebery West Coast $91,907 $1605. TAS Queenstown West Coast $93,707 $1606. VIC Ouyen Mildura $124,315 $1607. WA Kambalda East Coolgardie $90,978 $1608. SA Peterborough Peterborough $109,475 $1659. SA Coober Pedy Unicorp. SA $130,463 $17010. QLD Dysart Isaac $98,187 $170
# State Suburb Council Area Median Value Median Rent1. QLD South Gladstone Gladstone $120,964 $1202. QLD Clinton Gladstone $241,178 $1203. SA Whyalla Stuart Whyalla $146,462 $1354. SA Millicent Wattle Range $172,655 $1435. SA Whyalla Norrie Whyalla $158,967 $1506. QLD Tannum Sands Gladstone $184,350 $1507. QLD Calliope Gladstone $174,677 $1508. QLD West Gladstone Gladstone $170,353 $1509. QLD Barney Point Gladstone $135,473 $15010. SA Whyalla Whyalla $166,005 $153
# State Suburb Council Area Median Value Total Sales1. VIC Melbourne Melbourne $479,626 $817,683,9372. QLD Surfers Paradise Gold Coast $393,122 $696,103,8423. QLD Hope Island Gold Coast $621,137 $541,181,5884. VIC Southbank Melbourne $559,996 $445,398,8095. NSW Manly Manly $1,401,986 $434,192,5346. NSW Mosman Mosman $1,106,748 $432,651,2547. NSW Parramatta Parramatta $638,400 $424,753,0378. QLD Southport Gold Coast $375,174 $422,002,2879. VIC South Yarra Stonnington $577,886 $406,538,19310. NSW Sydney Sydney $985,982 $392,257,864
National Top 10

6 | CoreLogic Best of the Best 2017
© Copyright 2018 | RP Data Pty Ltd trading as CoreLogic Asia Pacific (CoreLogic) and its licensors are the sole and exclusive owners of all rights, title and interest (including intellectual property rights) subsisting in this publication including any data, analytics, statistics and other information. All rights reserved.
CoreLogic Best of the Best 2017 | 7
© Copyright 2018 | RP Data Pty Ltd trading as CoreLogic Asia Pacific (CoreLogic) and its licensors are the sole and exclusive owners of all rights, title and interest (including intellectual property rights) subsisting in this publication including any data, analytics, statistics and other information. All rights reserved.
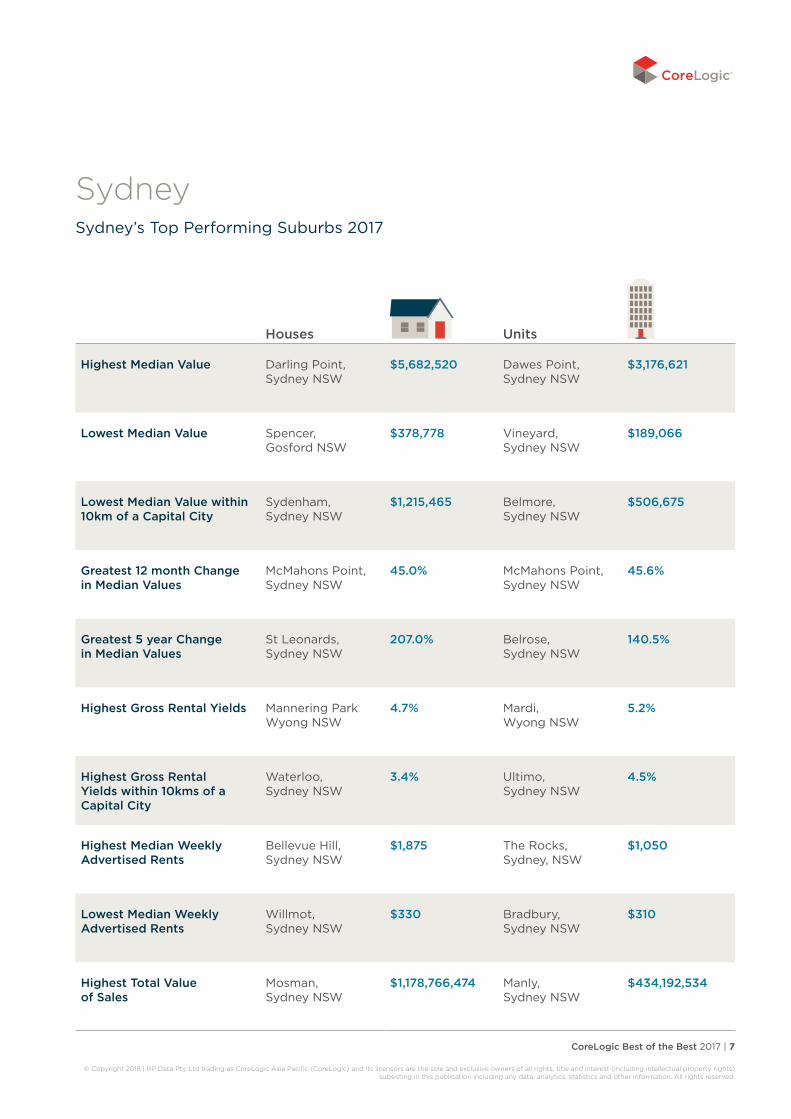
SydneySydney’s Top Performing Suburbs 2017
Houses Units
Highest Median Value Darling Point, Sydney NSW
$5,682,520 Dawes Point, Sydney NSW
$3,176,621
Lowest Median Value Spencer, Gosford NSW
$378,778 Vineyard, Sydney NSW
$189,066
Lowest Median Value within 10km of a Capital City
Sydenham,Sydney NSW
$1,215,465 Belmore,Sydney NSW
$506,675
Greatest 12 month Change in Median Values
McMahons Point, Sydney NSW
45.0% McMahons Point, Sydney NSW
45.6%
Greatest 5 year Change in Median Values
St Leonards, Sydney NSW
207.0% Belrose,Sydney NSW
140.5%
Highest Gross Rental Yields Mannering Park Wyong NSW
4.7% Mardi, Wyong NSW
5.2%
Highest Gross Rental Yields within 10kms of a Capital City
Waterloo, Sydney NSW
3.4% Ultimo, Sydney NSW
4.5%
Highest Median Weekly Advertised Rents
Bellevue Hill, Sydney NSW
$1,875 The Rocks, Sydney, NSW
$1,050
Lowest Median Weekly Advertised Rents
Willmot,Sydney NSW
$330 Bradbury, Sydney NSW
$310
Highest Total Value of Sales
Mosman, Sydney NSW
$1,178,766,474 Manly, Sydney NSW
$434,192,534

8 | CoreLogic Best of the Best 2017
© Copyright 2018 | RP Data Pty Ltd trading as CoreLogic Asia Pacific (CoreLogic) and its licensors are the sole and exclusive owners of all rights, title and interest (including intellectual property rights) subsisting in this publication including any data, analytics, statistics and other information. All rights reserved.
Sydney Top 10
Highest Median Value# Suburb Council Area # Sold Median value1. Darling Point Woollahra 12 $5,682,5202. Vaucluse Woollahra 86 $5,471,8533. Bellevue Hill Woollahra 68 $5,316,5874. Longueville Lane Cove 37 $4,259,6445. Tamarama Waverley 14 $4,254,6666. Dover Heights Waverley 36 $4,133,4407. Mosman Mosman 259 $4,041,5998. Double Bay Woollahra 12 $3,994,1149. Mcmahons Point North Sydney 20 $3,980,16910. Whale Beach Pittwater 19 $3,892,364
Lowest Median Value
Lowest Median Value within 10kms of a Capital City
Greatest 12 month Change# Suburb Council Area # Sold Median Value Change1. McMahons Point North Sydney 20 $3,980,169 45.0%2. North Sydney North Sydney 19 $2,545,310 36.5%3. Kemps Creek Penrith 13 $2,604,268 36.4%4. Cammeray North Sydney 40 $2,700,607 35.3%5. Bringelly Camden 17 $2,407,561 34.6%6. St Leonards Willoughby 25 $2,359,584 34.5%7. Rockdale Rockdale 48 $1,330,593 29.7%8. Llandilo Penrith 13 $2,103,144 29.1%9. Maraylya Hawkesbury 14 $2,171,046 29.1%10. Kurmond Hawkesbury 12 $1,095,046 28.7%
Greatest 5 year Change# Suburb Council Area # Sold Median Value Change1. St Leonards Willoughby 25 $2,359,584 207.0%2. Waverton North Sydney 13 $2,834,942 182.7%3. Llandilo Penrith 13 $2,103,144 170.0%4. McMahons Point North Sydney 20 $3,980,169 169.1%5. Homebush Strathfield 28 $2,255,321 157.2%6. Bringelly Camden 17 $2,407,561 152.1%7. Austral Liverpool 54 $2,438,725 143.8%8. Maraylya Hawkesbury 14 $2,171,046 142.6%9. Woolloomooloo Sydney 11 $1,766,122 137.2%10. Oakville Hawkesbury 11 $2,375,001 134.6%
# Suburb Council Area # Sold Median value1. Dawes Point Sydney 13 $3,176,6212. Barangaroo Sydney 12 $3,119,3293. Point Piper Woollahra 25 $2,989,2164. Darling Point Woollahra 85 $2,292,6865. The Rocks Sydney 30 $2,025,4996. Millers Point Sydney 41 $1,810,1997. Cabarita Canada Bay 15 $1,766,7198. Seaforth Manly 18 $1,672,2139. Palm Beach Pittwater 11 $1,626,91110. Milsons Point North Sydney 42 $1,620,837
# Suburb Council Area # Sold Median value1. Spencer Gosford 13 $378,7782. San Remo Wyong 124 $454,9463. Doyalson Wyong 11 $466,1834. Charmhaven Wyong 66 $471,1675. Gorokan Wyong 182 $481,9636. Mannering Park Wyong 68 $488,1177. Willmot Blacktown 34 $491,1768. Halekulani Wyong 53 $491,2819. Budgewoi Wyong 88 $491,72010. Watanobbi Wyong 79 $494,208
# Suburb Council Area # Sold Median value1. Vineyard Hawkesbury 13 $189,0662. Wyong Wyong 28 $329,7523. Berkeley Vale Wyong 29 $362,9784. Gorokan Wyong 44 $372,0835. Katoomba Blue Mountains 22 $374,1586. Toukley Wyong 31 $392,3937. Carramar Fairfield 33 $395,4838. Ambarvale Campbelltown 14 $399,8009. Tahmoor Wollondilly 15 $402,32110. Picton Wollondilly 20 $409,190
# Suburb Council Area # Sold Median Value Change1. McMahons Point North Sydney 33 $1,255,132 45.6%2. The Rocks Sydney 30 $2,025,499 45.1%3. Birchgrove Leichhardt 17 $1,354,415 37.7%4. Beecroft Hornsby 33 $1,026,091 31.7%5. North Sydney North Sydney 228 $1,128,653 31.4%6. Woollahra Woollahra 61 $1,204,931 25.4%7. Booker Bay Gosford 30 $617,604 25.2%8. Kurraba Point North Sydney 44 $1,320,886 24.8%9. Avoca Beach Gosford 31 $891,402 24.4%10. Seaforth Manly 18 $1,672,213 24.0%
# Suburb Council Area # Sold Median Value Change1. Belrose Warringah 22 $925,768 140.5%2. McMahons Point North Sydney 33 $1,255,132 124.1%3. Ramsgate Rockdale 25 $762,153 120.9%4. Balmain East Leichhardt 19 $1,520,361 120.3%5. The Rocks Sydney 30 $2,025,499 115.0%6. Bella Vista The Hills Shire 12 $1,193,677 112.5%7. Waverton North Sydney 51 $1,394,350 109.7%8. St Clair Penrith 10 $676,491 109.6%9. Waverley Waverley 44 $1,065,914 105.9%10. Dural Hornsby 34 $791,172 105.9%
Houses Units
# Suburb Council Area # Sold Median value1. Sydenham Marrickville 22 $1,215,4652. Tempe Marrickville 56 $1,230,5023. Arncliffe Rockdale 46 $1,237,8194. Turrella Rockdale 15 $1,257,4905. Waterloo Sydney 15 $1,312,2896. St Peters Marrickville 30 $1,325,6967. Erskineville Sydney 53 $1,408,3078. Newtown Sydney 164 $1,424,8119. Bardwell Park Rockdale 24 $1,449,23010. Enmore Marrickville 50 $1,464,922
# Suburb Council Area # Sold Median value1. Belmore Canterbury 105 $506,6752. Campsie Canterbury 339 $608,3943. Ropes Crossing Blacktown 24 $641,5054. Croydon Park Canterbury 65 $649,6635. Eastlakes Botany Bay 61 $650,5006. Hillsdale Botany Bay 148 $664,4567. Rockdale Rockdale 157 $673,5838. Homebush Strathfield 147 $682,5719. Enmore Marrickville 16 $695,32510. Enfield Burwood 21 $709,747

CoreLogic Best of the Best 2017 | 9
© Copyright 2018 | RP Data Pty Ltd trading as CoreLogic Asia Pacific (CoreLogic) and its licensors are the sole and exclusive owners of all rights, title and interest (including intellectual property rights) subsisting in this publication including any data, analytics, statistics and other information. All rights reserved.
Houses
Highest Gross Rental Yields# Suburb Council Area Median Value Yield1. Mannering Park Wyong $488,117 4.7%2. San Remo Wyong $454,946 4.5%3. Blue Haven Wyong $509,271 4.5%4. Lake Munmorah Wyong $513,481 4.5%5. Watanobbi Wyong $494,208 4.5%6. Gwandalan Wyong $516,712 4.5%7. Summerland Point Wyong $538,090 4.5%8. Wyongah Wyong $509,589 4.4%9. Wadalba Wyong $619,037 4.4%10. Kanwal Wyong $510,531 4.4%
Highest Gross Rental Yields within 10kms of a Capital City
Highest Median Advertised Rents (Weekly)# Suburb Council Area Median Value Median Rent1. Bellevue Hill Woollahra $5,316,587 $1,8752. Northbridge Willoughby $3,811,426 $1,8003. Vaucluse Woollahra $5,471,853 $1,7954. Clovelly Randwick $3,160,606 $1,7505. Double Bay Woollahra $3,994,114 $1,7356. Rose Bay Woollahra $3,696,415 $1,7007. Dover Heights Waverley $4,133,440 $1,6758. Mosman Mosman $4,041,599 $1,6509. Balgowlah Heights Manly $2,934,921 $1,57310. Potts Point Sydney $5,866,920 $1,525
Lowest Median Advertised Rents (Weekly)
Highest Total Value of Sales# Suburb Council Area Median Value Total Sales1. Mosman Mosman $4,041,599 $1,178,766,4742. Kellyville The Hills Shire $1,260,939 $764,878,3133. Castle Hill The Hills Shire $1,553,017 $667,794,8894. Paddington Woollahra $2,501,059 $603,681,7005. St Ives Ku-ring-gai $2,082,119 $498,701,6386. Wahroonga Ku-ring-gai $1,911,894 $463,687,1287. Baulkham Hills The Hills Shire $1,199,992 $429,284,2768. Vaucluse Woollahra $5,471,853 $426,674,8889. Bellevue Hill Woollahra $5,316,587 $386,831,84810. Turramurra Ku-ring-gai $2,094,702 $385,089,838
Units
# Suburb Council Area Median Value Yield1. Mardi Wyong $416,564 5.2%2. Wyong Wyong $329,752 5.2%3. Katoomba Blue Mountains $374,158 4.9%4. Bateau Bay Wyong $448,504 4.9%5. The Entrance North Wyong $521,890 4.8%6. Narara Gosford $453,136 4.8%7. Gorokan Wyong $372,083 4.8%8. Fairfield Fairfield $448,888 4.8%9. Ourimbah Wyong $438,167 4.7%10. Picton Wollondilly $409,190 4.7%
# Suburb Council Area Median Value Yield1. Waterloo Sydney $1,312,289 3.4%2. Sydenham Marrickville $1,215,465 3.3%3. St Peters Marrickville $1,325,696 3.2%4. North Balgowlah Warringah $2,074,038 3.2%5. Chippendale Sydney $1,646,065 3.2%6. Woolloomooloo Sydney $1,766,122 3.2%7. Enmore Marrickville $1,464,922 3.1%8. Newtown Sydney $1,424,811 3.1%9. Alexandria Sydney $1,535,383 3.1%10. Birchgrove Leichhardt $2,318,967 3.1%
# Suburb Council Area Median Value Yield1. Ultimo Sydney $762,853 4.5%2. Chippendale Sydney $822,079 4.5%3. Wolli Creek Rockdale $780,897 4.4%4. Darlington Sydney $875,889 4.4%5. Arncliffe Rockdale $752,885 4.3%6. Erskineville Sydney $901,155 4.3%7. Turrella Rockdale $746,195 4.3%8. Newtown Sydney $715,276 4.3%9. Waterloo Sydney $930,124 4.3%10. Enmore Marrickville $695,325 4.3%
# Suburb Council Area Median Value Median Rent1. The Rocks Sydney $2,025,499 $1,0502. Tamarama Waverley $1,564,541 $9203. Huntleys Cove Hunters Hill $1,370,826 $9004. Millers Point Sydney $1,810,199 $8755. Darling Point Woollahra $2,292,686 $8486. Haymarket Sydney $994,160 $8287. Milsons Point North Sydney $1,620,837 $8008. Cremorne Point North Sydney $1,439,944 $7959. Double Bay Woollahra $1,360,699 $77010. Pyrmont Sydney $1,153,278 $770
# Suburb Council Area Median Value Median Rent1. Willmot Blacktown $491,176 $3302. Bidwill Blacktown $544,294 $3453. Blackett Blacktown $524,390 $3504. Lethbridge Park Blacktown $518,833 $3505. Tregear Blacktown $515,852 $3506. Tuggerawong Wyong $560,311 $3557. Canton Beach Wyong $520,833 $3558. Emerton Blacktown $530,150 $3609. Budgewoi Wyong $491,720 $36310. Hebersham Blacktown $562,747 $370
# Suburb Council Area Median Value Median Rent1. Bradbury Campbelltown $421,710 $3102. Carramar Fairfield $395,483 $3203. Wyong Wyong $329,752 $3304. Toukley Wyong $392,393 $3305. Gorokan Wyong $372,083 $3306. Ambarvale Campbelltown $399,800 $3307. Cabramatta Fairfield $444,988 $3408. Mount Druitt Blacktown $421,649 $3509. Canley Vale Fairfield $434,088 $35010. Katoomba Blue Mountains $374,158 $350
# Suburb Council Area Median Value Total Sales1. Manly Manly $1,401,986 $434,192,5342. Mosman Mosman $1,106,748 $432,651,2543. Parramatta Parramatta $638,400 $424,753,0374. Sydney Sydney $985,982 $392,257,8645. Chatswood Willoughby $1,074,604 $356,956,4956. Wentworth Point Auburn $713,904 $355,801,2177. Pyrmont Sydney $1,153,278 $353,799,7988. Cronulla Sutherland Shire $833,836 $348,113,3589. Dee Why Warringah $808,709 $340,179,80010. Mascot Rockdale $901,235 $336,158,450
Sydney Top 10

10 | CoreLogic Best of the Best 2017
© Copyright 2018 | RP Data Pty Ltd trading as CoreLogic Asia Pacific (CoreLogic) and its licensors are the sole and exclusive owners of all rights, title and interest (including intellectual property rights) subsisting in this publication including any data, analytics, statistics and other information. All rights reserved.

CoreLogic Best of the Best 2017 | 11
© Copyright 2018 | RP Data Pty Ltd trading as CoreLogic Asia Pacific (CoreLogic) and its licensors are the sole and exclusive owners of all rights, title and interest (including intellectual property rights) subsisting in this publication including any data, analytics, statistics and other information. All rights reserved.
MelbourneMelbourne’s Top Performing Suburbs 2017
Houses Units
Highest Median Value Toorak, Melbourne VIC
$4,761,631 Albert Park, Melbourne VIC
$1,201,084
Lowest Median Value Millgrove,Melbourne VIC
$333,563 Albion,Melbourne VIC
$252,934
Lowest Median Value within 10km of a Capital City
Maidstone,Melbourne VIC
$809,830 Travancore,Melbourne VIC
$381,962
Greatest 12 month Change in Median Values
North Melbourne, Melbourne VIC
41.6% Watsonia, Melbourne VIC
36.7%
Greatest 5 year Change in Median Values
Ashburton,Melbourne VIC
145.0% South Kingsville, Melbourne VIC
97.9%
Highest Gross Rental Yields Millgrove, Melbourne VIC
5.0% Carlton, Melbourne VIC
7.2%
Highest Gross Rental Yields within 10kms of a Capital City
St Kilda, Melbourne VIC
4.1% Carlton, Melbourne VIC
7.2%
Highest Median Weekly Advertised Rents
Toorak, Melbourne VIC
$1,400 Docklands, Melbourne VIC
$575
Lowest Median Weekly Advertised Rents
Millgrove, Melbourne VIC
$300 Albion, Melbourne VIC
$250
Highest Total Value of Sales
Brighton, Melbourne VIC
$835,101,438 Melbourne, Melbourne VIC
$817,683,937
12 | CoreLogic Best of the Best 2017
© Copyright 2018 | RP Data Pty Ltd trading as CoreLogic Asia Pacific (CoreLogic) and its licensors are the sole and exclusive owners of all rights, title and interest (including intellectual property rights) subsisting in this publication including any data, analytics, statistics and other information. All rights reserved.
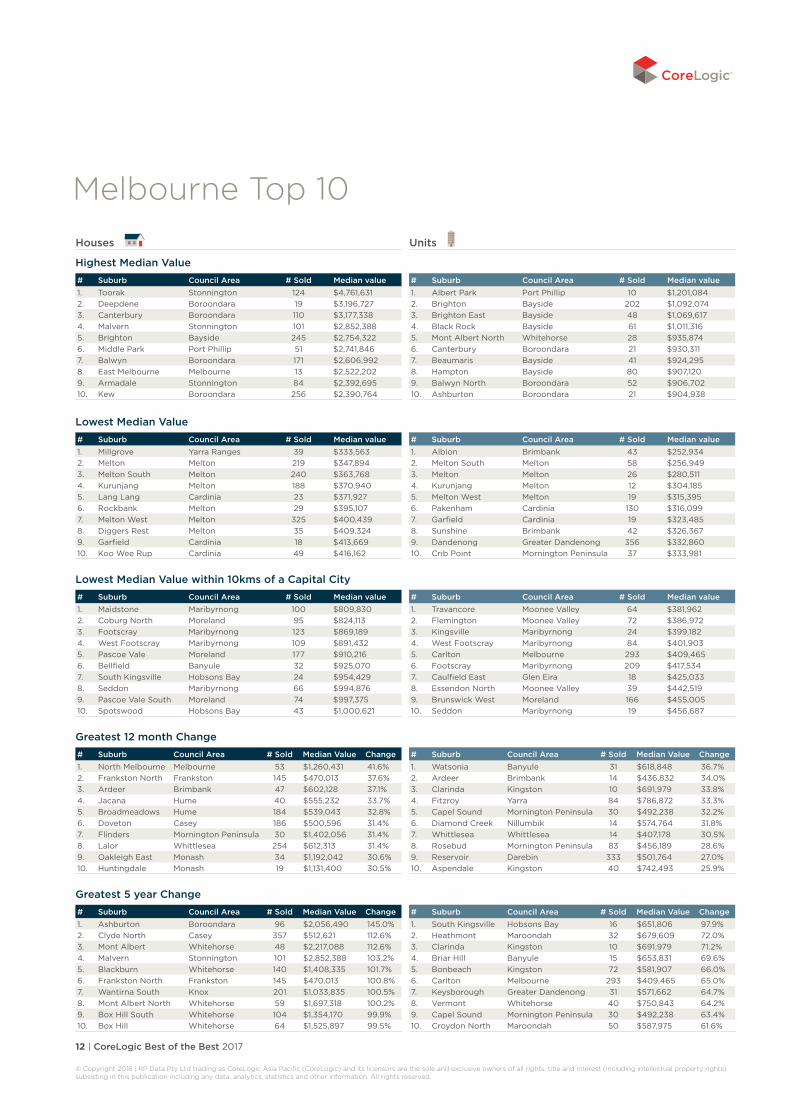
Melbourne Top 10
Highest Median Value# Suburb Council Area # Sold Median value1. Toorak Stonnington 124 $4,761,6312. Deepdene Boroondara 19 $3,196,7273. Canterbury Boroondara 110 $3,177,3384. Malvern Stonnington 101 $2,852,3885. Brighton Bayside 245 $2,754,3226. Middle Park Port Phillip 51 $2,741,8467. Balwyn Boroondara 171 $2,606,9928. East Melbourne Melbourne 13 $2,522,2029. Armadale Stonnington 84 $2,392,69510. Kew Boroondara 256 $2,390,764
Lowest Median Value
Lowest Median Value within 10kms of a Capital City
Greatest 12 month Change# Suburb Council Area # Sold Median Value Change1. North Melbourne Melbourne 53 $1,260,431 41.6%2. Frankston North Frankston 145 $470,013 37.6%3. Ardeer Brimbank 47 $602,128 37.1%4. Jacana Hume 40 $555,232 33.7%5. Broadmeadows Hume 184 $539,043 32.8%6. Doveton Casey 186 $500,596 31.4%7. Flinders Mornington Peninsula 30 $1,402,056 31.4%8. Lalor Whittlesea 254 $612,313 31.4%9. Oakleigh East Monash 34 $1,192,042 30.6%10. Huntingdale Monash 19 $1,131,400 30.5%
Greatest 5 year Change# Suburb Council Area # Sold Median Value Change1. Ashburton Boroondara 96 $2,056,490 145.0%2. Clyde North Casey 357 $512,621 112.6%3. Mont Albert Whitehorse 48 $2,217,088 112.6%4. Malvern Stonnington 101 $2,852,388 103.2%5. Blackburn Whitehorse 140 $1,408,335 101.7%6. Frankston North Frankston 145 $470,013 100.8%7. Wantirna South Knox 201 $1,033,835 100.5%8. Mont Albert North Whitehorse 59 $1,697,318 100.2%9. Box Hill South Whitehorse 104 $1,354,170 99.9%10. Box Hill Whitehorse 64 $1,525,897 99.5%
# Suburb Council Area # Sold Median value1. Albert Park Port Phillip 10 $1,201,0842. Brighton Bayside 202 $1,092,0743. Brighton East Bayside 48 $1,069,6174. Black Rock Bayside 61 $1,011,3165. Mont Albert North Whitehorse 28 $935,8746. Canterbury Boroondara 21 $930,3117. Beaumaris Bayside 41 $924,2958. Hampton Bayside 80 $907,1209. Balwyn North Boroondara 52 $906,70210. Ashburton Boroondara 21 $904,938
# Suburb Council Area # Sold Median value1. Millgrove Yarra Ranges 39 $333,5632. Melton Melton 219 $347,8943. Melton South Melton 240 $363,7684. Kurunjang Melton 188 $370,9405. Lang Lang Cardinia 23 $371,9276. Rockbank Melton 29 $395,1077. Melton West Melton 325 $400,4398. Diggers Rest Melton 35 $409,3249. Garfield Cardinia 18 $413,66910. Koo Wee Rup Cardinia 49 $416,162
# Suburb Council Area # Sold Median value1. Albion Brimbank 43 $252,9342. Melton South Melton 58 $256,9493. Melton Melton 26 $280,5114. Kurunjang Melton 12 $304,1855. Melton West Melton 19 $315,3956. Pakenham Cardinia 130 $316,0997. Garfield Cardinia 19 $323,4858. Sunshine Brimbank 42 $326,3679. Dandenong Greater Dandenong 356 $332,86010. Crib Point Mornington Peninsula 37 $333,981
# Suburb Council Area # Sold Median Value Change1. Watsonia Banyule 31 $618,848 36.7%2. Ardeer Brimbank 14 $436,832 34.0%3. Clarinda Kingston 10 $691,979 33.8%4. Fitzroy Yarra 84 $786,872 33.3%5. Capel Sound Mornington Peninsula 30 $492,238 32.2%6. Diamond Creek Nillumbik 14 $574,764 31.8%7. Whittlesea Whittlesea 14 $407,178 30.5%8. Rosebud Mornington Peninsula 83 $456,189 28.6%9. Reservoir Darebin 333 $501,764 27.0%10. Aspendale Kingston 40 $742,493 25.9%
# Suburb Council Area # Sold Median Value Change1. South Kingsville Hobsons Bay 16 $651,806 97.9%2. Heathmont Maroondah 32 $679,609 72.0%3. Clarinda Kingston 10 $691,979 71.2%4. Briar Hill Banyule 15 $653,831 69.6%5. Bonbeach Kingston 72 $581,907 66.0%6. Carlton Melbourne 293 $409,465 65.0%7. Keysborough Greater Dandenong 31 $571,662 64.7%8. Vermont Whitehorse 40 $750,843 64.2%9. Capel Sound Mornington Peninsula 30 $492,238 63.4%10. Croydon North Maroondah 50 $587,975 61.6%
Houses Units
# Suburb Council Area # Sold Median value1. Maidstone Maribyrnong 100 $809,8302. Coburg North Moreland 95 $824,1133. Footscray Maribyrnong 123 $869,1894. West Footscray Maribyrnong 109 $891,4325. Pascoe Vale Moreland 177 $910,2166. Bellfield Banyule 32 $925,0707. South Kingsville Hobsons Bay 24 $954,4298. Seddon Maribyrnong 66 $994,8769. Pascoe Vale South Moreland 74 $997,37510. Spotswood Hobsons Bay 43 $1,000,621
# Suburb Council Area # Sold Median value1. Travancore Moonee Valley 64 $381,9622. Flemington Moonee Valley 72 $386,9723. Kingsville Maribyrnong 24 $399,1824. West Footscray Maribyrnong 84 $401,9035. Carlton Melbourne 293 $409,4656. Footscray Maribyrnong 209 $417,5347. Caulfield East Glen Eira 18 $425,0338. Essendon North Moonee Valley 39 $442,5199. Brunswick West Moreland 166 $455,00510. Seddon Maribyrnong 19 $456,687
CoreLogic Best of the Best 2017 | 13
© Copyright 2018 | RP Data Pty Ltd trading as CoreLogic Asia Pacific (CoreLogic) and its licensors are the sole and exclusive owners of all rights, title and interest (including intellectual property rights) subsisting in this publication including any data, analytics, statistics and other information. All rights reserved.
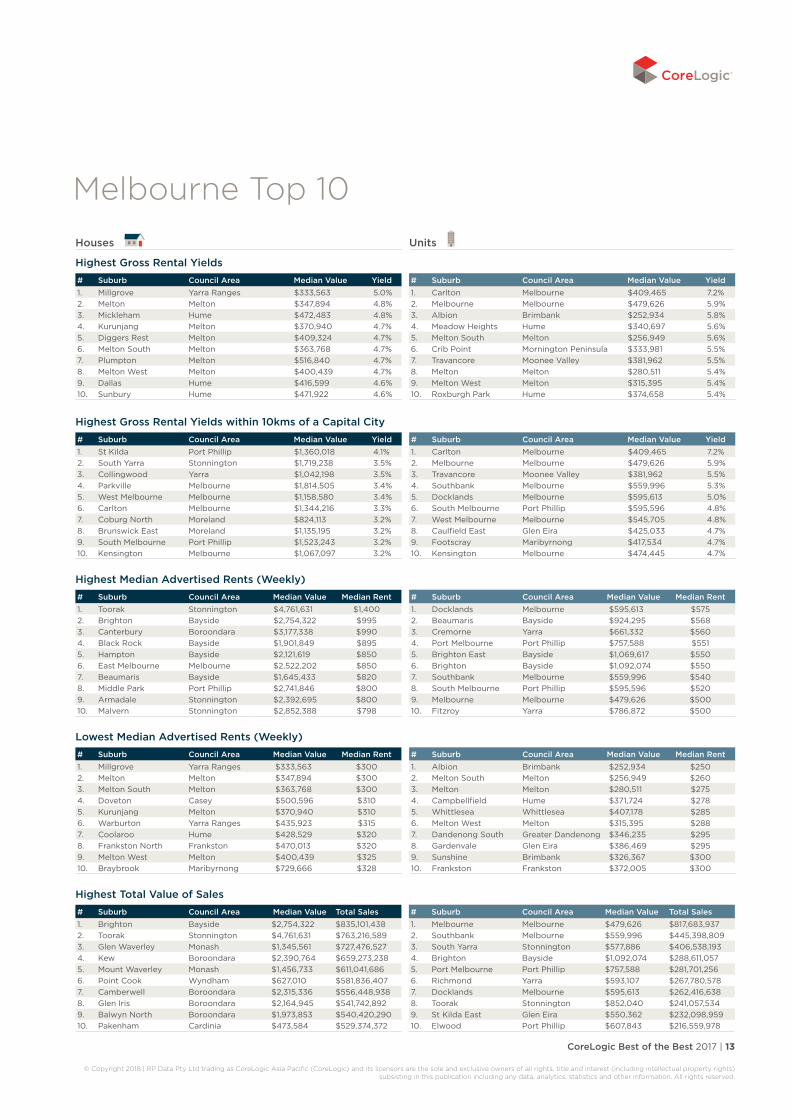
Houses
Highest Gross Rental Yields# Suburb Council Area Median Value Yield1. Millgrove Yarra Ranges $333,563 5.0%2. Melton Melton $347,894 4.8%3. Mickleham Hume $472,483 4.8%4. Kurunjang Melton $370,940 4.7%5. Diggers Rest Melton $409,324 4.7%6. Melton South Melton $363,768 4.7%7. Plumpton Melton $516,840 4.7%8. Melton West Melton $400,439 4.7%9. Dallas Hume $416,599 4.6%10. Sunbury Hume $471,922 4.6%
Highest Gross Rental Yields within 10kms of a Capital City
Highest Median Advertised Rents (Weekly)# Suburb Council Area Median Value Median Rent1. Toorak Stonnington $4,761,631 $1,4002. Brighton Bayside $2,754,322 $9953. Canterbury Boroondara $3,177,338 $9904. Black Rock Bayside $1,901,849 $8955. Hampton Bayside $2,121,619 $8506. East Melbourne Melbourne $2,522,202 $8507. Beaumaris Bayside $1,645,433 $8208. Middle Park Port Phillip $2,741,846 $8009. Armadale Stonnington $2,392,695 $80010. Malvern Stonnington $2,852,388 $798
Lowest Median Advertised Rents (Weekly)
Highest Total Value of Sales# Suburb Council Area Median Value Total Sales1. Brighton Bayside $2,754,322 $835,101,4382. Toorak Stonnington $4,761,631 $763,216,5893. Glen Waverley Monash $1,345,561 $727,476,5274. Kew Boroondara $2,390,764 $659,273,2385. Mount Waverley Monash $1,456,733 $611,041,6866. Point Cook Wyndham $627,010 $581,836,4077. Camberwell Boroondara $2,315,336 $556,448,9388. Glen Iris Boroondara $2,164,945 $541,742,8929. Balwyn North Boroondara $1,973,853 $540,420,29010. Pakenham Cardinia $473,584 $529,374,372
Units
# Suburb Council Area Median Value Yield1. Carlton Melbourne $409,465 7.2%2. Melbourne Melbourne $479,626 5.9%3. Albion Brimbank $252,934 5.8%4. Meadow Heights Hume $340,697 5.6%5. Melton South Melton $256,949 5.6%6. Crib Point Mornington Peninsula $333,981 5.5%7. Travancore Moonee Valley $381,962 5.5%8. Melton Melton $280,511 5.4%9. Melton West Melton $315,395 5.4%10. Roxburgh Park Hume $374,658 5.4%
# Suburb Council Area Median Value Yield1. St Kilda Port Phillip $1,360,018 4.1%2. South Yarra Stonnington $1,719,238 3.5%3. Collingwood Yarra $1,042,198 3.5%4. Parkville Melbourne $1,814,505 3.4%5. West Melbourne Melbourne $1,158,580 3.4%6. Carlton Melbourne $1,344,216 3.3%7. Coburg North Moreland $824,113 3.2%8. Brunswick East Moreland $1,135,195 3.2%9. South Melbourne Port Phillip $1,523,243 3.2%10. Kensington Melbourne $1,067,097 3.2%
# Suburb Council Area Median Value Yield1. Carlton Melbourne $409,465 7.2%2. Melbourne Melbourne $479,626 5.9%3. Travancore Moonee Valley $381,962 5.5%4. Southbank Melbourne $559,996 5.3%5. Docklands Melbourne $595,613 5.0%6. South Melbourne Port Phillip $595,596 4.8%7. West Melbourne Melbourne $545,705 4.8%8. Caulfield East Glen Eira $425,033 4.7%9. Footscray Maribyrnong $417,534 4.7%10. Kensington Melbourne $474,445 4.7%
# Suburb Council Area Median Value Median Rent1. Docklands Melbourne $595,613 $5752. Beaumaris Bayside $924,295 $5683. Cremorne Yarra $661,332 $5604. Port Melbourne Port Phillip $757,588 $5515. Brighton East Bayside $1,069,617 $5506. Brighton Bayside $1,092,074 $5507. Southbank Melbourne $559,996 $5408. South Melbourne Port Phillip $595,596 $5209. Melbourne Melbourne $479,626 $50010. Fitzroy Yarra $786,872 $500
# Suburb Council Area Median Value Median Rent1. Millgrove Yarra Ranges $333,563 $3002. Melton Melton $347,894 $3003. Melton South Melton $363,768 $3004. Doveton Casey $500,596 $3105. Kurunjang Melton $370,940 $3106. Warburton Yarra Ranges $435,923 $3157. Coolaroo Hume $428,529 $3208. Frankston North Frankston $470,013 $3209. Melton West Melton $400,439 $32510. Braybrook Maribyrnong $729,666 $328
# Suburb Council Area Median Value Median Rent1. Albion Brimbank $252,934 $2502. Melton South Melton $256,949 $2603. Melton Melton $280,511 $2754. Campbellfield Hume $371,724 $2785. Whittlesea Whittlesea $407,178 $2856. Melton West Melton $315,395 $2887. Dandenong South Greater Dandenong $346,235 $2958. Gardenvale Glen Eira $386,469 $2959. Sunshine Brimbank $326,367 $30010. Frankston Frankston $372,005 $300
# Suburb Council Area Median Value Total Sales1. Melbourne Melbourne $479,626 $817,683,9372. Southbank Melbourne $559,996 $445,398,8093. South Yarra Stonnington $577,886 $406,538,1934. Brighton Bayside $1,092,074 $288,611,0575. Port Melbourne Port Phillip $757,588 $281,701,2566. Richmond Yarra $593,107 $267,780,5787. Docklands Melbourne $595,613 $262,416,6388. Toorak Stonnington $852,040 $241,057,5349. St Kilda East Glen Eira $550,362 $232,098,95910. Elwood Port Phillip $607,843 $216,559,978
Melbourne Top 10

14 | CoreLogic Best of the Best 2017
© Copyright 2018 | RP Data Pty Ltd trading as CoreLogic Asia Pacific (CoreLogic) and its licensors are the sole and exclusive owners of all rights, title and interest (including intellectual property rights) subsisting in this publication including any data, analytics, statistics and other information. All rights reserved.

CoreLogic Best of the Best 2017 | 15
© Copyright 2018 | RP Data Pty Ltd trading as CoreLogic Asia Pacific (CoreLogic) and its licensors are the sole and exclusive owners of all rights, title and interest (including intellectual property rights) subsisting in this publication including any data, analytics, statistics and other information. All rights reserved.
BrisbaneBrisbane’s Top Performing Suburbs 2017
Houses Units
Highest Median Value Teneriffe, Brisbane QLD
$1,705,513 Tennyson, Brisbane QLD
$1,095,945
Lowest Median Value Russell Island,Moreton Bay QLD
$227,434 Beachmere, Moreton Bay QLD
$135,981
Lowest Median Value within 10km of a Capital City
Rocklea, Brisbane QLD
$411,416 Boronia Heights, Brisbane QLD
$259,099
Greatest 12 month Change in Median Values
Yeronga, Brisbane QLD
25.4% Ormiston, Brisbane QLD
15.7%
Greatest 5 year Change in Median Values
Hawthorn, Brisbane QLD
44.3% Bethania, Brisbane QLD
79.2%
Highest Gross Rental Yields Tivoli, Brisbane QLD
6.2% Slacks Creek, Brisbane QLD
7.4%
Highest Gross Rental Yields within 10kms of a Capital City
Rocklea, Brisbane QLD
4.8% Salisbury, Brisbane QLD
6.2%
Highest Median Weekly Advertised Rents
Pullenvale, Brisbane QLD
$850 Tennyson, Brisbane QLD
$763
Lowest Median Weekly Advertised Rents
Russell Island, Moreton Bay QLD
$250 Booval, Ipswich QLD
$260
Highest Total Value of Sales
Camp Hill, Brisbane QLD
$231,322,801 Brisbane City, Brisbane QLD
$273,276,236
16 | CoreLogic Best of the Best 2017
© Copyright 2018 | RP Data Pty Ltd trading as CoreLogic Asia Pacific (CoreLogic) and its licensors are the sole and exclusive owners of all rights, title and interest (including intellectual property rights) subsisting in this publication including any data, analytics, statistics and other information. All rights reserved.
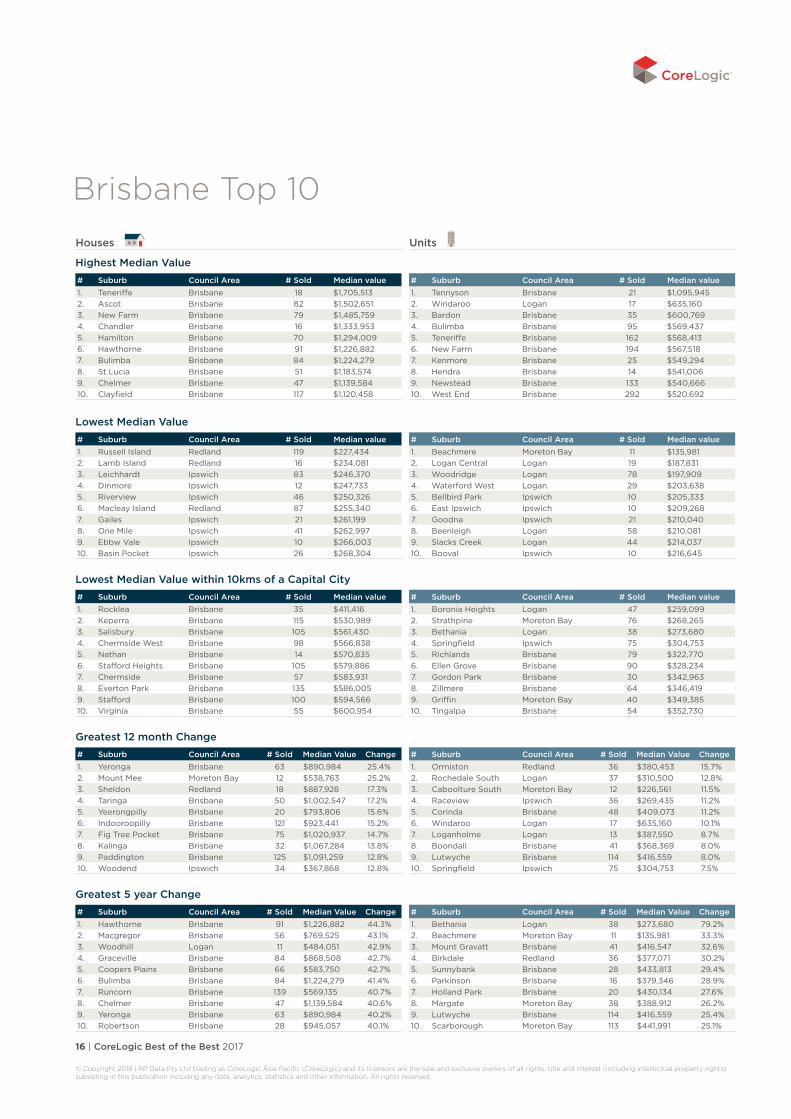
Brisbane Top 10
Highest Median Value# Suburb Council Area # Sold Median value1. Teneriffe Brisbane 18 $1,705,5132. Ascot Brisbane 82 $1,502,6513. New Farm Brisbane 79 $1,485,7594. Chandler Brisbane 16 $1,333,9535. Hamilton Brisbane 70 $1,294,0096. Hawthorne Brisbane 91 $1,226,8827. Bulimba Brisbane 84 $1,224,2798. St Lucia Brisbane 51 $1,183,5749. Chelmer Brisbane 47 $1,139,58410. Clayfield Brisbane 117 $1,120,458
Lowest Median Value
Lowest Median Value within 10kms of a Capital City
Greatest 12 month Change# Suburb Council Area # Sold Median Value Change1. Yeronga Brisbane 63 $890,984 25.4%2. Mount Mee Moreton Bay 12 $538,763 25.2%3. Sheldon Redland 18 $887,928 17.3%4. Taringa Brisbane 50 $1,002,547 17.2%5. Yeerongpilly Brisbane 20 $793,806 15.6%6. Indooroopilly Brisbane 121 $923,441 15.2%7. Fig Tree Pocket Brisbane 75 $1,020,937 14.7%8. Kalinga Brisbane 32 $1,067,284 13.8%9. Paddington Brisbane 125 $1,091,259 12.8%10. Woodend Ipswich 34 $367,868 12.8%
Greatest 5 year Change# Suburb Council Area # Sold Median Value Change1. Hawthorne Brisbane 91 $1,226,882 44.3%2. Macgregor Brisbane 56 $769,525 43.1%3. Woodhill Logan 11 $484,051 42.9%4. Graceville Brisbane 84 $868,508 42.7%5. Coopers Plains Brisbane 66 $583,750 42.7%6. Bulimba Brisbane 84 $1,224,279 41.4%7. Runcorn Brisbane 139 $569,135 40.7%8. Chelmer Brisbane 47 $1,139,584 40.6%9. Yeronga Brisbane 63 $890,984 40.2%10. Robertson Brisbane 28 $945,057 40.1%
# Suburb Council Area # Sold Median value1. Tennyson Brisbane 21 $1,095,9452. Windaroo Logan 17 $635,1603. Bardon Brisbane 35 $600,7694. Bulimba Brisbane 95 $569,4375. Teneriffe Brisbane 162 $568,4136. New Farm Brisbane 194 $567,5187. Kenmore Brisbane 25 $549,2948. Hendra Brisbane 14 $541,0069. Newstead Brisbane 133 $540,66610. West End Brisbane 292 $520,692
# Suburb Council Area # Sold Median value1. Russell Island Redland 119 $227,4342. Lamb Island Redland 16 $234,0813. Leichhardt Ipswich 83 $246,3704. Dinmore Ipswich 12 $247,7335. Riverview Ipswich 46 $250,3266. Macleay Island Redland 87 $255,3407. Gailes Ipswich 21 $261,1998. One Mile Ipswich 41 $262,9979. Ebbw Vale Ipswich 10 $266,00310. Basin Pocket Ipswich 26 $268,304
# Suburb Council Area # Sold Median value1. Beachmere Moreton Bay 11 $135,9812. Logan Central Logan 19 $187,8313. Woodridge Logan 78 $197,9094. Waterford West Logan 29 $203,6385. Bellbird Park Ipswich 10 $205,3336. East Ipswich Ipswich 10 $209,2687. Goodna Ipswich 21 $210,0408. Beenleigh Logan 58 $210,0819. Slacks Creek Logan 44 $214,03710. Booval Ipswich 10 $216,645
# Suburb Council Area # Sold Median Value Change1. Ormiston Redland 36 $380,453 15.7%2. Rochedale South Logan 37 $310,500 12.8%3. Caboolture South Moreton Bay 12 $226,561 11.5%4. Raceview Ipswich 36 $269,435 11.2%5. Corinda Brisbane 48 $409,073 11.2%6. Windaroo Logan 17 $635,160 10.1%7. Loganholme Logan 13 $387,550 8.7%8. Boondall Brisbane 41 $368,369 8.0%9. Lutwyche Brisbane 114 $416,559 8.0%10. Springfield Ipswich 75 $304,753 7.5%
# Suburb Council Area # Sold Median Value Change1. Bethania Logan 38 $273,680 79.2%2. Beachmere Moreton Bay 11 $135,981 33.3%3. Mount Gravatt Brisbane 41 $416,547 32.6%4. Birkdale Redland 36 $377,071 30.2%5. Sunnybank Brisbane 28 $433,813 29.4%6. Parkinson Brisbane 16 $379,346 28.9%7. Holland Park Brisbane 20 $430,134 27.6%8. Margate Moreton Bay 38 $388,912 26.2%9. Lutwyche Brisbane 114 $416,559 25.4%10. Scarborough Moreton Bay 113 $441,991 25.1%
Houses Units
# Suburb Council Area # Sold Median value1. Rocklea Brisbane 35 $411,4162. Keperra Brisbane 115 $530,9893. Salisbury Brisbane 105 $561,4304. Chermside West Brisbane 98 $566,8385. Nathan Brisbane 14 $570,8356. Stafford Heights Brisbane 105 $579,8867. Chermside Brisbane 57 $583,9318. Everton Park Brisbane 135 $586,0059. Stafford Brisbane 100 $594,56610. Virginia Brisbane 55 $600,954
# Suburb Council Area # Sold Median value1. Boronia Heights Logan 47 $259,0992. Strathpine Moreton Bay 76 $268,2653. Bethania Logan 38 $273,6804. Springfield Ipswich 75 $304,7535. Richlands Brisbane 79 $322,7706. Ellen Grove Brisbane 90 $328,2347. Gordon Park Brisbane 30 $342,9638. Zillmere Brisbane 64 $346,4199. Griffin Moreton Bay 40 $349,38510. Tingalpa Brisbane 54 $352,730
CoreLogic Best of the Best 2017 | 17
© Copyright 2018 | RP Data Pty Ltd trading as CoreLogic Asia Pacific (CoreLogic) and its licensors are the sole and exclusive owners of all rights, title and interest (including intellectual property rights) subsisting in this publication including any data, analytics, statistics and other information. All rights reserved.
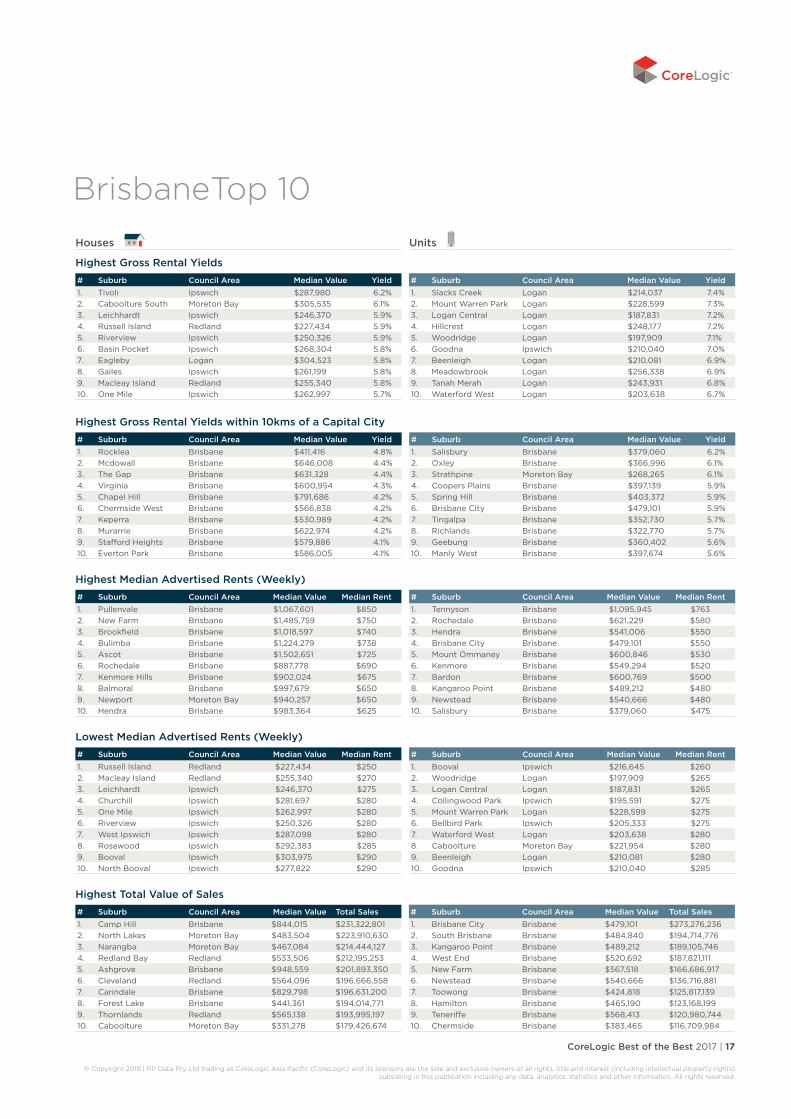
Houses
Highest Gross Rental Yields# Suburb Council Area Median Value Yield1. Tivoli Ipswich $287,980 6.2%2. Caboolture South Moreton Bay $305,535 6.1%3. Leichhardt Ipswich $246,370 5.9%4. Russell Island Redland $227,434 5.9%5. Riverview Ipswich $250,326 5.9%6. Basin Pocket Ipswich $268,304 5.8%7. Eagleby Logan $304,523 5.8%8. Gailes Ipswich $261,199 5.8%9. Macleay Island Redland $255,340 5.8%10. One Mile Ipswich $262,997 5.7%
Highest Gross Rental Yields within 10kms of a Capital City
Highest Median Advertised Rents (Weekly)# Suburb Council Area Median Value Median Rent1. Pullenvale Brisbane $1,067,601 $8502. New Farm Brisbane $1,485,759 $7503. Brookfield Brisbane $1,018,597 $7404. Bulimba Brisbane $1,224,279 $7385. Ascot Brisbane $1,502,651 $7256. Rochedale Brisbane $887,778 $6907. Kenmore Hills Brisbane $902,024 $6758. Balmoral Brisbane $997,679 $6509. Newport Moreton Bay $940,257 $65010. Hendra Brisbane $983,364 $625
Lowest Median Advertised Rents (Weekly)
Highest Total Value of Sales# Suburb Council Area Median Value Total Sales1. Camp Hill Brisbane $844,015 $231,322,8012. North Lakes Moreton Bay $483,504 $223,910,6303. Narangba Moreton Bay $467,084 $214,444,1274. Redland Bay Redland $533,506 $212,195,2535. Ashgrove Brisbane $948,559 $201,893,3506. Cleveland Redland $564,096 $196,666,5587. Carindale Brisbane $829,798 $196,631,2008. Forest Lake Brisbane $441,361 $194,014,7719. Thornlands Redland $565,138 $193,995,19710. Caboolture Moreton Bay $331,278 $179,426,674
Units
# Suburb Council Area Median Value Yield1. Slacks Creek Logan $214,037 7.4%2. Mount Warren Park Logan $228,599 7.3%3. Logan Central Logan $187,831 7.2%4. Hillcrest Logan $248,177 7.2%5. Woodridge Logan $197,909 7.1%6. Goodna Ipswich $210,040 7.0%7. Beenleigh Logan $210,081 6.9%8. Meadowbrook Logan $256,338 6.9%9. Tanah Merah Logan $243,931 6.8%10. Waterford West Logan $203,638 6.7%
# Suburb Council Area Median Value Yield1. Rocklea Brisbane $411,416 4.8%2. Mcdowall Brisbane $646,008 4.4%3. The Gap Brisbane $631,328 4.4%4. Virginia Brisbane $600,954 4.3%5. Chapel Hill Brisbane $791,686 4.2%6. Chermside West Brisbane $566,838 4.2%7. Keperra Brisbane $530,989 4.2%8. Murarrie Brisbane $622,974 4.2%9. Stafford Heights Brisbane $579,886 4.1%10. Everton Park Brisbane $586,005 4.1%
# Suburb Council Area Median Value Yield1. Salisbury Brisbane $379,060 6.2%2. Oxley Brisbane $366,996 6.1%3. Strathpine Moreton Bay $268,265 6.1%4. Coopers Plains Brisbane $397,139 5.9%5. Spring Hill Brisbane $403,372 5.9%6. Brisbane City Brisbane $479,101 5.9%7. Tingalpa Brisbane $352,730 5.7%8. Richlands Brisbane $322,770 5.7%9. Geebung Brisbane $360,402 5.6%10. Manly West Brisbane $397,674 5.6%
# Suburb Council Area Median Value Median Rent1. Tennyson Brisbane $1,095,945 $7632. Rochedale Brisbane $621,229 $5803. Hendra Brisbane $541,006 $5504. Brisbane City Brisbane $479,101 $5505. Mount Ommaney Brisbane $600,846 $5306. Kenmore Brisbane $549,294 $5207. Bardon Brisbane $600,769 $5008. Kangaroo Point Brisbane $489,212 $4809. Newstead Brisbane $540,666 $48010. Salisbury Brisbane $379,060 $475
# Suburb Council Area Median Value Median Rent1. Russell Island Redland $227,434 $2502. Macleay Island Redland $255,340 $2703. Leichhardt Ipswich $246,370 $2754. Churchill Ipswich $281,697 $2805. One Mile Ipswich $262,997 $2806. Riverview Ipswich $250,326 $2807. West Ipswich Ipswich $287,098 $2808. Rosewood Ipswich $292,383 $2859. Booval Ipswich $303,975 $29010. North Booval Ipswich $277,822 $290
# Suburb Council Area Median Value Median Rent1. Booval Ipswich $216,645 $2602. Woodridge Logan $197,909 $2653. Logan Central Logan $187,831 $2654. Collingwood Park Ipswich $195,591 $2755. Mount Warren Park Logan $228,599 $2756. Bellbird Park Ipswich $205,333 $2757. Waterford West Logan $203,638 $2808. Caboolture Moreton Bay $221,954 $2809. Beenleigh Logan $210,081 $28010. Goodna Ipswich $210,040 $285
# Suburb Council Area Median Value Total Sales1. Brisbane City Brisbane $479,101 $273,276,2362. South Brisbane Brisbane $484,840 $194,714,7763. Kangaroo Point Brisbane $489,212 $189,105,7464. West End Brisbane $520,692 $187,821,1115. New Farm Brisbane $567,518 $166,686,9176. Newstead Brisbane $540,666 $136,716,8817. Toowong Brisbane $424,818 $125,817,1398. Hamilton Brisbane $465,190 $123,168,1999. Teneriffe Brisbane $568,413 $120,980,74410. Chermside Brisbane $383,465 $116,709,984
BrisbaneTop 10

18 | CoreLogic Best of the Best 2017
© Copyright 2018 | RP Data Pty Ltd trading as CoreLogic Asia Pacific (CoreLogic) and its licensors are the sole and exclusive owners of all rights, title and interest (including intellectual property rights) subsisting in this publication including any data, analytics, statistics and other information. All rights reserved.

CoreLogic Best of the Best 2017 | 19
© Copyright 2018 | RP Data Pty Ltd trading as CoreLogic Asia Pacific (CoreLogic) and its licensors are the sole and exclusive owners of all rights, title and interest (including intellectual property rights) subsisting in this publication including any data, analytics, statistics and other information. All rights reserved.
AdelaideAdelaide’s Top Performing Suburbs 2017
Houses Units
Highest Median Value Medindie, Adelaide SA
$1,681,713 Eastwood, Adelaide SA
$554,287
Lowest Median Value Davoren Park, Adelaide SA
$183,217 Elizabeth Vale, Adelaide SA
$128,118
Lowest Median Value within 10km of a Capital City
Ottoway, Adelaide SA
$355,149 Greenacres, Adelaide SA
$238,658
Greatest 12 month Change in Median Values
Glenelg South, Adelaide SA
19.1% Mile End, Adelaide SA
14.4%
Greatest 5 year Change in Median Values
Leabrook, Adelaide SA
92.5% Flinders Park, Adelaide SA
53.4%
Highest Gross Rental Yields Elizabeth, Adelaide SA
7.1% Salisbury, Adelaide SA
6.9%
Highest Gross Rental Yields within 10kms of a Capital City
Ottoway, Adelaide SA
5.0% Enfield, Adelaide SA
6.1%
Highest Median Weekly Advertised Rents
Malvern, Adelaide SA
$650 Eastwood, Adelaide SA
$450
Lowest Median Weekly Advertised Rents
Elizabeth South, Adelaide SA
$255 Smithfield Plains, Adelaide SA
$211
Highest Total Value of Sales
Prospect, Adelaide SA
$119,995,264 Adelaide, Adelaide SA
$301,244,088

20 | CoreLogic Best of the Best 2017
© Copyright 2018 | RP Data Pty Ltd trading as CoreLogic Asia Pacific (CoreLogic) and its licensors are the sole and exclusive owners of all rights, title and interest (including intellectual property rights) subsisting in this publication including any data, analytics, statistics and other information. All rights reserved.
Adelaide Top 10
Highest Median Value# Suburb Council Area # Sold Median value1. Medindie Walkerville 14 $1,681,7132. Leabrook Burnside 16 $1,535,9943. Springfield Mitcham 14 $1,502,0584. Unley Park Unley 34 $1,423,0255. Rose Park Burnside 11 $1,421,0536. Toorak Gardens Burnside 33 $1,392,7897. Malvern Unley 49 $1,287,8178. Saint Peters Norwood Payneham St Peters 50 $1,160,7849. Tennyson Charles Sturt 18 $1,115,22210. Walkerville Walkerville 40 $1,098,623
Lowest Median Value
Lowest Median Value within 10kms of a Capital City
Greatest 12 month Change# Suburb Council Area # Sold Median Value Change1. Glenelg South Holdfast Bay 22 $1,036,821 19.1%2. Leabrook Burnside 16 $1,535,994 15.1%3. Saint Marys Mitcham 62 $469,208 13.9%4. Sefton Park Port Adelaide Enfield 19 $608,462 13.3%5. Saint Georges Burnside 30 $1,029,024 13.3%6. Black Forest Unley 16 $730,763 13.3%7. Trinity Gardens Norwood Payneham St Peters 24 $818,941 13.1%8. Glandore West Torrens 36 $632,869 12.5%9. Hazelwood Park Burnside 26 $954,088 12.4%10. Saint Clair Charles Sturt 22 $617,928 12.4%
Greatest 5 year Change# Suburb Council Area # Sold Median Value Change1. Leabrook Burnside 16 $1,535,994 92.5%2. Aldinga Onkaparinga 13 $451,721 54.7%3. Gilberton Walkerville 19 $1,067,000 43.4%4. Collinswood Prospect 13 $816,969 42.7%5. Glenunga Burnside 39 $964,646 42.1%6. Hazelwood Park Burnside 26 $954,088 40.6%7. Rose Park Burnside 11 $1,421,053 38.4%8. Westbourne Park Mitcham 30 $863,219 37.9%9. Dulwich Burnside 20 $1,053,580 37.4%10. Myrtle Bank Unley 33 $962,006 36.9%
# Suburb Council Area # Sold Median value1. Eastwood Burnside 18 $554,2872. Norwood Norwood Payneham St Peters 95 $506,8533. Kent Town Norwood Payneham St Peters 21 $506,5254. North Adelaide Adelaide 100 $502,1575. Frewville Burnside 12 $493,4886. Hyde Park Unley 15 $474,7167. Kensington Norwood Payneham St Peters 22 $469,1908. Glenelg Holdfast Bay 122 $461,5249. Gilberton Walkerville 37 $458,15610. Rose Park Burnside 14 $457,461
# Suburb Council Area # Sold Median value1. Davoren Park Playford 97 $183,2172. Smithfield Plains Playford 70 $187,0933. Elizabeth North Playford 44 $187,1944. Elizabeth Downs Playford 82 $193,1455. Elizabeth Park Playford 70 $203,2096. Elizabeth South Playford 37 $203,9307. Elizabeth Grove Playford 27 $211,7448. Elizabeth East Playford 52 $220,2709. Smithfield Playford 40 $226,51010. Elizabeth Playford 20 $228,447
# Suburb Council Area # Sold Median value1. Elizabeth Vale Playford 12 $128,1182. Elizabeth North Playford 42 $164,0503. Salisbury Salisbury 51 $186,7074. Salisbury North Salisbury 54 $199,9345. Rosewater Port Adelaide Enfield 14 $211,7796. Paralowie Salisbury 14 $213,0537. Salisbury East Salisbury 35 $213,5728. Gawler South Gawler 11 $215,7929. Willaston Gawler 14 $218,85710. Reynella Onkaparinga 12 $221,229
# Suburb Council Area # Sold Median Value Change1. Mile End West Torrens 32 $417,649 14.4%2. Flinders Park Charles Sturt 16 $428,246 13.8%3. Royal Park Charles Sturt 34 $322,496 11.9%4. West Lakes Shore Charles Sturt 24 $440,834 10.7%5. Everard Park Unley 16 $296,955 10.6%6. Ethelton Port Adelaide Enfield 13 $339,952 9.2%7. Paradise Campbelltown 24 $313,093 7.6%8. Torrens Park Mitcham 14 $375,745 7.4%9. Ovingham Charles Sturt 17 $284,123 6.8%10. North Adelaide Adelaide 100 $502,157 6.7%
# Suburb Council Area # Sold Median Value Change1. Flinders Park Charles Sturt 16 $428,246 53.4%2. Kensington Park Burnside 17 $408,944 36.8%3. North Plympton West Torrens 21 $395,398 33.7%4. Woodville South Charles Sturt 15 $333,907 32.9%5. West Croydon Charles Sturt 14 $381,051 32.2%6. Semaphore South Port Adelaide Enfield 13 $357,705 31.9%7. Glenunga Burnside 18 $430,917 31.5%8. Christies Beach Onkaparinga 46 $292,510 31.1%9. Maylands Norwood Payneham St Peters 14 $417,577 31.1%10. Royal Park Charles Sturt 34 $322,496 29.9%
Houses Units
# Suburb Council Area # Sold Median value1. Ottoway Port Adelaide Enfield 43 $355,1492. Gepps Cross Port Adelaide Enfield 16 $360,5923. Woodville Gardens Port Adelaide Enfield 27 $378,3374. Athol Park Charles Sturt 38 $384,3705. Pennington Charles Sturt 48 $388,4106. Mansfield Park Port Adelaide Enfield 42 $389,0567. Holden Hill Tea Tree Gully 55 $391,7978. Woodville North Charles Sturt 33 $401,7769. Royal Park Charles Sturt 60 $404,89810. Kilburn Port Adelaide Enfield 40 $406,085
# Suburb Council Area # Sold Median value1. Greenacres Port Adelaide Enfield 12 $238,6582. Windsor Gardens Port Adelaide Enfield 19 $241,3863. Mansfield Park Port Adelaide Enfield 18 $243,2584. Saint Marys Mitcham 27 $244,0085. Kilburn Port Adelaide Enfield 46 $244,5476. Holden Hill Tea Tree Gully 16 $258,1867. Pooraka Salisbury 20 $259,2048. Kurralta Park West Torrens 49 $259,3679. Alberton Port Adelaide Enfield 13 $264,50310. Brooklyn Park West Torrens 41 $267,423

CoreLogic Best of the Best 2017 | 21
© Copyright 2018 | RP Data Pty Ltd trading as CoreLogic Asia Pacific (CoreLogic) and its licensors are the sole and exclusive owners of all rights, title and interest (including intellectual property rights) subsisting in this publication including any data, analytics, statistics and other information. All rights reserved.
Houses
Highest Gross Rental Yields# Suburb Council Area Median Value Yield1. Elizabeth Playford $228,447 7.1%2. Smithfield Plains Playford $187,093 7.1%3. Elizabeth Downs Playford $193,145 7.1%4. Elizabeth North Playford $187,194 7.0%5. Davoren Park Playford $183,217 6.9%6. Elizabeth Park Playford $203,209 6.7%7. Elizabeth East Playford $220,270 6.5%8. Elizabeth Grove Playford $211,744 6.4%9. Smithfield Playford $226,510 6.4%10. Elizabeth South Playford $203,930 6.2%
Highest Gross Rental Yields within 10kms of a Capital City
Highest Median Advertised Rents (Weekly)# Suburb Council Area Median Value Median Rent1. Malvern Unley $1,287,817 $6502. Glen Osmond Burnside $930,484 $6303. West Lakes Charles Sturt $739,459 $5804. Wattle Park Burnside $870,626 $5505. Parkside Unley $804,838 $5506. North Adelaide Adelaide $975,970 $5407. Kensington Park Burnside $848,908 $5258. Linden Park Burnside $827,745 $5259. Saint Peters Norwood Payneham St Peters $1,160,784 $52010.Henley Beach South Charles Sturt $751,709 $520
Lowest Median Advertised Rents (Weekly)
Highest Total Value of Sales# Suburb Council Area Median Value Total Sales1. Prospect Prospect $689,032 $119,995,2642. Morphett Vale Onkaparinga $304,101 $118,170,7973. Hallett Cove Marion $448,200 $103,062,2274. Mawson Lakes Salisbury $490,562 $101,272,9695. Magill Campbelltown $623,874 $95,683,5376. Aldinga Beach Onkaparinga $341,439 $85,560,3007. Flagstaff Hill Onkaparinga $487,133 $83,369,8928. Rostrevor Campbelltown $590,342 $79,635,4469. Campbelltown Campbelltown $537,360 $78,129,38110. Aberfoyle Park Onkaparinga $402,599 $77,235,298
Units
# Suburb Council Area Median Value Yield1. Salisbury Salisbury $186,707 6.9%2. Salisbury North Salisbury $199,934 6.9%3. Paralowie Salisbury $213,053 6.6%4. Salisbury East Salisbury $213,572 6.5%5. Salisbury Downs Salisbury $230,966 6.2%6. Morphett Vale Onkaparinga $236,290 6.2%7. Enfield Port Adelaide Enfield $286,112 6.1%8. Kurralta Park West Torrens $259,367 6.1%9. Queenstown Port Adelaide Enfield $285,668 5.9%10. Mawson Lakes Salisbury $287,150 5.9%
# Suburb Council Area Median Value Yield1. Ottoway Port Adelaide Enfield $355,149 5.0%2. Mansfield Park Port Adelaide Enfield $389,056 4.9%3. Athol Park Charles Sturt $384,370 4.9%4. Pennington Charles Sturt $388,410 4.8%5. Albert Park Charles Sturt $446,545 4.8%6. Holden Hill Tea Tree Gully $391,797 4.8%7. Glenalta Mitcham $507,686 4.7%8. Oaklands Park Marion $472,053 4.6%9. Hillcrest Port Adelaide Enfield $448,788 4.6%10. Northfield Port Adelaide Enfield $407,550 4.6%
# Suburb Council Area Median Value Yield1. Enfield Port Adelaide Enfield $286,112 6.1%2. Kurralta Park West Torrens $259,367 6.1%3. Queenstown Port Adelaide Enfield $285,668 5.9%4. Mawson Lakes Salisbury $287,150 5.9%5. Windsor Gardens Port Adelaide Enfield $241,386 5.8%6. Saint Marys Mitcham $244,008 5.8%7. Kilburn Port Adelaide Enfield $244,547 5.8%8. Pooraka Salisbury $259,204 5.7%9. Camden Park West Torrens $317,973 5.7%10. Modbury Tea Tree Gully $269,430 5.6%
# Suburb Council Area Median Value Median Rent1. Eastwood Burnside $554,287 $4502. Adelaide Adelaide $423,491 $4403. Walkerville Walkerville $395,376 $4204. Hyde Park Unley $474,716 $4005. Seacombe Gardens Marion $428,509 $4006. North Adelaide Adelaide $502,157 $3987. Brompton Charles Sturt $441,519 $3958. Bowden Charles Sturt $424,888 $3909. Glenelg Holdfast Bay $461,524 $39010. Gilberton Walkerville $458,156 $380
# Suburb Council Area Median Value Median Rent1. Elizabeth South Playford $203,930 $2552. Elizabeth North Playford $187,194 $2553. Elizabeth Downs Playford $193,145 $2604. Elizabeth Grove Playford $211,744 $2605. Smithfield Plains Playford $187,093 $2606. Davoren Park Playford $183,217 $2607. Elizabeth Park Playford $203,209 $2658. Elizabeth Playford $228,447 $2709. Elizabeth East Playford $220,270 $27010. Elizabeth Vale Playford $239,815 $270
# Suburb Council Area Median Value Median Rent1. Smithfield Plains Playford $244,100 $2112. Davoren Park Playford $148,959 $2153. Elizabeth South Playford $142,929 $2204. Elizabeth Downs Playford $147,476 $2205. Elizabeth Vale Playford $128,118 $2206. Elizabeth Grove Playford $164,200 $2257. Elizabeth North Playford $164,050 $2258. Evanston Gawler $130,568 $2289. Elizabeth East Playford $161,908 $23010. Salisbury Salisbury $186,707 $230
# Suburb Council Area Median Value Total Sales1. Adelaide Adelaide $423,491 $301,244,0882. Glenelg Holdfast Bay $461,524 $68,913,5003. North Adelaide Adelaide $502,157 $54,099,8504. Norwood Norwood Payneham St Peters $506,853 $48,329,5725. Prospect Prospect $325,618 $45,356,5406. Bowden Charles Sturt $424,888 $36,810,6007. Glenelg North Holdfast Bay $364,139 $35,251,9508. West Lakes Charles Sturt $417,494 $31,266,4499. Mawson Lakes Salisbury $287,150 $30,451,20010. Warradale Marion $356,894 $30,232,590
Adelaide Top 10
22 | CoreLogic Best of the Best 2017
© Copyright 2018 | RP Data Pty Ltd trading as CoreLogic Asia Pacific (CoreLogic) and its licensors are the sole and exclusive owners of all rights, title and interest (including intellectual property rights) subsisting in this publication including any data, analytics, statistics and other information. All rights reserved.
CoreLogic Best of the Best 2017 | 23
© Copyright 2018 | RP Data Pty Ltd trading as CoreLogic Asia Pacific (CoreLogic) and its licensors are the sole and exclusive owners of all rights, title and interest (including intellectual property rights) subsisting in this publication including any data, analytics, statistics and other information. All rights reserved.
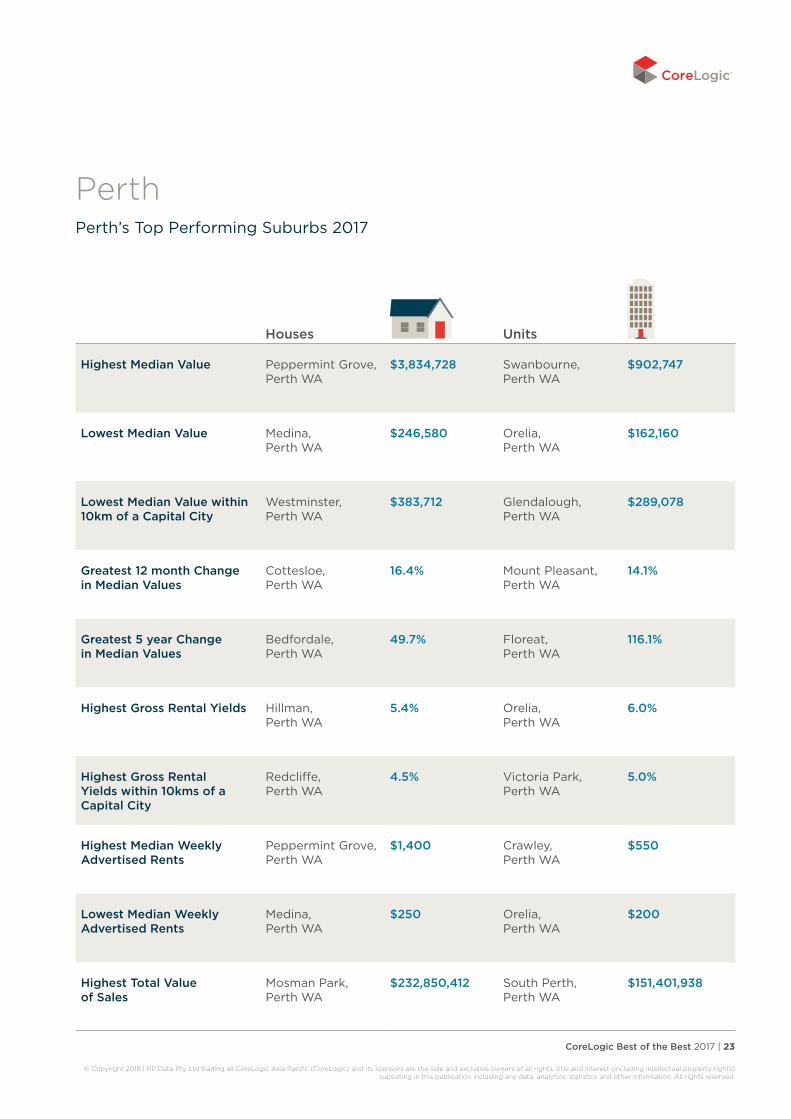
PerthPerth’s Top Performing Suburbs 2017
Houses Units
Highest Median Value Peppermint Grove, Perth WA
$3,834,728 Swanbourne, Perth WA
$902,747
Lowest Median Value Medina, Perth WA
$246,580 Orelia, Perth WA
$162,160
Lowest Median Value within 10km of a Capital City
Westminster, Perth WA
$383,712 Glendalough, Perth WA
$289,078
Greatest 12 month Change in Median Values
Cottesloe, Perth WA
16.4% Mount Pleasant, Perth WA
14.1%
Greatest 5 year Change in Median Values
Bedfordale, Perth WA
49.7% Floreat, Perth WA
116.1%
Highest Gross Rental Yields Hillman, Perth WA
5.4% Orelia, Perth WA
6.0%
Highest Gross Rental Yields within 10kms of a Capital City
Redcliffe, Perth WA
4.5% Victoria Park, Perth WA
5.0%
Highest Median Weekly Advertised Rents
Peppermint Grove, Perth WA
$1,400 Crawley, Perth WA
$550
Lowest Median Weekly Advertised Rents
Medina, Perth WA
$250 Orelia, Perth WA
$200
Highest Total Value of Sales
Mosman Park, Perth WA
$232,850,412 South Perth, Perth WA
$151,401,938

24 | CoreLogic Best of the Best 2017
© Copyright 2018 | RP Data Pty Ltd trading as CoreLogic Asia Pacific (CoreLogic) and its licensors are the sole and exclusive owners of all rights, title and interest (including intellectual property rights) subsisting in this publication including any data, analytics, statistics and other information. All rights reserved.
Perth Top 10
Highest Median Value# Suburb Council Area # Sold Median value1. Peppermint Grove Peppermint Grove 15 $3,834,7282. Dalkeith Nedlands 59 $2,608,9903. Cottesloe Cottesloe 78 $2,124,5094. City Beach Cambridge 91 $1,801,4945. Applecross Melville 80 $1,606,7126. Swanbourne Nedlands 52 $1,604,6407. Nedlands Nedlands 117 $1,540,1768. Claremont Claremont 80 $1,374,0849. Mount Claremont Nedlands 63 $1,330,44610. Mosman Park Mosman Park 115 $1,286,697
Lowest Median Value
Lowest Median Value within 10kms of a Capital City
Greatest 12 month Change# Suburb Council Area # Sold Median Value Change1. Cottesloe Cottesloe 78 $2,124,509 16.4%2. Wandi Kwinana 29 $385,060 15.3%3. Peppermint Grove Peppermint Grove 15 $3,834,728 14.9%4. Treeby Cockburn 15 $474,483 14.8%5. Shenton Park Subiaco 51 $1,169,830 14.1%6. Applecross Melville 80 $1,606,712 13.9%7. North Fremantle Fremantle 29 $1,062,965 12.5%8. Casuarina Kwinana 14 $854,956 12.5%9. Subiaco Subiaco 74 $1,161,534 11.4%10. Eglinton Wanneroo 23 $364,732 11.3%
Greatest 5 year Change# Suburb Council Area # Sold Median Value Change1. Bedfordale Armadale 21 $757,621 49.7%2. Dayton Swan 40 $393,374 43.0%3. North Coogee Cockburn 23 $981,439 41.5%4. Burns Beach Joondalup 42 $817,698 35.6%5. Brabham Swan 67 $395,674 34.1%6. Jarrahdale Serpentine-Jarrahdale 15 $497,901 31.9%7. Swanbourne Nedlands 52 $1,604,640 31.8%8. Oakford Serpentine-Jarrahdale 19 $987,526 30.5%9. Mundijong Serpentine-Jarrahdale 22 $500,406 25.7%10. Claremont Claremont 80 $1,374,084 24.7%
# Suburb Council Area # Sold Median value1. Swanbourne Nedlands 19 $902,7472. Mount Pleasant Melville 14 $831,9603. Floreat Cambridge 20 $818,8484. Cottesloe Cottesloe 52 $750,4805. North Fremantle Fremantle 49 $724,8746. Claremont Claremont 68 $708,3927. South Fremantle Fremantle 15 $697,9668. Applecross Melville 34 $635,7599. North Coogee Cockburn 52 $608,91110. North Beach Stirling 14 $606,856
# Suburb Council Area # Sold Median value1. Medina Kwinana 48 $246,5802. Camillo Armadale 50 $270,5473. Hillman Rockingham 27 $273,2994. Parmelia Kwinana 65 $285,1105. Armadale Armadale 165 $288,7926. Cooloongup Rockingham 77 $290,4277. Orelia Kwinana 48 $290,7018. Calista Kwinana 24 $291,3699. Brookdale Armadale 21 $296,91510. Koongamia Swan 11 $308,511
# Suburb Council Area # Sold Median value1. Orelia Kwinana 14 $162,1602. Armadale Armadale 26 $251,1013. Waikiki Rockingham 18 $257,6194. Shoalwater Rockingham 23 $260,6765. Kelmscott Armadale 13 $264,8056. Butler Wanneroo 12 $269,4577. Baldivis Rockingham 24 $286,2368. Glendalough Stirling 42 $289,0789. Maddington Gosnells 11 $291,88910. Rockingham Rockingham 99 $307,801
# Suburb Council Area # Sold Median Value Change1. Mount Pleasant Melville 14 $831,960 14.1%2. North Coogee Cockburn 52 $608,911 6.6%3. Churchlands Stirling 16 $413,978 4.1%4. Swanbourne Nedlands 19 $902,747 3.7%5. Queens Park Canning 27 $376,677 2.9%6. Beeliar Cockburn 15 $386,210 2.8%7. North Beach Stirling 14 $606,856 2.7%8. South Perth South Perth 190 $551,819 1.1%9. Kalamunda Kalamunda 13 $474,371 0.8%10. Inglewood Stirling 32 $383,213 0.5%
# Suburb Council Area # Sold Median Value Change1. Floreat Cambridge 20 $818,848 116.1%2. Mount Pleasant Melville 14 $831,960 37.9%3. Lathlain Victoria Park 31 $461,438 31.7%4. Burswood Victoria Park 37 $534,489 16.9%5. West Leederville Cambridge 66 $408,012 14.1%6. Hamilton Hill Cockburn 44 $363,286 12.2%7. Yokine Stirling 85 $412,436 10.5%8. Spearwood Cockburn 24 $359,532 9.3%9. Mount Hawthorn Vincent 28 $510,986 9.3%10. Melville Melville 18 $533,672 8.8%
Houses Units
# Suburb Council Area # Sold Median value1. Westminster Stirling 129 $383,7122. Nollamara Stirling 202 $404,5373. Redcliffe Belmont 66 $429,0124. Osborne Park Stirling 42 $436,0465. Queens Park Canning 79 $438,3536. Cloverdale Belmont 107 $452,3827. Bentley Canning 68 $455,2508. Belmont Belmont 85 $475,9529. Ashfield Bassendean 14 $477,08210. Embleton Bayswater 59 $481,474
# Suburb Council Area # Sold Median value1. Glendalough Stirling 42 $289,0782. Wembley Cambridge 95 $311,5533. Osborne Park Stirling 51 $331,1474. Maylands Bayswater 158 $340,6145. Jolimont Subiaco 13 $344,3986. Kewdale Belmont 34 $344,8077. Belmont Belmont 34 $352,9708. Rivervale Belmont 87 $359,3709. Cloverdale Belmont 43 $365,05610. Westminster Stirling 14 $366,982

CoreLogic Best of the Best 2017 | 25
© Copyright 2018 | RP Data Pty Ltd trading as CoreLogic Asia Pacific (CoreLogic) and its licensors are the sole and exclusive owners of all rights, title and interest (including intellectual property rights) subsisting in this publication including any data, analytics, statistics and other information. All rights reserved.
Houses
Highest Gross Rental Yields# Suburb Council Area Median Value Yield1. Hillman Rockingham $273,299 5.4%2. Camillo Armadale $270,547 5.2%3. Cooloongup Rockingham $290,427 5.2%4. Stratton Swan $316,950 5.2%5. Port Kennedy Rockingham $374,280 5.0%6. Orelia Kwinana $290,701 5.0%7. Warnbro Rockingham $329,069 4.9%8. Koongamia Swan $308,511 4.9%9. Jane Brook Swan $480,169 4.9%10. Brookdale Armadale $296,915 4.9%
Highest Gross Rental Yields within 10kms of a Capital City
Highest Median Advertised Rents (Weekly)# Suburb Council Area Median Value Median Rent1. Peppermint Grove Peppermint Grove $3,834,728 $1,4002. Dalkeith Nedlands $2,608,990 $9003. Mount Claremont Nedlands $1,330,446 $8384. City Beach Cambridge $1,801,494 $8235. Churchlands Stirling $1,271,626 $8056. Cottesloe Cottesloe $2,124,509 $7987. Mosman Park Mosman Park $1,286,697 $7508. North Fremantle Fremantle $1,062,965 $7259. Subiaco Subiaco $1,161,534 $70010. Swanbourne Nedlands $1,604,640 $675
Lowest Median Advertised Rents (Weekly)
Highest Total Value of Sales# Suburb Council Area Median Value Total Sales1. Mosman Park Mosman Park $1,286,697 $232,850,4122. Nedlands Nedlands $1,540,176 $222,513,5003. Cottesloe Cottesloe $2,124,509 $221,392,0004. Canning Vale Canning $568,539 $214,838,8775. City Beach Cambridge $1,801,494 $186,888,2776. Dianella Stirling $607,426 $186,456,2367. Dalkeith Nedlands $2,608,990 $178,695,0008. Willetton Canning $702,972 $171,738,4989. Claremont Claremont $274,662 $170,907,00010. Baldivis Rockingham $386,066 $167,245,199
Units
# Suburb Council Area Median Value Yield1. Orelia Kwinana $162,160 6.0%2. Rockingham Rockingham $307,801 5.2%3. Shoalwater Rockingham $260,676 5.1%4. Waikiki Rockingham $257,619 5.1%5. Kelmscott Armadale $264,805 5.1%6. Maddington Gosnells $291,889 5.1%7. Armadale Armadale $251,101 5.1%8. Victoria Park Victoria Park $411,356 5.0%9. West Leederville Cambridge $408,012 5.0%10. Glendalough Stirling $289,078 5.0%
# Suburb Council Area Median Value Yield1. Redcliffe Belmont $429,012 4.5%2. Westminster Stirling $383,712 4.3%3. Queens Park Canning $438,353 4.3%4. Nollamara Stirling $404,537 4.3%5. Osborne Park Stirling $436,046 4.2%6. Innaloo Stirling $560,749 4.1%7. Bentley Canning $455,250 4.0%8. Ascot Belmont $693,137 3.9%9. Tuart Hill Stirling $484,576 3.9%10. Balcatta Stirling $574,087 3.9%
# Suburb Council Area Median Value Yield1. Victoria Park Victoria Park $411,356 5.0%2. West Leederville Cambridge $408,012 5.0%3. Glendalough Stirling $289,078 5.0%4. East Perth Perth $446,538 4.9%5. Rivervale Belmont $359,370 4.8%6. West Perth Perth $438,836 4.8%7. Westminster Stirling $366,982 4.8%8. Maylands Bayswater $340,614 4.8%9. Wembley Cambridge $311,553 4.8%10. Perth Perth $449,794 4.7%
# Suburb Council Area Median Value Median Rent1. Crawley Subiaco $539,672 $5502. North Fremantle Fremantle $724,874 $5303. Floreat Cambridge $818,848 $4804. South Fremantle Fremantle $697,966 $4655. Cottesloe Cottesloe $750,480 $4506. Burswood Victoria Park $534,489 $4457. Sorrento Joondalup $469,927 $4408. Perth Perth $449,794 $4009. Subiaco Subiaco $496,476 $40010. East Perth Perth $446,538 $400
# Suburb Council Area Median Value Median Rent1. Medina Kwinana $246,580 $2502. Armadale Armadale $288,792 $2603. Camillo Armadale $270,547 $2654. Calista Kwinana $291,369 $2705. Parmelia Kwinana $285,110 $2706. Kelmscott Armadale $328,455 $2807. Orelia Kwinana $290,701 $2808. Maddington Gosnells $318,267 $2909. Gosnells Gosnells $328,727 $29010. Koongamia Swan $308,511 $290
# Suburb Council Area Median Value Median Rent1. Orelia Kwinana $162,160 $2002. Parmelia Kwinana $184,866 $2003. Armadale Armadale $251,101 $2304. Shoalwater Rockingham $260,676 $2335. Safety Bay Rockingham $265,018 $2456. Wembley Cambridge $311,553 $2507. Cooloongup Rockingham $251,292 $2508. Osborne Park Stirling $331,147 $2509. Bayswater Bayswater $397,057 $25510. Kelmscott Armadale $264,805 $258
# Suburb Council Area Median Value Total Sales1. South Perth South Perth $551,819 $151,401,9382. East Perth Perth $446,538 $148,555,9363. Perth Perth $449,794 $113,346,2834. Scarborough Stirling $518,975 $111,289,8665. Como South Perth $487,451 $93,125,0336. West Perth Perth $438,836 $66,434,2997. Maylands Bayswater $340,614 $64,959,9668. Subiaco Subiaco $496,476 $62,429,3049. North Fremantle Fremantle $724,874 $58,646,50010. Claremont Claremont $216,482 $54,449,150
Perth Top 10

26 | CoreLogic Best of the Best 2017
© Copyright 2018 | RP Data Pty Ltd trading as CoreLogic Asia Pacific (CoreLogic) and its licensors are the sole and exclusive owners of all rights, title and interest (including intellectual property rights) subsisting in this publication including any data, analytics, statistics and other information. All rights reserved.

CoreLogic Best of the Best 2017 | 27
© Copyright 2018 | RP Data Pty Ltd trading as CoreLogic Asia Pacific (CoreLogic) and its licensors are the sole and exclusive owners of all rights, title and interest (including intellectual property rights) subsisting in this publication including any data, analytics, statistics and other information. All rights reserved.
HobartHobart’s Top Performing Suburbs 2017
Houses Units
Highest Median Value Battery Point, Hobart TAS
$1,132,555 Battery Point, Hobart TAS
$592,247
Lowest Median Value Herdsmans Cove, Hobart TAS
$154,204 New Norfolk, Derwent Valley TAS
$205,814
Lowest Median Value within 10km of a Capital City
Clarendon Vale, Hobart TAS
$158,246 Montrose, Hobart TAS
$211,518
Greatest 12 month Change in Median Values
Glebe, Hobart TAS
34.8% Kingston Beach, Hobart TAS
28.8%
Greatest 5 year Change in Median Values
North Hobart, Hobart TAS
55.8% Kingston Beach, Hobart TAS
35.5%
Highest Gross Rental Yields Gagebrook, Hobart TAS
9.1% Claremont, Hobart TAS
7.3%
Highest Gross Rental Yields within 10kms of a Capital City
Risdon Vale, Hobart TAS
8.5% Moonah, Hobart TAS
6.7%
Highest Median Weekly Advertised Rents
Battery Point, Hobart TAS
$650 Hobart, Hobart TAS
$500
Lowest Median Weekly Advertised Rents
Primrose Sands, Hobart TAS
$250 Claremont, Hobart TAS
$260
Highest Total Value of Sales
Sandy Bay, Hobart TAS
$153,161,974 Sandy Bay, Hobart TAS
$57,885,765
28 | CoreLogic Best of the Best 2017
© Copyright 2018 | RP Data Pty Ltd trading as CoreLogic Asia Pacific (CoreLogic) and its licensors are the sole and exclusive owners of all rights, title and interest (including intellectual property rights) subsisting in this publication including any data, analytics, statistics and other information. All rights reserved.
Hobart Top 10
Highest Median Value# Suburb Council Area # Sold Median value1. Battery Point Hobart 15 $1,132,5552. Sandy Bay Hobart 133 $832,3043. Acton Park Clarence 28 $707,9754. Dynnyrne Hobart 20 $666,6375. Glebe Hobart 12 $655,2606. West Hobart Hobart 76 $631,5807. Tranmere Clarence 43 $618,5938. Otago Clarence 12 $593,6129. Mount Stuart Hobart 32 $584,61410. North Hobart Hobart 27 $582,143
Lowest Median Value
Lowest Median Value within 10kms of a Capital City
Greatest 12 month Change# Suburb Council Area # Sold Median Value Change1. Glebe Hobart 12 $655,260 34.8%2. North Hobart Hobart 27 $582,143 31.5%3. Mount Stuart Hobart 32 $584,614 29.7%4. Derwent Park Glenorchy 13 $310,638 22.0%5. West Hobart Hobart 76 $631,580 21.4%6. Dynnyrne Hobart 20 $666,637 21.0%7. West Moonah Glenorchy 68 $369,735 18.6%8. Lauderdale Clarence 43 $438,842 18.1%9. Lutana Glenorchy 32 $343,122 18.0%10. Goodwood Glenorchy 31 $264,226 17.2%
Greatest 5 year Change# Suburb Council Area # Sold Median Value Change1. North Hobart Hobart 27 $582,143 55.8%2. Glebe Hobart 12 $655,260 52.8%3. Dynnyrne Hobart 20 $666,637 50.5%4. Otago Clarence 12 $593,612 48.2%5. West Hobart Hobart 76 $631,580 45.6%6. Sandy Bay Hobart 133 $832,304 41.6%7. Mount Stuart Hobart 32 $584,614 36.0%8. South Hobart Hobart 69 $526,710 33.8%9. Snug Kingborough 14 $383,150 33.8%10. Rose Bay Clarence 15 $525,672 32.7%
# Suburb Council Area # Sold Median value1. Battery Point Hobart 37 $592,2472. Hobart Hobart 49 $540,0183. Sandy Bay Hobart 112 $463,5844. West Hobart Hobart 21 $452,1415. North Hobart Hobart 12 $418,8006. Dynnyrne Hobart 15 $372,0637. Kingston Beach Kingborough 14 $367,7458. South Hobart Hobart 37 $353,4729. Lindisfarne Clarence 26 $351,53610. Howrah Clarence 44 $327,882
# Suburb Council Area # Sold Median value1. Herdsmans Cove Brighton 15 $154,2042. Gagebrook Brighton 29 $156,7123. Clarendon Vale Clarence 18 $158,2464. Bridgewater Brighton 49 $186,1665. Risdon Vale Clarence 52 $195,6636. Primrose Sands Sorell 55 $204,6237. New Norfolk Derwent Valley 120 $210,7378. Rokeby Clarence 60 $225,3239. Chigwell Glenorchy 28 $237,52210. Warrane Clarence 42 $258,019
# Suburb Council Area # Sold Median value1. New Norfolk Derwent Valley 17 $205,8142. Montrose Glenorchy 14 $211,5183. Claremont Glenorchy 75 $216,4824. Brighton Brighton 21 $220,1495. Moonah Glenorchy 26 $230,5646. Lutana Glenorchy 12 $231,9657. Glenorchy Glenorchy 109 $232,5438. Rokeby Clarence 12 $241,0119. Austins Ferry Glenorchy 10 $242,16510. Rosetta Glenorchy 13 $242,954
# Suburb Council Area # Sold Median Value Change1. Kingston Beach Kingborough 14 $367,745 28.8%2. Rokeby Clarence 12 $241,011 18.7%3. Sandy Bay Hobart 112 $463,584 17.1%4. West Hobart Hobart 21 $452,141 14.7%5. Dynnyrne Hobart 15 $372,063 14.4%6. Blackmans Bay Kingborough 42 $326,236 12.3%7. Kingston Kingborough 85 $315,808 11.4%8. New Town Hobart 30 $293,725 11.3%9. Mount Nelson Hobart 20 $288,638 11.3%10. Lindisfarne Clarence 26 $351,536 11.0%
# Suburb Council Area # Sold Median Value Change1. Kingston Beach Kingborough 14 $367,745 35.5%2. West Hobart Hobart 21 $452,141 35.0%3. Blackmans Bay Kingborough 42 $326,236 33.2%4. Mount Stuart Hobart 25 $302,829 27.2%5. Sandy Bay Hobart 112 $463,584 26.1%6. Lindisfarne Clarence 26 $351,536 24.8%7. Lenah Valley Hobart 32 $320,015 24.0%8. Bellerive Clarence 45 $323,719 23.9%9. Hobart Hobart 49 $540,018 22.5%10. South Hobart Hobart 37 $353,472 22.3%
Houses Units
# Suburb Council Area # Sold Median value1. Clarendon Vale Clarence 18 $158,2462. Risdon Vale Clarence 52 $195,6633. Rokeby Clarence 60 $225,3234. Warrane Clarence 42 $258,0195. Goodwood Glenorchy 31 $264,2266. Glenorchy Glenorchy 170 $292,3107. Mornington Clarence 54 $304,9448. Derwent Park Glenorchy 13 $310,6389. Montrose Glenorchy 33 $328,05910. Lutana Glenorchy 32 $343,122
# Suburb Council Area # Sold Median value1. Montrose Glenorchy 14 $211,5182. Moonah Glenorchy 26 $230,5643. Lutana Glenorchy 12 $231,9654. Glenorchy Glenorchy 109 $232,5435. Rokeby Clarence 12 $241,0116. Rosetta Glenorchy 13 $242,9547. Warrane Clarence 11 $268,8708. West Moonah Glenorchy 33 $277,6889. Mount Nelson Hobart 20 $288,63810. New Town Hobart 30 $293,725
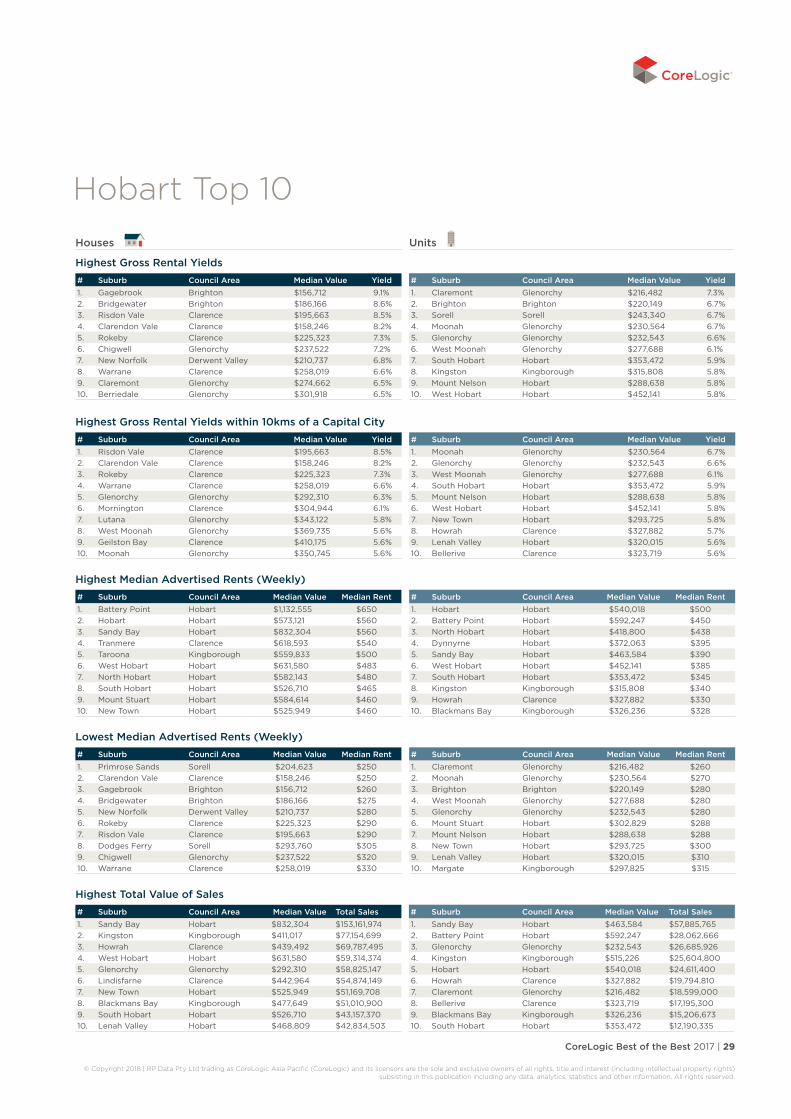
CoreLogic Best of the Best 2017 | 29
© Copyright 2018 | RP Data Pty Ltd trading as CoreLogic Asia Pacific (CoreLogic) and its licensors are the sole and exclusive owners of all rights, title and interest (including intellectual property rights) subsisting in this publication including any data, analytics, statistics and other information. All rights reserved.
Houses
Highest Gross Rental Yields# Suburb Council Area Median Value Yield1. Gagebrook Brighton $156,712 9.1%2. Bridgewater Brighton $186,166 8.6%3. Risdon Vale Clarence $195,663 8.5%4. Clarendon Vale Clarence $158,246 8.2%5. Rokeby Clarence $225,323 7.3%6. Chigwell Glenorchy $237,522 7.2%7. New Norfolk Derwent Valley $210,737 6.8%8. Warrane Clarence $258,019 6.6%9. Claremont Glenorchy $274,662 6.5%10. Berriedale Glenorchy $301,918 6.5%
Highest Gross Rental Yields within 10kms of a Capital City
Highest Median Advertised Rents (Weekly)# Suburb Council Area Median Value Median Rent1. Battery Point Hobart $1,132,555 $6502. Hobart Hobart $573,121 $5603. Sandy Bay Hobart $832,304 $5604. Tranmere Clarence $618,593 $5405. Taroona Kingborough $559,833 $5006. West Hobart Hobart $631,580 $4837. North Hobart Hobart $582,143 $4808. South Hobart Hobart $526,710 $4659. Mount Stuart Hobart $584,614 $46010. New Town Hobart $525,949 $460
Lowest Median Advertised Rents (Weekly)
Highest Total Value of Sales# Suburb Council Area Median Value Total Sales1. Sandy Bay Hobart $832,304 $153,161,9742. Kingston Kingborough $411,017 $77,154,6993. Howrah Clarence $439,492 $69,787,4954. West Hobart Hobart $631,580 $59,314,3745. Glenorchy Glenorchy $292,310 $58,825,1476. Lindisfarne Clarence $442,964 $54,874,1497. New Town Hobart $525,949 $51,169,7088. Blackmans Bay Kingborough $477,649 $51,010,9009. South Hobart Hobart $526,710 $43,157,37010. Lenah Valley Hobart $468,809 $42,834,503
Units
# Suburb Council Area Median Value Yield1. Claremont Glenorchy $216,482 7.3%2. Brighton Brighton $220,149 6.7%3. Sorell Sorell $243,340 6.7%4. Moonah Glenorchy $230,564 6.7%5. Glenorchy Glenorchy $232,543 6.6%6. West Moonah Glenorchy $277,688 6.1%7. South Hobart Hobart $353,472 5.9%8. Kingston Kingborough $315,808 5.8%9. Mount Nelson Hobart $288,638 5.8%10. West Hobart Hobart $452,141 5.8%
# Suburb Council Area Median Value Yield1. Risdon Vale Clarence $195,663 8.5%2. Clarendon Vale Clarence $158,246 8.2%3. Rokeby Clarence $225,323 7.3%4. Warrane Clarence $258,019 6.6%5. Glenorchy Glenorchy $292,310 6.3%6. Mornington Clarence $304,944 6.1%7. Lutana Glenorchy $343,122 5.8%8. West Moonah Glenorchy $369,735 5.6%9. Geilston Bay Clarence $410,175 5.6%10. Moonah Glenorchy $350,745 5.6%
# Suburb Council Area Median Value Yield1. Moonah Glenorchy $230,564 6.7%2. Glenorchy Glenorchy $232,543 6.6%3. West Moonah Glenorchy $277,688 6.1%4. South Hobart Hobart $353,472 5.9%5. Mount Nelson Hobart $288,638 5.8%6. West Hobart Hobart $452,141 5.8%7. New Town Hobart $293,725 5.8%8. Howrah Clarence $327,882 5.7%9. Lenah Valley Hobart $320,015 5.6%10. Bellerive Clarence $323,719 5.6%
# Suburb Council Area Median Value Median Rent1. Hobart Hobart $540,018 $5002. Battery Point Hobart $592,247 $4503. North Hobart Hobart $418,800 $4384. Dynnyrne Hobart $372,063 $3955. Sandy Bay Hobart $463,584 $3906. West Hobart Hobart $452,141 $3857. South Hobart Hobart $353,472 $3458. Kingston Kingborough $315,808 $3409. Howrah Clarence $327,882 $33010. Blackmans Bay Kingborough $326,236 $328
# Suburb Council Area Median Value Median Rent1. Primrose Sands Sorell $204,623 $2502. Clarendon Vale Clarence $158,246 $2503. Gagebrook Brighton $156,712 $2604. Bridgewater Brighton $186,166 $2755. New Norfolk Derwent Valley $210,737 $2806. Rokeby Clarence $225,323 $2907. Risdon Vale Clarence $195,663 $2908. Dodges Ferry Sorell $293,760 $3059. Chigwell Glenorchy $237,522 $32010. Warrane Clarence $258,019 $330
# Suburb Council Area Median Value Median Rent1. Claremont Glenorchy $216,482 $2602. Moonah Glenorchy $230,564 $2703. Brighton Brighton $220,149 $2804. West Moonah Glenorchy $277,688 $2805. Glenorchy Glenorchy $232,543 $2806. Mount Stuart Hobart $302,829 $2887. Mount Nelson Hobart $288,638 $2888. New Town Hobart $293,725 $3009. Lenah Valley Hobart $320,015 $31010. Margate Kingborough $297,825 $315
# Suburb Council Area Median Value Total Sales1. Sandy Bay Hobart $463,584 $57,885,7652. Battery Point Hobart $592,247 $28,062,6663. Glenorchy Glenorchy $232,543 $26,685,9264. Kingston Kingborough $515,226 $25,604,8005. Hobart Hobart $540,018 $24,611,4006. Howrah Clarence $327,882 $19,794,8107. Claremont Glenorchy $216,482 $18,599,0008. Bellerive Clarence $323,719 $17,195,3009. Blackmans Bay Kingborough $326,236 $15,206,67310. South Hobart Hobart $353,472 $12,190,335
Hobart Top 10

30 | CoreLogic Best of the Best 2017
© Copyright 2018 | RP Data Pty Ltd trading as CoreLogic Asia Pacific (CoreLogic) and its licensors are the sole and exclusive owners of all rights, title and interest (including intellectual property rights) subsisting in this publication including any data, analytics, statistics and other information. All rights reserved.

CoreLogic Best of the Best 2017 | 31
© Copyright 2018 | RP Data Pty Ltd trading as CoreLogic Asia Pacific (CoreLogic) and its licensors are the sole and exclusive owners of all rights, title and interest (including intellectual property rights) subsisting in this publication including any data, analytics, statistics and other information. All rights reserved.
DarwinDarwin’s Top Performing Suburbs 2017
Houses Units
Highest Median Value Fannie Bay, Darwin NT
$1,058,494 Bayview, Darwin NT
$638,483
Lowest Median Value Moulden, Darwin NT
$393,424 Gray, Darwin NT
$285,996
Lowest Median Value within 10km of a Capital City
Anula, Darwin NT
$513,568 Millner, Darwin NT
$351,028
Greatest 12 month Change in Median Values
Coconut Grove, Darwin NT
5.1% Driver, Darwin NT
10.4%
Greatest 5 year Change in Median Values
Johnston, Darwin NT
31.6% Fannie Bay, Darwin NT
19.1%
Highest Gross Rental Yields Johnston, Darwin NT
5.4% Nightcliff, Darwin NT
5.8%
Highest Gross Rental Yields within 10kms of a Capital City
Jingili, Darwin NT
5.0% Nightcliff, Darwin NT
5.8%
Highest Median Weekly Advertised Rents
Bayview, Darwin NT
$850 Bayview, Darwin NT
$565
Lowest Median Weekly Advertised Rents
Moulden, Darwin NT
$400 Woodroffe, Darwin NT
$310
Highest Total Value of Sales
Nightcliff, Darwin NT
$49,682,000 Darwin City, Darwin NT
$38,366,534

32 | CoreLogic Best of the Best 2017
© Copyright 2018 | RP Data Pty Ltd trading as CoreLogic Asia Pacific (CoreLogic) and its licensors are the sole and exclusive owners of all rights, title and interest (including intellectual property rights) subsisting in this publication including any data, analytics, statistics and other information. All rights reserved.
Darwin Top 10
Highest Median Value# Suburb Council Area # Sold Median value1. Fannie Bay Darwin 16 $1,058,4942. Virginia Litchfield 17 $800,2403. Lyons Darwin 18 $785,2584. Nightcliff Darwin 31 $776,2825. Parap Darwin 15 $756,3326. Girraween Litchfield 11 $753,2917. Howard Springs Litchfield 42 $737,9998. Stuart Park Darwin 17 $733,0869. Marrara Darwin 11 $707,73910. Bees Creek Litchfield 12 $706,377
Lowest Median Value
Lowest Median Value within 10kms of a Capital City
Greatest 12 month Change# Suburb Council Area # Sold Median Value Change1. Coconut Grove Darwin 13 $686,030 5.1%2. Bees Creek Litchfield 12 $706,377 3.6%3. Rapid Creek Darwin 28 $705,091 2.9%4. Anula Darwin 33 $513,568 2.4%5. Johnston Palmerston 10 $619,648 1.9%6. Nightcliff Darwin 31 $776,282 0.7%
Greatest 5 year Change# Suburb Council Area # Sold Median Value Change1. Johnston Palmerston 10 $619,648 31.6%2. Virginia Litchfield 17 $800,240 16.0%3. Howard Springs Litchfield 42 $737,999 12.6%4. Rapid Creek Darwin 28 $705,091 11.2%5. Herbert Litchfield 15 $685,106 6.6%6. Humpty Doo Litchfield 48 $664,999 5.8%7. Bellamack Palmerston 22 $650,558 4.4%8. Girraween Litchfield 11 $753,291 4.1%9. Nightcliff Darwin 31 $776,282 3.2%10. Bakewell Palmerston 21 $496,822 1.5%
# Suburb Council Area # Sold Median value1. Bayview Darwin 19 $638,4832. Fannie Bay Darwin 70 $514,6363. Berrimah Unincorporated NT 12 $493,6014. The Gardens Darwin 11 $487,8705. Larrakeyah Darwin 69 $487,7516. Woolner Darwin 13 $460,3237. Stuart Park Darwin 56 $450,5408. Darwin City Darwin 87 $436,6319. Johnston Palmerston 19 $418,72110. Parap Darwin 23 $412,438
# Suburb Council Area # Sold Median value1. Moulden Palmerston 17 $393,4242. Gray Palmerston 22 $423,2643. Woodroffe Palmerston 35 $448,0004. Driver Palmerston 27 $460,0785. Karama Darwin 54 $484,0626. Bakewell Palmerston 21 $496,8227. Malak Darwin 29 $506,1438. Zuccoli Palmerston 184 $509,2519. Wagaman Darwin 23 $512,80110. Anula Darwin 33 $513,568
# Suburb Council Area # Sold Median value1. Gray Palmerston 13 $285,9962. Karama Darwin 10 $300,4653. Driver Palmerston 10 $317,7844. Bakewell Palmerston 22 $324,8455. Millner Darwin 18 $351,0286. Leanyer Darwin 17 $362,1057. Coconut Grove Darwin 32 $367,5848. Nightcliff Darwin 51 $367,7719. Rosebery Palmerston 10 $368,53810. Marrara Darwin 19 $370,625
# Suburb Council Area # Sold Median Value Change1. Driver Palmerston 10 $317,784 10.4%2. The Gardens Darwin 11 $487,870 2.8%3. Johnston Palmerston 19 $418,721 2.3%4. Larrakeyah Darwin 69 $487,751 0.6%5. Bakewell Palmerston 22 $324,845 0.4%
# Suburb Council Area # Sold Median Value Change1. Fannie Bay Darwin 70 $514,636 19.1%2. Nightcliff Darwin 51 $367,771 13.8%3. Larrakeyah Darwin 69 $487,751 7.4%4. Bayview Darwin 19 $638,483 -1.7%5. Driver Palmerston 10 $317,784 -4.5%6. Millner Darwin 18 $351,028 -5.6%7. Coconut Grove Darwin 32 $367,584 -5.8%8. Rapid Creek Darwin 33 $401,425 -7.2%9. Stuart Park Darwin 56 $450,540 -7.4%10. Rosebery Palmerston 10 $368,538 -8.7%
Houses Units
# Suburb Council Area # Sold Median value1. Anula Darwin 33 $513,5682. Millner Darwin 19 $519,0833. Alawa Darwin 27 $532,0244. Jingili Darwin 27 $539,1855. Moil Darwin 25 $544,6786. Ludmilla Darwin 20 $635,8997. Coconut Grove Darwin 13 $686,0308. Rapid Creek Darwin 28 $705,0919. Marrara Darwin 11 $707,73910. Stuart Park Darwin 17 $733,086
# Suburb Council Area # Sold Median value1. Millner Darwin 18 $351,0282. Coconut Grove Darwin 32 $367,5843. Nightcliff Darwin 51 $367,7714. Marrara Darwin 19 $370,6255. Rapid Creek Darwin 33 $401,4256. Parap Darwin 23 $412,4387. Darwin City Darwin 87 $436,6318. Stuart Park Darwin 56 $450,5409. Woolner Darwin 13 $460,32310. Larrakeyah Darwin 69 $487,751

CoreLogic Best of the Best 2017 | 33
© Copyright 2018 | RP Data Pty Ltd trading as CoreLogic Asia Pacific (CoreLogic) and its licensors are the sole and exclusive owners of all rights, title and interest (including intellectual property rights) subsisting in this publication including any data, analytics, statistics and other information. All rights reserved.
Houses
Highest Gross Rental Yields# Suburb Council Area Median Value Yield1. Johnston Palmerston $619,648 5.4%2. Woodroffe Palmerston $448,000 5.4%3. Farrar Palmerston $580,160 5.4%4. Moulden Palmerston $393,424 5.1%5. Malak Darwin $506,143 5.1%6. Jingili Darwin $539,185 5.0%7. Wanguri Darwin $584,342 5.0%8. Wulagi Darwin $519,902 5.0%9. Karama Darwin $484,062 5.0%10. Driver Palmerston $460,078 4.9%
Highest Gross Rental Yields within 10kms of a Capital City
Highest Median Advertised Rents (Weekly)# Suburb Council Area Median Value Median Rent1. Bayview Darwin $972,811 $8502. Larrakeyah Darwin $1,370,761 $8003. Fannie Bay Darwin $1,058,494 $7254. Parap Darwin $756,332 $7155. Nightcliff Darwin $776,282 $6506. Virginia Litchfield $800,240 $6457. Howard Springs Litchfield $737,999 $6008. Bellamack Palmerston $650,558 $6009. Johnston Palmerston $619,648 $59010. Marrara Darwin $707,739 $590
Lowest Median Advertised Rents (Weekly)
Highest Total Value of Sales# Suburb Council Area Median Value Total Sales1. Nightcliff Darwin $776,282 $49,682,0002. Zuccoli Palmerston $509,251 $39,129,4523. Humpty Doo Litchfield $664,999 $28,786,5004. Leanyer Darwin $566,807 $27,881,6055. Durack Palmerston $528,409 $27,778,5006. Gunn Palmerston $534,795 $26,613,4777. Karama Darwin $484,062 $21,589,7338. Rosebery Palmerston $584,427 $19,307,2009. Howard Springs Litchfield $737,999 $18,452,37910. Anula Darwin $513,568 $17,651,200
Units
# Suburb Council Area Median Value Yield1. Nightcliff Darwin $367,771 5.8%2. Darwin City Darwin $436,631 5.7%3. Bakewell Palmerston $324,845 5.5%4. Rapid Creek Darwin $401,425 5.5%5. Millner Darwin $351,028 5.5%6. Karama Darwin $300,465 5.5%7. Coconut Grove Darwin $367,584 5.4%8. Driver Palmerston $317,784 5.3%9. Woolner Darwin $460,323 5.3%10. Parap Darwin $412,438 5.3%
# Suburb Council Area Median Value Yield1. Jingili Darwin $539,185 5.0%2. Anula Darwin $513,568 4.9%3. Moil Darwin $544,678 4.8%4. Ludmilla Darwin $635,899 4.8%5. Alawa Darwin $532,024 4.8%6. Rapid Creek Darwin $705,091 4.7%7. Parap Darwin $756,332 4.7%8. Stuart Park Darwin $733,086 4.5%9. Marrara Darwin $707,739 4.5%10. Millner Darwin $519,083 4.5%
# Suburb Council Area Median Value Yield1. Nightcliff Darwin $367,771 5.8%2. Darwin City Darwin $436,631 5.7%3. Rapid Creek Darwin $401,425 5.5%4. Millner Darwin $351,028 5.5%5. Coconut Grove Darwin $367,584 5.4%6. Woolner Darwin $460,323 5.3%7. Parap Darwin $412,438 5.3%8. Larrakeyah Darwin $487,751 5.3%9. Stuart Park Darwin $450,540 5.3%10. The Gardens Darwin $487,870 5.2%
# Suburb Council Area Median Value Median Rent1. Bayview Darwin $638,483 $5652. Larrakeyah Darwin $487,751 $4953. Darwin City Darwin $436,631 $4604. Woolner Darwin $460,323 $4505. Parap Darwin $412,438 $4306. Stuart Park Darwin $450,540 $4307. Fannie Bay Darwin $514,636 $4208. The Gardens Darwin $487,870 $4209. Johnston Palmerston $418,721 $40010. Rosebery Palmerston $368,538 $400
# Suburb Council Area Median Value Median Rent1. Moulden Palmerston $393,424 $4002. Gray Palmerston $423,264 $4203. Woodroffe Palmerston $448,000 $4404. Driver Palmerston $460,078 $4505. Millner Darwin $519,083 $4506. Bakewell Palmerston $496,822 $4607. Karama Darwin $484,062 $4708. Wagaman Darwin $512,801 $4759. Moil Darwin $544,678 $48510. Gunn Palmerston $534,795 $490
# Suburb Council Area Median Value Median Rent1. Woodroffe Palmerston $290,763 $3102. Moulden Palmerston $296,995 $3203. Driver Palmerston $317,784 $3204. Gray Palmerston $285,996 $3255. Malak Darwin $308,448 $3306. Karama Darwin $300,465 $3307. Nightcliff Darwin $367,771 $3508. Bakewell Palmerston $324,845 $3509. Millner Darwin $351,028 $35010. Marrara Darwin $370,625 $350
# Suburb Council Area Median Value Total Sales1. Darwin City Darwin $436,631 $38,366,5342. Fannie Bay Darwin $514,636 $31,138,0003. Stuart Park Darwin $450,540 $24,608,5004. Larrakeyah Darwin $487,751 $22,742,3245. Nightcliff Darwin $367,771 $18,173,0906. Coconut Grove Darwin $367,584 $15,101,2507. Rapid Creek Darwin $401,425 $12,302,0008. Parap Darwin $412,438 $9,507,7509. Berrimah Unincorporated NT $493,601 $8,672,50010. Millner Darwin $351,028 $6,062,000
Darwin Top 10

34 | CoreLogic Best of the Best 2017
© Copyright 2018 | RP Data Pty Ltd trading as CoreLogic Asia Pacific (CoreLogic) and its licensors are the sole and exclusive owners of all rights, title and interest (including intellectual property rights) subsisting in this publication including any data, analytics, statistics and other information. All rights reserved.
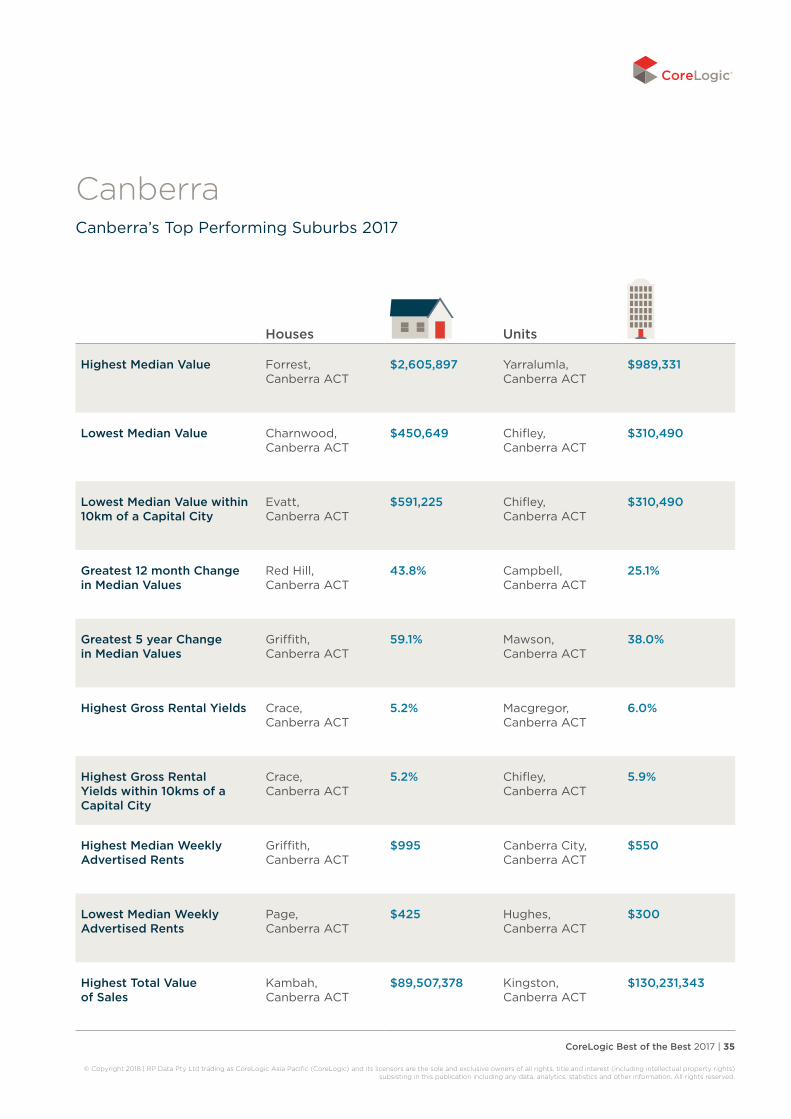
CoreLogic Best of the Best 2017 | 35
© Copyright 2018 | RP Data Pty Ltd trading as CoreLogic Asia Pacific (CoreLogic) and its licensors are the sole and exclusive owners of all rights, title and interest (including intellectual property rights) subsisting in this publication including any data, analytics, statistics and other information. All rights reserved.
CanberraCanberra’s Top Performing Suburbs 2017
Houses Units
Highest Median Value Forrest, Canberra ACT
$2,605,897 Yarralumla, Canberra ACT
$989,331
Lowest Median Value Charnwood, Canberra ACT
$450,649 Chifley, Canberra ACT
$310,490
Lowest Median Value within 10km of a Capital City
Evatt, Canberra ACT
$591,225 Chifley, Canberra ACT
$310,490
Greatest 12 month Change in Median Values
Red Hill, Canberra ACT
43.8% Campbell, Canberra ACT
25.1%
Greatest 5 year Change in Median Values
Griffith, Canberra ACT
59.1% Mawson, Canberra ACT
38.0%
Highest Gross Rental Yields Crace, Canberra ACT
5.2% Macgregor, Canberra ACT
6.0%
Highest Gross Rental Yields within 10kms of a Capital City
Crace, Canberra ACT
5.2% Chifley, Canberra ACT
5.9%
Highest Median Weekly Advertised Rents
Griffith, Canberra ACT
$995 Canberra City, Canberra ACT
$550
Lowest Median Weekly Advertised Rents
Page, Canberra ACT
$425 Hughes, Canberra ACT
$300
Highest Total Value of Sales
Kambah, Canberra ACT
$89,507,378 Kingston, Canberra ACT
$130,231,343
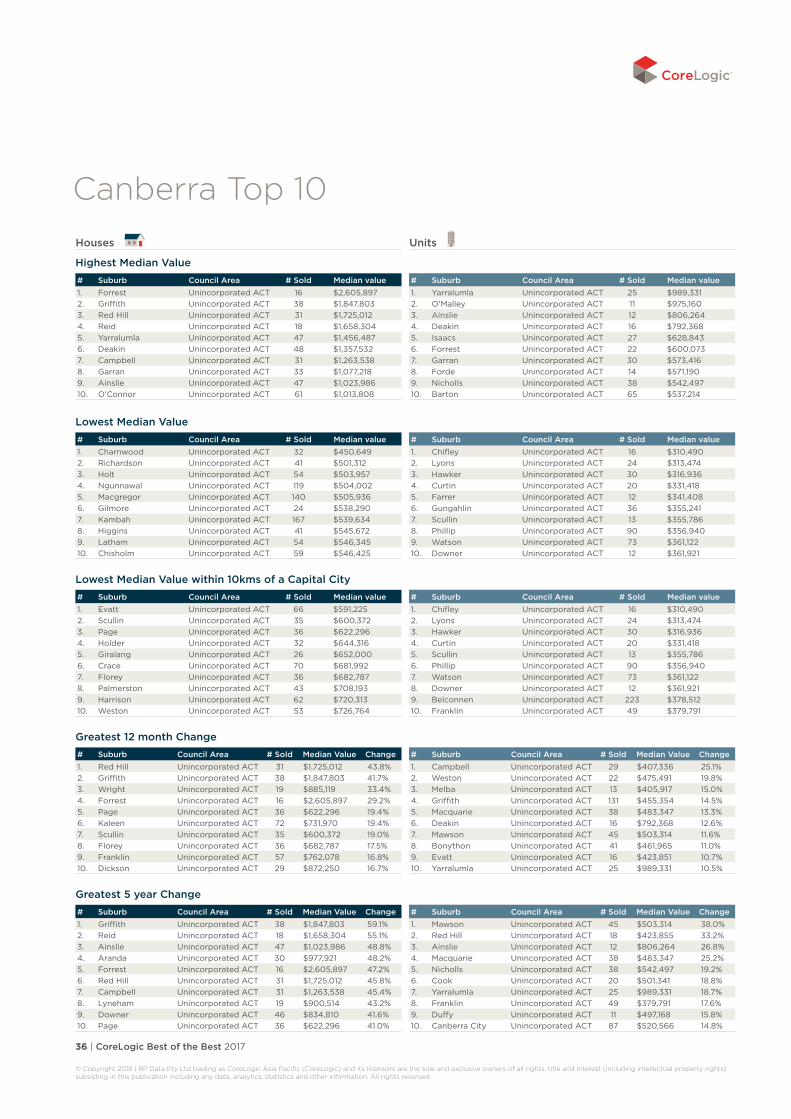
36 | CoreLogic Best of the Best 2017
© Copyright 2018 | RP Data Pty Ltd trading as CoreLogic Asia Pacific (CoreLogic) and its licensors are the sole and exclusive owners of all rights, title and interest (including intellectual property rights) subsisting in this publication including any data, analytics, statistics and other information. All rights reserved.
Canberra Top 10
Highest Median Value# Suburb Council Area # Sold Median value1. Forrest Unincorporated ACT 16 $2,605,8972. Griffith Unincorporated ACT 38 $1,847,8033. Red Hill Unincorporated ACT 31 $1,725,0124. Reid Unincorporated ACT 18 $1,658,3045. Yarralumla Unincorporated ACT 47 $1,456,4876. Deakin Unincorporated ACT 48 $1,357,5327. Campbell Unincorporated ACT 31 $1,263,5388. Garran Unincorporated ACT 33 $1,077,2189. Ainslie Unincorporated ACT 47 $1,023,98610. O'Connor Unincorporated ACT 61 $1,013,808
Lowest Median Value
Lowest Median Value within 10kms of a Capital City
Greatest 12 month Change# Suburb Council Area # Sold Median Value Change1. Red Hill Unincorporated ACT 31 $1,725,012 43.8%2. Griffith Unincorporated ACT 38 $1,847,803 41.7%3. Wright Unincorporated ACT 19 $885,119 33.4%4. Forrest Unincorporated ACT 16 $2,605,897 29.2%5. Page Unincorporated ACT 36 $622,296 19.4%6. Kaleen Unincorporated ACT 72 $731,970 19.4%7. Scullin Unincorporated ACT 35 $600,372 19.0%8. Florey Unincorporated ACT 36 $682,787 17.5%9. Franklin Unincorporated ACT 57 $762,078 16.8%10. Dickson Unincorporated ACT 29 $872,250 16.7%
Greatest 5 year Change# Suburb Council Area # Sold Median Value Change1. Griffith Unincorporated ACT 38 $1,847,803 59.1%2. Reid Unincorporated ACT 18 $1,658,304 55.1%3. Ainslie Unincorporated ACT 47 $1,023,986 48.8%4. Aranda Unincorporated ACT 30 $977,921 48.2%5. Forrest Unincorporated ACT 16 $2,605,897 47.2%6. Red Hill Unincorporated ACT 31 $1,725,012 45.8%7. Campbell Unincorporated ACT 31 $1,263,538 45.4%8. Lyneham Unincorporated ACT 19 $900,514 43.2%9. Downer Unincorporated ACT 46 $834,810 41.6%10. Page Unincorporated ACT 36 $622,296 41.0%
# Suburb Council Area # Sold Median value1. Yarralumla Unincorporated ACT 25 $989,3312. O'Malley Unincorporated ACT 11 $975,1603. Ainslie Unincorporated ACT 12 $806,2644. Deakin Unincorporated ACT 16 $792,3685. Isaacs Unincorporated ACT 27 $628,8436. Forrest Unincorporated ACT 22 $600,0737. Garran Unincorporated ACT 30 $573,4168. Forde Unincorporated ACT 14 $571,1909. Nicholls Unincorporated ACT 38 $542,49710. Barton Unincorporated ACT 65 $537,214
# Suburb Council Area # Sold Median value1. Charnwood Unincorporated ACT 32 $450,6492. Richardson Unincorporated ACT 41 $501,3123. Holt Unincorporated ACT 54 $503,9574. Ngunnawal Unincorporated ACT 119 $504,0025. Macgregor Unincorporated ACT 140 $505,9366. Gilmore Unincorporated ACT 24 $538,2907. Kambah Unincorporated ACT 167 $539,6348. Higgins Unincorporated ACT 41 $545,6729. Latham Unincorporated ACT 54 $546,34510. Chisholm Unincorporated ACT 59 $546,425
# Suburb Council Area # Sold Median value1. Chifley Unincorporated ACT 16 $310,4902. Lyons Unincorporated ACT 24 $313,4743. Hawker Unincorporated ACT 30 $316,9364. Curtin Unincorporated ACT 20 $331,4185. Farrer Unincorporated ACT 12 $341,4086. Gungahlin Unincorporated ACT 36 $355,2417. Scullin Unincorporated ACT 13 $355,7868. Phillip Unincorporated ACT 90 $356,9409. Watson Unincorporated ACT 73 $361,12210. Downer Unincorporated ACT 12 $361,921
# Suburb Council Area # Sold Median Value Change1. Campbell Unincorporated ACT 29 $407,336 25.1%2. Weston Unincorporated ACT 22 $475,491 19.8%3. Melba Unincorporated ACT 13 $405,917 15.0%4. Griffith Unincorporated ACT 131 $455,354 14.5%5. Macquarie Unincorporated ACT 38 $483,347 13.3%6. Deakin Unincorporated ACT 16 $792,368 12.6%7. Mawson Unincorporated ACT 45 $503,314 11.6%8. Bonython Unincorporated ACT 41 $461,965 11.0%9. Evatt Unincorporated ACT 16 $423,851 10.7%10. Yarralumla Unincorporated ACT 25 $989,331 10.5%
# Suburb Council Area # Sold Median Value Change1. Mawson Unincorporated ACT 45 $503,314 38.0%2. Red Hill Unincorporated ACT 18 $423,855 33.2%3. Ainslie Unincorporated ACT 12 $806,264 26.8%4. Macquarie Unincorporated ACT 38 $483,347 25.2%5. Nicholls Unincorporated ACT 38 $542,497 19.2%6. Cook Unincorporated ACT 20 $501,341 18.8%7. Yarralumla Unincorporated ACT 25 $989,331 18.7%8. Franklin Unincorporated ACT 49 $379,791 17.6%9. Duffy Unincorporated ACT 11 $497,168 15.8%10. Canberra City Unincorporated ACT 87 $520,566 14.8%
Houses Units
# Suburb Council Area # Sold Median value1. Evatt Unincorporated ACT 66 $591,2252. Scullin Unincorporated ACT 35 $600,3723. Page Unincorporated ACT 36 $622,2964. Holder Unincorporated ACT 32 $644,3165. Giralang Unincorporated ACT 26 $652,0006. Crace Unincorporated ACT 70 $681,9927. Florey Unincorporated ACT 36 $682,7878. Palmerston Unincorporated ACT 43 $708,1939. Harrison Unincorporated ACT 62 $720,31310. Weston Unincorporated ACT 53 $726,764
# Suburb Council Area # Sold Median value1. Chifley Unincorporated ACT 16 $310,4902. Lyons Unincorporated ACT 24 $313,4743. Hawker Unincorporated ACT 30 $316,9364. Curtin Unincorporated ACT 20 $331,4185. Scullin Unincorporated ACT 13 $355,7866. Phillip Unincorporated ACT 90 $356,9407. Watson Unincorporated ACT 73 $361,1228. Downer Unincorporated ACT 12 $361,9219. Belconnen Unincorporated ACT 223 $378,51210. Franklin Unincorporated ACT 49 $379,791

CoreLogic Best of the Best 2017 | 37
© Copyright 2018 | RP Data Pty Ltd trading as CoreLogic Asia Pacific (CoreLogic) and its licensors are the sole and exclusive owners of all rights, title and interest (including intellectual property rights) subsisting in this publication including any data, analytics, statistics and other information. All rights reserved.
Houses
Highest Gross Rental Yields# Suburb Council Area Median Value Yield1. Crace Unincorporated ACT $681,992 5.2%2. Charnwood Unincorporated ACT $450,649 5.1%3. Macgregor Unincorporated ACT $505,936 5.0%4. Bonner Unincorporated ACT $645,052 5.0%5. Gowrie Unincorporated ACT $585,131 5.0%6. Dunlop Unincorporated ACT $569,762 4.9%7. Ngunnawal Unincorporated ACT $504,002 4.9%8. Gordon Unincorporated ACT $615,774 4.9%9. Banks Unincorporated ACT $553,859 4.9%10. Wanniassa Unincorporated ACT $596,134 4.9%
Highest Gross Rental Yields within 10kms of a Capital City
Highest Median Advertised Rents (Weekly)# Suburb Council Area Median Value Median Rent1. Griffith Unincorporated ACT $1,847,803 $9952. Campbell Unincorporated ACT $1,263,538 $7903. Red Hill Unincorporated ACT $1,725,012 $7504. Deakin Unincorporated ACT $1,357,532 $6805. Yarralumla Unincorporated ACT $1,456,487 $6806. Isaacs Unincorporated ACT $932,353 $6787. Chapman Unincorporated ACT $912,611 $6508. Garran Unincorporated ACT $1,077,218 $6459. Bruce Unincorporated ACT $825,361 $63510. Ainslie Unincorporated ACT $1,023,986 $635
Lowest Median Advertised Rents (Weekly)
Highest Total Value of Sales# Suburb Council Area Median Value Total Sales1. Kambah Unincorporated ACT $539,634 $89,057,3782. Yarralumla Unincorporated ACT $1,456,487 $80,747,0003. Casey Unincorporated ACT $607,985 $66,045,5624. Griffith Unincorporated ACT $1,847,803 $65,351,5005. Bonner Unincorporated ACT $645,052 $65,158,9396. Braddon Unincorporated ACT $1,064,707 $64,920,0007. Curtin Unincorporated ACT $928,400 $62,572,0008. Wanniassa Unincorporated ACT $596,134 $61,723,6069. Macgregor Unincorporated ACT $505,936 $60,785,82210. Nicholls Unincorporated ACT $851,118 $59,403,000
Units
# Suburb Council Area Median Value Yield1. Macgregor Unincorporated ACT $367,721 6.0%2. Chifley Unincorporated ACT $310,490 5.9%3. Holt Unincorporated ACT $370,825 5.9%4. Gungahlin Unincorporated ACT $355,241 5.8%5. Watson Unincorporated ACT $361,122 5.8%6. Franklin Unincorporated ACT $379,791 5.8%7. Harrison Unincorporated ACT $389,567 5.7%8. Phillip Unincorporated ACT $356,940 5.7%9. Greenway Unincorporated ACT $415,343 5.6%10. Wright Unincorporated ACT $400,399 5.6%
# Suburb Council Area Median Value Yield1. Crace Unincorporated ACT $681,992 5.2%2. Franklin Unincorporated ACT $762,078 4.8%3. Harrison Unincorporated ACT $720,313 4.7%4. Evatt Unincorporated ACT $591,225 4.6%5. Palmerston Unincorporated ACT $708,193 4.5%6. Giralang Unincorporated ACT $652,000 4.4%7. Florey Unincorporated ACT $682,787 4.3%8. Bruce Unincorporated ACT $825,361 4.3%9. Scullin Unincorporated ACT $600,372 4.3%10. Mckellar Unincorporated ACT $774,035 4.2%
# Suburb Council Area Median Value Yield1. Chifley Unincorporated ACT $310,490 5.9%2. Watson Unincorporated ACT $361,122 5.8%3. Franklin Unincorporated ACT $379,791 5.8%4. Harrison Unincorporated ACT $389,567 5.7%5. Phillip Unincorporated ACT $356,940 5.7%6. Wright Unincorporated ACT $400,399 5.6%7. Florey Unincorporated ACT $398,250 5.6%8. Mawson Unincorporated ACT $503,314 5.6%9. Belconnen Unincorporated ACT $378,512 5.6%10. Bruce Unincorporated ACT $388,056 5.6%
# Suburb Council Area Median Value Median Rent1. Canberra City Unincorporated ACT $520,566 $5502. Barton Unincorporated ACT $537,214 $5403. Forrest Unincorporated ACT $600,073 $5304. Garran Unincorporated ACT $573,416 $5185. Isaacs Unincorporated ACT $628,843 $5106. Kingston Unincorporated ACT $515,226 $4807. Yarralumla Unincorporated ACT $989,331 $4708. Amaroo Unincorporated ACT $481,894 $4709. Deakin Unincorporated ACT $792,368 $46510. Bonner Unincorporated ACT $453,408 $460
# Suburb Council Area Median Value Median Rent1. Page Unincorporated ACT $622,296 $4252. Charnwood Unincorporated ACT $450,649 $4303. Ngunnawal Unincorporated ACT $504,002 $4304. Holt Unincorporated ACT $503,957 $4505. Macgregor Unincorporated ACT $505,936 $4506. Chisholm Unincorporated ACT $546,425 $4607. Scullin Unincorporated ACT $600,372 $4638. Rivett Unincorporated ACT $590,796 $4659. Macquarie Unincorporated ACT $727,175 $47010. Conder Unincorporated ACT $604,357 $470
# Suburb Council Area Median Value Median Rent1. Hughes Unincorporated ACT $258,320 $3002. Hackett Unincorporated ACT $355,072 $3183. Red Hill Unincorporated ACT $423,855 $3304. Curtin Unincorporated ACT $331,418 $3405. Campbell Unincorporated ACT $407,336 $3436. Gungahlin Unincorporated ACT $355,241 $3507. Mawson Unincorporated ACT $503,314 $3508. Lyons Unincorporated ACT $313,474 $3509. Holt Unincorporated ACT $370,825 $35310. Chifley Unincorporated ACT $310,490 $353
# Suburb Council Area Median Value Total Sales1. Kingston Unincorporated ACT $515,226 $130,231,3432. Belconnen Unincorporated ACT $378,512 $91,406,8783. Griffith Unincorporated ACT $455,354 $73,798,4494. Braddon Unincorporated ACT $443,505 $58,912,9815. Canberra City Unincorporated ACT $520,566 $46,814,7886. Bruce Unincorporated ACT $388,056 $46,623,4707. Lawson Unincorporated ACT $504,754 $40,512,7518. Turner Unincorporated ACT $498,587 $39,304,8009. Narrabundah Unincorporated ACT $448,253 $26,867,75010. Lyneham Unincorporated ACT $404,077 $25,282,000
Canberra Top 10

38 | CoreLogic Best of the Best 2017
© Copyright 2018 | RP Data Pty Ltd trading as CoreLogic Asia Pacific (CoreLogic) and its licensors are the sole and exclusive owners of all rights, title and interest (including intellectual property rights) subsisting in this publication including any data, analytics, statistics and other information. All rights reserved.
Important to note – when using the data supplied to compile an article please keep in mind the following:
► All data highlighted is current to November 2017. (Total Value of Sales to September 2017)
► Median values are based on the middle value of all automated valuations across the subject suburb.
► The change in median value looks at the difference in median values over a 12 month period.
► The five year change in median values represents the total change over the five year period.
► Included in the analysis are only those suburbs that had at least 10 sales over the past year and a minimum of 100 AVM observations.
► Rental rates quoted are based on the median across all rental advertisements over the 12 months to November 2017.
► Gross rental yields are calculated across those properties advertised for rent. The annualised rental listing is divided by the valuation estimate to derive a gross yield for individual properties. The displayed gross yield is the median across the region over the period.
► Included in the analysis are only those suburbs that had at least 20 rental observations and >200 dwellings.
► Total Value of Sales data The total value of all property transactions recorded over the 12 months to September 2017.
In compiling this publication, RP Data Pty Ltd trading as CoreLogic has relied upon information supplied by a number of external sources. CoreLogic does not warrant its accuracy or completeness and to the full extent allowed by law excludes liability in contract, tort or otherwise, for any loss or damage sustained by subscribers, or by any other person or body corporate arising from or in connection with the supply or use of the whole or any part of the information in this publication through any cause whatsoever and limits any liability it may have to the amount paid to CoreLogic for the supply of such information.

CoreLogic Best of the Best 2017 | 39
© Copyright 2018 | RP Data Pty Ltd trading as CoreLogic Asia Pacific (CoreLogic) and its licensors are the sole and exclusive owners of all rights, title and interest (including intellectual property rights) subsisting in this publication including any data, analytics, statistics and other information. All rights reserved.
In compiling this publication, RP Data Pty Ltd trading as CoreLogic has relied upon information supplied by a number of external sources. CoreLogic does not warrant its accuracy or completeness and to the full extent allowed by law excludes liability in contract, tort or otherwise, for any loss or damage sustained by subscribers, or by any other person or body corporate arising from or in connection with the supply or use of the whole or any part of the information in this publication through any cause whatsoever and limits any liability it may have to the amount paid to CoreLogic for the supply of such information.
Queensland DataBased on or contains data provided by the State of Queensland (Department of Natural Resources and Mines) 2016. In consideration of the State permitting use of this data you acknowledge and agree that the State gives no warranty in relation to the data (including accuracy, reliability, completeness, currency or suitability) and accepts no liability (including without limitation, liability in negligence) for any loss, damage or costs (including consequential damage) relating to any use of the data. Data must not be used for direct marketing or be used in breach of the privacy laws.
South Australian DataThis information is based on data supplied by the South Australian Government and is published by permission. The South Australian Government does not accept any responsibility for the accuracy or completeness of the published information or suitability for any purpose of the published information or the underlying data.
New South Wales DataContains property sales information provided under licence from the Land and Property Information (“LPI”). CoreLogic is authorised as a Property Sales Information provider by the LPI.
Victorian DataThe State of Victoria owns the copyright in the Property Sales Data which constitutes the basis of this report and reproduction of that data in any way without the consent of the State of Victoria will constitute a breach of the Copyright Act 1968 (Cth). The State of Victoria does not warrant the accuracy or completeness of the information contained in this report and any person using or relying upon such information does so on the basis that the State of Victoria accepts no responsibility or liability whatsoever for any errors, faults, defects or omissions in the information supplied.
Western Australian DataBased on information provided by and with the permission of the Western Australian Land Information Authority (2016) trading as Landgate.
Australian Capital Territory DataThe Territory Data is the property of the Australian Capital Territory. No part of it may in any form or by any means (electronic, mechanical, microcopying, photocopying, recording or otherwise) be reproduced, stored in a retrieval system or transmitted without prior written permission. Enquiries should be directed to: Director, Customer Services ACT Planning and Land Authority GPO Box 1908 Canberra ACT 2601.
Tasmanian DataThis product incorporates data that is copyright owned by the Crown in Right of Tasmania. The data has been used in the product with the permission of the Crown in Right of Tasmania. The Crown in Right of Tasmania and its employees and agents:
a. give no warranty regarding the data’s accuracy, completeness, currency or suitability for any particular purpose; and
b. do not accept liability howsoever arising, including but not limited to negligence for any loss resulting from the use of or reliance upon the data.
Base data from the LIST © State of Tasmania http://www.thelist.tas.gov.au
Contact us at: [email protected] or on 1300 472 767
Disclaimers

corelogic.com.au
© 2017 CoreLogic, Inc. No unauthorised use or disclosure. All rights reserved. CORELOGIC and the CoreLogic logo are New Zealand and Australian trademarks of CoreLogic, Inc. and/or its subsidiaries.


