1 20 March 2005/jse DECENTRALIZED GOVERNANCE AND FOOD SECURITY Perceptions from Rural Local Governments and Communities in Bulacan Province, the Philippines Ms. Josefa S. Edralin and Mr. Cristino M. Collado INTRODUCTION More than a decade ago, the Philippines made headlines on the adoption of the Local Government Code of 1991. Such legislation has placed substantial decisions in the hands of local government units (LGUs), including budget and human resources. Devolution has affected five national government departments, namely, the Departments of Agriculture, Environment and Natural Resources, Health, Public Works and Highways, and Social Welfare and Development.1/ In the Department of Agriculture, authority and responsibility for agricultural extension and research has been devolved to LGUs, comprising provinces, cities, municipalities, and barangays (the lowest unit of government). This was a major shift from a centralized system premised on macro policy-based command and control principles. Devolution entailed added responsibility for financial and personnel management by LGUs. Until now, however, many LGUs have had no funds to administer, except their shares from the internal revenue allotments (IRAs)2/ and their income from local taxes and fees. They remain heavily dependent on the national government for recurrent and capital or investment expenditures. The Department of Finance records show that the national government still spends a considerable portion of its budget to finance the devolved functions.3/ In 2003, for example, the IRA allotted to LGUs increased to P141 billion from P134.4 billion in 2002. However, LGUs also have had problems in actually getting the budgeted funds released from the national government. This made expenditure planning by LGUs extremely difficult. The transformation of LGUs to decentralized, participatory governance was a difficult task. LGUs accustomed to highly centralized government and administration found it difficult to deal with such decentralized governance concepts as empowerment, participation, equity, accountability, responsiveness, and efficient and effective management of resources. Many were unprepared for their new roles.4/ While richer LGUs were able to deliver effective, efficient, and sustainable services and practice fiscal discipline, the poorer ones lagged behind. Many LGUs had no experience in decentralized governance and lacked capacity for facilitating development at the local
Transcript
1
20 March 2005/jse
DECENTRALIZED GOVERNANCE AND FOOD SECURITY Perceptions from Rural Local Governments and Communities
in Bulacan Province, the Philippines
Ms. Josefa S. Edralin and Mr. Cristino M. Collado
INTRODUCTION More than a decade ago, the Philippines made headlines on the adoption of the Local Government Code of 1991. Such legislation has placed substantial decisions in the hands of local government units (LGUs), including budget and human resources. Devolution has affected five national government departments, namely, the Departments of Agriculture, Environment and Natural Resources, Health, Public Works and Highways, and Social Welfare and Development.1/
In the Department of Agriculture, authority and responsibility for agricultural extension and research has been devolved to LGUs, comprising provinces, cities, municipalities, and barangays (the lowest unit of government). This was a major shift from a centralized system premised on macro policy-based command and control principles.
Devolution entailed added responsibility for financial and personnel management
by LGUs. Until now, however, many LGUs have had no funds to administer, except their shares from the internal revenue allotments (IRAs)2/ and their income from local taxes and fees. They remain heavily dependent on the national government for recurrent and capital or investment expenditures. The Department of Finance records show that the national government still spends a considerable portion of its budget to finance the devolved functions.3/ In 2003, for example, the IRA allotted to LGUs increased to P141 billion from P134.4 billion in 2002. However, LGUs also have had problems in actually getting the budgeted funds released from the national government. This made expenditure planning by LGUs extremely difficult.
The transformation of LGUs to decentralized, participatory governance was a difficult task. LGUs accustomed to highly centralized government and administration found it difficult to deal with such decentralized governance concepts as empowerment, participation, equity, accountability, responsiveness, and efficient and effective management of resources. Many were unprepared for their new roles.4/ While richer LGUs were able to deliver effective, efficient, and sustainable services and practice fiscal discipline, the poorer ones lagged behind. Many LGUs had no experience in decentralized governance and lacked capacity for facilitating development at the local
2
level. Communities had little or no opportunity to be involved directly with the LGUs. As a result, development administration was very weak at the local level, reflecting low planning and implementation skills, lack of budgetary resources, lack of community participation, and poor quality of infrastructure, services, and facilities. To date, there is little documented experience on how LGUs are implementing agricultural extension and food security programmes. The effects of such poorly managed programmes are observed to be especially acute. From the viewpoint of a nongovernmental organization (NGO), devolution of the agricultural extension function to LGUs has been ineffective because they lacked the capacity to provide the needed support services such as credit and technical assistance.5/
With the aim of helping move decentralization from rhetoric to empirical reality, the authors conducted a small study of Bulacan Province and its selected municipalities and rural communities to assess whether the devolution process has helped improve the food security situation in the province. The results of the study are documented in this paper, emphasizing the strong points and positive outcomes of devolution from the perspective of the LGUs and their rural communities. Food Security Framework Many organizations (e.g., the World Bank, the Food and Agriculture Organization of the United Nations, the World Food Programme, and Save the Children) have contributed to understanding the concept of food security in developing countries. The World Bank defines food security as “access by all people at all times to enough food for an active and healthy life”.6/ This means that households and individuals must have available food, access to food, and the ability to fully utilize food once it is available and accessible.
This paper adopts the World Bank definition and uses the following indicators to measure the different facets of food security:7/
• Food availability -- sufficient physical supplies of food; • Food access – economic and physical access by all households and individuals
to those food supplies either through market systems or other sources; and • Food utilization -- proper biological use of those food supplies by households
and individuals to meet their dietary and food needs.
The above indicators relate to food production, food distribution, and food consumption, respectively. More than these factors, food security requires decentralized governance as well as proper interventions to guarantee the sustainability of food production, distribution, and consumption. On the other hand, decentralized governance requires a strong, stable local government that will enhance and protect food security at the local level.8/ A sustainable food system will help to satisfy basic human needs9/ while decentralized governance will encourage local initiative. Food security will be lasting only if all these factors are applied.
3
This paper examined the performance of these indicators in Bulacan Province to determine whether its rural communities are food secure. FOOD SECURITY ISSUES AT THE NATIONAL LEVEL Causes of Food Insecurity Fast-paced population growth, poverty, and slow economic growth represent some of the underlying causes of food insecurity in the Philippines. These issues are major stumbling blocks in efforts to increase food security in the country. 1. Rapid population growth The Philippines is experiencing rapid population growth. By the National Statistical Coordination Board (NSCB) projection, the population will increase to 85.2 million this year (2005), from 82.3 million in 2003 and 76.5 million in 2000.10/ The rate of natural increase (birth rate minus death rate) is 2.36 per cent.11/ High population growth threatens food security, and the status quo is not acceptable, according to Balisacan.12/ Arresting the rapid growth of the population could very well address food security concerns, he concludes. 2. Poverty According to the World Bank’s World Development Report, 1990, the country’s high population growth rate is a major cause of widespread poverty, particularly in the rural areas where three-quarters of the poor live. 13/
While the country’s population is steadily rising, more people are falling into the poverty trap. Since 1985, Philippine economic growth has had only a slight effect in reducing poverty levels while the absolute number of poor keeps increasing, according to a report by the Asian Development Bank (ADB).14/ The proportion of families living in poverty fell from 44.2 per cent in 1985 to 31.8 per cent in 1997 but had since risen to 33.7 per cent in 2000, the ADB report said.
Indeed, the economic and social reforms introduced by the past and present
government administrations hardly eased poverty. In 2000, 20.9 per cent of the population (or 16.7 per cent of total families) were core poor (i.e., food poor or lived below subsistence), according to the 2003 Philippine Progress Report on the Millennium Development Goals (MDGs).15/ In 2001, around 38 per cent of the population were considered to be living below the poverty line; in 2003, the figure went up to 40 per cent, according to the Philippine Population Commission.16/ The target under the Medium-Term Philippine Development Plan, 2005-2010 is to cut by half the current 38 per cent poverty incidence within the next six years.
4
Also in 2000, the NSCB estimates that approximately one-third of the population lacked the amount required annually (about US$275) to satisfy food and non-food basic needs.17/ Poverty is highest in the agriculture sector, according to the Philippines Poverty Assessment Report.18/ Agriculture-dependent households account for over two-thirds of the poor (representing about 30.8 million poor people or 5.1 million poor families in 2000), according to the same report.19/ Between 1985 and 2000, poverty incidence among farm households remained at more than 50 per cent or more than half of the total families whose heads were farmers without sufficient income to meet their basic needs.20/ Inequalities in income divide Philippine society. The disparity between the richest and the poorest households is very wide.21/ For example, in 2004 the median household income was approximately U$$1,836, which is forecast to rise by an average of 6.7 per cent a year. In 2003, the richest 20 per cent of the population had an income 9.7 times that of the poorest 20 per cent, and the richest 10 per cent captured 36.3 per cent of household income.
However, the most notable gap is the poverty incidence across regions – in 2000 the highest was in the Autonomous Region in Muslim Mindanao (ARMM) (66 per cent) and the lowest was in the National Capital Region (8.7 per cent).22/ 3. Slow economic growth Poverty and rapid population growth are in turn linked to the country’s economy. The Asian Development Outlook 2004 projected Philippine economic growth in the range of 4.5 per cent to 5.5 per cent in both 2004 and 2005, compared with 4.5 per cent in 2003.23/ Agricultural growth was expected to accelerate from 3.1 per cent in 2001 to between 3.7 per cent and 4.7 per cent in 2004 and 2005. But the ADB report warned that unless major economic and political reforms are accomplished, it will be extremely difficult for the country to lift its potential growth rate. For the country to take a more rapid growth path, the ADB report said the government must address the heavy budget deficit and consequent debt problem, poor investment climate, lack of capacity to generate employment, and a high rate of population increase.
The country experienced both good and bad growth periods in its economic history.24/ The good years were 1986-89 (the early years of the Aquino administration), and 1993-97 (part of the Ramos administration and the Asian financial crisis). The bad years were 1990-92 (the 1 December 1989 coup, the power crisis, political destabilization moves, and lack of international business confidence in the political leadership) and 1998-2000 (the reported scandals and subsequent impeachment of Estrada).
Besides population growth, poverty, and slow economic growth, weak macroeconomic management, employment problems, an unfinished land reform programme, issues over corruption, a weak state, and security problems are blamed for the food security problems in the country.
5
Food Security Situation at the National Level In the Philippines, food security is sometimes referred to “food self-sufficiency”. Self-sufficiency in rice and white corn was mandated in the Agriculture and Fisheries Modernization Act of 1997. Rice is both a staple food and an economic and political commodity. About 3 million small farmers depend on rice farming as their source of livelihood.
Achieving self-sufficiency in rice has been the elusive goal of past and present government administrations, beginning with Marcos’ Masagana ’99, and followed by Aquino’s Rice Productivity Enhancement Programme, Ramos’ Grains Productivity Enhancement Programme, Estrada’s Agriculturang Makamasa (Agriculture for the Masses), and Arroyo’s P20-billion-a-year Agricultural Modernization Programme for which she was awarded the FAO Ceres Award. 1. Food availability Is there enough food for all in the country? The Philippines has been classified by the Food and Agriculture Organization of the United Nations (FAO) as a low-income and food-deficit country. Agriculture suffers from low and declining productivity, and is incapable of supplying the food needs of the population, according to the Philippine Legislators’ Committee on Population and Development Foundation.25/ The Committee notes that total agricultural output as measured by real gross value added (GVA) has minimally increased. For example, from 1995-2000 the average growth rate of agricultural GVA was only 1.38 per cent, which is lower than the average rate of 1.62 per cent during 1991-94. This reflects a declining agricultural output. In 2002, the agricultural sector only slightly grew by 3.69 per cent in GVA compared to the 2000 output of 3.52 per cent. In particular, rice and corn which accounts for 50 per cent to 60 per cent of agricultural GVA has performed poorly. While rice production increased in the early 1990s it suffered significant declines in 1997-98. This is true for corn production which posted negative growth rates from 1995 to 2000. Nonetheless, in its January-December 2004 performance report the Bureau of Agricultural Statistics claims that agricultural output expanded by 5.06 per cent in 2004, from 3.8 per cent in 2002 and 2003.26/ By contrast, the 1998-2000 Food Balance Sheets of the Philippines indicate that per capita food supply in 2000 was more than adequate to satisfy daily per capita consumption, says Florencio.27/ She estimates that the per capita daily food supply was 1127 g and the per capita daily recommended food intake was 1031 g, indicating a 109 per cent food supply to recommended adequacy level. Based on the 1993 National Nutrition Survey, Florencio estimates that the per capita daily energy supply was 2445
6
kcal and the per capita energy consumption was 1684 kcal, giving a supply to consumption adequacy level of 145 per cent. Based on Florencio’s estimates, it can be said that food is readily available, although opportunities to buy food are often constrained by the lack of income to buy food. 2. Food access Based on a 2000 study by United Nations Economic and Social Commission for Asia and the Pacific (UNESCAP), the Economist Intelligence Unit (EIU) indicates that the daily calorie consumption per head is low in the Philippines, at 2,408.28/ Philippine consumption of fish and fruit is ranked high (ninth in the world), consumption of vegetables is middling, and consumption of meat is low. This reflects the availability of domestically produced food, according to the EIU.29/ Furthermore, EIU claims that food imports accounted for only around 5-6 per cent of total imports in 2004. Nonetheless, since the Government of the Philippines ratified the General Agreement on Tariffs and Trade (GATT)-Uruguay Round and became a member of the World Trade Organization (WTO) in 1995, it has been observed that the volume of imported agricultural products, including rice, increased as a result of liberalized trade policies.30/ However, critics argue that increased imports in agricultural products caused undue competition with local production, dislocating the farmers who rely on agriculture for their livelihood. Relative to the rice-producing ASEAN countries (e.g., Indonesia and Viet Nam), the Philippines has been left behind in terms of productivity growth. For example, in 2001 rice yield in the Philippines was 3.19 mt/ha, as against 4.25 mt/ha in Indonesia and 4.26 mt/ha in Viet Nam.31/ This year, the National Food Authority (NFA) announced that it will import 400,000 mt of rice from nine Vietnamese firms and two Thai firms.32/ The imports are intended to boost the country’s rice stocks in anticipation of a possible drop in crop production because of the El Nino phenomenon. Since 1983, it has been observed that the domestic wholesale prices of rice in the Philippines have been higher than international prices.33/ This is because domestic rice producers continue to receive government protection.
The food industry is one of the biggest industries in the country, with agriculture accounting for 14.8 per cent of GDP in 2003.34/ Although agriculture employs a large proportion of the population (approximately one-third of the labour force in 2003), the Philippines continues to import food products.
Expenditure on food as a percentage of household spending is estimated to have
declined marginally to 39.6 per cent in 2003 from 40.2 per cent in 1998.35/
7
3. Food consumption The Philippines is not on target in meeting the United Nations Millennium Development Goal (MDG) of reducing the proportion of malnourished people by 50 per cent by 2015, either from the 1990 or 1996 levels of protein-energy malnutrition. According to the 2003 Philippine Progress Report on the Millennium Development Goals, the government target under its Medium-Term Philippine Development Plan, 2001-2004 was to reduce the prevalence of underweight children aged 0-5 years old (Philippine Reference Standards) to 7.4 per cent by 2004.36/ Malnutrition is still a major threat to the Filipino child’s survival even as the prevalence of underweight preschool children has improved, the report said.
In 1989-90, the starting point used to measure progress against the target, and the year the First National Nutrition Survey was conducted by the Food and Nutrition Research Institute, Department of Science and Technology (FNRI-DOST), the Philippine Progress Report on the MDGs notes that the prevalence of underweight preschool children 0-5 years old decreased from 34.5 per cent to 30.8 per cent in 1996, then increased to 32 per cent in 1998 and decreased to 30.6 per cent in 2001.
In order to halve the 1990 proportion of underweight preschool children, the
average annual rate experienced during the decade should be trebled, Florencio argues. She says, “If it is ‘business as usual’, the goal may be reached only in 2040.”37/ For underweight young schoolchildren ( 6-19 years of age), Florencio notes that the annual reduction rate will have to be ten times the average annual rate (from 34.2 per cent in 1989-90 to 32.9 per cent in 2001). “If the usual rate continues, it may take more than 100 years for the goal to be met.”38/
Government figures from the Sixth National Nutrition Survey claim a further
decline in the percentage of underweight preschool children to 27.6 per cent in 2003.39/ While noting that there have been slight improvements in the nutritional status of children, the survey results show that the number of afflicted children is still enormous.
Regional disparities in the nutritional status of children remain wide, from a low of 20.3 per cent in the National Capital Region to 37.8 per cent in the Bicol Region, according to the Philippine Progress Report on the MDGs. Again, the Sixth National Nutrition Survey shows that 3.4 million primary school-age children were underheight or stunted (41 out of every 100 boys compared to 32 out of every 100 girls), a condition indicative of prolonged deprivation of food. As cited in the Philippine Progress Report on the MDGs, figures on stunted growth decreased from 40 per cent in 1989-90 to 34.5 per cent in 1996, and remained at 34 per cent until 1998.
Concerns remain about the country’s dismal performance in increasing food consumption. According to the Philippine Progress Report on the MDGs, the trends in
8
food consumption indicate a general decrease in the intake of various foods, particularly rice, fish, and meat. The report indicates that the mean one-day per capita food consumption decreased from 869 grams in 1987 to 803 grams in 1993, and the mean one-day per capita energy intake decreased from 1,753 kilo calories to 1,684 kilo calories in the same period. Energy, iron, calcium, and ascorbic acid intakes also significantly decreased between 1987 and 1993. As cited in the report, most of the food groups showed lower consumption levels. These negative trends indicate that the vitamin and mineral intakes of Filipinos are very inadequate. Policy Interventions for Food Security Various policy interventions have been initiated by past and present government administrations to improve agriculture and food security. The LGUs are key partners of the national government in implementing the policies, plans, and programmes. A Cabinet-level Executive Committee on Food Security was established in 1996 to implement the Rome Declaration and Plan of Action on Food Security.40/ The policy and programme interventions include the following:
• The Agriculture and Fisheries Modernization Act (AFMA) of 1997, which provides for the development of agricultural support services such as irrigation, training, and credit; increasing the efficiency and effectiveness of key sectoral interventions; encouraging private sector investments; and modernizing technology extension system.
• The Department of Agriculture’s (DA) Philippine Food Security Plan, with an
eight-point programme – providing food for every family; improved income through improved farm production; improved food safety; empowering farmers and fisherfolk; the full implementation of the Agriculture and Fisheries Modernization Act; a focus on the southern region of Mindanao; expansion of credit facilities; and the creation of jobs to help ease unemployment.
• The DA’s Gintong Ani (Golden Harvest) Programme, with four banner sub-
programmes – Grains, Fisheries, Commercial Crops, and Livestock. • The Social Reform and Poverty Alleviation Act of 1997, with “flagship”
programmes targeted to disadvantaged groups (farmers, landless rural workers, fisherfolk, indigenous peoples, informal sector workers, and the urban poor).41/
• The Nutrition Act of the Philippines, which declared nutrition a priority of the
government.
• The sixth Philippine Food and Nutrition Plan, 1999-2004, otherwise called the Philippine Plan of Action for Nutrition (PPAN), which was formulated in
9
consonance with the Medium-Term Philippine Development Plan, 1999-2004 (which allocated resources for agricultural production and rural development). The PPAN was designed to improve food security in the home, community, and the nation through a two-pronged strategy – Food Security; and Prevention, Control, and Elimination of Micronutrient Malnutrition.42/
• A draft Philippine Plan of Action for Nutrition, 2005-2010 was recently
unveiled, with the following guiding principles -- “Food is key to survival and critical for physical and mental development”; “Good nutrition is the right of every Filipino”; and Good nutrition is “sound investment”.43/
Monitoring systems were established including the following: • National nutrition surveys conducted every five years and updates issued by
the FNRI-DOST. • The Food Insecurity and Vulnerability Information and Mapping Systems
(FIVIMS), established by the National Nutrition Council (an agency attached to the DA) to monitor food insecurity and vulnerability at the national level.44/
Recent assessments show the inadequacies of some of the policy interventions. With respect to the agriculture, Bello says:
Agricultural policy for the Philippines is in crisis. The various parts of such a policy – trade, agrarian reform, technological upgrading, and food security – are very loosely articulated with one another. How in so far as one can say that there is a common thread running through these different components, it is of relying on market forces as much as possible—that is, ‘reforming’ Philippine agriculture through accelerated deregulation and liberalization, though this process must be tempered by pragmatic political considerations.45/ In a paper by Lara, he confirms that earlier calls for synergy in policy reform and
implementation have not been accomplished.46/ This indicates the state’s abdication of its role in fostering markets, he says.
A policy advocacy paper by the Integrated Rural Development Foundation of the
Philippines points out that “the Philippines’ food security situation is at its worst” because laws that give support to rice farmers and poor consumers were repealed.47/ This included the 1995 Magna Carta for Small Farmers (which provided quantitative import restrictions on sensitive products) and the Seed Act (which banned importation of seeds). Furthermore, the Foundation noted that the Agriculture and Fisheries Modernization Act, which was supposed to be the main vehicle for making the agricultural sector globally competitive, lacked budgetary support.
10
In fact, the DA’s budget suffered significant declines from 3.99 per cent of the total national government budget in 1996 to 2.29 per cent in 2000. The DA’s budget was cut from P19.9 billion in 2002 to P16.5 billion in 2003. A further evidence of declining government support for agricultural development is the 2005 budget which did not include the DA in the top-ten priority departments designated to receive higher allotments from the national government.
In reviewing the performance of the nutrition interventions, Florencio observed that the PPAN 1999-2004 was very much like the 1993-98 version which achieved less than half of the interventions; and that the results of the 1993 and 1998 national nutrition surveys of the FNRI-DOST did not support the government’s claim that there had been improvements in the nutritional status of Filipinos.48/ IMPLEMENTING DECENTRALIZED GOVERNANCE AND FOOD SECURITY: FOCUS ON BULACAN PROVINCE Bulacan Province’s vision is “to have a province that is progressive, peaceful, and self-reliant where its people are living models of its historical heritage and cultural excellence with strong middle class as the core of the citizenry with equal access to opportunities and services. Towards this end, the province is committed to pursue good and responsive governance, sustainable economic growth, protection and management of the environment, and community safety”.49/ In 2001, the Provincial Government launched its Five-Point Development Agenda consisting of Sustainable Economic Development; Peace and Order; Youth, Culture, and Historical Development; Effective Delivery of Health Services; and Reforms in Government Bureaucracy. The provincial economy has undergone a dynamic transformation, from agriculture and farming-based activities to manufacturing and entrepreneurial activities. The municipalities in the province were instrumental in attracting business investments in their localities. In 2001, some 2,598 business and commercial enterprises and 282 main offices and branches of major Manila-based commercial banks and province-based rural banks were established in the different municipalities. Based on figures compiled by the Provincial Planning and Development Office (PPDO), the total investments generated amounted to P4.695 billion resulting in job openings for 31,300 people. This growth has resulted in better-than-average employment rate in Bulacan. In 2002, Bulacan registered an employment rate of 91.8 per cent, compared to 90.1 per cent in 1998. In the same year, Region III (comprising six provinces of Central Luzon, including Bulacan) had an employment rate of 89.2 per cent while the whole country had 89.8 per cent.
11
The average annual income of Bulacan families also increased, from P95,000 in 1991 to P142,082 in 1997, and then to P183,495 in 2000, according to PPDO data obtained from the Regional Office of the Department of Labor and Employment. The favourable employment rate, coupled with adequate income opportunities, had brought down the poverty incidence in the province. According to the provincial data available, the poverty index was significantly reduced from 17.3 per cent in 1994 to 8.3 per cent in 1997, and then to 5.4 per cent in 2000. On the other hand, the human development index (HDI) increased from 0.727 in 1994 to 0.760 in 2000. The good revenue contributed by the various forms of taxes enabled the province to pursue its development goals. In 2001, for example, the provincial share from the real property taxes collected from the various municipalities amounted to P609.98 million. This brought the total income of the province to P1,697.83 million (including loans from NGOs and government-controlled corporations, grants and donations, trust funds, and appropriations from the national government). Meanwhile, Bulacan’s share from the IRA increased to P578 million in 2001, from P513 million in 1999. According to the Bulacan Provincial Police Office, there are no reasons for businesses and people to be concerned about peace and order conditions in the province. In 2001, for example, of the 1,771 crimes of various categories reported, 1,601 were resolved, giving the police a capability rating of 90.4 per cent.
The province is located north of Metro Manila (a 45-minute ride from the metropolis) and serves as the main gateway to all the regions and provinces in the central and northern parts of Central Luzon. Comprised of twenty-three towns and two cities, and divided into four political districts, it has a total land area of 262,500 ha. Based on the last Philippine census, its population in 2000 was 2,234,088, which translated to a population density of 851 people per km2. The NSCB projected that the population would increase to 2,250.620 by 2005. FINDINGS FROM THE BULACAN FIELD SURVEY To gauge the performance of the farming sector and solicit feedbacks on how the LGUs had contributed in their pursuit for a better economic situation, a field survey was conducted in February/March 2005. Chosen in a random manner were ninety-six farmers and ninety-six rural housewives picked out from twenty-four barangays in eight municipalities. The municipalities of Calumpit, Pulilan, Baliuag, Bustos, Plaridel, San Rafael, San Ildefonso, and San Miguel were chosen as interview sites on account of their vast agricultural production areas and the large concentration of farming families in their villages.
12
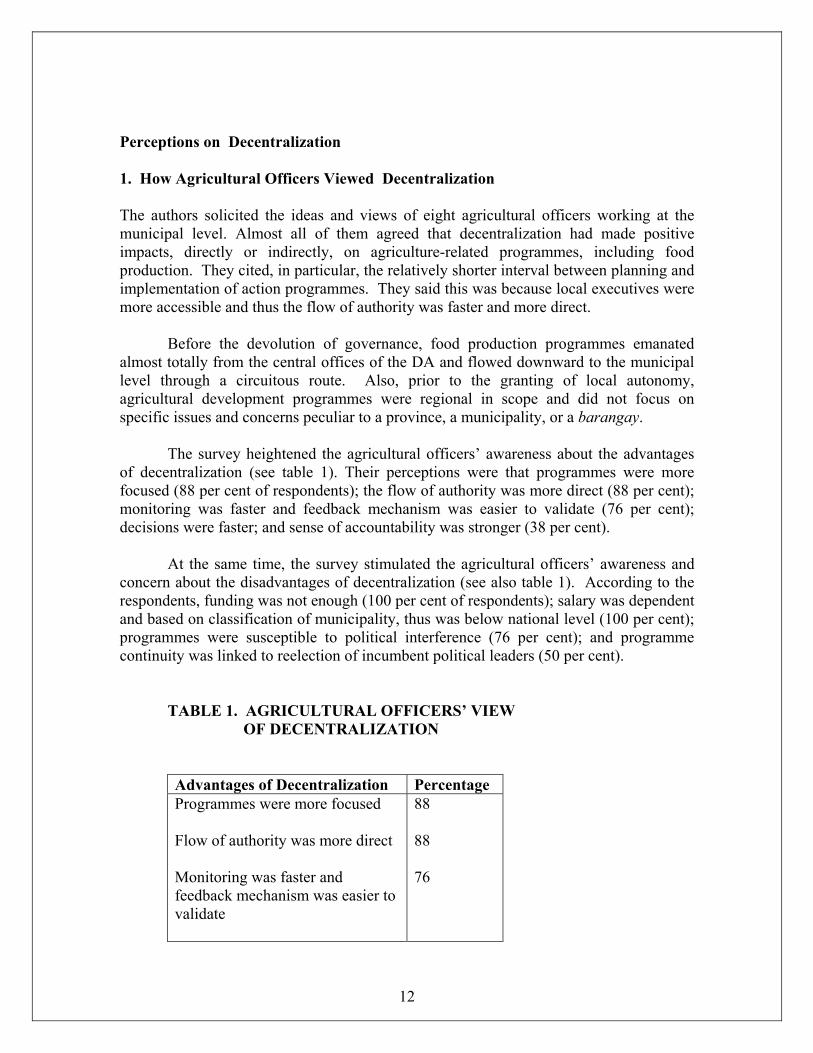
Perceptions on Decentralization 1. How Agricultural Officers Viewed Decentralization The authors solicited the ideas and views of eight agricultural officers working at the municipal level. Almost all of them agreed that decentralization had made positive impacts, directly or indirectly, on agriculture-related programmes, including food production. They cited, in particular, the relatively shorter interval between planning and implementation of action programmes. They said this was because local executives were more accessible and thus the flow of authority was faster and more direct. Before the devolution of governance, food production programmes emanated almost totally from the central offices of the DA and flowed downward to the municipal level through a circuitous route. Also, prior to the granting of local autonomy, agricultural development programmes were regional in scope and did not focus on specific issues and concerns peculiar to a province, a municipality, or a barangay. The survey heightened the agricultural officers’ awareness about the advantages of decentralization (see table 1). Their perceptions were that programmes were more focused (88 per cent of respondents); the flow of authority was more direct (88 per cent); monitoring was faster and feedback mechanism was easier to validate (76 per cent); decisions were faster; and sense of accountability was stronger (38 per cent). At the same time, the survey stimulated the agricultural officers’ awareness and concern about the disadvantages of decentralization (see also table 1). According to the respondents, funding was not enough (100 per cent of respondents); salary was dependent and based on classification of municipality, thus was below national level (100 per cent); programmes were susceptible to political interference (76 per cent); and programme continuity was linked to reelection of incumbent political leaders (50 per cent).
TABLE 1. AGRICULTURAL OFFICERS’ VIEW OF DECENTRALIZATION
Advantages of Decentralization Percentage Programmes were more focused Flow of authority was more direct Monitoring was faster and feedback mechanism was easier to validate
88 88 76
13
Decisions were faster Sense of accountability was stronger
50 38
Disadvantages of Decentralization
Percentages
Funding was not enough Salary was dependent and based on class of municipality Programmes were susceptible to political interference Programme continuity was linked to reelection of incumbent politicians
100 100 76 50
Note: Due to multiple answers, the percentage total does not come up to 100.
The above comments by the agricultural officers suggest that agriculture and related food production programmes were among the biggest casualties of decentralization. The agricultural officers themselves were victims. Some of them had to suffer diminution in their salaries. From the payroll of the national government, they were moved to the roster of LGUs whose ability to pay their employees was contingent on their income level. Thus, those who found themselves devolved to 4th or 5th class municipalities found their salary rate way below the national average salaries of civil service employees whose offices were not decentralized. The effect of this disparity in salary rate was the dip in the morale of the affected employees. Their enthusiasm diminished. A good number of them failed to provide extension services to far-flung farming areas. Because of the precarious budgetary state of the poorer municipalities where they were assigned, their travel and field expenses could not be reimbursed expeditiously. In the process and down the road, the efficacy of these disadvantaged agricultural workers was compromised. The agricultural officers’ concern about political interference appear to translate into the susceptibility of agriculture-related initiatives and food production campaigns to the vagaries of politics. Some local executives, particularly those slated for reelection, tended to pander to the requests of local political leaders even if doing so would derail some of the agreed development projects. A worse case scenario could emerge where the incumbent local executive ends his term after holding office for three consecutive terms (or after nine successive years) or fails in his/her reelection bid. This is particularly true if the succeeding governor or mayor is from the opposite political camp. Some of the ongoing programmes may be unjustly modified at best, or totally scrapped at worst.
14
2. How Farmers Perceived Decentralized Governance A high number of Bulacan farmers were aware of the work of LGUs and were appreciative of those initiatives that positively affected them. As shown in table 2, nine out of ten farmers recognized that LGUs had contributed to the improvement of law and order in the community. About 80 per cent of the farmers appreciated the technical seminars and training on cooperatives and crop and livestock production organized and coordinated by the provincial and municipal agricultural officers.
TABLE 2. FARMERS’ PERCEPTIONS ON DECENTRALIZED GOVERNANCE
Found LGU helpful, one way or another Yes No
Percentage 79 21
Those who were helped, and kind of assistance received Peace and order Technical seminars Training on cooperatives Communal irrigation Pest and disease control Improved seeds distribution Micro-credit seminars
89 82 77 70 51 28 25
Note: Multiple answers. A specific case cited frequently during the interviews was the significant role the LGU played in the control of foot-and-mouth disease that broke out not many years ago. The disease struck fear in the heart of many farmers because aside from swine, it could also affect buffaloes which were most essential in their farming. Some farmers mentioned that they heard of their municipal councils having passed ordinances banning the inter-municipality movement of diseased animals. During the dry cropping season, supply of irrigation water usually dwindles. It becomes problematic for those farmers whose farms are situated at the far end of the irrigation canals. Since communal irrigation flows by gravity, there could be times when water, which was released from dams in allocated quantity, would no longer be sufficient by the time it reaches the areas peripheral to the canal network. Related to this, 70 per cent of the farmers found the local executives, particularly the mayors, quite helpful in
15
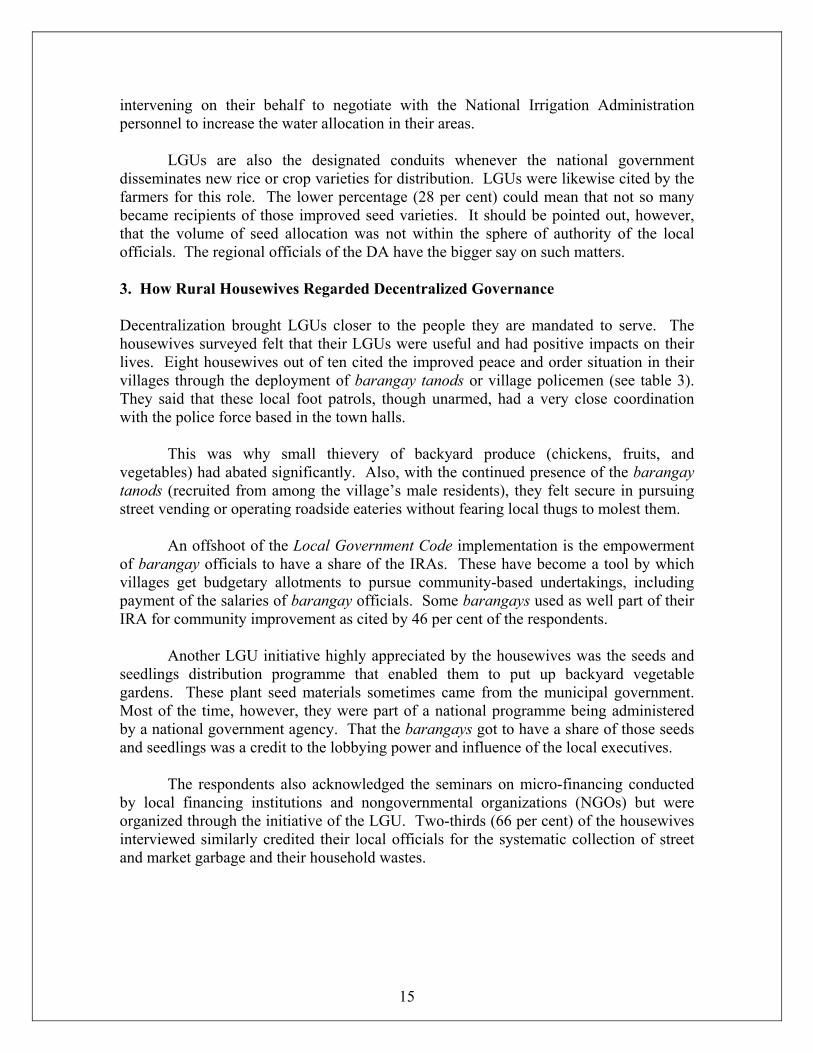
intervening on their behalf to negotiate with the National Irrigation Administration personnel to increase the water allocation in their areas. LGUs are also the designated conduits whenever the national government disseminates new rice or crop varieties for distribution. LGUs were likewise cited by the farmers for this role. The lower percentage (28 per cent) could mean that not so many became recipients of those improved seed varieties. It should be pointed out, however, that the volume of seed allocation was not within the sphere of authority of the local officials. The regional officials of the DA have the bigger say on such matters.
3. How Rural Housewives Regarded Decentralized Governance Decentralization brought LGUs closer to the people they are mandated to serve. The housewives surveyed felt that their LGUs were useful and had positive impacts on their lives. Eight housewives out of ten cited the improved peace and order situation in their villages through the deployment of barangay tanods or village policemen (see table 3). They said that these local foot patrols, though unarmed, had a very close coordination with the police force based in the town halls. This was why small thievery of backyard produce (chickens, fruits, and vegetables) had abated significantly. Also, with the continued presence of the barangay tanods (recruited from among the village’s male residents), they felt secure in pursuing street vending or operating roadside eateries without fearing local thugs to molest them. An offshoot of the Local Government Code implementation is the empowerment of barangay officials to have a share of the IRAs. These have become a tool by which villages get budgetary allotments to pursue community-based undertakings, including payment of the salaries of barangay officials. Some barangays used as well part of their IRA for community improvement as cited by 46 per cent of the respondents.
Another LGU initiative highly appreciated by the housewives was the seeds and seedlings distribution programme that enabled them to put up backyard vegetable gardens. These plant seed materials sometimes came from the municipal government. Most of the time, however, they were part of a national programme being administered by a national government agency. That the barangays got to have a share of those seeds and seedlings was a credit to the lobbying power and influence of the local executives. The respondents also acknowledged the seminars on micro-financing conducted by local financing institutions and nongovernmental organizations (NGOs) but were organized through the initiative of the LGU. Two-thirds (66 per cent) of the housewives interviewed similarly credited their local officials for the systematic collection of street and market garbage and their household wastes.
16
TABLE 3. RURAL HOUSEWIVES’ PERCEPTIONS ON DECENTRALIZED GOVERNANCE
Found LGU helpful, one way or another Yes No
Percentage 71 29
Ways by which LGU was found helpful Peace and order through barangay tanod Seeds and seedlings (backyard vegetable production) Waste management Livelihood seminar (micro-credit financing) Health care (rural health centre) Community beautification
79 72 66 60 51 46
Note: Multiple answers.
Rural Communities’ Perceptions on Food Security
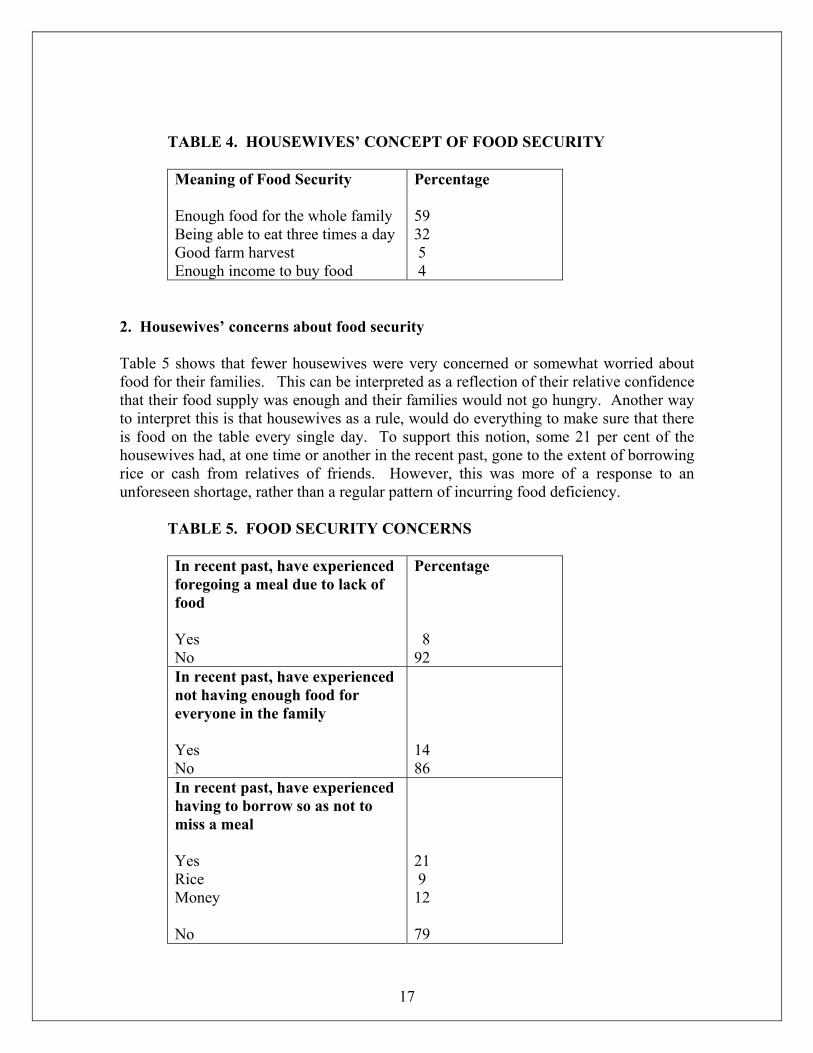
1. Meaning of food security, according to housewives Food sufficiency in terms of what the family needs to fill their stomachs every mealtime summarizes the rural housewives’ understanding of what food security is all about (see table 4). Nine out of ten housewives said that they would feel secure if the food available to them would be enough for everyone in the family; not one family member had to be hungry; and everyone would be able to eat three square meals a day. A small percentage (5 per cent), possibly those depending solely on farm cultivation, correlated food security with having a good harvest. Others (4 per cent) defined food security in terms of having enough income to buy food.
17
TABLE 4. HOUSEWIVES’ CONCEPT OF FOOD SECURITY
Meaning of Food Security Enough food for the whole family Being able to eat three times a day Good farm harvest Enough income to buy food
Percentage 59 32 5 4
2. Housewives’ concerns about food security
Table 5 shows that fewer housewives were very concerned or somewhat worried about food for their families. This can be interpreted as a reflection of their relative confidence that their food supply was enough and their families would not go hungry. Another way to interpret this is that housewives as a rule, would do everything to make sure that there is food on the table every single day. To support this notion, some 21 per cent of the housewives had, at one time or another in the recent past, gone to the extent of borrowing rice or cash from relatives of friends. However, this was more of a response to an unforeseen shortage, rather than a regular pattern of incurring food deficiency.
TABLE 5. FOOD SECURITY CONCERNS
In recent past, have experienced foregoing a meal due to lack of food Yes No
Percentage 8 92
In recent past, have experienced not having enough food for everyone in the family Yes No
14 86
In recent past, have experienced having to borrow so as not to miss a meal Yes Rice Money No
21 9 12 79
18
3. Access to Markets and Food Access to markets was not a problem among the housewives surveyed. They had different sources of marketing for the purchase of foodstuffs – from public markets that were usually located in the centre of the town (51 per cent) to ambulant vendors who could be seen plying their wares around the village throughout the day (25 per cent) (table 6). A marketing source that plays a significant role in the continuous flow of food items in rural villages is the neighbourhood store that is found in many road intersections. Their marketing frequency varied from weekly to daily. In many Bulacan villages as elsewhere in the Philippines, an inverse relationship exists between frequency of marketing and the level of income. Thus, those who did their marketing weekly or once a week should not in any way be seen as having refrigerators or freezers that enabled them to store food provisions that would last six or seven days. On the contrary, the women whose responses were “weekly” had husbands who did menial jobs and got paid at the end of the week or those who managed to supplement their daily subsistence through backyard gardening and thus needed to buy only items such as condiments, sugar, vinegar, and related necessities that they themselves did not produce. The once-a-week buyers were also those whose trip to the town proper was necessitated only by their need to go to church on Sundays and took advantage of the trip to go to the public market as well. TABLE 6. SOURCE AND FREQUENCY OF MARKETING
Source of Marketing Public market Neighbourhood store Ambulant vendor Grocery store
Percentage 51 38 25 13
Frequency of Marketing Weekly Twice a week Thrice a week Daily
42 29 23 6
Note: Due to multiple answers, the total does not add up to 100 per cent.
19
4. Sources and level of family income The housewives’ families had multiple sources of income (table 7). More than half of them (64 per cent) derived their earnings from farming or agribusiness; 46 per cent had family members who were regularly employed; and 40 per cent were engaged in small business (e.g., beauty shops, eateries, or selling). Still some had relatives who enhanced the family income by their remittances. It should be noted that the total percentages exceeded 100 per cent simply because most households had multiple sources of income. Some (14 per cent) even had remittances from family members working abroad who sent money in dollars or yen. The interviews for both the farmers and the housewives were undertaken in the same village. It is thus safe to assume that a big number of housewife-respondents themselves belonged to the same farming families as the farmer-interviewees did. It can be seen in tables 8 and 12 that a big percentage of the farmers’ and housewives’ households had at least three and as many as four members having income to contribute to the family budget. This would thus explain why nearly half of the housewives’ households had at least P5,000 monthly income. One-third of them generated P8,000 or more. According to the estimates of the PPDO, an average Bulacan family needed only a monthly budget of P7,021.50 to meet food and nonfood basic requirements.
TABLE 7. SOURCES AND LEVEL OF FAMILY INCOME
Sources of Income Farming/agribusiness Public/private employment Self-employment Remittances from relatives
Percentage 64 46 40 17
Average Monthly Family Income 3,000 - 5,000 5,000 - 8,000 8,000 - 12,000 12,000 and above
19 49 18 14
Note: Multiple responses. 5. Housewives’ Profile In many ways, the housewives serve as good or perhaps better arbiter in assessing the success or failure of government programmes at the grass roots level. On matters of food
20
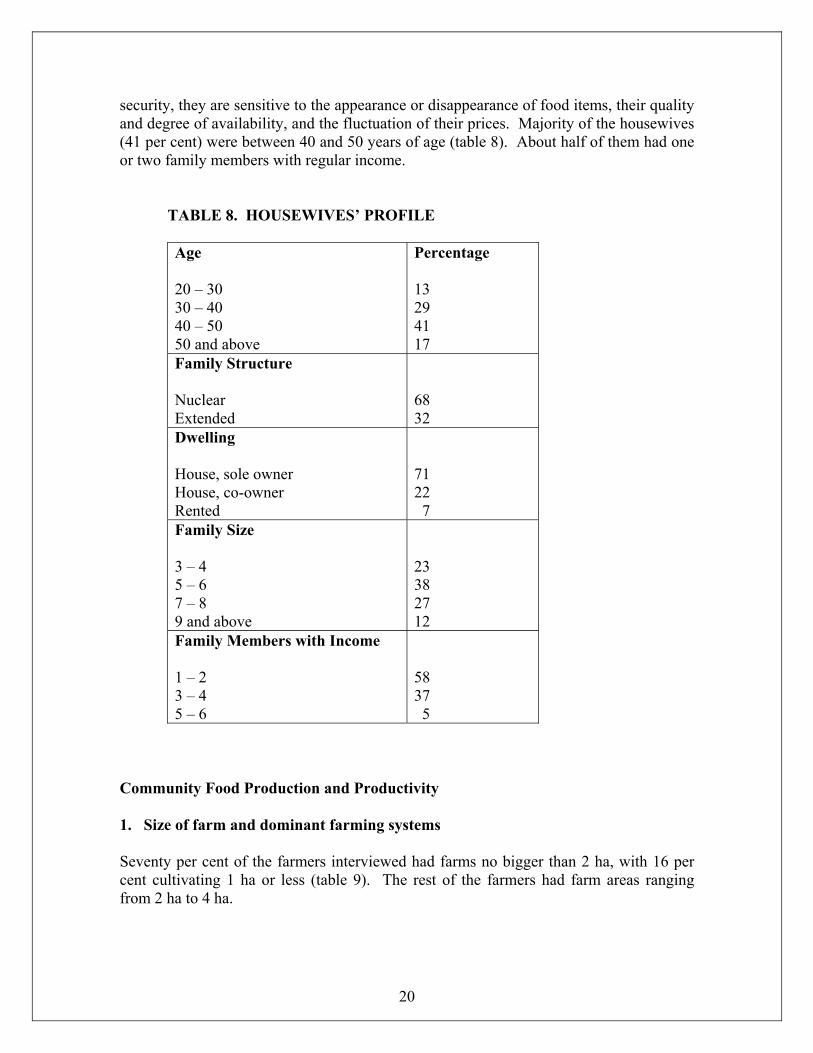
security, they are sensitive to the appearance or disappearance of food items, their quality and degree of availability, and the fluctuation of their prices. Majority of the housewives (41 per cent) were between 40 and 50 years of age (table 8). About half of them had one or two family members with regular income. TABLE 8. HOUSEWIVES’ PROFILE
Age 20 – 30 30 – 40 40 – 50 50 and above
Percentage 13 29 41 17
Family Structure Nuclear Extended
68 32
Dwelling House, sole owner House, co-owner Rented
71 22 7
Family Size 3 – 4 5 – 6 7 – 8 9 and above
23 38 27 12
Family Members with Income 1 – 2 3 – 4 5 – 6
58 37 5
Community Food Production and Productivity 1. Size of farm and dominant farming systems Seventy per cent of the farmers interviewed had farms no bigger than 2 ha, with 16 per cent cultivating 1 ha or less (table 9). The rest of the farmers had farm areas ranging from 2 ha to 4 ha.
21
The smaller farm areas suggest two things. First, the ratio between the farm size and the farmer’s time and labour is narrow which indicates that the farmer is able to tend to his crops more closely and efficiently. Second, the farmers’ families had grown larger such that parceling of the farm lot among the farmers’ children had to be resorted to in order to provide them a source of livelihood. Per the national population census of 2000, Bulacan’s population was growing at 4.02 per cent , which was much higher than the region’s average of 2.02 per cent.50/
Rice is the dominant crop in almost every agricultural land used for crop production in Bulacan Province (table 9). More than half of the farmers surveyed (54 per cent) were planting no other crop but rice all year round. One-fifth (22 per cent) also planted vegetables side-by-side with rice. Others (13 per cent) planted corn to complement rice. This was particularly done during the dry season when irrigation water was sometimes inadequate to meet the crops’ requirements (corn needs less water than rice). Only one in every ten farmers ventured in planting both corn and vegetables simultaneously with rice. TABLE 9. SIZE OF FARM AND DOMINANT FARMING SYSTEMS
Size of Farms Less than 1 ha 1 – 2 ha 2 – 3 ha 3 – 4 ha Above 4 ha
Percentage 16 54 18 8 4
Dominant Farming Systems Rice only Rice + corn Rice + vegetables Rice + corn + vegetables
54 13 22 11
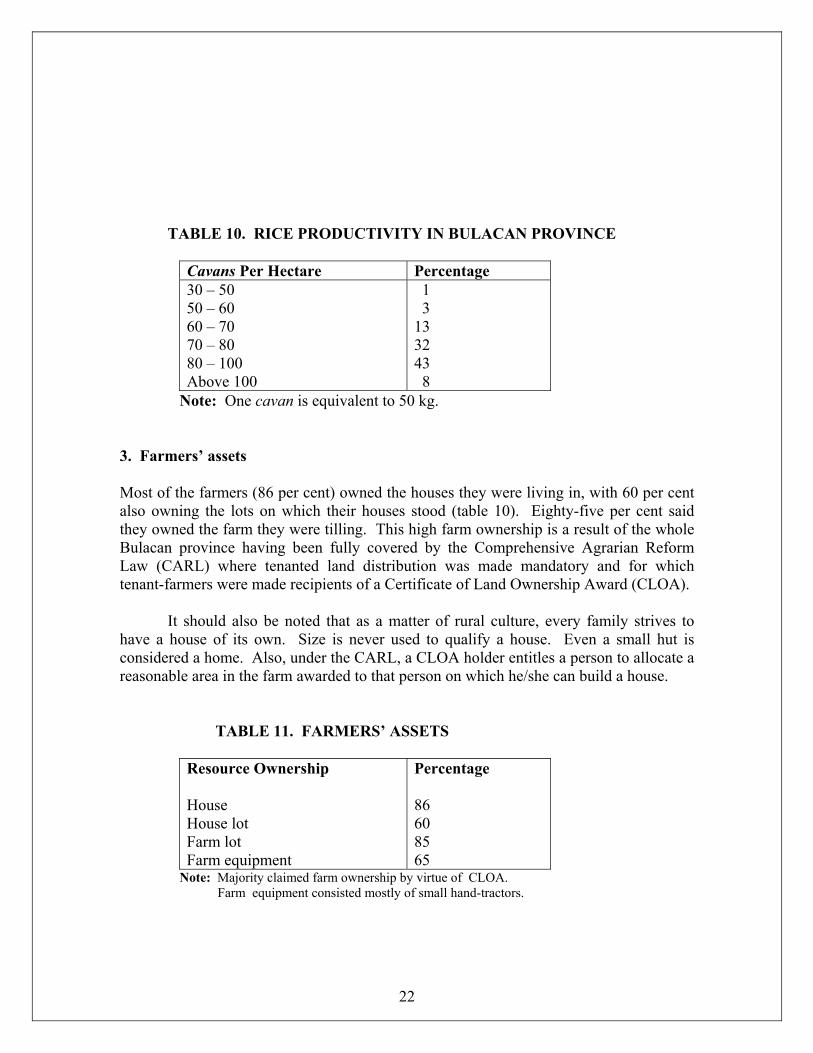
2. Productivity of rice cultivation The national rice harvest in the Philippines is around 3.8 mt/ha.51/ Bulacan farmers have thus been proving that they generally perform much better than their counterparts elsewhere in the country. More than half of the farmers interviewed (51 per cent) could produce a yield that was 4 mt/ha.
Note: One cavan is equivalent to 50 kg. 3. Farmers’ assets Most of the farmers (86 per cent) owned the houses they were living in, with 60 per cent also owning the lots on which their houses stood (table 10). Eighty-five per cent said they owned the farm they were tilling. This high farm ownership is a result of the whole Bulacan province having been fully covered by the Comprehensive Agrarian Reform Law (CARL) where tenanted land distribution was made mandatory and for which tenant-farmers were made recipients of a Certificate of Land Ownership Award (CLOA). It should also be noted that as a matter of rural culture, every family strives to have a house of its own. Size is never used to qualify a house. Even a small hut is considered a home. Also, under the CARL, a CLOA holder entitles a person to allocate a reasonable area in the farm awarded to that person on which he/she can build a house. TABLE 11. FARMERS’ ASSETS
Resource Ownership House House lot Farm lot Farm equipment
Percentage 86 60 85 65
Note: Majority claimed farm ownership by virtue of CLOA. Farm equipment consisted mostly of small hand-tractors.
23
4. Farmers’ income and livelihood A high percentage of farmers had one or two family members earning an income; they are likely to be the farmer and his wife or working child. Rice farming is not too time consuming. The farmer only has to occasionally visit his farm to remove weeds and apply fertilizers between planting time and the harvest season. Thus, he can easily find time to engage in some side activities that could augment his income. Bulacan farmers appear to have productively made use of their spare time by engaging in construction work, carpentry, or tricycle-driving.
TABLE 12. FARMERS’ INCOME AND LIVELIHOOD
Family Members with Income 1 – 2 3 – 4 5 – 6
Percentage 54 42 4
Total Monthly Family Income P3,000 – P5,000 P5,000 – P8,000 P8,000 – P12,000 Above P12,000
21 53 10 16
Sources of Family Income Farm/agribusiness Public/private employment Self-employment Remittances from relatives abroad
100 27 52 14
5. Farmers’ profile Table 13 indicates that a majority of farmers in Bulacan are still young and in their most physically productive years. Sixty per cent of the farmers interviewed were between 20 and 40 years of age. The other 40 per cent were above 40 years old, indicating an established familiarity with agriculture and long experience in the farming of rice and other crops.
24
TABLE 13. FARMERS’ PROFILE
Age 20 – 30 30 – 40 40 – 50 Above 50
Percentage 35 24 26 15
Family Structure Nuclear Extended
71 29
CONCLUSIONS AND POLICY RECOMMENDATIONS
Conclusions: Food Security Impact of Decentralized Governance Decentralized governance was one of the Government of the Philippines’ best legislative initiatives in 1991. In one big stroke, the government bestowed on the LGUs the empowerment they had long needed to spur development in the countryside. Devolution was an appropriate institutional response to the evolving risk of human insecurity. It also took away the long circuitous route that had prevented the swift flow of authority from the bureaucratic offices of the central government to the LGUs, NGOs, and community-based organizations tasked to implement programmes.
Bulacan Province was able to showcase the benefits of devolution. However, due to the lapse of time, data and information on the socioeconomic conditions prevailing in the province prior to the implementation of the Local Government Code proved difficult to collect. Nonetheless, it would not be far off to surmise that post-decentralization had brought more progress and improvement in the quality of life of the people in the province.
The responses generated in this study supported the premise that decentralized governance could provide the impetus and serve as an effective tool through which socioeconomic development could be pursued. Devolution creates an environment where the benefactor-beneficiary roles between the LGUs and the local communities become interchangeable. Top-down consultation is facilitated in the same way that bottom-up feedback is expedited.
25
A specific beneficiary of devolution in Bulacan Province was its food security programme which is aimed at improving the farmers’ productivity to increase the supply level of basic food items and their continued availability. The programme likewise seeks to improve the people’s livelihood opportunities so that they could be equipped with purchasing power that would enable them to freely access food that they could afford. In a parallel manner, the programme aims to broaden the people’s understanding of what food items they should consume to sustain their nourishment and satisfy their nutritional requirements.
The farm-level productivity of the rice-croppers was very much improved compared to the national standards. More than half (51 per cent) had yields that were far superior to the national harvest level.
Devolution has empowered the local communities to address their own basic needs. A good 80 per cent of the village families had income levels that put them above the poverty line of US$2 a day. The diversity of their income sources has reduced their dependency on a single resource (farming) and vulnerability to natural hazards and uncertain returns in volatile markets. This lends support to the assumption that they had the purchasing power to procure food items to complement what they produced on their own. This was made possible by the large percentage of those whose households had three or more family members with earning capacity. Another factor to consider is that more than half of the respondents had the capability to engage in self-employment, which could thrive only under a favourable socioeconomic environment.
In analysing the cause-and-effect relationship in a given socioeconomic setting, it is usually helpful to focus on the effect rather than on the cause. In judging a development initiative, the targeted beneficiaries can be the best barometers to assess the positive impacts or inefficacy of such initiatives. These notions received validation from the Bulacan farmers and housewives who contributed their economic experiences and shared their perceptions on how their LGUs had affected them.
Eight out of ten farmers interviewed acknowledged that their local government leaders had been helpful one way or another in their daily social life and economic pursuits. Their views were shared by 70 per cent of the women interviewed. What these figures indicate is that people are now more involved in the affairs of their LGUs and given the proper stimulus, they are willing and ready to respond to and be a part of local development efforts. A good example of this is the high percentage of farmers (82 per cent) who attended and benefited from the technical seminars and training programmes.
A salient feature of the Local Government Code is the granting of authority even to village leaders to address their concerns by themselves using the resources available to them. As articulated well during the interviews, whereas before the village people had to seek higher authorities’ assistance to bring up complaints, village officials themselves could now resolve minor and localized disputes onsite. This was evidenced by the high approval rating of LGUs on improved peace-and-order situation made possible by the deployment of barangay tanods.
26
Diminished incidence of petty thievery involving backyard produce and household property helped to create a feeling of human security that motivated village people to engage in various forms of entrepreneurial activities. Village women did not fear to roam around the streets to sell vegetables or open road-side eateries as they were assured that they were free from molestations and harassments of undesirable social elements.
The Bulacan experience, coupled with a situational assessment of the interrelationship between decentralized governance and food security efforts, provides a microcosm of the shifting dynamics that must be always put into focus and continually addressed to ensure that the social and economic order will prevail. It serves as a reminder that the beneficial aspects of devolution should be preserved but at the same time, be improved and enhanced particularly in the area of implementation. Policy Recommendations 1. Make the provincial governors the food czars of their respective provinces. It would be pragmatic and helpful if provincial governors would be designated as the equivalent of the DA Secretary (Minister) in their own provinces and made to head the food security programme. They are the ones more attuned to what needs to be done on the ground. They know the territory and the constraints. Thus, they can prescribe the more doable and sustainable solution.
Concerning food production, for example, provincial governors are more knowledgeable about the infrastructure constraints (irrigation, farm-to-market roads, and post-harvest facilities) that must be prioritized and put in place. They are prerequisites to sustained agricultural development efforts. They also know better the local market situation, the eating habits and preferences of the people, and the area topography as well as the production-carrying capacity of the agricultural lands in the province. Most important, they know that the people are aware that their tenure of elective office can only be as good as their performance and capability to fulfill their constituency’s expectations. As such, they can be expected to be more circumscribed in their decisions and judgment calls. By necessity, the local officials tend to be more sensitive to public perception of good governance. Their desire to win opprobrium from the electorate provides them a strong pressure to do their best. 2. Make decentralization more meaningful by devolving as well the corresponding budgetary outlay needed to fund LGUs’ development programmes. Based on the principle of subsidiarity, agricultural development functions have heen devolved to each level of government. Yet, there has been no clear assignment of expenditures to each level of government. Concomitant with the devolved functions,
27
corresponding budgetary allocations must also be devolved. Anyone who had had a hand in operational matters will agree that the chances of development programmes succeeding are only as good as the adequacy level of their funding. 3. Reengineer the DA’s procedures in formulating its annual programmes.
To make its programmes more needs-oriented, and to spur food production in the rural areas, the DA should solicit proposals from the provincial governments. Guidelines on proposal preparation should be disseminated so that the submissions of the different provinces would conform to the parameters on which inclusion in the national programmes should be based. 4. Provide a fixed line-item budget for LGU-initiated agricultural development proposals, once included in the DA’s national programme.
• Once the DA’s budget receives congressional approval, fund releases to the provincial governments should be automatic and no longer subject to the discretion of the Cabinet secretaries (ministers) of the DA and the Department of Budget and Management (DBM).
• The DA’s role then becomes merely ministerial and coordinative.
• To provide safeguards against fund misuse and abuse, an Oversight and
Monitoring Committee composed of the Undersecretaries for Operation of both the DA and the DBM, plus the PPDO Officer of each province, should be created.
A recurring dilemma for Cabinet secretaries is how to keep programme
implementation focused on predetermined needs while at the same time be able to accommodate “persuasive” interference from meddling national politicians who have a say on budget approval. Thus, if certain development programmes are given to LGUs for implementation, this balancing act will be shifted to the local level (where political susceptibility is lower). 5. Enable provincial governments to prepare and consolidate holistic development proposals by replicating the consultative process suggested to the DA.
• A provincial-level plenary workshop, with the Planning and Development Officers of all municipalities as participants, should be convened. During the workshop, proposals emanating from each municipality should be discussed and screened in accordance with an agreed set of criteria. All candidate proposals should be subjected to an evaluation process.
• The consolidated proposals would then be submitted to the governor who in turn
should direct the PPDO to determine which ones can be implemented using the provincial budget and which ones to endorse to the DA.
28
6. Strengthen the capacity of the devolved agricultural offices in enhancing food security; and address the grievances of the agricultural officers.
• Enhancing food security at the local level cannot be achieved without developing the capacity of the devolved agricultural offices. Strengthening their capacity will enable them to pursue agricultural modernization and meet the food security objectives of the LGUs.
• In addition to capacity development, there is a need to address the continuing
grievances of those who were devolved to poor provinces and municipalities. Through no fault of their own, they were made to suffer a diminution of their salary level. The provincial governments concerned should make a strong representation on their behalf, with both the DA and the DBM.
Those provinces whose revenue level has put the devolved agricultural officers in
the 4th and 5th class categories should seek a remittance to their coffers the equivalent of the differentials between the current (lower) salary rates of devolved agricultural officers and what they should be receiving by now had they been retained in the payroll of the DA. 7. Establish food security councils at the national and local levels. There are many reasons why the national government and LGUs should create food security councils. The most important is the need to broaden the discussion of issues beyond agricultural production and nutrition to involve a more comprehensive examination of issues relating to food security. The councils can also examine how LGUs are implementing food security programmes, the effectiveness of such programmes, and the causes of food insecurity or hunger. The councils can also be a vehicle to consider how the decisions of the stakeholders and actors concerned affect food security. They can also be a valuable resource for developing and implementing risk management activities designed to serve the food security needs of the disadvantaged and vulnerable groups in society. Local food councils can initiate local food mapping and food security assessments, and identify and strengthen community-based food security strategies, and with support from civil society organizations, strengthen food security in the local communities. They can also monitor food insecurity and vulnerability at the local level. 8. Continue the education and awareness programmes on food security. LGUs, in partnership with the private sector and civil society organizations, should continue to develop and conduct a series of educational programmes that will work to enhance community awareness, skills, and involvement in efforts to achieve food security in the community. This should include knowledge of food security, healthy food choices, food production and preservation, community-supported farming, reduced purchase of agricultural inputs, reduced use of insecticides and pesticides, direct marketing, and the root causes of hunger and malnutrition.
29
9. Incorporate the gender dimension in agricultural development and food security programmes. LGUs, in partnership with the private sector and civil society organizations, should give priority to agricultural development and food security programmes that recognize and empower women, particularly in those activities critical to maintaining food security for the family and community. Women are key contributors to household food security. They are also increasingly involved in traditionally male tasks, such as land preparation, irrigation, and threshing. LGUs should consider establishing a task force on women and agricultural development and food security. NOTES 1/ Department of the Interior and Local Government (DILG) and the Japan International Cooperation Agency (JICA), Devolution in National Governance (An Examination of the Devolved Functions in National Government Agencies) (Book I) (Quezon City: Bureau of Local Government Development, 2003). 2/ In their study titled, “Fiscal Decentralization and Economic Efficiency: Measurement and Evaluation” (Consulting Assistance on Economic Reform II. CAER Discussion Paper No. 38. Boston, MA: Harvard Institute for International Development, 1999), William Loehr and Rosario Manasan found that many LGUs were not able to meet their devolved expenditure responsibilities and create new expenditures out of their shared revenues. Provinces were particularly hard pressed to meet their expenditure responsibilities. Under the Local Government Code, local government units (LGUs) are entitled to receive 40 per cent of the internal revenue tax collections three years prior to the current year. The internal revenue allotment (IRA) is divided among the LGUs as follows: provinces (23 per cent); cities (23 per cent); municipalities (34 per cent); and barangays (20 per cent). The share of each LGU is determined by a formula that takes into account population, land area, and equal sharing 3/ A big portion of the national government budgets for 2004 (about P141 billion) and for 2005 (more than P100 billion) constitutes IRAs for LGUs. See “2005 Budget to be Signed Tuesday,” Philippine Star 11 March 2005); Jess Diaz, “Local Gov’ts Told to Rely Less on Nat’l Budget,” Philippine Star (14 October 2004); Des Ferriols, ‘LGUs’ Foreign Assisted Projects to Suffer from Budget Cuts,” Philippine Star (5 September 2004); and Des Ferriols, “LGUs Told to Fund Own Projects,” Philippine Star (31 October 2004) 4/ Iain Aitken, “Decentralization and Reproductive Health: Opportunities and Challenges” (Notes for presentation at the American Public Health Association Meeting, Indianapolis, 9-13 November 1997); and A. Mukherjee and S. Ndegwa, “Political Economy of Decentralization in the Philippines” (Washington, DC:
30
World Bank, 2005). 5/ Philippine Development Assistance Programme (PDAP), “The Sustainable Path to Food Security: A Case Study of PDAP-Initiated Project” ( Makati, 2004). Available at http://www.tritechdjs.com/casestudy.pdf; accessed 2/15/2005. 6/ World Bank, Poverty and Hunger: Issues and Options for Food Security in Developing Countries (Washington, DC, 1986). 7/ Adapted from S. Gervais, “Local Capacity Building in Title II Food Security Projects: A Framework” (Occasional Paper No. 3) (Washington, DC: USAID Office of Food for Peace, 2004). 8/ N. M. Messer, “Decentralization and Rural Food Security: Some Theoretical and Empirical Relationships,” Land Reform (1:1997). 9/ M. Koc et al., “Introduction: Food Security Is a Global Concern” in International Development Research Centre (IDRC), For Hunger-proof Cities’ Sustainable Urban Food Systems (Ottawa, 1999); and C. E. Schnell, “Strengthening Local Governance to Enhance the Impact and Sustainability of Food and Livelihood Security Interventions: Case Studies from CARE Honduras and Peru.” Available at http://kcenter.com/phls/FinalMunicipalStrengthening.pdf; accessed 1/12/2005. 10/ National Statistical Coordination Board (NSCB), “Statistics: Population and Housing.” Available at http://www.nscb.gov.ph; accessed 2/19/2005. 11/ Philippine Progress Report on the Millennium Development Goals (MDGs),
2003 (Makati City: United Nations Development Programme (UNDP), 2003).
12/ A. M. Balisacan, “High Population Growth Threatens Food Security” (Star Science) Philippine Star (17 March 2005). 13/ International Bank for Reconstruction and Development (IBRD), World Development Report, 1990 (Washington, DC: World Bank, 1990). 14/ Asian Development Bank (ADB), “ADB: RP Economic Growth Fails to Substantially Help Poor,” Philippine Star (21 February 2005). 15/ Philippine Progress Report on the MDGs. 16/ S. Crisostomo, “Population to Hit 84 M as More Families Become Poorer,” Philippine Star (1 March 2004). 17/ NSCB, “Philippine Minimum National Social Data Set.” Available at http://www.nscb.gov.ph/stats/mnsds/mnsds; accessed 2/19/2005.
18/ Philippines Poverty Assessment (Volume 1: Main Report) (Manila, 2000). 19/ Ibid. 20/ Philippine Progress Report on the MDGs. 21/ Ibid. 22/ ADB, “ADB.” 23/ Asian Development Outlook 2004 (Mandaluyong City: ADB, 2004). 24/ E. A. Morato, Jr., “Entrepreneurship and Economic Development,” Philippine Star (12 July 2004). 25/ Philippine Legislators’ Committee on Population and Development Foundation, “Philippine Food Security Situation” (Manila, 2001). Available at http: //www.plcpdfound.org/talkpoint/tp_foodSecurity.asp; accessed 2/5/2005. 26/ Bureau of Agricultural Statistics, “Performance of Philippine Agriculture, January-December 2004” (Manila, 2005). Available at http://bas.gov.ph/perflastyear.php; accessed 2/15/2005. 27/ C. A. Florencio, “Food and Nutritional Status of Filipinos and Nutrition Integration” (Paper presented at the 2003 University of the Philippines’ Alumni Council Meeting, Diliman, Quezon City, 20 June 2003). 28/ Economist Intelligence Unit (EIU), “Executive Briefing: Philippines” (Economist, 11 March 2005). Available at http://eb.eiu.com/index.asp?layout=oneclick&country_id=1610000161; accessed 3/12/2005). 29/ Ibid. 30/ Philippine Legislative Committee on Population and Development Foundation, “Philippine Food Security Situation.” 31/ FAO Statistical Yearbook, 2001 (Rome, 2002). 32/ “NFA to Import 400,000 Tons of Rice,” Philippine Star (11 March 2005). 33/ M. Mangabat, “Effects of Trade Liberalization on Agriculture in the Philippines:
Commodity Aspects” (Working paper series; no. 51) (Bogor: CGPRT Centre, 1998).
34/ EIU, “Executive Briefing.” 35/ Ibid. 36/ Philippine Progress Report on the MDGs. 37/ Florencio, “Food and Nutritional Status of Filipinos and Nutrition Integration.” 38/ Ibid. 39/ Food and Nutrition Research Institute (FNRI), “Sixth National Nutrition Survey” (Taguig, 2003). 40/ Philippine Progress Report on the MDGs. 41/ UNDP, “Poverty Report 2000: Philippines Country Assessment” (Manila, 2000). 42/ Food and Nutrition Research Institute (FNRI), Medium-Term Philippine Food and Nutrition Plan, 1999-2004 (Philippine Plan of Action for Nutrition) (Manila, 1998). 43/ “New RP Plan of Action for Nutrition Unveiled,” Philippine Star (6 March 2005). 44/ Philippine Progress Report on the MDGs. 45/ Walden Bello, “The GATT Agricultural Accord and Food Security: The Philippine Case” (Quezon City, 1998) Available at http://www.focusweb.org/publications/1998/; accessed 2/5/2005. 46/ F. J. Lara, Jr., “The Challenge of Securing Food for the Poor and Vulnerable: The Case of the Philippines” (Paper presented at the European Solidarity Conference on the Philippines, Reading, UK, 10-12 September 1999). Available at http://www.philsol.nl/solcon/Pancho-Lara-99.htm; accessed 2/8/2005. 47/ Integrated Rural Development Foundation of the Philippines, “Beyond Tarrifs, Markets and Trade” (Manila, 2002). Available at http://www.environmentalobservatory.org; accessed 2/8/2005. 48/ Florencio, “Food and Nutritional Status of Filipinos and Nutrition Integration.” 49/ Commission on Audit, Region III (Central Luzon), “Annual Audit Report on the Province of Bulacan for the year ended December 31, 2003” (San Fernando, Pampanga, 2003). 50/ Personal communication by Cristino M. Collado with an official from the Department of Agriculture (11 March 2005).