ORIGINAL RESEARCH ARTICLE published: 12 August 2014 doi: 10.3389/fpsyg.2014.00849 Decision-making in stimulant and opiate addicts in protracted abstinence: evidence from computational modeling with pure users Woo-Young Ahn 1 , Georgi Vasilev 2 , Sung-Ha Lee 3 , Jerome R. Busemeyer 3 , John K. Kruschke 3 , Antoine Bechara 4,5 and Jasmin Vassileva 6 * 1 Virginia Tech Carilion Research Institute, Virginia Tech, Roanoke, VA, USA 2 Bulgarian Addictions Institute, Sofia, Bulgaria 3 Department of Psychological and Brain Sciences, Indiana University, Bloomington, IN, USA 4 Department of Psychology, University of Southern California, Los Angeles, CA, USA 5 Brain and Creativity Institute, University of Southern California, Los Angeles, CA, USA 6 Department of Psychiatry, Virginia Commonwealth University School of Medicine, Richmond, VA, USA Edited by: Ching-Hung Lin, Kaohsiung Medical University, Taiwan Reviewed by: Eric-Jan Wagenmakers, University of Amsterdam, Netherlands Darrell A. Worthy, Texas A&M University, USA *Correspondence: Jasmin Vassileva, Department of Psychiatry, Institute for Drug and Alcohol Studies, Virginia Commonwealth University, 203 E. Cary Street, Richmond, VA 23219, USA e-mail: [email protected]Substance dependent individuals (SDI) often exhibit decision-making deficits; however, it remains unclear whether the nature of the underlying decision-making processes is the same in users of different classes of drugs and whether these deficits persist after discontinuation of drug use. We used computational modeling to address these questions in a unique sample of relatively “pure” amphetamine-dependent (N = 38) and heroin-dependent individuals (N = 43) who were currently in protracted abstinence, and in 48 healthy controls (HC). A Bayesian model comparison technique, a simulation method, and parameter recovery tests were used to compare three cognitive models: (1) Prospect Valence Learning with decay reinforcement learning rule (PVL-DecayRI), (2) PVL with delta learning rule (PVL-Delta), and (3) Value-Plus-Perseverance (VPP) model based on Win-Stay-Lose-Switch (WSLS) strategy. The model comparison results indicated that the VPP model, a hybrid model of reinforcement learning (RL) and a heuristic strategy of perseverance had the best post-hoc model fit, but the two PVL models showed better simulation and parameter recovery performance. Computational modeling results suggested that overall all three groups relied more on RL than on a WSLS strategy. Heroin users displayed reduced loss aversion relative to HC across all three models, which suggests that their decision-making deficits are longstanding (or pre-existing) and may be driven by reduced sensitivity to loss. In contrast, amphetamine users showed comparable cognitive functions to HC with the VPP model, whereas the second best-fitting model with relatively good simulation performance (PVL-DecayRI) revealed increased reward sensitivity relative to HC. These results suggest that some decision-making deficits persist in protracted abstinence and may be mediated by different mechanisms in opiate and stimulant users. Keywords: addiction, decision-making, computational modeling, heroin, amphetamine, protracted abstinence, Bayesian data analysis, Widely Applicable Information Criterion (WAIC) INTRODUCTION Drug addiction is a chronic relapsing brain disease, characterized by compulsive drug seeking and use despite negative conse- quences in major life domains (Goldstein and Volkow, 2011). Substance dependent individuals (SDI) are commonly charac- terized by decision-making deficits, both on laboratory tasks and in real life, manifested by lack of judgment and reduced concern for the consequences of their actions. What remains unknown, however, is whether these decision-making deficits are equally represented across addictions to different classes of drugs. Current theories consider addiction to different classes of drugs as a unitary phenomenon, in part based on evidence that most drugs of abuse act on the mesocortico/mesolimbic dopamine (DA) system (Wise, 1978; Di Chiara and Imperato, 1988; Robinson and Berridge, 1993). More recently, however, ani- mal and human studies have begun to reveal important cognitive and neurobiological differences between addictions to different classes of drugs, such as stimulants and opiates (Pettit et al., 1984; Rogers et al., 1999; Ersche et al., 2005b; Badiani et al., 2011). It is now well known that these two classes of drugs act on differ- ent mechanisms of DA modulation (Kreek et al., 2002, 2012). DA transmission mediates self-administration of stimulants, but not of opiates; in contrast, the μ-opiate receptor plays an important role for opiate, but not for stimulant self-administration (Badiani et al., 2011). Further, genetic studies reveal minimal overlap of genes associated with stimulant and opiate addiction (Yuferov et al., 2010). www.frontiersin.org August 2014 | Volume 5 | Article 849 | 1
Transcript
ORIGINAL RESEARCH ARTICLEpublished: 12 August 2014
doi: 10.3389/fpsyg.2014.00849
Decision-making in stimulant and opiate addicts inprotracted abstinence: evidence from computationalmodeling with pure usersWoo-Young Ahn1, Georgi Vasilev2, Sung-Ha Lee3, Jerome R. Busemeyer3, John K. Kruschke3,
Antoine Bechara4,5 and Jasmin Vassileva6*
1 Virginia Tech Carilion Research Institute, Virginia Tech, Roanoke, VA, USA2 Bulgarian Addictions Institute, Sofia, Bulgaria3 Department of Psychological and Brain Sciences, Indiana University, Bloomington, IN, USA4 Department of Psychology, University of Southern California, Los Angeles, CA, USA5 Brain and Creativity Institute, University of Southern California, Los Angeles, CA, USA6 Department of Psychiatry, Virginia Commonwealth University School of Medicine, Richmond, VA, USA
Eric-Jan Wagenmakers, Universityof Amsterdam, NetherlandsDarrell A. Worthy, Texas A&MUniversity, USA
*Correspondence:
Jasmin Vassileva, Department ofPsychiatry, Institute for Drug andAlcohol Studies, VirginiaCommonwealth University, 203 E.Cary Street, Richmond, VA 23219,USAe-mail: [email protected]
Substance dependent individuals (SDI) often exhibit decision-making deficits; however,it remains unclear whether the nature of the underlying decision-making processes isthe same in users of different classes of drugs and whether these deficits persistafter discontinuation of drug use. We used computational modeling to address thesequestions in a unique sample of relatively “pure” amphetamine-dependent (N = 38)and heroin-dependent individuals (N = 43) who were currently in protracted abstinence,and in 48 healthy controls (HC). A Bayesian model comparison technique, a simulationmethod, and parameter recovery tests were used to compare three cognitive models: (1)Prospect Valence Learning with decay reinforcement learning rule (PVL-DecayRI), (2) PVLwith delta learning rule (PVL-Delta), and (3) Value-Plus-Perseverance (VPP) model basedon Win-Stay-Lose-Switch (WSLS) strategy. The model comparison results indicated thatthe VPP model, a hybrid model of reinforcement learning (RL) and a heuristic strategyof perseverance had the best post-hoc model fit, but the two PVL models showedbetter simulation and parameter recovery performance. Computational modeling resultssuggested that overall all three groups relied more on RL than on a WSLS strategy.Heroin users displayed reduced loss aversion relative to HC across all three models, whichsuggests that their decision-making deficits are longstanding (or pre-existing) and may bedriven by reduced sensitivity to loss. In contrast, amphetamine users showed comparablecognitive functions to HC with the VPP model, whereas the second best-fitting modelwith relatively good simulation performance (PVL-DecayRI) revealed increased rewardsensitivity relative to HC. These results suggest that some decision-making deficits persistin protracted abstinence and may be mediated by different mechanisms in opiate andstimulant users.
Bayesian data analysis, Widely Applicable Information Criterion (WAIC)
INTRODUCTIONDrug addiction is a chronic relapsing brain disease, characterizedby compulsive drug seeking and use despite negative conse-quences in major life domains (Goldstein and Volkow, 2011).Substance dependent individuals (SDI) are commonly charac-terized by decision-making deficits, both on laboratory tasksand in real life, manifested by lack of judgment and reducedconcern for the consequences of their actions. What remainsunknown, however, is whether these decision-making deficitsare equally represented across addictions to different classes ofdrugs.
Current theories consider addiction to different classes ofdrugs as a unitary phenomenon, in part based on evidencethat most drugs of abuse act on the mesocortico/mesolimbic
dopamine (DA) system (Wise, 1978; Di Chiara and Imperato,1988; Robinson and Berridge, 1993). More recently, however, ani-mal and human studies have begun to reveal important cognitiveand neurobiological differences between addictions to differentclasses of drugs, such as stimulants and opiates (Pettit et al., 1984;Rogers et al., 1999; Ersche et al., 2005b; Badiani et al., 2011). Itis now well known that these two classes of drugs act on differ-ent mechanisms of DA modulation (Kreek et al., 2002, 2012). DAtransmission mediates self-administration of stimulants, but notof opiates; in contrast, the μ-opiate receptor plays an importantrole for opiate, but not for stimulant self-administration (Badianiet al., 2011). Further, genetic studies reveal minimal overlap ofgenes associated with stimulant and opiate addiction (Yuferovet al., 2010).
Ahn et al. Decision-making in pure substance users
Preclinical studies reveal notable differences between stimu-lants and opiates, which exert fundamentally different behavioraleffects, such that stimulants produce arousing and activatingeffects, whereas opiates produce mixed inhibitory and excitatoryeffects (Stewart et al., 1984). Of note, the rewarding effects ofstimulant self-administrations are greater in new and arousingenvironments than in familiar and safe environments, whereasthe opposite is observed with the sedative effects of opiates(Caprioli et al., 2008). Further, the neural pathway activated byaversive stimuli from lateral habenula to rostromedial tegmen-tal nucleus (RMTg) is affected by opiates, but not by stimulants(Lecca et al., 2011).
In contrast, studies comparing neurocognitive performanceof human stimulant and opiate users have shown mixed results.Some studies reveal distinct performance patterns in stimulantvs. opiate users. Rogers et al. (1999) report that amphetamineusers perform worse than healthy individuals on the CambridgeGambling Task, whereas opiate users display intact performanceon this decision task. In addition, duration of drug abuse wasassociated with suboptimal decision-making in stimulant users,but not in opiate users. In another study (Ornstein et al., 2000),amphetamine and heroin abusers were characterized by differ-ent attentional shifting deficits, with amphetamine users beingimpaired on the extra-dimensional (ED) and heroin users onthe intra-dimensional (ID) shift component of the task. Also,cocaine users, but not heroin users show deficits in responseinhibition (Verdejo-Garcia et al., 2007b). In contrast, other stud-ies reveal comparable neurocognitive profiles between users ofthese two classes of drugs. Both cocaine and heroin users showhigher discounting of delayed rewards compared to alcohol usersand healthy individuals (Kirby and Petry, 2004). Further, on atask measuring reflection impulsivity, both amphetamine- andopiate-dependent individuals sample less information and per-form worse than healthy individuals (Clark et al., 2006).
Decision-making is one of the neurocognitive domains onwhich SDI are commonly impaired. It is typically indexed in thelaboratory with tasks that simulate real-life decision-making suchas the Iowa Gambling Task (IGT) (Bechara et al., 1994), on whichSDI often select choices that yield high immediate gains but havehigher future losses (Grant et al., 2000; Bechara et al., 2001; Bollaet al., 2003; Bechara and Martin, 2004; Gonzalez et al., 2007;Vassileva et al., 2007a; Verdejo-Garcia et al., 2007a). Decision-making deficits among SDI are of immediate practical concern,in light of their associations with HIV risk behaviors (Gonzalezet al., 2005) and clinical outcomes such as abstinence (Passettiet al., 2008). The IGT is a complex task and poor behavioralperformance could be the result of deficits in various distinct neu-rocognitive processes, such as hypersensitivity to reward and/orhyposensitivity to losses, failure to learn from past outcomes andlosses, and/or erratic and impulsive response style. In a seriesof studies, Busemeyer et al. (Busemeyer and Stout, 2002; Stoutet al., 2004; Yechiam et al., 2005; Ahn et al., 2008) have devel-oped mathematical models of the task that capture the complexinterplay of cognitive and motivational processes involved indecision-making. The use of such models allows one to decom-pose behavioral performance on the task into distinct cogni-tive, motivational, and response processes, thereby providing a
fine-grained analysis of the underlying decision-making processesand characterizing more precisely the decision-making deficitsof different clinical groups. This approach yields quantifiableparameter estimates of such processes, which have been success-fully mapped in various clinical populations including cocaineusers, cannabis users, alcohol users, individuals with Asperger’sdisease, Huntington’s disease, schizophrenia, and bipolar disorder(for a review, see Yechiam et al., 2005), as well as in eating disor-ders (Chan et al., 2014) and patients with HIV (Vassileva et al.,2013). Studies applying this approach show that although behav-ioral performance may be similar across different clinical groups,the cognitive processes that underlie these behavioral profiles mayvary across groups in clinically meaningful ways.
The widespread polysubstance-dependence among SDI signif-icantly complicates attempts to dissociate pre-existing biologicalor personality characteristics from the effects of chronic use of dif-ferent classes of drugs on neurocognitive functioning (Fernández-Serrano et al., 2011; Gorodetzky et al., 2011; Baldacchino et al.,2012). Further, we still know very little about the reversibility ofthe observed neurocognitive deficits with abstinence, given thatwith few exceptions (Ersche et al., 2005a,b; Clark et al., 2006)most studies to date have focused on current drug users or onSDI who have been abstinent for rather brief periods of time.The chronic relapsing nature of addiction suggests that some ofthe neurocognitive deficits, particularly those in decision-making,may persist with abstinence and may be critically implicated inincreased susceptibility to relapse. In order to better understandthe brain’s recovery of function with protracted abstinence and torefine treatment interventions at different stages of the addictioncycle, it is crucial to get a better understanding of the specificityand the persistence of the neurocognitive deficits observed in drugusers.
To address these challenges, we conducted the current studyin Bulgaria, where polysubstance dependence is still relativelyuncommon and where we have access to a unique populationof fairly “pure” (monosubstance-dependent) amphetamine andheroin users who meet lifetime DSM-IV criteria for amphetamineor heroin dependence. The heroin epidemic in Bulgaria startedin the early 1990s after the end of communism, when Bulgariabecame a key transit country for heroin trafficking due to itsstrategic geographical position on the “Balkan Drug Route,” oneof the main routes for international drug traffic from South-West Asia to Western Europe. Estimates show that at timesup to 80% of heroin used in Western Europe passes throughthis route (European Monitoring Center for Drugs and DrugAddiction, 2011). The heroin epidemic reached its peak in 1997–1998, after which it plateaued. In the early 2000s, there werean estimated 20–30,000 regular heroin addicts in Bulgaria (pop-ulation of ∼7,476,000 people), which number has remainedsteady over the last decade, with a recent trend for a slightdecline. Typically, heroin addicts belong to a cohort of somewhataging addicts, ∼30 years of age. In contrast, the amphetamineepidemic in Bulgaria started more recently in the new millen-nium when Bulgaria became a major center for production ofsynthetic amphetamine-type stimulants and is currently one ofthe top five highest-prevalence countries in Europe (EuropeanMonitoring Center for Drugs and Drug Addiction, 2011). Hence,
Frontiers in Psychology | Decision Neuroscience August 2014 | Volume 5 | Article 849 | 2
Ahn et al. Decision-making in pure substance users
amphetamine users are typically younger—normally in their lateteens or early 20s. Notably, few SDI use the two types of drugsconcurrently.
We compared the decision-making performance of heroin andamphetamine users to that of healthy controls (HC) withoutany history of substance dependence. We followed these behav-ioral analyses by applying a computational modeling approach,in order to better characterize their decision-making styles andto disentangle the distinct neurocognitive processes underlyingthe decision-making performance of heroin and amphetamineusers. The modeling results and their interpretations depend onwhich model we use. Therefore, we first identified the best-fittingmodel by comparing three existing computational models usinga Bayesian model comparison technique, a simulation method,and parameter recovery tests (see Materials and Methods belowfor more details). Then, we compared groups in a Bayesian wayusing the best-fitting model, but also tested whether we wouldobserve similar group differences with the other models. Basedon previous animal and human studies, we hypothesized thatamphetamine and heroin users would show distinct decision-making profiles. Specifically, we expected that amphetamine userswould show increased reward sensitivity and heroin users wouldshow reduced loss aversion compared to HC (Spotts and Shontz,1980; Stewart et al., 1984; Kreek et al., 2002).
In light of the growing evidence for the relationship of exter-nalizing and internalizing personality traits and disorders withdecision-making and drug addiction, in exploratory analyses weconsidered the relationship between impulsivity and psychopathy(externalizing spectrum) and depression and anxiety (internal-izing spectrum) with decision-making. We hypothesized thatexternalizing but not internalizing traits and states would beassociated with compromised decision-making.
MATERIALS AND METHODSPARTICIPANTSStudy participants included 129 individuals, enrolled in a largerstudy of impulsivity in heroin and amphetamine users in Sofia,Bulgaria. Potential participants were recruited via flyers placed atsubstance abuse clinics, cafes, bars, and night clubs in Sofia andscreened via telephone and in-person on their medical and sub-stance use histories. SDI had lifetime DSM-IV histories of opiateor stimulant dependence. The current study included primarilymonosubstance-dependent users with no history of dependenceon alcohol or any drug other than opiates or stimulants (withthe exception of nicotine, caffeine, and/or past cannabis depen-dence). Demographically similar individuals with no history ofsubstance dependence were included as controls. Study partici-pants included 38 amphetamine users, 43 heroin users, and 48HC. Most of the heroin and amphetamine users were in pro-tracted abstinence at the time of testing (∼2.9 years on averagesince they last met DSM-IV criteria for substance dependence,minimum 3 months post discontinuation of drug use). Amongthe 38 amphetamine users, 11 were in early (<12 months ofabstinence) full (n = 9; 24%) or partial (n = 2; 5%) remis-sion and 27 were in sustained (>12 months of abstinence) full(n = 25; 66%) or partial (n = 2; 5%) remission. Among the 43heroin users, 12 (28%) were in early full remission, 30 (70%)
were in sustained full and one (2%) was in sustained partialremission.
Inclusion criteria consisted of age between 18 and 50 years,minimum of 8 years of formal education, ability to speak and readBulgarian, estimated IQ greater than 80, negative breathalyzer testfor alcohol and negative rapid urine toxicology screen for opiates,cannabis, amphetamines, methamphetamines, benzodiazepines,barbiturates, cocaine, MDMA, and methadone. Exclusion criteriaincluded history of neurologic illness or injury, history of psy-chotic disorders, and current opioid substitution therapy (OST).All participants were HIV-seronegative, as verified by rapid HIVtest. All participants provided written informed consent. Studyprocedures were approved by the Institutional Review Boards ofthe University of Illinois at Chicago and the Medical University inSofia on behalf of the Bulgarian Addictions Institute.
ASSESSMENTHistory of substance abuse and dependence was determinedusing the Structured Clinical Interview for DSM-IV SubstanceAbuse Module (SCID-SAM; First et al., 1996). The Raven’sProgressive Matrices was administered to index estimated IQ. Forthe exploratory analyses, the Barratt Impulsiveness Scale—11threvision (BIS-11; Patton and Stanford, 1995) indexed the per-sonality trait of impulsivity. Psychopathy was assessed with thePsychopathy Checklist: Screening Version (PCL:SV; Hart et al.,1995). Current depression was assessed with the [Beck DepressionInventory-II (BDI-II); Beck et al., 1996] and anxiety with the[State-Trait Anxiety Inventory (STAI); Spielberger and Gorsuch,1983]. For the exploratory analyses, we also tabulated several sub-stance use characteristics including number of years of drug use,length of abstinence from the primary drug of dependence, num-ber of DSM-IV criteria met for the primary drug of dependence,severity of nicotine dependence, and history of past cannabisdependence.
IOWA GAMBLING TASKDecision-making was measured with the computerized IGT(Bechara et al., 1994, 2001), arguably the most popular decisiontask in the addiction literature. The task requires participants toselect cards from one of four decks with the goal of maximizingprofits. Unbeknownst to participants, two of the decks (decksC and D) are advantageous (“good”) and two (decks A and B)are disadvantageous (“bad”) in terms of their long-term payoffs.The frequencies of punishment also vary across decks such thatpunishment is more frequent in decks A and C (50%) thanin decks B and D (10%). In the modified version of the IGT(Bechara et al., 2001) used in the current study, each deck hasup to 60 cards and the amounts of net gains or losses increasedincrementally in every block of 10 cards. For example, the netloss of decks A and B in the first block of 10 cards is -$250, butacross every block it goes up with $150 until it reaches $1000 inthe sixth block. Similarly, the net gain of decks C and D goes upfrom $250 in the first block to $375 in the sixth block, with anincrement of $25 in each block of 10 cards. The frequencies ofpunishment are identical to those in the original IGT version.Participants have to learn the task contingencies by trial-and-error. Healthy participants typically learn to select cards from the
Ahn et al. Decision-making in pure substance users
advantageous decks as the task progresses, thereby achieving ahigher cumulative reward value. Behavioral performance analyseswere based on the total net score, calculated by subtracting thenumber of disadvantageous deck selections from the number ofadvantageous deck selections. Trial-by-trial choice data of theHC, amphetamine, and heroin groups are available at http://figshare.com/articles/IGT_raw_data_Ahn_et_al_2014_Frontiers_in_Psychology/1101324.
COMPUTATIONAL MODELING OF DECISION-MAKINGFrom a statistical perspective, the IGT is a four-armed ban-dit problem (Berry and Fristedt, 1985), a special case of rein-forcement learning (RL) problems in which an agent needsto learn an environment by choosing actions and experienc-ing the outcomes of those actions. Poor performance on theIGT can be due to a number of distinct underlying neurocog-nitive processes such as poor learning/memory, hypersensitivityto reward, hyposensitivity to loss, or response inconsistency. Inorder to better characterize behavioral performance on the IGTand to disentangle the distinct neurocognitive processes under-lying the performance of pure heroin and amphetamine userson the task, we next used the computational modeling approach(Busemeyer and Stout, 2002; Yechiam et al., 2005; Ahn et al.,2008).
We compared three of the most promising models of theIGT according to the literature (e.g., Ahn et al., 2008, 2011;Steingroever et al., 2013, 2014; Worthy et al., 2013b): the ProspectValence Learning (PVL) model with delta learning rule (PVL-Delta) (Ahn et al., 2008), the PVL model with decay reinforce-ment learning rule (PVL-DecayRI) (Ahn et al., 2008, 2011), andthe Value-Plus-Perseverance model (VPP) (Worthy et al., 2013b).We used Watanabe-Akaike Information Criterion (also calledWidely Applicable Information Criterion; WAIC) (Watanabe,2010) to compare the post-hoc fits of models. We also used asimulation method to examine whether a model with estimatedparameters can generate the observed choice pattern (Ahn et al.,2008; Steingroever et al., 2014). We describe the mathematicaldetails of all models, which are also available in the previous pub-lication (Worthy et al., 2013b) as well as WAIC and the simulationmethod below.
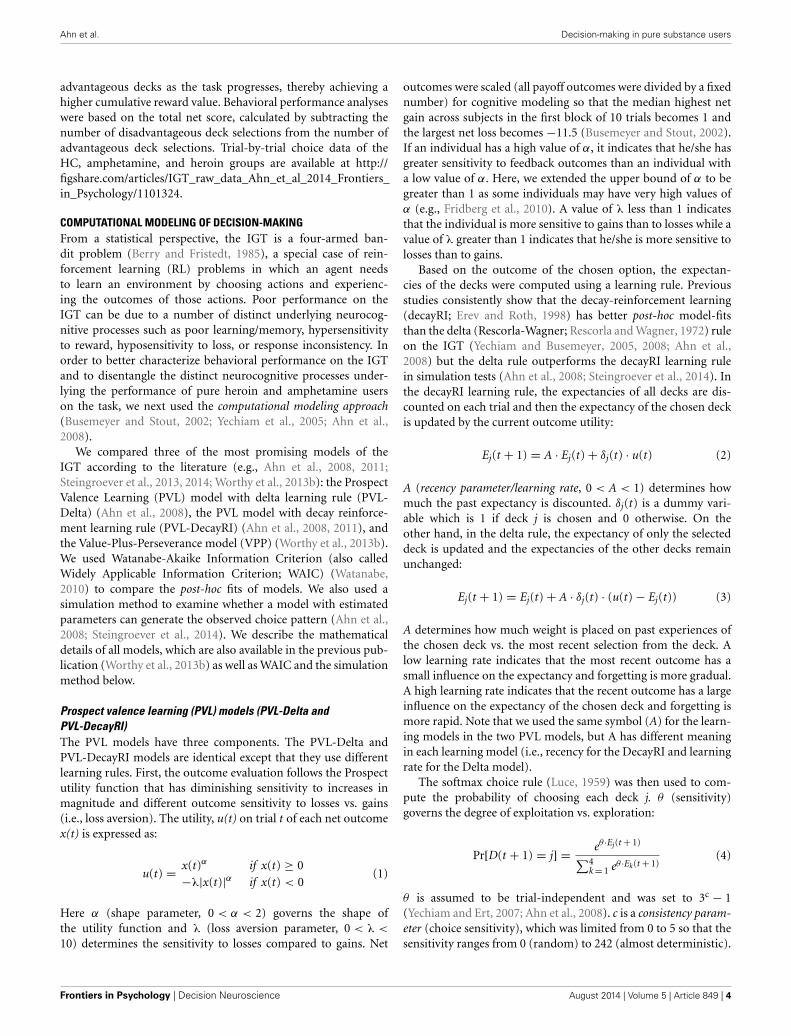
Prospect valence learning (PVL) models (PVL-Delta andPVL-DecayRI)The PVL models have three components. The PVL-Delta andPVL-DecayRI models are identical except that they use differentlearning rules. First, the outcome evaluation follows the Prospectutility function that has diminishing sensitivity to increases inmagnitude and different outcome sensitivity to losses vs. gains(i.e., loss aversion). The utility, u(t) on trial t of each net outcomex(t) is expressed as:
u(t) = x(t)α if x(t) ≥ 0−λ|x(t)|α if x(t) < 0
(1)
Here α (shape parameter, 0 < α < 2) governs the shape ofthe utility function and λ (loss aversion parameter, 0 < λ <
10) determines the sensitivity to losses compared to gains. Net
outcomes were scaled (all payoff outcomes were divided by a fixednumber) for cognitive modeling so that the median highest netgain across subjects in the first block of 10 trials becomes 1 andthe largest net loss becomes −11.5 (Busemeyer and Stout, 2002).If an individual has a high value of α, it indicates that he/she hasgreater sensitivity to feedback outcomes than an individual witha low value of α. Here, we extended the upper bound of α to begreater than 1 as some individuals may have very high values ofα (e.g., Fridberg et al., 2010). A value of λ less than 1 indicatesthat the individual is more sensitive to gains than to losses while avalue of λ greater than 1 indicates that he/she is more sensitive tolosses than to gains.
Based on the outcome of the chosen option, the expectan-cies of the decks were computed using a learning rule. Previousstudies consistently show that the decay-reinforcement learning(decayRI; Erev and Roth, 1998) has better post-hoc model-fitsthan the delta (Rescorla-Wagner; Rescorla and Wagner, 1972) ruleon the IGT (Yechiam and Busemeyer, 2005, 2008; Ahn et al.,2008) but the delta rule outperforms the decayRI learning rulein simulation tests (Ahn et al., 2008; Steingroever et al., 2014). Inthe decayRI learning rule, the expectancies of all decks are dis-counted on each trial and then the expectancy of the chosen deckis updated by the current outcome utility:
Ej(t + 1) = A · Ej(t) + δj(t) · u(t) (2)
A (recency parameter/learning rate, 0 < A < 1) determines howmuch the past expectancy is discounted. δj(t) is a dummy vari-able which is 1 if deck j is chosen and 0 otherwise. On theother hand, in the delta rule, the expectancy of only the selecteddeck is updated and the expectancies of the other decks remainunchanged:
A determines how much weight is placed on past experiences ofthe chosen deck vs. the most recent selection from the deck. Alow learning rate indicates that the most recent outcome has asmall influence on the expectancy and forgetting is more gradual.A high learning rate indicates that the recent outcome has a largeinfluence on the expectancy of the chosen deck and forgetting ismore rapid. Note that we used the same symbol (A) for the learn-ing models in the two PVL models, but A has different meaningin each learning model (i.e., recency for the DecayRI and learningrate for the Delta model).
The softmax choice rule (Luce, 1959) was then used to com-pute the probability of choosing each deck j. θ (sensitivity)governs the degree of exploitation vs. exploration:
θ is assumed to be trial-independent and was set to 3c − 1(Yechiam and Ert, 2007; Ahn et al., 2008). c is a consistency param-eter (choice sensitivity), which was limited from 0 to 5 so that thesensitivity ranges from 0 (random) to 242 (almost deterministic).
Frontiers in Psychology | Decision Neuroscience August 2014 | Volume 5 | Article 849 | 4
Ahn et al. Decision-making in pure substance users
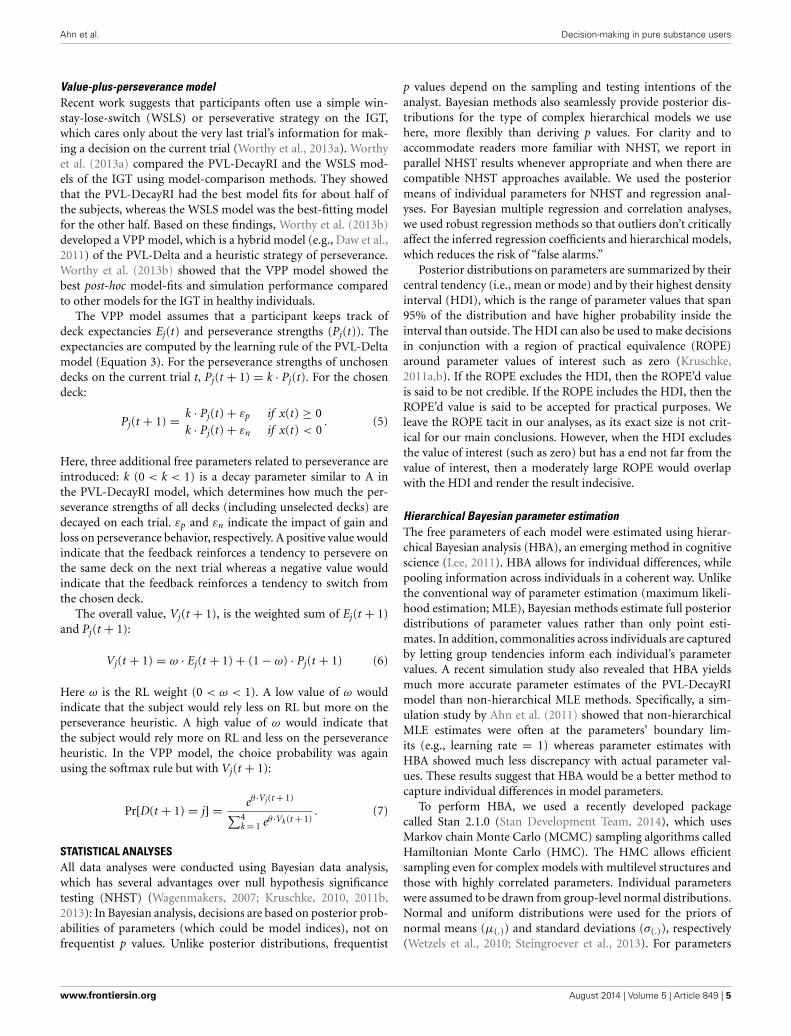
Value-plus-perseverance modelRecent work suggests that participants often use a simple win-stay-lose-switch (WSLS) or perseverative strategy on the IGT,which cares only about the very last trial’s information for mak-ing a decision on the current trial (Worthy et al., 2013a). Worthyet al. (2013a) compared the PVL-DecayRI and the WSLS mod-els of the IGT using model-comparison methods. They showedthat the PVL-DecayRI had the best model fits for about half ofthe subjects, whereas the WSLS model was the best-fitting modelfor the other half. Based on these findings, Worthy et al. (2013b)developed a VPP model, which is a hybrid model (e.g., Daw et al.,2011) of the PVL-Delta and a heuristic strategy of perseverance.Worthy et al. (2013b) showed that the VPP model showed thebest post-hoc model-fits and simulation performance comparedto other models for the IGT in healthy individuals.
The VPP model assumes that a participant keeps track ofdeck expectancies Ej(t) and perseverance strengths (Pj(t)). Theexpectancies are computed by the learning rule of the PVL-Deltamodel (Equation 3). For the perseverance strengths of unchosendecks on the current trial t, Pj(t + 1) = k · Pj(t). For the chosendeck:
Pj(t + 1) = k · Pj(t) + εp if x(t) ≥ 0k · Pj(t) + εn if x(t) < 0
. (5)
Here, three additional free parameters related to perseverance areintroduced: k (0 < k < 1) is a decay parameter similar to A inthe PVL-DecayRI model, which determines how much the per-severance strengths of all decks (including unselected decks) aredecayed on each trial. εp and εn indicate the impact of gain andloss on perseverance behavior, respectively. A positive value wouldindicate that the feedback reinforces a tendency to persevere onthe same deck on the next trial whereas a negative value wouldindicate that the feedback reinforces a tendency to switch fromthe chosen deck.
The overall value, Vj(t + 1), is the weighted sum of Ej(t + 1)and Pj(t + 1):
Here ω is the RL weight (0 < ω < 1). A low value of ω wouldindicate that the subject would rely less on RL but more on theperseverance heuristic. A high value of ω would indicate thatthe subject would rely more on RL and less on the perseveranceheuristic. In the VPP model, the choice probability was againusing the softmax rule but with Vj(t + 1):
STATISTICAL ANALYSESAll data analyses were conducted using Bayesian data analysis,which has several advantages over null hypothesis significancetesting (NHST) (Wagenmakers, 2007; Kruschke, 2010, 2011b,2013): In Bayesian analysis, decisions are based on posterior prob-abilities of parameters (which could be model indices), not onfrequentist p values. Unlike posterior distributions, frequentist
p values depend on the sampling and testing intentions of theanalyst. Bayesian methods also seamlessly provide posterior dis-tributions for the type of complex hierarchical models we usehere, more flexibly than deriving p values. For clarity and toaccommodate readers more familiar with NHST, we report inparallel NHST results whenever appropriate and when there arecompatible NHST approaches available. We used the posteriormeans of individual parameters for NHST and regression anal-yses. For Bayesian multiple regression and correlation analyses,we used robust regression methods so that outliers don’t criticallyaffect the inferred regression coefficients and hierarchical models,which reduces the risk of “false alarms.”
Posterior distributions on parameters are summarized by theircentral tendency (i.e., mean or mode) and by their highest densityinterval (HDI), which is the range of parameter values that span95% of the distribution and have higher probability inside theinterval than outside. The HDI can also be used to make decisionsin conjunction with a region of practical equivalence (ROPE)around parameter values of interest such as zero (Kruschke,2011a,b). If the ROPE excludes the HDI, then the ROPE’d valueis said to be not credible. If the ROPE includes the HDI, then theROPE’d value is said to be accepted for practical purposes. Weleave the ROPE tacit in our analyses, as its exact size is not crit-ical for our main conclusions. However, when the HDI excludesthe value of interest (such as zero) but has a end not far from thevalue of interest, then a moderately large ROPE would overlapwith the HDI and render the result indecisive.
Hierarchical Bayesian parameter estimationThe free parameters of each model were estimated using hierar-chical Bayesian analysis (HBA), an emerging method in cognitivescience (Lee, 2011). HBA allows for individual differences, whilepooling information across individuals in a coherent way. Unlikethe conventional way of parameter estimation (maximum likeli-hood estimation; MLE), Bayesian methods estimate full posteriordistributions of parameter values rather than only point esti-mates. In addition, commonalities across individuals are capturedby letting group tendencies inform each individual’s parametervalues. A recent simulation study also revealed that HBA yieldsmuch more accurate parameter estimates of the PVL-DecayRImodel than non-hierarchical MLE methods. Specifically, a sim-ulation study by Ahn et al. (2011) showed that non-hierarchicalMLE estimates were often at the parameters’ boundary lim-its (e.g., learning rate = 1) whereas parameter estimates withHBA showed much less discrepancy with actual parameter val-ues. These results suggest that HBA would be a better method tocapture individual differences in model parameters.
To perform HBA, we used a recently developed packagecalled Stan 2.1.0 (Stan Development Team, 2014), which usesMarkov chain Monte Carlo (MCMC) sampling algorithms calledHamiltonian Monte Carlo (HMC). The HMC allows efficientsampling even for complex models with multilevel structures andthose with highly correlated parameters. Individual parameterswere assumed to be drawn from group-level normal distributions.Normal and uniform distributions were used for the priors ofnormal means (μ(.)) and standard deviations (σ(.)), respectively(Wetzels et al., 2010; Steingroever et al., 2013). For parameters
Ahn et al. Decision-making in pure substance users
(say ζ for a general parameter for illustration purposes) that arebounded between 0 and 1 (e.g., A, k, ω):
μξ ′ ∼ Normal (0, 1), σξ ′ ∼ Uniform (0, 1.5),
ξ ′ ∼ Normal (μξ ′ , σξ ′), ξ = Probit (ξ ′) (8)
While Worthy et al. (2013b) set the boundary limits of εp and εn
at [−1, 1], we set no bound constraints on εp and εn. We believesuch boundary limits are useful for practical purposes in MLEbut not in HBA methods. For those parameters with no boundconstraints:
ξ ∼ Normal (μξ , σξ ), μξ ∼ Normal (0, 5),
σξ ∼ Uniform (0, 1.5) (9)
For parameters that are constrained to be greater than zero butwith an upper limit (=U) (e.g., U = 2 for α, U = 10 for λ, U = 5for c), we used the following transformations to allow a flat priordistribution over a full range:
μξ ′ ∼ Normal (0, 1), σξ ′ ∼ Uniform (0, 1.5),
ξ ′ ∼ Normal (μξ ′ , σξ ′), ξ = U · Probit (ξ ′) (10)
We also reparameterized parameters (i.e., parameters aresampled as independent unit normals and then transformedaccordingly for each parameter), which can be effective for com-plex hierarchical models, as suggested by Stan developers (seeChapter 19 “Optimizing Stan Code” of the Stan 2.1.0 Manual;https://github.com/stan-dev/stan/releases/download/v2.1.0/stan-reference-2.1.0.pdf).
A total of 2000 samples were drawn after 1000 burn-in sam-ples for each of 3 chains (=2000 samples × 3 chains = a totalof 6000 samples). We estimated individual and group parametersseparately for each population (HC, amphetamine, and heroingroups). For each parameter, the Gelman-Rubin test (Gelman andRubin, 1992) was used to check the convergence of the chains(a.k.a. R̂ statistic). R̂ values close to 1.00 would indicate thatMCMC chains are converged to the target distributions. In ourdata, all model parameters of all models had R̂ values of 1.00.MCMC chains were also visually inspected, which confirmedexcellent mixing of MCMC samples. Effective sample sizes (ESS)of model parameters, which are related to autocorrelation andmixing of MCMC chains (i.e., a smaller ESS is related to higherautocorrelation), were typically greater than 1000 (out of 6000total samples). The minimum ESS of hyper-parameters was 561 inthe two PVL models, and 372 in the VPP model. Visual inspectionof the parameters with smaller ESSs confirmed their convergenceto target distributions.
Model comparisons using WAICWAIC is a way to estimate a model’s predictive accuracy with biascorrection from over-fitting like Akaike Information Criterion(AIC; Akaike et al., 1973) and Deviance Information Criterion(DIC; Spiegelhalter et al., 2002). As a measure of predictive accu-racy, the log predictive density or log-likelihood, log p(y|θ), is
commonly used where y and θ indicate data and model parame-ters, respectively. WAIC is “a more fully Bayesian approach” thatuses log pointwise posterior predictive density (lppd) and a cor-rection (or penalty) term, each of which can be computed fromMCMC samples made available from (hierarchical) Bayesianparameter estimation (for reviews and more details, see Gelmanet al., 2013a,b).
Computed lppd (for each participant i; subscript i is omittedfor convenience) is defined as:
T∑t = 1
log
(1
S
S∑s = 1
p(yt |θ s)) (11)
Here θ s are posterior MCMC samples (s = 1, 2, . . . , S) and T isthe number of trials (data points). Note that the likelihood dom-inates the posterior under standard conditions where a posteriordistribution approaches a normal distribution (Degroot, 1970;Gelman et al., 2013a,b).
There is a correction term that adjusts for the effective numberof parameters and overfitting. There are two types of adjustments(pWAIC1 and pWAIC2) (Gelman et al., 2013a,b). Gelman et al.(2013a,b) recommended pWAIC2 because of its closer relationshipwith leave-one-out cross validation than pWAIC1. We report resultsusing pWAIC2 but both adjustments yielded very similar values.Computed pWAIC2 (for each participant i, subscript i is omittedfor convenience here) is defined as:
T∑t = 1
VSs = 1
(log p
(yt |θ s)) (12)
where VSs = 1 indicates the sample variance (i.e., the variance of
log p(yt |θ s) over S samples). WAICi for each participant i isdefined like the following so that its value is on the deviance scalelike AIC, DIC, and BIC (Schwartz, 1978).
WAICi = −2 ∗ (lppd − pWAIC2) (13)
We computed lppd and pWAIC2 by rewriting the separate like-lihood function in R (R Development Core Team, 2009) butit is also possible to implement WAIC in a Stan code directly(Vehtari and Gelman, under review). Specifically; we first ran-domly sampled 1,000 (S = 1,000 in Equations 11 and 12)posterior samples from each subject’s individual posterior dis-tributions. We used posterior individual distributions (insteadof group distributions) for the calculation because our goal wasto replicate new data and evaluate predictive accuracy in exist-ing groups. Then we prepared a matrix of each subject fortrial-by-trial predictive density (p(yt |θ s), matrix size = num-ber of samples × number of trials = 1000 × 100). Trial-by-trialpredictive density was computed for each subject using eachposterior sample separately. Then, using Equations (11–13), wecomputed lppd, pWAIC2, and WAICi for each participant, and thensummed WAICi over all participants for each model (Table 3).The R codes for performing HBA and computing WAIC areavailable by request to the first author (Woo-Young Ahn;[email protected]).
Frontiers in Psychology | Decision Neuroscience August 2014 | Volume 5 | Article 849 | 6
Ahn et al. Decision-making in pure substance users
Simulation methodWe also used a simulation method to evaluate how accurately amodel can generate observed choice pattern in new and unob-served payoff sequences based on parameter values alone (Ahnet al., 2008; Fridberg et al., 2010; Steingroever et al., 2013, 2014).Using the procedure in Appendix B of Ahn et al. (2008) and indi-vidual posterior means as a subject’s best fitting parameters, wetested the simulation performance of each model. We set the max-imum number of trials to 100 and used the payoff schedule of themodified IGT. We only report the results using individual poste-rior means but we note that running simulations using randomdraws from individual posteriors (Steingroever et al., 2013, 2014)yielded very similar results (not reported for brevity).
Parameter recovery testsUsing parameter recovery tests, we tested the adequacy ofeach model, specifically how well each model can recover trueparameter values that were used to simulate synthetic data (Ahnet al., 2011; Steingroever et al., 2013). We simulated HC par-ticipants’ performance on the modified IGT assuming that theybehaved according to each model. We generated true parametervalues based on the individual posterior means of the HC group.Then we simulated synthetic behavioral data based on the param-eters, and then recovered their parameter values using the HBAdescribed in Section Hierarchical Bayesian Parameter Estimation.See Appendix for the details.
Hierarchical Bayesian multiple regression analysesFor multiple regression analyses, often many candidate predictorsare included in the model, which increases the risk of erroneouslydeciding that a regression coefficient is non-zero. In many cases,regression coefficients are distributed like a t distribution, suchthat the predicted variable has non-significant correlations withmost candidate predictors, but a sizable relationship with only afew predictors. Also, some predictors are substantially correlatedwith each other, which suggests that estimating regression coeffi-cients separately for each predictor can possibly be misleading.
We assigned a higher-level distribution across the regres-sion coefficients of the various predictors. Specifically, regres-sion coefficients came from a t distribution with parame-ters (mean, scale, and df) estimated from the data. Becauseof this hierarchical structure, estimated regression coefficientsexperience shrinkage and are less likely to produce falsealarms. We used the program “MultiLinRegressHyperJAGS.R”from Kruschke (2011b), available at http://www.indiana.edu/%7Ekruschke/DoingBayesianDataAnalysis/Programs/.
We used Just Another Gibbs Sampler (JAGS) for MCMCsampling and for posterior inference of regression analyses. Foreach analysis, a total of 50,000 samples per chain were drawnafter 1000 adaptive and 1000 burn-in samples with three chains.For each parameter, the Gelman-Rubin test was run to confirmthe convergence of the chains. R̂ mean values were 1.00 for allparameters.
Bayesian estimation for group comparisonsFor Bayesian estimation for group differences, (e.g., on behav-ioral performance, Figure 1), we used Bayesian estimation
FIGURE 1 | Behavioral performance on the IGT (net score of
“advantageous”—“disadvantageous” choices) of amphetamine,
heroin, and healthy control groups. The 100 trials were divided into fiveblocks of 20 trials. Shaded regions indicate ±1 s.e.m.
(BEST) codes that are available at: http://www.indiana.edu/∼kruschke/BEST/. The analysis is implemented in JAGS andwe used a total of 50,000 samples after 1000 adaptive and 1000burn-in samples were drawn. R̂ mean values were 1.00 for allparameters. For more details about BEST, see Kruschke (2013).
RESULTSPARTICIPANTS’ CHARACTERISTICSTable 1 shows demographic and substance use characteristics ofparticipants. The groups differed on age, such that HC individ-uals were younger than heroin users [95% HDI from 3.5 to 6.8,mean of HDI = 5.1; t(89) = 4.81, p = 6.11E-06] and older thanamphetamine users [95% HDI from 0.1 to 3.4, mean of HDI =1.8; t(84) = 2.11, p = 0.037], reflecting the timeline of heroin andamphetamine influx in Bulgaria. HC individuals had higher IQthan both amphetamine [95% HDI from 0.4 to 11.1, mean ofHDI = 6.0; t(84) = 2.28, p = 0.025] and heroin users [95% HDIfrom 2.9 to 12.8, mean of HDI = 7.8; t(89) = 3.13, p = 0.002],but there was no difference between the two drug-using groups[95% HDI from −7.8 to 3.6; mean of HDI = −2.0; t(79) = 0.66,p = 0.510].
As reported in Table 2, the two drug using groups scoredhigher on trait impulsivity (BIS-11) [HC vs. Amphetamine: 95%HDI from 5.5 to 14.9, mean of HDI = 10.2; t(83) = 4.66, p =1.19E-05; HC vs. Heroin: 95% HDI from 5.6 to 13.7, mean ofHDI = 9.7; t(88) = 4.87, p = 4.90E-06] and psychopathy(PCL:SV) [HC vs. Amphetamine: 95% HDI from 4.0 to 7.7,mean of HDI = 5.8; t(84) = 6.49, p = 5.72E-09; HC vs. Heroin:95% HDI from 7.4 to 11.1, mean of HDI = 9.3; t(89) = 10.62,
Years of amph./heroin use – 3.2 (2.3) 7.2 (3.5) p < 0.001
Years of any drug use – 6.5 (2.7) 10.8 (3.6) p < 0.001
# of amph./heroin DSM-IV dependence criteria met – 4.9 (1.3) 6.1 (1.0) p < 0.001
Time (years) since last met dependence criteria – 2.8 (1.6) 2.9 (2.2) p = 0.89
Fagerstrom test of nicotine dependenced 0.7 (1.6) 3.3 (2.8) 4.7 (2.7) p < 0.001
Min–Max days since last drug use – 90–2190 152–3285 –
Past cannabis dependence (%)e 0 12 (32%) 6 (14%) p < 0.001
aH > HC > A (Bayesian and NHST t-tests yielded the same conclusions).bHC > A, H (Bayesian and NHST t-tests yielded same conclusions).cHC > A (Bayesian and NHST t-tests yielded same conclusions).d H >A > HC (Bayesian and NHST t-tests yielded same conclusions).eA > H > HC (Bayesian and NHST χ -square tests yielded same conclusions).f Sig. results are based on omnibus NHST ANOVA tests.
Table 2 | Personality and psychopathology characteristics of
participants.
HC A H Group
comparisons
BIS total 55.96 (9.1) 66.13 (11.0) 65.70 (9.9) HC < A, H
BIS attention 14.28 (3.7) 16.32 (4.1) 16.56 (5.3) HC < A, H
BIS motor 20.40 (3.8) 25.18 (5.2) 23.12 (5.0) HC < A, H
BIS nonplanning 21.23 (4.3) 24.63 (4.4) 25.70 (3.9) HC < A, H
PCL:SV 3.67 (3.2) 9.34 (4.9) 12.19 (4.4) HC < A < H
BDI-II total 4.21 (4.1) 6.62 (5.6) 8.26 (6.4) HC < A, H
State anxiety (STAI-S) 29.42 (5.9) 33.68 (7.7) 36.12 (10.1) HC < A, H
Trait anxiety (STAI-T) 34.33 (8.7) 38.58 (9.3) 39.98 (10.1) HC < A, H
All group comparison results are based on Bayesian tests. HC, healthy con-
trols; A, amphetamine; H, heroin; BIS, Barratt Impulsiveness Scale; PCL:SV,
p = 2.20E-16] than HC individuals. Comparisons between thetwo drug using groups revealed that heroin users had higher lev-els of psychopathy than amphetamine users [HDI from 0.8 to 5.1,mean of HDI = 3.0; t(79) = 2.73, p = 0.008]. Both amphetamineand heroin users scored higher on depression (BDI-II) [HCvs. Amphetamine: 95% HDI from −4.4 to −0.5, mean ofHDI = −2.3; t(82) = 2.26, p = 0.026; HC vs. Heroin: 95% HDIfrom −5.8 to −1.7, mean of HDI = −3.8; t(88) = 3.59, p =5.40E-04], state anxiety (STAI-S) [HC vs. Amphetamine: 95%HDI from −7.7 to −1.6, mean of HDI = −4.5; t(84) = 2.90,p = 4.7E-04; HC vs. Heroin: 95% HDI from −9.7 to −2.5,mean of HDI = −6.4; t(89) = 3.90, p = 1.80E-04], and trait anx-iety (STAI-T) [HC vs. Amphetamine: 95% HDI from −8.5to −0.3, mean of HDI = −4.4; t(84) = 2.18, p = 0.032; HC vs.Heroin: 95% HDI from −10.0 to −1.3, mean of HDI = −5.6;
t(89) = 2.86, p = 0.005] than HC individuals. There were nodifferences between the two drug using groups on these measures.
BEHAVIORAL RESULTSBehavioral results revealed that the HC group made more advan-tageous choices than the heroin group [difference of mean netscore (advantageous—disadvantageous choices per five blocks of20 trials) = 2.77, 95% HDI from 0.7 to 4.8, mean of HDI = 2.8;t(90) = 2.80, p < 0.010] and marginally than the amphetaminegroup [difference of mean net score = 1.14, 95% HDI from −0.1to 2.3, mean of HDI = 1.9; with 95.3% of the posterior sam-ples were greater than 0; t(84) = 2.02, p = 0.047]. There wereno behavioral differences between the two drug using groups interms of net scores (see Figure 1). Further, the choice patternsof these two groups were qualitatively different from those ofthe HC group. As shown in Figures S1–S3 (left), whereas theHC group favored one of the advantageous decks (Deck D) asthe task progressed, both amphetamine and heroin users consis-tently favored the disadvantageous deck B throughout the task.Decks B and D carry low-frequency losses and are usually cho-sen more often than decks with high-frequency losses such as Aand C, yet one is disadvantageous (Deck B) whereas the otherone is advantageous (Deck D). Our results demonstrate that pastdrug users who are currently in protracted abstinence continueto show similar preference for disadvantageous decks as cur-rently dependent drug users (Bechara et al., 2001; Yechiam et al.,2005).
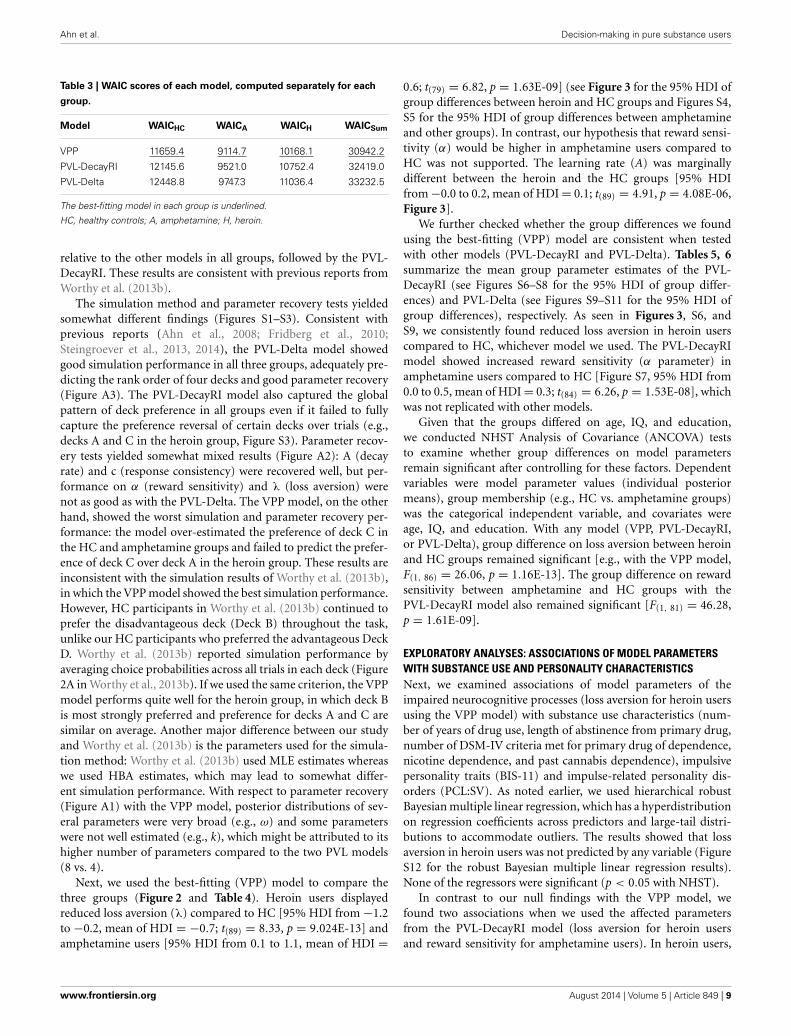
MODEL COMPARISONS RESULTSWe first checked which model provided the best predictive accu-racy, as measured by WAIC. Table 3 presents WAIC scores foreach model, summarized for each group. Note that the smallera model’s values of WAIC scores are, the better its model-fits are.As noted in Table 3, the VPP model provided the best model-fits
Frontiers in Psychology | Decision Neuroscience August 2014 | Volume 5 | Article 849 | 8
Ahn et al. Decision-making in pure substance users
Table 3 | WAIC scores of each model, computed separately for each
group.
Model WAICHC WAICA WAICH WAICSum
VPP 11659.4 9114.7 10168.1 30942.2
PVL-DecayRI 12145.6 9521.0 10752.4 32419.0
PVL-Delta 12448.8 9747.3 11036.4 33232.5
The best-fitting model in each group is underlined.
HC, healthy controls; A, amphetamine; H, heroin.
relative to the other models in all groups, followed by the PVL-DecayRI. These results are consistent with previous reports fromWorthy et al. (2013b).
The simulation method and parameter recovery tests yieldedsomewhat different findings (Figures S1–S3). Consistent withprevious reports (Ahn et al., 2008; Fridberg et al., 2010;Steingroever et al., 2013, 2014), the PVL-Delta model showedgood simulation performance in all three groups, adequately pre-dicting the rank order of four decks and good parameter recovery(Figure A3). The PVL-DecayRI model also captured the globalpattern of deck preference in all groups even if it failed to fullycapture the preference reversal of certain decks over trials (e.g.,decks A and C in the heroin group, Figure S3). Parameter recov-ery tests yielded somewhat mixed results (Figure A2): A (decayrate) and c (response consistency) were recovered well, but per-formance on α (reward sensitivity) and λ (loss aversion) werenot as good as with the PVL-Delta. The VPP model, on the otherhand, showed the worst simulation and parameter recovery per-formance: the model over-estimated the preference of deck C inthe HC and amphetamine groups and failed to predict the prefer-ence of deck C over deck A in the heroin group. These results areinconsistent with the simulation results of Worthy et al. (2013b),in which the VPP model showed the best simulation performance.However, HC participants in Worthy et al. (2013b) continued toprefer the disadvantageous deck (Deck B) throughout the task,unlike our HC participants who preferred the advantageous DeckD. Worthy et al. (2013b) reported simulation performance byaveraging choice probabilities across all trials in each deck (Figure2A in Worthy et al., 2013b). If we used the same criterion, the VPPmodel performs quite well for the heroin group, in which deck Bis most strongly preferred and preference for decks A and C aresimilar on average. Another major difference between our studyand Worthy et al. (2013b) is the parameters used for the simula-tion method: Worthy et al. (2013b) used MLE estimates whereaswe used HBA estimates, which may lead to somewhat differ-ent simulation performance. With respect to parameter recovery(Figure A1) with the VPP model, posterior distributions of sev-eral parameters were very broad (e.g., ω) and some parameterswere not well estimated (e.g., k), which might be attributed to itshigher number of parameters compared to the two PVL models(8 vs. 4).
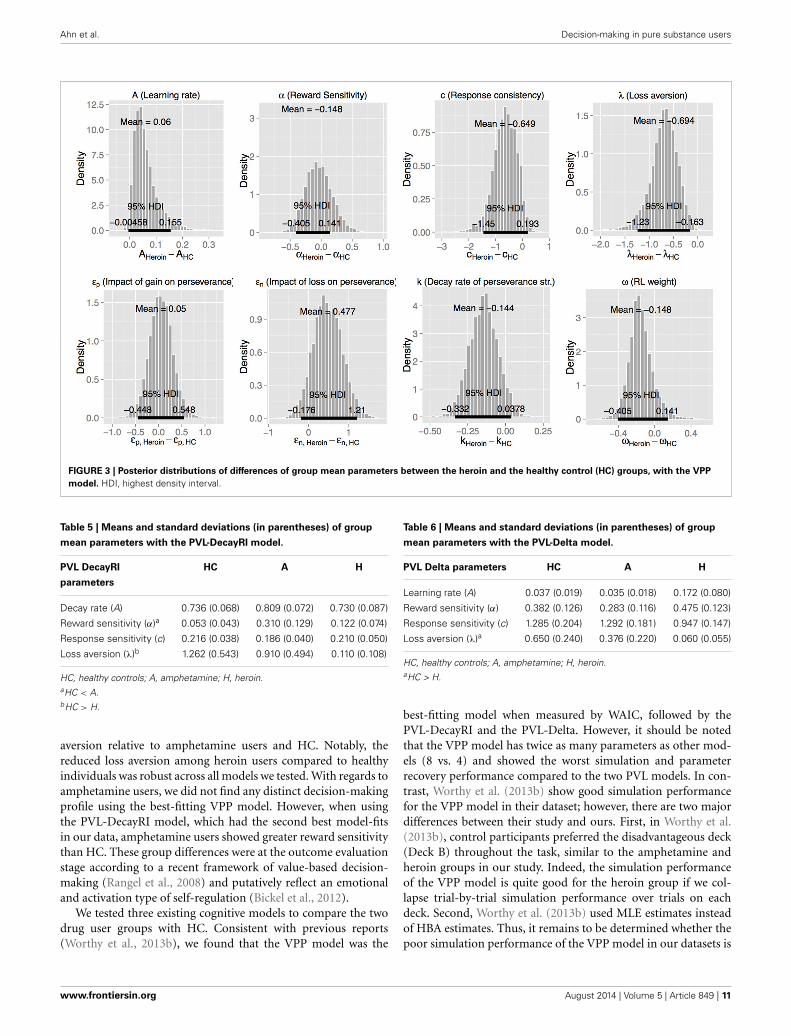
Next, we used the best-fitting (VPP) model to compare thethree groups (Figure 2 and Table 4). Heroin users displayedreduced loss aversion (λ) compared to HC [95% HDI from −1.2to −0.2, mean of HDI = −0.7; t(89) = 8.33, p = 9.024E-13] andamphetamine users [95% HDI from 0.1 to 1.1, mean of HDI =
0.6; t(79) = 6.82, p = 1.63E-09] (see Figure 3 for the 95% HDI ofgroup differences between heroin and HC groups and Figures S4,S5 for the 95% HDI of group differences between amphetamineand other groups). In contrast, our hypothesis that reward sensi-tivity (α) would be higher in amphetamine users compared toHC was not supported. The learning rate (A) was marginallydifferent between the heroin and the HC groups [95% HDIfrom −0.0 to 0.2, mean of HDI = 0.1; t(89) = 4.91, p = 4.08E-06,Figure 3].
We further checked whether the group differences we foundusing the best-fitting (VPP) model are consistent when testedwith other models (PVL-DecayRI and PVL-Delta). Tables 5, 6summarize the mean group parameter estimates of the PVL-DecayRI (see Figures S6–S8 for the 95% HDI of group differ-ences) and PVL-Delta (see Figures S9–S11 for the 95% HDI ofgroup differences), respectively. As seen in Figures 3, S6, andS9, we consistently found reduced loss aversion in heroin userscompared to HC, whichever model we used. The PVL-DecayRImodel showed increased reward sensitivity (α parameter) inamphetamine users compared to HC [Figure S7, 95% HDI from0.0 to 0.5, mean of HDI = 0.3; t(84) = 6.26, p = 1.53E-08], whichwas not replicated with other models.
Given that the groups differed on age, IQ, and education,we conducted NHST Analysis of Covariance (ANCOVA) teststo examine whether group differences on model parametersremain significant after controlling for these factors. Dependentvariables were model parameter values (individual posteriormeans), group membership (e.g., HC vs. amphetamine groups)was the categorical independent variable, and covariates wereage, IQ, and education. With any model (VPP, PVL-DecayRI,or PVL-Delta), group difference on loss aversion between heroinand HC groups remained significant [e.g., with the VPP model,F(1, 86) = 26.06, p = 1.16E-13]. The group difference on rewardsensitivity between amphetamine and HC groups with thePVL-DecayRI model also remained significant [F(1, 81) = 46.28,p = 1.61E-09].
EXPLORATORY ANALYSES: ASSOCIATIONS OF MODEL PARAMETERSWITH SUBSTANCE USE AND PERSONALITY CHARACTERISTICSNext, we examined associations of model parameters of theimpaired neurocognitive processes (loss aversion for heroin usersusing the VPP model) with substance use characteristics (num-ber of years of drug use, length of abstinence from primary drug,number of DSM-IV criteria met for primary drug of dependence,nicotine dependence, and past cannabis dependence), impulsivepersonality traits (BIS-11) and impulse-related personality dis-orders (PCL:SV). As noted earlier, we used hierarchical robustBayesian multiple linear regression, which has a hyperdistributionon regression coefficients across predictors and large-tail distri-butions to accommodate outliers. The results showed that lossaversion in heroin users was not predicted by any variable (FigureS12 for the robust Bayesian multiple linear regression results).None of the regressors were significant (p < 0.05 with NHST).
In contrast to our null findings with the VPP model, wefound two associations when we used the affected parametersfrom the PVL-DecayRI model (loss aversion for heroin usersand reward sensitivity for amphetamine users). In heroin users,
Ahn et al. Decision-making in pure substance users
FIGURE 2 | Density plots of posterior group parameter distributions
with the Value-Plus-Perseverance (VPP) model. Bottom and top tickmarks indicate HDI 95% range, and middle tick marks indicate mean
values for each group. Density plots range from 0.01 to 99.99% ofposterior distributions. HC, Healthy Control group; AMPH, Amphetaminegroup; HERO, Heroin group.
Table 4 | Means and standard deviations (in parentheses) of group
HC, healthy controls; A, amphetamine; H, heroin.aHC, A > H.
loss aversion (λ) was predicted by impulsive personality traits(BIS-11 total score; mean coefficient = −0.027, 95% HDI from−0.05 to −0.00, mean of HDI = −0.03) (Figure S13). In con-trast, in amphetamine users, reward sensitivity was predicted by
number of years of drug use (mean coefficient = 0.042, 95% HDIof group differences from 0.01 to 0.07, mean of HDI = 0.04,see Figure S14). Other variables were not associated with modelparameters. Correlational analyses with internalizing characteris-tics (depression and anxiety) revealed no associations with modelparameters.
DISCUSSIONThis is the first human study that uses a computational model-ing approach to investigate neurocognitive functioning in rela-tively pure amphetamine and heroin users. Our behavioral resultsreveal that heroin users show more disadvantageous decision-making performance than HC; however, their performance wasnot different from that of amphetamine users. These results arein line with the persistent nature of decision-making deficitsobserved among opiate addicts in particular (Vassileva et al.,2007b; Fernández-Serrano et al., 2011; Li et al., 2013). Critically,our computational modeling findings suggest that amphetamineand heroin users may be characterized by dissociable decision-making biases even within the context of no overt behavioraldifferences in performance. When we compared groups usingthe best-fitting (VPP) model, heroin users showed reduced loss
Frontiers in Psychology | Decision Neuroscience August 2014 | Volume 5 | Article 849 | 10
Loss aversion (λ)b 1.262 (0.543) 0.910 (0.494) 0.110 (0.108)
HC, healthy controls; A, amphetamine; H, heroin.aHC < A.bHC > H.
aversion relative to amphetamine users and HC. Notably, thereduced loss aversion among heroin users compared to healthyindividuals was robust across all models we tested. With regards toamphetamine users, we did not find any distinct decision-makingprofile using the best-fitting VPP model. However, when usingthe PVL-DecayRI model, which had the second best model-fitsin our data, amphetamine users showed greater reward sensitivitythan HC. These group differences were at the outcome evaluationstage according to a recent framework of value-based decision-making (Rangel et al., 2008) and putatively reflect an emotionaland activation type of self-regulation (Bickel et al., 2012).
We tested three existing cognitive models to compare the twodrug user groups with HC. Consistent with previous reports(Worthy et al., 2013b), we found that the VPP model was the
Table 6 | Means and standard deviations (in parentheses) of group
Loss aversion (λ)a 0.650 (0.240) 0.376 (0.220) 0.060 (0.055)
HC, healthy controls; A, amphetamine; H, heroin.aHC > H.
best-fitting model when measured by WAIC, followed by thePVL-DecayRI and the PVL-Delta. However, it should be notedthat the VPP model has twice as many parameters as other mod-els (8 vs. 4) and showed the worst simulation and parameterrecovery performance compared to the two PVL models. In con-trast, Worthy et al. (2013b) show good simulation performancefor the VPP model in their dataset; however, there are two majordifferences between their study and ours. First, in Worthy et al.(2013b), control participants preferred the disadvantageous deck(Deck B) throughout the task, similar to the amphetamine andheroin groups in our study. Indeed, the simulation performanceof the VPP model is quite good for the heroin group if we col-lapse trial-by-trial simulation performance over trials on eachdeck. Second, Worthy et al. (2013b) used MLE estimates insteadof HBA estimates. Thus, it remains to be determined whether thepoor simulation performance of the VPP model in our datasets is
Ahn et al. Decision-making in pure substance users
due to its over-complexity, the limited generalizability of specificbehavioral patterns, or to differences in the parameter estimationmethods. It would also be helpful to perform external valida-tion tests (e.g., Wallsten et al., 2005) because the parameters of amodel with good model-fits do not necessarily reflect underlyingpsychological constructs (Riefer et al., 2002). In this study, eachparticipant performed only up to 100 trials: Even if hierarchi-cal modeling allowed us to pool information across individuals,100 trials might not contain enough information to reliably esti-mate 8 free parameters and capture true underlying psychologicalconstructs. It might be related to the fact that behaviorally theamphetamine group showed different choice patterns from theHC group but none of their model parameter values are credi-bly different from those of the HC group. As seen in Figure 2,several parameters of the amphetamine group are “sub-optimal”compared to the HC group (e.g., εn, k, and ω) but the groupdifferences did not reach the threshold of credible group differ-ence. It is possible that deficits in the amphetamine group weredecomposed into several parameters, instead of into one or twoparameters in the VPP model. It may be necessary and help-ful to develop new models with fewer model parameters basedon the psychological and neuroscience literature by using modelcomparison methods and performing external validation.
There are a few previous studies using the PVL-DecayRI(Vassileva et al., 2013) or the PVL-Delta (Fridberg et al.,2010) model to study decision-making processes in drug users.Consistent with our results, both chronic (current) marijuanausers (Fridberg et al., 2010) and polysubstance (former) users(Vassileva et al., 2013) showed reduced loss aversion comparedto HC. On the other hand, chronic marijuana users also exhib-ited higher reward sensitivity, impaired learning/memory, andreduced response consistency compared to HC when tested withthe PVL-Delta model (Fridberg et al., 2010). Polysubstance usewas also associated with impaired learning/memory when testedwith the PVL-DecayRI model (Vassileva et al., 2013). Stout et al.(2004) used the EVL model and MLE method for parameter esti-mation, and reported reduced attention weight to loss amongcurrent cocaine users compared to HC. In the EVL model, thew parameter (attention weight to loss vs. gain) incorporates bothreward sensitivity and loss aversion; therefore, it is difficult todirectly compare the findings from Stout et al. (2004) with ourresults. However, it is likely that one or both of the two processeswas impaired in current cocaine users in the Stout et al. (2004)study.
It should be also noted that the mean w parameter (RL weight)value was greater than 0.5 in all groups (Figure 2), suggestingthat overall RL was a primary strategy in all groups. Worthy et al.(2013b) reported that the mean w parameter of healthy individu-als was 0.49, which is the mean value of MLE individual estimates.In addition to the difference in parameter estimation methods,we also found some differences in the choice patterns of the threegroups. As seen in Figure S1, healthy control individuals in ourstudy eventually preferred the advantageous deck (Deck D) as thetask progressed. On the other hand, healthy individuals in Worthyet al. (2013b) continued to prefer the disadvantageous deck (DeckB) throughout the task, which was the deck preferred by bothheroin and amphetamine users in our study. It remains unclear
why the two drug user groups, which showed similar behavioralpatterns to participants in Worthy et al. (2013b), showed w valuegreater than 0.5 on average. A future study will be necessary toreplicate the findings.
This is one of the very few studies that investigateamphetamine and heroin users in protracted abstinence (Erscheet al., 2005a,b; Clark et al., 2006). Our results indicate thatdecision-making deficits previously reported with current drugusers (Bechara et al., 2001; Yechiam et al., 2005) may persistlong after discontinuation of drug use and appear particularlypronounced in heroin users. These deficits and decision-makingbiases may have existed prior to onset of drug use and therebycould have contributed to an increased susceptibility to developaddiction, in line with longitudinal studies with adolescents,which show that poor response inhibition and behavioral dys-function often precede onset of drug use and contribute tothe development of addiction (Nigg et al., 2006; Wong et al.,2006). Alternatively, these deficits and biases may reflect residual,enduring and possibly irreversible effects of chronic drug use; oran interaction between pre-existing predispositions and residualeffects of drugs of abuse. Although our study revealed some disso-ciable decision-making biases in amphetamine and heroin users,our design does not allow us to determine whether they precedeonset of drug use or whether they are consequences of chronicdrug use. This crucial question should be investigated by futurecarefully designed prospective studies.
Using the second best-fitting PVL-DecayRI model, we foundthat the distinct decision-making style of heroin users charac-terized by reduced sensitivity to loss is associated with elevatedtrait impulsivity, as hypothesized. These findings are in line withreports that personality variables are related to decision-makingperformance on the IGT among heroin users on OST (Lemenageret al., 2011). Our results indicate that similar associations areobservable among heroin users in protracted abstinence who arenot on OST. Speculatively, given the persistent nature of person-ality traits such as impulsivity, which develop early and typicallyprior to onset of substance dependence, the reduced loss aversionin heroin users may have predated the development of addictionand may be of etiological significance for addiction to opiatesin particular. In contrast, the decision-making bias displayed bystimulant users (reward sensitivity) was not associated with per-sonality traits but was instead related to duration of stimulantuse, which suggests that such biases may potentially reflect cumu-lative residual effects of chronic stimulant use. It is importantto emphasize that we should exercise caution when interpretingthese associations, as they were not replicated with the best-fitting(VPP) model.
A question arises as to what is the clinical significance of theobserved decision-making biases and deficits within the contextof our participants’ history of protracted abstinence, which isthe standard metric of success of most addiction treatment pro-grams. Specifically, despite the observed decision-making deficitsand biases among the two drug user groups, the majority ofour participants have been remarkably successful in maintainingabstinence for long periods of time and without the help of anysubstitution therapy. In essence, the ability of our participantsto abstain for such protracted periods of time suggests that this
Frontiers in Psychology | Decision Neuroscience August 2014 | Volume 5 | Article 849 | 12
Ahn et al. Decision-making in pure substance users
group could be comprised of some of the least impulsive SDI,expected to display more adaptive decision-making abilities thanSDI who are unable to remain abstinent for long. Future stud-ies should determine the real-life significance of such decision-making deficits and biases and the role they play in the protractedabstinence stage. For example, we recently reported that somedecision-making biases may have functional significance for HIVinfected women with a history of illicit drug use, among whomthey may be related to risky sexual behaviors and reduced adher-ence to HIV medication dosing schedules (Vassileva et al., 2013).Similarly, we recently found that a composite neurocognitiveindex of reward-based decision-making (which includes the IGT)predicts recent (past 30-days) sexual HIV risk behaviors in heroinand amphetamine users in protracted abstinence (Wilson et al.,under review). Overall, our results suggest that decision-makingprocesses other than the ones we examined may be more relevantfor the successful and prolonged maintenance of a state of absti-nence. Further, our findings may be specific to decision-makingunder uncertainty and ambiguity, as measured by the IGT. Itis possible that SDI in protracted abstinence may display intactfunctioning in other aspects of decision-making (e.g., decisionsunder risk) that may have more direct relevance to the success-ful maintenance of abstinence. On the other hand, the fact thatsuch decision-making deficits and biases were observed in par-ticipants who have successfully maintained prolonged abstinenceraises the question of whether users who are unable to maintainlong-term abstinence are characterized by even more aberrantdecision-making profiles. It would be crucial for future studiesto determine how “successful” long-term abstainers such as ourparticipants compare to currently active SDI or to SDI who areunable to abstain from drug use. Future studies should also deter-mine whether similar substance-specific biases are observable inopiate and stimulant users at other stages of the addiction cycleand ideally employ longitudinal designs to determine whetherthey are precursors or consequences of chronic substance use.
While clearly of theoretical significance, the extent to whichour findings have implications for prevention and interven-tion remains to be determined. If replicated by future studies,such decision-making deficits and biases may inform treatmentand recovery programs for opiate and stimulant dependentindividuals. Within this context, pre-treatment decision-makingassessments may represent a useful adjunct to help formulate per-sonalized treatment plans (Baldacchino et al., 2012), which couldpotentially include cognitive enhancement or training that haveshown some promising results (Nutt et al., 2007; Bickel et al.,2011). Our results from the PVL-DecayRI model suggest thatinterventions that target reduced loss aversion (punishment sen-sitivity) may be more suitable for heroin users, whereas othersaddressing increased reward sensitivity may hold promise withamphetamine users, though we should exercise caution with thelatter, which failed to replicate with the best-fitting model.
There are a number of limitations that need to be consideredwhen evaluating the current findings. First, the fact that our par-ticipants were predominantly male should be taken into accountwhen considering the generalizability of our findings to females.Second, our findings could have been influenced by group dif-ferences in age, IQ, and education, though the reduced loss
aversion in heroin users and the increased reward sensitivity inthe amphetamine group (with the PVL-DecayRI model) relativeto HC remained robust even after controlling for those factors.Third, computational modeling parameter estimates, like manyconceptual or quantitative interpretive tools, are useful heuristicsin the evaluation of observed behavior patterns, not explanatorymechanisms of the phenomena at hand. Interpretations should berendered accordingly, though the reduced loss aversion in heroinusers was robust across all models we tested.
In sum, by recruiting relatively pure amphetamine and heroinusers in protracted abstinence and by parcellating their decision-making performance into distinct neurocognitive processes byusing computational modeling and Bayesian tools, we revealedthat heroin users displayed reduced loss aversion relative toHC while being in protracted abstinence. Future studies uti-lizing other experimental paradigms probing different aspectsof decision-making and computational models will be neces-sary to examine which mechanisms may be at play in thedecision-making performance of heroin and amphetamine usersat different stages of the addiction cycle.
ACKNOWLEDGMENTSThe authors thank all volunteers for their participation in thisstudy; Kiril Bozgunov, Rada Naslednikova, and Ivaylo Raynov fortesting study participants; Warren K. Bickel and reviewers of ear-lier drafts for helpful comments on the manuscript; and HelenSteingroever for her feedback on our implementation of WAIC.This publication was made possible by R01DA021421 grant fromthe National Institute on Drug Abuse (NIDA) and the FogartyInternational Center (FIC) to Jasmin Vassileva. Its contents aresolely the responsibility of the authors and do not necessarilyrepresent the official views of the National Institutes of Health(NIH).
SUPPLEMENTARY MATERIALThe Supplementary Material for this article can be foundonline at: http://www.frontiersin.org/journal/10.3389/fpsyg.2014.00849/abstract
REFERENCESAhn, W.-Y., Busemeyer, J. R., Wagenmakers, E.-J., and Stout, J. C. (2008).
Comparison of decision learning models using the generalization cri-terion method. Cogn. Sci. 32, 1376–1402. doi: 10.1080/03640210802352992
Ahn, W.-Y., Krawitz, A., Kim, W., Busemeyer, J. R., and Brown, J. W. (2011). Amodel-based fMRI analysis with hierarchical bayesian parameter estimation.J. Neurosci. Psychol. Econ. 4, 95–110. doi: 10.1037/a0020684
Akaike, H., Petrov, B. N., and Csaki, F. (1973). “Information theory as an extensionof the maximum likelihood principle,” in Second International Symposium onInformation Theory, (Akademiai Kiado), 267–281.
Badiani, A., Belin, D., Epstein, D., Calu, D., and Shaham, Y. (2011). Opiate versuspsychostimulant addiction: the differences do matter. Nat. Rev. Neurosci. 12,685–700. doi: 10.1038/nrn3104
Baldacchino, A., Balfour, D., Passetti, F., Humphris, G., and Matthews, K.(2012). Neuropsychological consequences of chronic opioid use: a quantita-tive review and meta-analysis. Neurosci. Biobehav. Rev. 36, 2056–2068. doi:10.1016/j.neubiorev.2012.06.006
Bechara, A., Damasio, A. R., Damasio, H., and Anderson, S. (1994). Insensitivity tofuture consequences following damage to human prefrontal cortex. Cognition50, 7–15. doi: 10.1016/0010-0277(94)90018-3
Ahn et al. Decision-making in pure substance users
Bechara, A., Dolan, S., Denburg, N., Hindes, A., Anderson, S. W., and Nathan, P. E.(2001). Decision-making deficits, linked to a dysfunctional ventromedial pre-frontal cortex, revealed in alcohol and stimulant abusers. Neuropsychologia 39,376–389. doi: 10.1016/S0028-3932(00)00136-6
Bechara, A., and Martin, E. M. (2004). Impaired decision making related to work-ing memory deficits in individuals with substance addictions. Neuropsychology18, 152–162. doi: 10.1037/0894-4105.18.1.152
Beck, A. T., Steer, R. A., and Brown, G. K. (1996). Manual for the Beck DepressionInventory-II. San Antonio, TX: The Psychological Corporation.
Berry, D. A., and Fristedt, B. (1985). Bandit Problems: Sequential Allocationof Experiments (Monographs on Statistics and Applied Probability). London:Chapman & Hall.
Bickel, W. K., Jarmolowicz, D. P., Mueller, E. T., Gatchalian, K. M.,and Mcclure, S. M. (2012). Are executive function and impulsivityantipodes? A conceptual reconstruction with special reference to addic-tion. Psychopharmacology (Berl). 221, 361–387. doi: 10.1007/s00213-012-2689-x
Bickel, W. K., Yi, R., Landes, R. D., Hill, P. F., and Baxter, C. (2011). Rememberthe future: working memory training decreases delay discounting amongstimulant addicts. Biol. Psychiatry 69, 260–265. doi: 10.1016/j.biopsych.2010.08.017
Bolla, K. I., Eldreth, D. A., London, E. D., Kiehl, K. A., Mouratidis, M.,Contoreggi, C., et al. (2003). Orbitofrontal cortex dysfunction in abstinentcocaine abusers performing a decision-making task. Neuroimage 19, 1085–1094.doi: 10.1016/S1053-8119(03)00113-7
Busemeyer, J. R., and Stout, J. C. (2002). A contribution of cognitive deci-sion models to clinical assessment: decomposing performance on the Becharagambling task. Psychol. Assess. 14, 253–262. doi: 10.1037/1040-3590.14.3.253
Caprioli, D., Celentano, M., Paolone, G., Lucantonio, F., Bari, A., Nencini, P.,et al. (2008). Opposite environmental regulation of heroin and amphetamineself-administration in the rat. Psychopharmacology (Berl). 198, 395–404. doi:10.1007/s00213-008-1154-3
Chan, T. W., Ahn, W.-Y., Bates, J. E., Busemeyer, J. R., Guillaume, S., Redgrave,G. W., et al. (2014). Differential impairments underlying decision making inanorexia nervosa and bulimia nervosa: a cognitive modeling analysis. Int. J. Eat.Disord. 47, 157–167. doi: 10.1002/eat.22223
Clark, L., Robbins, T. W., Ersche, K. D., and Sahakian, B. J. (2006). Reflectionimpulsivity in current and former substance users. Biol. Psychiatry 60, 515–522.doi: 10.1016/j.biopsych.2005.11.007
Daw, N. D., Gershman, S. J., Seymour, B., Dayan, P., and Dolan, R. J. (2011). Model-based influences on humans’ choices and striatal prediction errors. Neuron 69,1204–1215. doi: 10.1016/j.neuron.2011.02.027
Degroot, M. (1970). Optimal Statistical Decisions. New York, NY: McGraw-Hill.Di Chiara, G., and Imperato, A. (1988). Drugs abused by humans preferen-
tially increase synaptic dopamine concentrations in the mesolimbic systemof freely moving rats. Proc. Natl. Acad. Sci. U.S.A. 85, 5274–5278. doi:10.1073/pnas.85.14.5274
Erev, I., and Roth, A. (1998). Predicting how people play games: reinforcementlearning in experimental games with unique, mixed strategy equilibria. Am.Econ. Rev. 88, 848–881.
Ersche, K. D., Fletcher, P. C., Lewis, S. J., Clark, L., Stocks-Gee, G., London, M., et al.(2005a). Abnormal frontal activations related to decision-making in current andformer amphetamine and opiate dependent individuals. Psychopharmacology(Berl). 180, 612–623. doi: 10.1007/s00213-005-2205-7
Ersche, K. D., Roiser, J. P., Clark, L., London, M., Robbins, T. W., and Sahakian,B. J. (2005b). Punishment induces risky decision-making in methadone-maintained opiate users but not in heroin users or healthy volunteers.Neuropsychopharmacology 30, 2115–2124. doi: 10.1038/sj.npp.1300812
European Monitoring Center for Drugs and Drug Addiction. (2011). AnnualReport. Available online at: http://www.emcdda.europa.eu/publications/annual-report/2011
Fernández-Serrano, M. J., Pérez-García, M., and Verdejo-García, A. (2011).What are the specific vs. generalized effects of drugs of abuse on neu-ropsychological performance? Neurosci. Biobehav. Rev. 35, 377–406. doi:10.1016/j.neubiorev.2010.04.008
First, M., Gibbon, M., Spitzer, R., and Williams, J. (1996). User’s Guide for theStructured Interview for DSM-IV Axis 1 Disorders-Research Version. New York,NY: Biometrics Research.
Fridberg, D. J., Queller, S., Ahn, W.-Y., Kim, W., Bishara, A. J., Busemeyer, J.R., et al. (2010). Cognitive mechanisms underlying disadvantageous decision-making in chronic cannabis abusers. J. Math. Psychol. 54, 28–38. doi:10.1016/j.jmp.2009.10.002
Gelman, A., Carlin, J. B., Stern, H. S., Dunson, D. B., Vehtari, A., and Rubin,D. B. (2013a). “Chapter 7. Evaluating, comparing, and expanding models,” inBayesian Data Analysis, 3rd Edn., eds A. Gelman, J. B. Carlin, H. S. Stern, D. B.Dunson, A. Vehtari, and D. B. Rubin (Boca Raton, FL: CRC press), 165–196.
Gelman, A., Hwang, J., and Vehtari, A. (2013b). Understanding predictive infor-mation criteria for Bayesian models. Stat. Comput. 1–20. doi: 10.1007/s11222-013-9416-2
Gelman, A., and Rubin, D. B. (1992). Inference from iterative simulation usingmultiple sequences. Stat. Sci. 457–472. doi: 10.1214/ss/1177011136
Goldstein, R. Z., and Volkow, N. D. (2011). Dysfunction of the prefrontal cortex inaddiction: neuroimaging findings and clinical implications. Nat. Rev. Neurosci.12, 652–669. doi: 10.1038/nrn3119
Gonzalez, R., Bechara, A., and Martin, E. M. (2007). Executive functionsamong individuals with methamphetamine or alcohol as drugs of choice:preliminary observations. J. Clin. Exp. Neuropsychol. 29, 155–159. doi:10.1080/13803390600582446
Gonzalez, R., Vassileva, J., Bechara, A., Grbesic, S., Sworowski, L., Novak, R. M.,et al. (2005). The influence of executive functions, sensation seeking, and HIVserostatus on the risky sexual practices of substance-dependent individuals.J. Int. Neuropsychol. Soc. 11, 121–131. doi: 10.1017/S1355617705050186
Gorodetzky, H., Sahakian, B. J., Robbins, T. W., and Ersche, K. D. (2011).Differences in self-reported decision-making styles in stimulant-dependentand opiate-dependent individuals. Psychiatry Res. 186, 437–440. doi:10.1016/j.psychres.2010.07.024
Grant, S., Contoreggi, C., and London, E. D. (2000). Drug abusers show impairedperformance in a laboratory test of decision making. Neuropsychologia 38,1180–1187. doi: 10.1016/S0028-3932(99)00158-X
Hart, S. D., Cox, D. N., and Hare, R. D. (1995). The Hare Psychopathy Checklist:Screening Version (PCL: SV). Toronto, ON: Multi-Health Systems, Incorporated.
Kirby, K. N., and Petry, N. M. (2004). Heroin and cocaine abusers have higherdiscount rates for delayed rewards than alcoholics or non-drug-using controls.Addiction 99, 461–471. doi: 10.1111/j.1360-0443.2003.00669.x
Kreek, M. J., Laforge, K. S., and Butelman, E. (2002). Pharmacotherapy of addic-tions. Nat. Rev. Drug Discov. 1, 710–726. doi: 10.1038/nrd897
Kreek, M. J., Levran, O., Reed, B., Schlussman, S. D., Zhou, Y., and Butelman, E. R.(2012). Opiate addiction and cocaine addiction: underlying molecular neurobi-ology and genetics. J. Clin. Invest. 122, 3387–3393. doi: 10.1172/JCI60390
Kruschke, J. K. (2010). What to believe: Bayesian methods for data analysis. TrendsCogn. Sci. 14, 293–300. doi: 10.1016/j.tics.2010.05.001
Kruschke, J. K. (2011a). Bayesian assessment of null values via parameter estima-tion and model comparison. Perspect. Psychol. Sci. 6, 299–312. doi: 10.1177/1745691611406925
Kruschke, J. K. (2011b). Doing Bayesian Data Analysis: A Tutorial with R and BUGS.Burlington, MA: Academic Press/Elsevier.
Kruschke, J. K. (2013). Bayesian estimation supersedes the t test. J. Exp. Psychol.Gen. 142, 573–603. doi: 10.1037/a0029146
Lecca, S., Melis, M., Luchicchi, A., Ennas, M. G., Castelli, M. P., Muntoni, A. L., et al.(2011). Effects of drugs of abuse on putative rostromedial tegmental neurons,inhibitory afferents to midbrain dopamine cells. Neuropsychopharmacology 36,589–602. doi: 10.1038/npp.2010.190
Lee, M. D. (2011). How cognitive modeling can benefit from hierarchical Bayesianmodels. J. Math. Psychol. 55, 1–7. doi: 10.1016/j.jmp.2010.08.013
Lemenager, T., Richter, A., Reinhard, I., Gelbke, J., Beckmann, B., Heinrich, M.,et al. (2011). Impaired decision making in opiate addiction correlates with anx-iety and self-directedness but not substance use parameters. J. Addict. Med. 5,203–213. doi: 10.1097/ADM.0b013e31820b3e3d
Li, X., Zhang, F., Zhou, Y., Zhang, M., Wang, X., and Shen, M. (2013). Decision-making deficits are still present in heroin abusers after short-to long-term absti-nence. Drug Alcohol Depend. 130, 61–67. doi: 10.1016/j.drugalcdep.2012.10.012
Luce, R. (1959). Individual Choice Behavior. New York, NY: Wiley.Nigg, J. T., Wong, M. M., Martel, M. M., Jester, J. M., Puttler, L. I., Glass, J.
M., et al. (2006). Poor response inhibition as a predictor of problem drinkingand illicit drug use in adolescents at risk for alcoholism and other sub-stance use disorders. J. Am. Acad. Child Adolesc. Psychiatry 45, 468–475. doi:10.1097/01.chi.0000199028.76452.a9
Frontiers in Psychology | Decision Neuroscience August 2014 | Volume 5 | Article 849 | 14
Ahn et al. Decision-making in pure substance users
Nutt, D., Robbins, T., and Stimson, G. (2007). Drugs futures 2025? Drugs and theFuture: Brain Science, Addiction and Society. London: Academic Press.
Ornstein, T. J., Iddon, J. L., Baldacchino, A. M., Sahakian, B. J., London, M., Everitt,B. J., et al. (2000). Profiles of cognitive dysfunction in chronic amphetamine andheroin abusers. Neuropsychopharmacology 23, 113–126. doi: 10.1016/S0893-133X(00)00097-X
Passetti, F., Clark, L., Mehta, M. A., Joyce, E., and King, M. (2008).Neuropsychological predictors of clinical outcome in opiate addiction. DrugAlcohol Depend. 94, 82–91. doi: 10.1016/j.drugalcdep.2007.10.008
Patton, J. H., and Stanford, M. S. (1995). Factor structure of the Barrattimpulsiveness scale. J. Clin. Psychol. 51, 768–774. doi: 10.1002/1097-4679(199511)51:6%3C768::AID-JCLP2270510607%3E3.0.CO;2-1
Pettit, H. O., Ettenberg, A., Bloom, F. E., and Koob, G. F. (1984). Destructionof dopamine in the nucleus accumbens selectively attenuates cocaine but notheroin self-administration in rats. Psychopharmacology (Berl.) 84, 167–73. doi:10.1007/BF00427441
Rangel, A., Camerer, C., and Montague, P. R. (2008). A framework for studying theneurobiology of value-based decision making. Nat. Rev. Neurosci. 9, 545–556.doi: 10.1038/nrn2357
R Development Core Team. (2009). R: A Language and Environment for StatisticalComputing. Vienna: R Foundation for Statistical Computing.
Rescorla, R. A., and Wagner, A. R. (1972). A Theory of Pavlovian Conditioning:Variations in the Effectiveness of Reinforcement and Nonreinforcement. New York,NY: Appleton-Century-Crofts.
Riefer, D. M., Knapp, B. R., Batchelder, W. H., Bamber, D., and Manifold, V.(2002). Cognitive psychometrics: assessing storage and retrieval deficits inspecial populations with multinomial processing tree models. Psychol. Assess.14:184. doi: 10.1037/1040-3590.14.2.184
Robinson, T. E., and Berridge, K. C. (1993). The neural basis of drug craving: anincentive-sensitization theory of addiction. Brain Res. Rev. 18, 247–291. doi:10.1016/0165-0173(93)90013-P
Rogers, R. D., Everitt, B. J., Baldacchino, A., Blackshaw, A. J., Swainson, R.,Wynne, K., et al. (1999). Dissociable deficits in the decision-making cognitionof chronic amphetamine abusers, opiate abusers, patients with focal dam-age to prefrontal cortex, and tryptophan-depleted normal volunteers: evidencefor monoaminergic mechanisms. Neuropsychopharmacology 20, 322–339. doi:10.1016/S0893-133X(98)00091-8
Schwartz, G. (1978). Estimating the dimension of a model. Ann. Stat. 5, 461–464.doi: 10.1214/aos/1176344136
Spiegelhalter, D. J., Best, N. G., Carlin, B. P., and Van Der Linde, A. (2002). Bayesianmeasures of model complexity and fit. J. R. Stat. Soc. B 64, 583–639. doi:10.1111/1467-9868.00353
Spielberger, C. D., and Gorsuch, R. L. (1983). Manual for the State-Trait AnxietyInventory STAI (Form Y) (“Self-Evaluation Questionnaire”). Redwood City, CA:Mind Garden.
Spotts, J. V., and Shontz, F. C. (1980). A life-theme theory of chronic drug abuse.NIDA Res. Monogr. 30, 59–70.
Stan Development Team. (2014). Stan: A C++ Library for Probability and Sampling,Version 2.1. Available online at: http://mc-stan.org/rstan.html
Steingroever, H., Wetzels, R., and Wagenmakers, E.-J. (2013). Validating thePVL-Delta model for the Iowa gambling task. Front. Psychol. 4:898. doi:10.3389/fpsyg.2013.00898
Steingroever, H., Wetzels, R., and Wagenmakers, E.-J. (2014). Absolute perfor-mance of reinforcement-learning models for the Iowa Gambling Task. Decision1, 161–183. doi: 10.1037/dec0000005
Stewart, J., De Wit, H., and Eikelboom, R. (1984). Role of unconditioned andconditioned drug effects in the self-administration of opiates and stimulants.Psychol. Rev. 91, 251–268. doi: 10.1037/0033-295X.91.2.251
Stout, J. C., Busemeyer, J. R., Lin, A., Grant, S. J., and Bonson, K. R. (2004).Cognitive modeling analysis of decision-making processes in cocaine abusers.Psychon. Bull. Rev. 11, 742–747. doi: 10.3758/BF03196629
Vassileva, J., Ahn, W. Y., Weber, K. M., Busemeyer, J. R., Stout, J. C., Gonzalez, R.,et al. (2013). Computational modeling reveals distinct effects of HIV and historyof drug use on decision-making processes in women. PLoS ONE 8:e68962. doi:10.1371/journal.pone.0068962
Vassileva, J., Gonzalez, R., Bechara, A., and Martin, E. M. (2007a). Are alldrug addicts impulsive? Effects of antisociality and extent of multidruguse on cognitive and motor impulsivity. Addict. Behav. 32, 3071–3076. doi:10.1016/j.addbeh.2007.04.017
Vassileva, J., Petkova, P., Georgiev, S., Martin, E. M., Tersiyski, R., Raycheva, M.,et al. (2007b). Impaired decision-making in psychopathic heroin addicts. DrugAlcohol Depend. 86, 287–289. doi: 10.1016/j.drugalcdep.2006.06.015
Verdejo-Garcia, A., Benbrook, A., Funderburk, F., David, P., Cadet, J. L.,and Bolla, K. I. (2007a). The differential relationship between cocaineuse and marijuana use on decision-making performance over repeat test-ing with the Iowa Gambling Task. Drug Alcohol Depend. 90, 2–11. doi:10.1016/j.drugalcdep.2007.02.004
Verdejo-Garcia, A. J., Perales, J. C., and Perez-Garcia, M. (2007b). Cognitive impul-sivity in cocaine and heroin polysubstance abusers. Addict. Behav. 32, 950–966.doi: 10.1016/j.addbeh.2006.06.032
Wagenmakers, E.-J. (2007). A practical solution to the pervasive problems ofpvalues. Psychon. Bull. Rev. 14, 779–804. doi: 10.3758/BF03194105
Wallsten, T. S., Pleskac, T. J., and Lejuez, C. W. (2005). Modeling behavior in aclinically diagnostic sequential risk-taking task. Psychol. Rev. 112, 862–880. doi:10.1037/0033-295X.112.4.862
Watanabe, S. (2010). Asymptotic equivalence of Bayes cross validation and widelyapplicable information criterion in singular learning theory. J. Mach. Learn. Res.9999, 3571–3594.
Wetzels, R., Vandekerckhove, J., Tuerlinckx, F., and Wagenmakers, E. (2010).Bayesian parameter estimation in the Expectancy Valence model of the Iowagambling task. J. Math. Psychol. 54, 14–27. doi: 10.1016/j.jmp.2008.12.001
Wise, R. A. (1978). Catecholamine theories of reward: a critical review. Brain Res.152, 215–247. doi: 10.1016/0006-8993(78)90253-6
Wong, M. M., Nigg, J. T., Zucker, R. A., Puttler, L. I., Fitzgerald, H. E., Jester, J.M., et al. (2006). Behavioral control and resiliency in the onset of alcohol andillicit drug use: a prospective study from preschool to adolescence. Child Dev.77, 1016–1033. doi: 10.1111/j.1467-8624.2006.00916.x
Worthy, D. A., Hawthorne, M. J., and Otto, A. R. (2013a). Heterogeneity ofstrategy use in the Iowa gambling task: a comparison of win-stay/lose-shiftand reinforcement learning models. Psychon. Bull. Rev. 20, 364–371. doi:10.3758/s13423-012-0324-9
Worthy, D. A., Pang, B., and Byrne, K. A. (2013b). Decomposing the roles of per-severation and expected value representation in models of the Iowa gamblingtask. Front. Psychol. 4:640. doi: 10.3389/fpsyg.2013.00640
Yechiam, E., and Busemeyer, J. R. (2005). Comparison of basic assumptions embed-ded in learning models for experience-based decision making. Psychon. Bull.Rev. 12, 387–402. doi: 10.3758/BF03193783
Yechiam, E., and Busemeyer, J. R. (2008). Evaluating generalizability and param-eter consistency in learning models. Games Econ. Behav. 63, 370–394. doi:10.1016/j.geb.2007.08.011
Yechiam, E., Busemeyer, J. R., Stout, J. C., and Bechara, A. (2005). Using cog-nitive models to map relations between neuropsychological disorders andhuman decision–making deficits. Psychol. Sci. 16, 973–978. doi: 10.1111/j.1467-9280.2005.01646.x
Yechiam, E., and Ert, E. (2007). Evaluating the reliance on past choices in adaptivelearning models. J. Math. Psychol. 51, 75–84. doi: 10.1016/j.jmp.2006.11.002
Yuferov, V., Levran, O., Proudnikov, D., Nielsen, D. A., and Kreek, M. J. (2010).Search for genetic markers and functional variants involved in the developmentof opiate and cocaine addiction and treatment. Ann. N.Y. Acad. Sci. 1187,184–207. doi: 10.1111/j.1749-6632.2009.05275.x
Conflict of Interest Statement: The authors declare that the research was con-ducted in the absence of any commercial or financial relationships that could beconstrued as a potential conflict of interest.