Pan W and Thomas R (2013) Defects of new-build dwellings constructed to building regulations and to the 'code for sustainable homes’ In: Smith, S.D and Ahiaga-Dagbui, D.D (Eds) Procs 29 th Annual ARCOM Conference, 2-4 September 2013, Reading, UK, Association of Researchers in Construction Management, 1015-1025. DEFECTS OF NEW-BUILD DWELLINGS CONSTRUCTED TO BUILDING REGULATIONS AND TO THE 'CODE FOR SUSTAINABLE HOMES’ Wei Pan 1 and Rhys Thomas 2 1 The University of Hong Kong, Department of Civil Engineering, Hong Kong 2 Plymouth University, School of Architecture, Design and Environment, UK Defect is an important aspect to address for enhancing quality of homes. However, there is little research into defects of new-build homes in the UK constructed to the 'Code for Sustainable Homes' which has been introduced to the UK building industry since 2007 as an environmental assessment tool. The aim of this paper is to contribute to knowledge of the defect profile of new homes regarding the defect number, type, location, severity and responsible trades. The research was carried out through analysing defect records for 327 homes in the UK constructed to the Code in comparison with to Building Regulations. In total 3209 defects were identified, with the mean average of 9.8 defects per home. Despite some extreme cases 91.4% of the dwellings studied were reported of 20 or less defects each. It is concluded that the defect profile of UK new-build homes since 2007 has improved in number, diversity and severity of defects. Nevertheless, kitchens and bathrooms remained as two most defective areas, with plumbers and painters/decorators being most often tasked for rectifications. With the evidence presented no clear relationship was observed between the defect profile of the homes and their performance standards or build methods adopted. Keywords: building standard, defect, quality, sustainable home. INTRODUCTION Housing represents a significant part of our society. In the UK, public and private housing together contributes a total value of £3,923 billion or 56% of the nation’s wealth (Office for National Statistics 2009). Previous research has estimated that defects cost between 2-6% of the overall build cost during construction (Ball 1987; Hammarlund 1990; van den Beukel 1989), and between 3-5% in post-completion maintenance (Josephson and Hammarlund 1999). Therefore, eliminating defects and maintaining good quality have an important cost benefit for the society. The Callcutt Review (2007:63) advocates that the high demand for housing must not be met with housing t o a low standard, ‘building to a low standard, where new housing incurs additional cost because defects in design or construction have to be expensively remedied after occupation, is a false economy’. Although it may be inevitable that defects in a building occur through general wear and tear, defects due to human errors in the construction of a home should be 1 [email protected]
Transcript
Pan W and Thomas R (2013) Defects of new-build dwellings constructed to building
regulations and to the 'code for sustainable homes’ In: Smith, S.D and Ahiaga-Dagbui,
D.D (Eds) Procs 29th
Annual ARCOM Conference, 2-4 September 2013, Reading, UK,
Association of Researchers in Construction Management, 1015-1025.
DEFECTS OF NEW-BUILD DWELLINGS
CONSTRUCTED TO BUILDING REGULATIONS AND
TO THE 'CODE FOR SUSTAINABLE HOMES’
Wei Pan1 and Rhys Thomas
2
1 The University of Hong Kong, Department of Civil Engineering, Hong Kong
2 Plymouth University, School of Architecture, Design and Environment, UK
Defect is an important aspect to address for enhancing quality of homes. However,
there is little research into defects of new-build homes in the UK constructed to the
'Code for Sustainable Homes' which has been introduced to the UK building industry
since 2007 as an environmental assessment tool. The aim of this paper is to contribute
to knowledge of the defect profile of new homes regarding the defect number, type,
location, severity and responsible trades. The research was carried out through
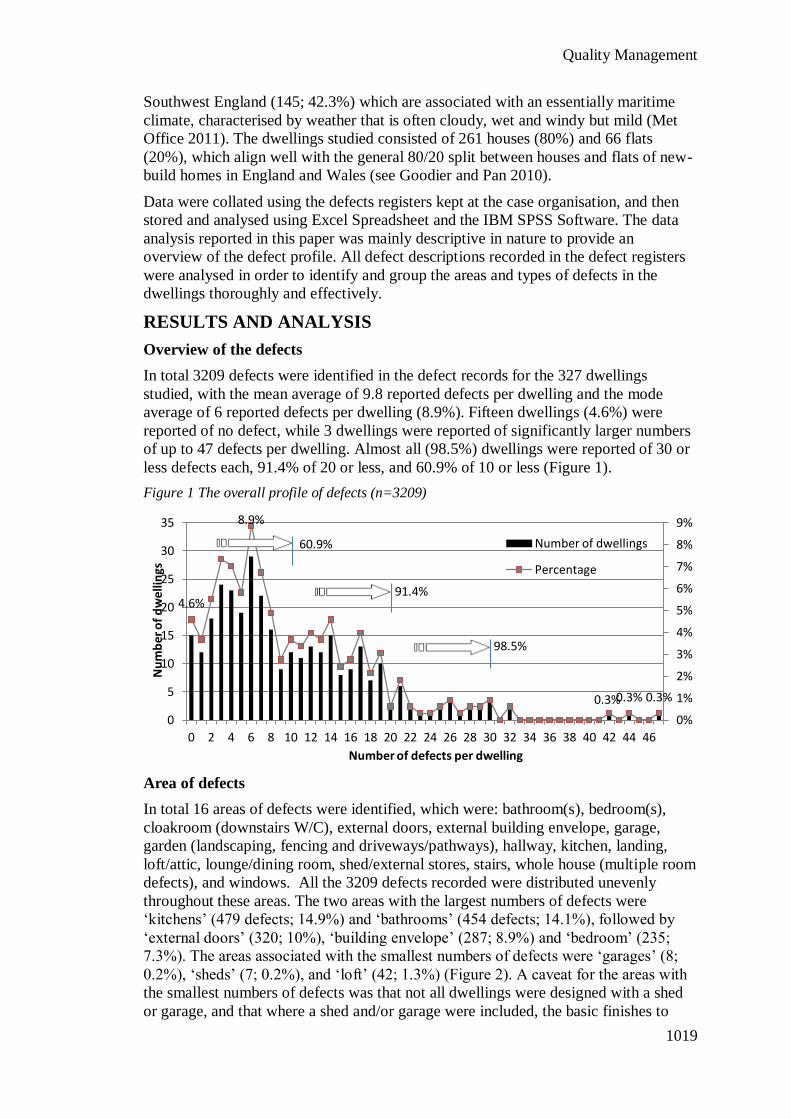
analysing defect records for 327 homes in the UK constructed to the Code in comparison with to Building Regulations. In total 3209 defects were identified, with
the mean average of 9.8 defects per home. Despite some extreme cases 91.4% of the
dwellings studied were reported of 20 or less defects each. It is concluded that the
defect profile of UK new-build homes since 2007 has improved in number, diversity
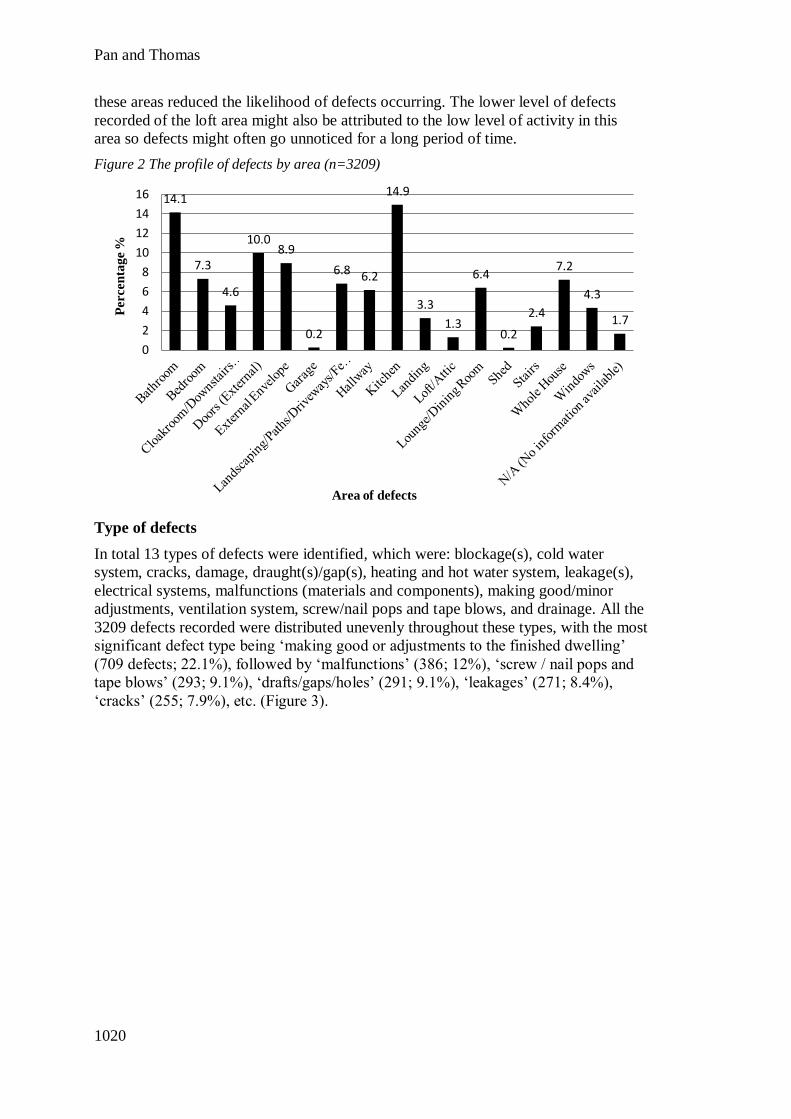
and severity of defects. Nevertheless, kitchens and bathrooms remained as two most
defective areas, with plumbers and painters/decorators being most often tasked for
rectifications. With the evidence presented no clear relationship was observed
between the defect profile of the homes and their performance standards or build
methods adopted.
Keywords: building standard, defect, quality, sustainable home.
INTRODUCTION
Housing represents a significant part of our society. In the UK, public and private
housing together contributes a total value of £3,923 billion or 56% of the nation’s
wealth (Office for National Statistics 2009). Previous research has estimated that
defects cost between 2-6% of the overall build cost during construction (Ball 1987;
Hammarlund 1990; van den Beukel 1989), and between 3-5% in post-completion
maintenance (Josephson and Hammarlund 1999). Therefore, eliminating defects and
maintaining good quality have an important cost benefit for the society. The Callcutt
Review (2007:63) advocates that the high demand for housing must not be met with
housing to a low standard, ‘building to a low standard, where new housing incurs
additional cost because defects in design or construction have to be expensively
remedied after occupation, is a false economy’.
Although it may be inevitable that defects in a building occur through general wear
and tear, defects due to human errors in the construction of a home should be
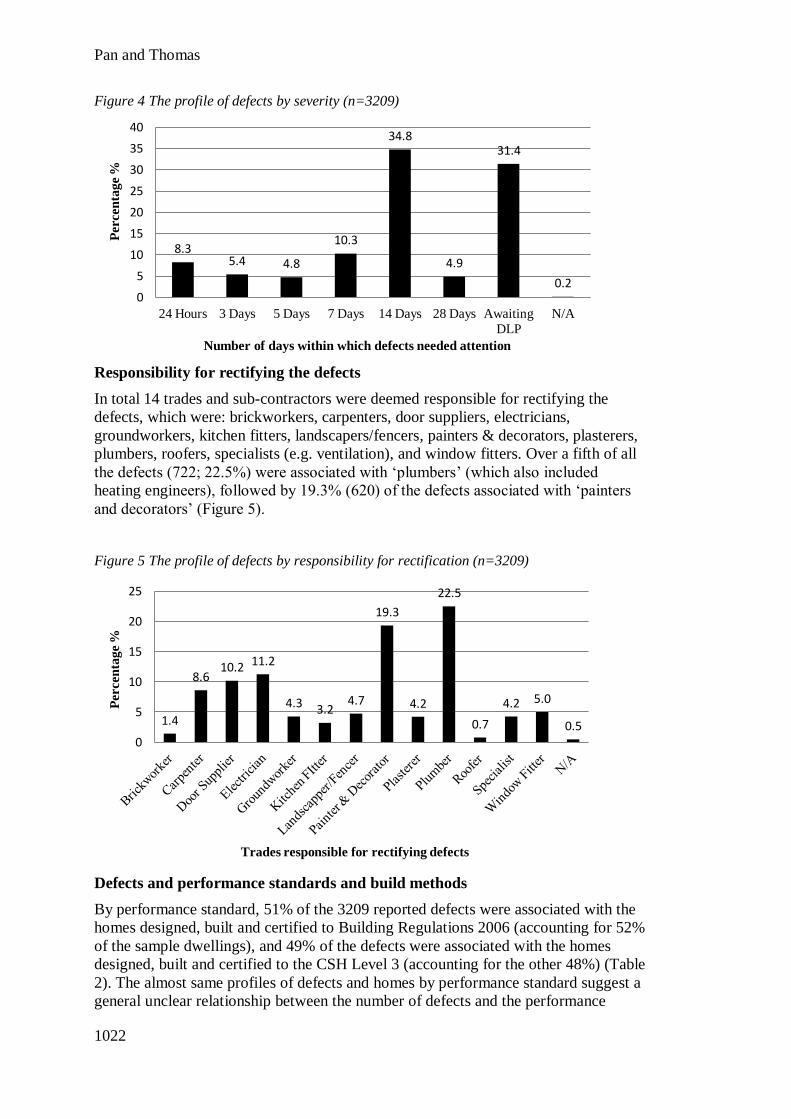
plumbers, roofers, specialists (e.g. ventilation), and window fitters. Over a fifth of all
the defects (722; 22.5%) were associated with ‘plumbers’ (which also included
heating engineers), followed by 19.3% (620) of the defects associated with ‘painters
and decorators’ (Figure 5).
Figure 5 The profile of defects by responsibility for rectification (n=3209)
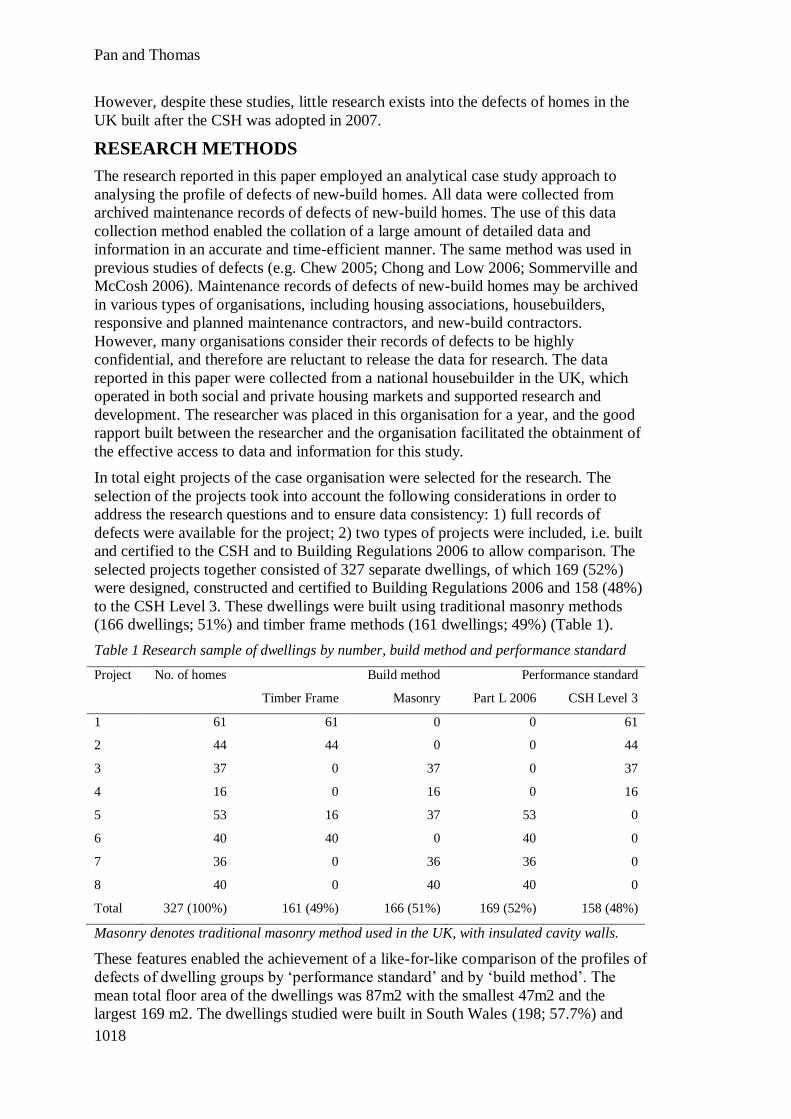
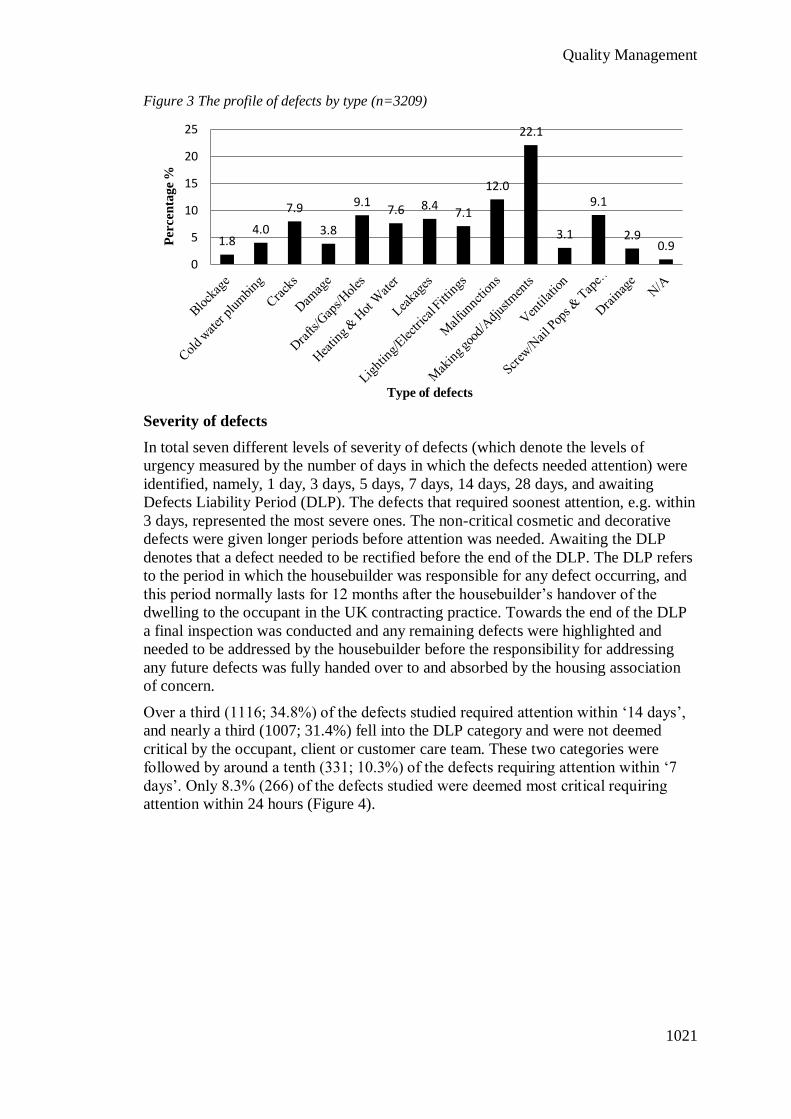
Defects and performance standards and build methods
By performance standard, 51% of the 3209 reported defects were associated with the
homes designed, built and certified to Building Regulations 2006 (accounting for 52%
of the sample dwellings), and 49% of the defects were associated with the homes
designed, built and certified to the CSH Level 3 (accounting for the other 48%) (Table
2). The almost same profiles of defects and homes by performance standard suggest a
general unclear relationship between the number of defects and the performance
8.3 5.4 4.8
10.3
34.8
4.9
31.4
0.2 0
5
10
15
20
25
30
35
40
24 Hours 3 Days 5 Days 7 Days 14 Days 28 Days Awaiting
DLP
N/A
Percen
tage %
Number of days within which defects needed attention
1.4
8.6 10.2 11.2
4.3 3.2 4.7
19.3
4.2
22.5
0.7
4.2 5.0
0.5 0
5
10
15
20
25
Percen
tag
e %
Trades responsible for rectifying defects
Quality Management
1023
standard adopted for the dwellings studied as a whole. By build method, 51% of the
3209 reported defects studied were associated with the masonry homes (accounting
for 51% of the sample dwellings), and 49% of the defects were associated with the
timber framed homes (accounting for the other 49%) (Table 2). The same profiles of
defects and homes by build method suggest a general unclear relationship between the
number of defects and the build method adopted for the dwellings studied as a whole.
Table 2 The profile of defects by performance standard and build method
Timber frame Masonry Total
Built to Building
Regulations
695 (42%)
(44%)
947 (58%)
(58%)
1642 (100%)
(51%)
Built to CSH Level 3 876 (56%)
(56%)
691 (44%)
(42%)
1567 (100%)
(49%)
Total 1571 (49%)
(100%)
1638 (51%)
(100%)
3209 (100%)
(100%)
DISCUSSION AND CONCLUSIONS
Previous research has examined the types and locations of defects in domestic
buildings. However, much such research in the UK was with the buildings constructed
to Building Regulations, while there is little research into defects of homes built to the
CSH which has been introduced to the UK building industry since 2007. Also, it
remains unclear if the adoption of the CSH has had any impact on the defect profile of
new-build homes. In addressing the gaps in knowledge, this paper has examined the
profile of defects in new-build dwellings in relation to the defect number, type,
location, severity and responsible trades.
The mean average of reported defects per dwelling examined in this paper was 9.8,
which was significantly lower than those previously reported, e.g. 59 defects per
dwelling reported by Sommerville and Craig (2006). Despite a small number of
extreme cases with up to 47 defects per home, 91.4% of the dwellings studied were
reported of 20 or less defects each, indicating a much less variety than those reported
in the UK building industry in previous years, e.g. 406 recorded defects in one
property as reported by Sommerville et al. (2004). Nevertheless, kitchens and
bathrooms were found to remain as two most defective areas, in terms of number of
defects, of the new-build homes studied. This finding is in line with the result reported
by Chew (2005). These areas are subject to the most extreme conditions in a home
because they are normally humid, wet and hot and go through prolonged wetting and
drying cycles. Also, this finding applied to homes built to Building Regulations as
well as to the CSH, which suggests that the raised performance standard had no clear
impact on the defect profile of the wet areas.
Plumbers and painters/decorators were identified as the two trades most often tasked
for rectifying the reported defects. The finding on plumbers supports the results that
most significant areas of defects were identified as the wet areas like kitchens and
bathrooms. Many rectification activities for the defects associated with 'painters and
decorators' actually resulted from 'making good' following other remedial works,
which suggests a significant quality control problem towards the end of the
construction period where finishes were applied to the dwelling. Nevertheless, it is
worth noting that although these trades and subcontractors were responsible for
rectifying the defects, they were not necessarily the parties who caused the defects.
Pan and Thomas
1024
This point of argument is also debated in the literature. For example, Pheng and Wee
(2001) pointed to human error as the main cause of defects, while Low and Chong
(2004) suggested that defects were more of a design based problem. Atkinson (2003)
revealed that 82% of the defects studied were attributed to management, and therefore
argued that defects were a management based problem. However, the results suggest
no clear relationship between the number of defects and the performance standards
adopted, i.e. the CSH Level 3 and Building Regulations 2006, or between the number
of defects and the build methods utilised, i.e. timber frame and masonry. Nevertheless,
only less than one tenth of the defects studied required attention within 24 hours, the
vast majority being much less critical.
Drawing on the discussion together the paper concludes that the defect profile of new-
build homes in the UK in recent years has improved from reported in the history, in
number, diversity and severity of defects. However, critical defective areas remain as
bathrooms and kitchens. From the evidence presented it is unclear if the adoption of
the CSH has had any significant impact on the defect profile of new-build homes.
Future research could cross analyse the multiple factors that influence building
defects, results of which should help achieve an alternative insight into the defect
profile of new-build dwellings.
REFERENCES
Assaf, S., Al-Hammand, A., and Al-Shihah, M. (1996). “Effects of faulty design and
construction on building maintenance.” J. Perform. Constr. Facil., 10(4), 171-174.
Atkinson, A. R. (2003). “The pathology of building defects; A human error approach.” Eng.
Constr., Archit. Manage., 9(1), 53-61.
Auchterlounie, T (2009) "Recurring quality issues in the UK private house building industry",
Structural Survey, 27(3), 241-51.
Ball, P.L (1987). The Economics and Assurance of Quality in Construction, Conference Paper, Quality: A Shared Commitment, EOQC, London,
Barrett, K. (2008) Defective construction work: and the project team. Oxford: Wiley-
Blackwell.
Bonshor, R. B. & Harrison, H. W., 1982. Traditional housing: a BRE study of quality.
Watford: Building Research Establishment.
BSI (2004) Building and civil engineering – Vocabulary – Part 1: General terms, BS 6100-
1:2004 BS ISO 6707-1:2004, British Standards Institution, London.
Callcutt Review (2007) The Callcutt Review of Housebuilding Delivery, Department of
Communities and Local Government (CLG), London
Chew, M. Y. L. (2005) 'Defect analysis in wet areas of buildings'. Construction and Building Materials, 19(3), 165-173.
DCLG (2006) Code for Sustainable Homes: A step-change in sustainable home building
practice. London: DCLG.
Goodier, C. and Pan, W. (2010) The Future of UK Housebuilding, RICS, London.
Hammarlund, Y. Jacobsson, S. Josephson, P.E. (1990). Quality Failure Costs in Building
Construction, CIB International Symposium at the University of Technology, Sydney,
14–21.
Harrison, H. W., (1993). “Quality in new-build housing”. Watford: Building Research
Establishment.
Quality Management
1025
Johnsson. H. and Meiling, J.H. (2009): Defects in offsite construction: timber module
prefabrication, Construction Management and Economics, 27:7, 667-681
Josephson, P.E. Hammarlund, Y. (1999). The causes and costs of defects in construction A
study of seven building projects. Automation in Construction. 8 (.), 681–687.
Low, S. P., and Chong, W. K. (2006). “Latent Building Defects: Causses and Design
Strategies to Prevent Them” Journal of Performance of constructed facilities, Vol. 20,
No. 3, 213-221.
Marshall, D., Worthing, D. & Heath, R., (2009). Understanding Housing Defects. 3rd Edition.
London: EG Books.
ONS (2009) UK worth £7.0trillion Decrease of £177bn on previous year, http://webarchive.nationalarchives.gov.uk/20090805161024/http://statistics.gov.uk/cc
i/nugget.asp?id=479. Office for National Statistics, London.
Pan, W. and Garmston, H. (2012) Building Regulations in Energy Efficiency: Compliance in
England and Wales. Energy Policy, 45(6), 594-605.
Pheng, L. S and Wee, D. (2001),"Improving maintenance and reducing building defects
through ISO 9000", Journal of Quality in Maintenance Engineering, 7(1), 6-24.
Sommerville, J., Craig, N. & Bowden, S., (2004). “The standardisation of construction snagging”. Structural Survey, 22(5), pp. 251-258.
Sommerville, J and McCosh, J (2006) "Defects in new homes: an analysis of data on 1,696
new UK houses", Structural Survey, 24(1), 6-21.
van den Beukel, A. (1989). Quality Cost, Committee on Housing, Building and Planning,
Economic Commission for Europe, Economic and Social Council, United Nations.