Page 1
P a g e | 1
Defining exposure time using burn severity of skin tissue
under the scanning electron microscope
Stephanie Ringrose*1, Dr. Shashi Jasra1, Dr. Pardeep Jasra1, Thomas Drake1
Abstract:
This research examines whether a scientist can determine the time interval associated with skin
when exposed to a burning substance using observation through an Environmental Scanning Electron
Microscope (ESEM). The microscope barrages the surface of the skin with electrons, giving the viewer an
image of the topography of the sample. Pig epithelial tissue was the medium experimented upon due to its
similarity to human skin and was stored in formaldehyde to keep the tissue fresh until examination could
occur. The tissues were burned chemically (with concentrated and half-diluted hydrochloric acid) as well
as thermally (using a household non-industrial refrigerator/freezer unit and a toaster oven) with controlled
variables allowing only exposure time and percentage of fat to be variable within the experiment.
Determining the exposure time interval betters the scientific understanding of pin-pointing evidence
leading to a near-definitive estimation of timed exposure. When burning the substance thermally, large
bubbles and tearing were seen in the frozen tissue whereas many small bubbles were seen dotting the
heated tissue. In terms of the acid, heavy pocketing occurred in the skin, eating the epithelial layer away
from the sample. Thus, the results show that as the time interval of exposure increases, the observed
artifacts of burning (bubbling and pocketing) also increase in number. In summary, due to the results
collected in this experiment, the time interval in which the skin was exposed to a burning substance can
be approximated based on the number of artifacts seen on the skin under the ESEM.
Keywords: scanning electron microscope, burn, burning, skin, epithelial tissue, freezing
1 Forensic Sciences, Faculty of Science, University of Windsor, 401Sunset Avenue, Windsor Ontario
Communicating Author Contact: Stephanie Ringrose, email: [email protected]
Page 2
P a g e | 2
Introduction
Forensic science, to be defined simply, is the utilization of science to analyze evidence
within a legal framework. It is often used in criminal as well as civil investigations. In these
investigations, time is usually of the essence. Due to this, scientists may want to estimate the
length of time a person or body has been exposed to a certain environmental condition. Knowing
that the current techniques can have estimations that are off by hours to days is always a
challenge for investigators. That is why, in this study, scientists will be observing thermal and
chemical burns on epithelial tissues to determine how long it was exposed to a certain burning
stimulus.
To begin, there are three classifications of burns: first, second, and third degree. First
degree burns only affect the epidermis, the outermost layer of the skin. Second degree burns
affect the epidermis and part of the underlying dermis. Being slightly more severe than first
degree, second degree burns cause pain, redness, swelling, and even blistering. On the other
hand, third degree burns destroy both the dermis and epidermis. In extreme cases, third degree
burns may also cause damage to the tendons and bones10. Knowing this, the research outlined in
this paper will focus on determining the time interval associated with exposure to a burning
substance using observation through an Environmental Scanning Electron Microscope (ESEM).
Thermal burns occur when an excess of heat or cold is applied to an area of the body. For
example, this research focuses on first to second degree burns (i.e. frostbite, sunburn) on pig
epithelial and muscle tissue. Cold burns are forensically relevant due to the complications of
freezing a victim post-homicide. A perpetrator may need to take time after the death of the
victim to devise a disposal method, thereby placing the body in the freezer in the meantime. By
conducting experiments on the epithelial tissue, this research could quantify the length of time
the mammalian tissue spent in the freezer.
Chemical burns occur when tissue is exposed to a corrosive substance, such as a strong
acid or base. This second portion of the study also focuses on first and second degree burns by
examining the reaction of the mammalian tissue depending upon the time interval wherein the
acid was left on the skin before being washed off. This is especially forensically relevant in
factories, public pools, or among chemists, where acid may be spilled due to a workplace
accident (requiring legal action). Perhaps this acid could not be washed off right away, leaving a
potential burn in its place. Being able to determine the exposure time could be presentable
evidence within a courtroom.
The controlled variables in this study will be the set temperatures and lengths of time
allotted per sample. The burn damage done to the epithelial tissue is dependent on these factors
and will be observed using an Environmental Scanning Electron Microscope (ESEM). It is
suspected that as the time interval increases the more severe the burns will become. Observing
tissue under the ESEM will result in evidence of “pocketing” and “bubbling”. Pocketing emerges
as a dark area on the scanned portion of the tissue, appearing farther away than the rest of the
tissue. Bubbling, another indication of a burn, will appear opposite pocketing, with hills that are
lighter than the surrounding area, and seem closer to the camera lens.
Upon reviewing articles, it was seen that this category of research does not have many
previous peer-reviewed statistics or testing available for reference. However, an article by
Schäfer exhibits extracellular extension when organ tissue is frozen over a long period. The facts
presented by Schäfer mentions the tissues rising and falling during the freeze-thaw cycle6, which
is what is to be expected in this experiment as well. On the other hand, no research was found
Page 3
P a g e | 3
that related directly to human or pig skin being burned thermally or chemically and examined
under the Scanning Electron Microscope.
Materials and Methods
To conduct the experiments detailed above, one must acquire:
- Epithelial tissue (pig specimen)
- Thermal burning mediums (non-industrial refrigerator/freezer, toaster oven)
- Chemical burning mediums (hydrochloric acid)
- Formaldehyde (37%)
- Glassware (jars for storage, beakers for acid transfer, graduated cylinders)
The tissue chosen comes from the lower leg (hock) of a pig specimen. This is because of
its lower fat content, which is more like the average human body type. Typically, pig tissue is
seen to be the most human-like physiologically and anatomically7.
Throughout the experiment, fresh pork hock was acquired and tested upon within eight
hours of obtaining the fresh tissue. Squares of tissue approximately 5cm by 5cm were used for
each trial, with microscope samples (0.5cm by 0.5cm) cut from the middle of the tissue to avoid
any excess burning that would appear on the outer edge of the tissue. After each section of tissue
was experimented upon, it was immediately stored in a solution of 37% formaldehyde to
preserve the tissue until examination under the microscope.
To test the cold thermal burns, a household refrigerator/freezer unit was acquired and set
to -18℃ (255K) which is standard for a non-industrial freezer11 (Whirlpool Refrigerator/Freezer
model ED2FHGXKQ04). The 5cm by 5cm samples were left in for 1 hour, 2 hours, and 3-hour
time intervals. For the heat burns, a standard toaster oven (Black & Decker Toaster Oven model
TO1420BC) was used to mimic a sauna in terms of burning through dry heat (93℃). The heat
samples were left in for 5, 10, 15, and 20-minute intervals, which were determined based on a
general idea of how long the average person might spend in a sauna.
To test chemical burns, hydrochloric acid was used at both a 12.3M concentration and a
6.2M concentration. The 12.3M solution was the stock solution provided and thus the highest
concentration available for this experiment. The 6.2M solution was created by diluting 50mL of
the 12.3M stock solution with 100mL of distilled water. To do this dilution, the formula C1V1 =
C2V2 was used to determine how much water would be needed for a half-dilution. The
measurements were carried out using graduated cylinders, and thus the two solutions were
created and applied to the tissue. During the application process, scientists left the tissue
submerged in the acid solution for 1, 3, 5, 8, and 10-minute intervals because of its fast-acting
severity. Submersion was followed by a wash in distilled water for approximately 60 seconds
before storage in formaldehyde.
All the above samples were stored in 37% formaldehyde for at least 24 hours before
examination to ensure fixation of the tissue had occurred.
The Scanning Electron Microscope (SEM) is then used to analyze the tissues. In this
experiment, the FEI Quanta 200 FEG (2005) model was used. The SEM produces images of a
sample by barraging a focused beam of electrons onto the sample, allowing interaction between
the electrons and the atoms within the tissue to produce a topographical image of the sample
(Danilatos, 1994). Similarly, the Environmental SEM allows this same process to happen but
includes a cooling and drying stage (using a gaseous environment) to collect electron
micrographs of a “wet” specimen (i.e. epithelial tissue that has been stored in a preservative
Page 4
P a g e | 4
chemical) in a low vacuum setting. This method was chosen for this experiment due to its high
magnification capabilities, allowing the experimenter to view the epidermis at a high resolution
thereby revealing surface-level details less than 5nm in size.
The relevant settings for the ESEM are as follows: minimum pressure of 800Pa,
maximum of 1300Pa whilst pumping (6 cycles), the target temperature of the stage is 2℃, high
voltage is set at 10kV, spot size is 3.9, and final pressure is 500Pa.
Results
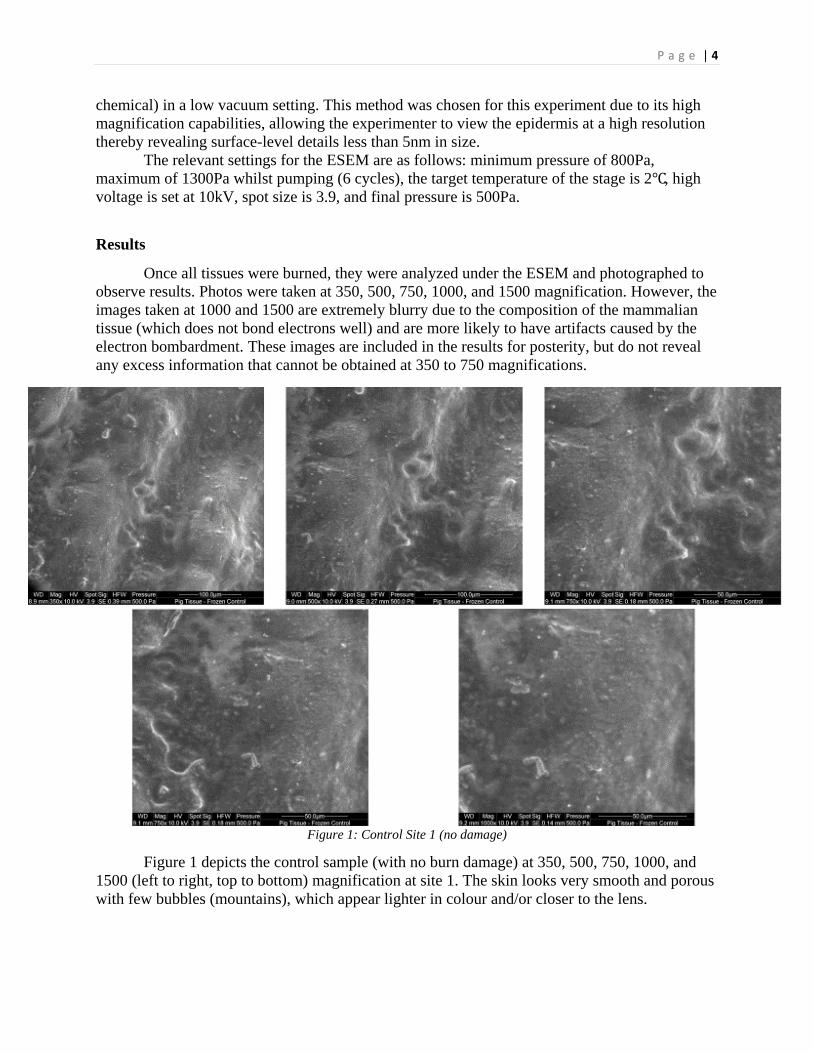
Once all tissues were burned, they were analyzed under the ESEM and photographed to
observe results. Photos were taken at 350, 500, 750, 1000, and 1500 magnification. However, the
images taken at 1000 and 1500 are extremely blurry due to the composition of the mammalian
tissue (which does not bond electrons well) and are more likely to have artifacts caused by the
electron bombardment. These images are included in the results for posterity, but do not reveal
any excess information that cannot be obtained at 350 to 750 magnifications.
Figure 1: Control Site 1 (no damage)
Figure 1 depicts the control sample (with no burn damage) at 350, 500, 750, 1000, and
1500 (left to right, top to bottom) magnification at site 1. The skin looks very smooth and porous
with few bubbles (mountains), which appear lighter in colour and/or closer to the lens.
Page 5
P a g e | 5
Figure 2: Control Site 2 (no damage)
Figure 2 depicts the control sample (with no burn damage) at 350, 500, 750, 1000, and
1500 (left to right, top to bottom) magnification at site 2. The skin still appears smooth, but has
more mountainous bubbling.
Page 6
P a g e | 6
Figure 3: Thermal (frozen, 1 hour) Site 1
Figure 3 depicts the thermal (frozen, 1 hour) sample at 350, 500, 750, 1000, and 1500
(left to right, top to bottom) magnification at site 1. Many large bubbles with shrunken tissue
between the mountains.
Page 7
P a g e | 7
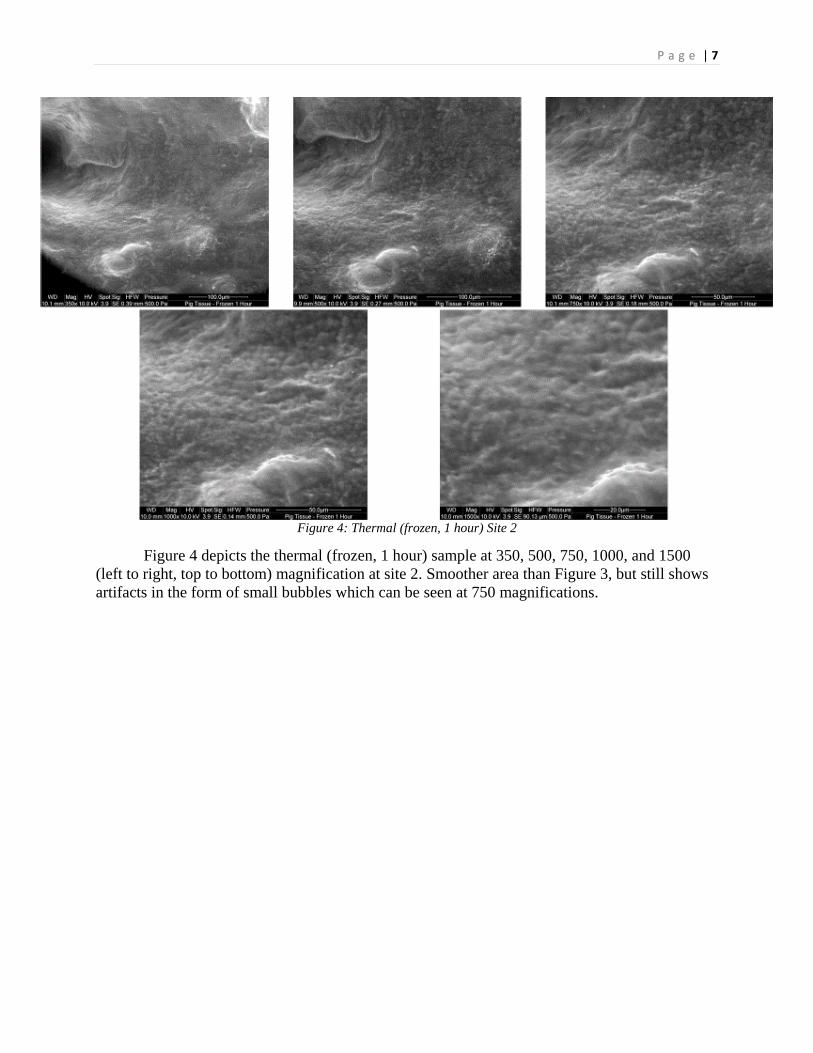
Figure 4: Thermal (frozen, 1 hour) Site 2
Figure 4 depicts the thermal (frozen, 1 hour) sample at 350, 500, 750, 1000, and 1500
(left to right, top to bottom) magnification at site 2. Smoother area than Figure 3, but still shows
artifacts in the form of small bubbles which can be seen at 750 magnifications.
Page 8
P a g e | 8
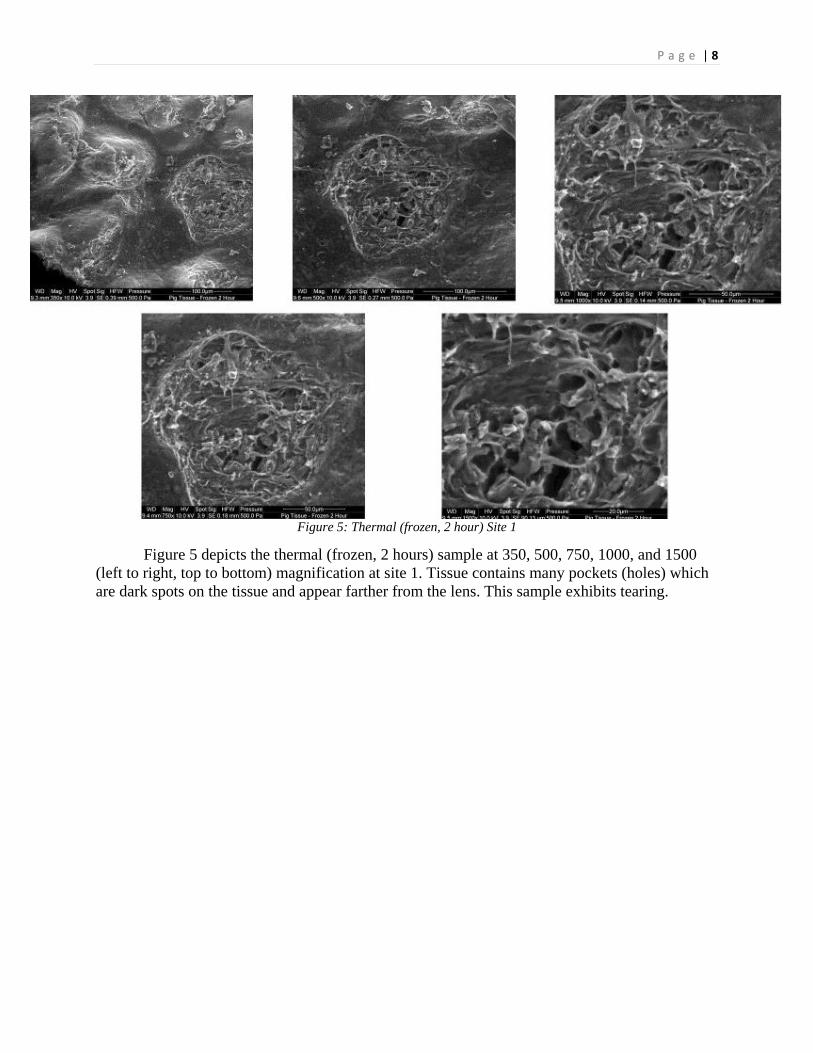
Figure 5: Thermal (frozen, 2 hour) Site 1
Figure 5 depicts the thermal (frozen, 2 hours) sample at 350, 500, 750, 1000, and 1500
(left to right, top to bottom) magnification at site 1. Tissue contains many pockets (holes) which
are dark spots on the tissue and appear farther from the lens. This sample exhibits tearing.
Page 9
P a g e | 9
Figure 6: Thermal (frozen, 2 hours) Site 2
Figure 6 depicts the thermal (frozen, 2 hours) sample at 350, 500, 750, 1000, and 1500
(left to right, top to bottom) magnification at site 2. Tissue contains bubbled areas surrounding
deep pocketing.
Page 10
P a g e | 10
Figure 7: Thermal (frozen, 3 hours) Site 1
Figure 7 depicts the thermal (frozen, 3 hours) sample at 350, 500, 750, 1000, and 1500
(left to right, top to bottom) magnification at site 1. Large bubbles are seen once again. The
tissue also appears extremely smooth, but small pockets are seen in the 750-magnification image.
Figure 8: Thermal (frozen, 3 hours) Site 2
Page 11
P a g e | 11
Figure 8 depicts the thermal (frozen, 3 hours) sample at 350, 500, 750, 1000, and 1500
(left to right, top to bottom) magnification at site 2. This sample does not contain bubbling or
pocketing but consists of tearing.
Figure 9: Thermal (heat, 5 minutes) Site 1
Figure 9 depicts the thermal (heat, 5 minutes) sample at 350, 500, 750, 1000, and 1500
(left to right, top to bottom) magnification at site 1. Large bubbles seen throughout, but many
more small bubbles can be seen in higher magnifications.
Page 12
P a g e | 12
Figure 10: Thermal (heat, 5 minutes) Site 2
Figure 10 depicts the thermal (heat, 5 minutes) sample at 350, 500, 750, 1000, and 1500
(left to right, top to bottom) magnification at site 2. Bubbling becomes slightly smaller,
pocketing more frequent. The 1000 magnification is not available for this sample.
Figure 11: Thermal (heat, 10 minutes) Site 1
Page 13
P a g e | 13
Figure 11 depicts the thermal (heat, 10 minutes) sample at 350, 500, 750, 1000, and 1500
(left to right, top to bottom) magnification at site 1. Small bubbling extremely common making
the tissue look very rough. Some larger bubbling.
Figure 12: Thermal (heat, 10 minutes) Site 2
Figure 12 depicts the thermal (heat, 10 minutes) sample at 350, 500, 750, 1000, and 1500
(left to right, top to bottom) magnification at site 2. Many small pockets. Few small bubbles.
Page 14
P a g e | 14
Figure 13: Thermal (heat, 15 minutes) Site 1
Figure 13 depicts the thermal (heat, 15 minutes) sample at 350, 500, 750, 1000, and 1500
(left to right, top to bottom) magnification at site 1. Many bubbles of small to medium sizes, skin
appears extremely irritated.
Figure 14: Thermal (heat, 15 minutes) Site 2
Page 15
P a g e | 15
Figure 14 depicts the thermal (heat, 15 minutes) sample at 350, 500, 750, 1000, and 1500
(left to right, top to bottom) magnification at site 2. Irritation more severe, bubbling and
pocketing rampant.
Figure 15: Thermal (heat, 20 minutes) Site 1
Figure 15 depicts the thermal (heat, 20 minutes) sample at 350, 500, 750, 1000, and 1500
(left to right, top to bottom) magnification at site 1. Small bubbles even more common, small
pockets seen as well.
Page 16
P a g e | 16
Figure 16: Thermal (heat, 20 minutes) Site 2
Figure 16 depicts the thermal (heat, 20 minutes) sample at 350, 500, 750, 1000, and 1500
(left to right, top to bottom) magnification at site 2. More pockets than bubbles observed. Pockets
are deeper than the previous figure.
Figure 17: Chemical (acid 12.3M, 1 minute) Site 1
Page 17
P a g e | 17
Figure 17 depicts the chemical (acid 12.3M, 1 minute) sample at 350, 500, 750, 1000,
and 1500 (left to right, top to bottom) magnification at site 1. Many small bubbles seen, some
large. Irritation.
Figure 18: Chemical (acid 12.3M, 1 minute) Site 2
Figure 18 depicts the chemical (acid 12.3M, 1 minute) sample at 350, 500, 750, 1000,
and 1500 (left to right, top to bottom) magnification at site 2. Irritation more severe. Many small
bubbles.
Page 18
P a g e | 18
Figure 19: Chemical (acid 12.3M, 3 minutes) Site 1
Figure 19 depicts the chemical (acid 12.3M, 3 minutes) sample at 350, 500, 750, 1000,
and 1500 (left to right, top to bottom) magnification at site 1. Deep pocketing. Some fat layer can
be seen.
Figure 20: Chemical (acid 12.3M, 3 minutes) Site 2
Page 19
P a g e | 19
Figure 20 depicts the chemical (acid 12.3M, 3 minutes) sample at 350, 500, 750, 1000,
and 1500 (left to right, top to bottom) magnification at site 2. Deep pocketing (hole right through
to the fat layer which can be observed).
Figure 21: Chemical (acid 12.3M, 5 minutes) Site 1
Figure 21 depicts the chemical (acid 12.3M, 5 minutes) sample at 350, 500, 750, 1000,
and 1500 (left to right, top to bottom) magnification at site 1. Deep pocketing with small bubbles
inside of the pockets.
Page 20
P a g e | 20
Figure 22: Chemical (acid 12.3M, 5 minutes) Site 2
Figure 22 depicts the chemical (acid 12.3M, 5 minutes) sample at 350, 500, 750, 1000,
and 1500 (left to right, top to bottom) magnification at site 2. Large pocket seen in upper left of
350 magnification. Small bubbles seen inside the pocket, skin appears irritated.
Figure 23: Chemical (acid 12.3M, 8 minutes) Site 1
Page 21
P a g e | 21
Figure 23 depicts the chemical (acid 12.3M, 8 minutes) sample at 350, 500, 750, 1000,
and 1500 (left to right, top to bottom) magnification at site 1. Chasm from acid formed, pocket
deem enough to see the fat layer. String of epithelial tissue can be seen across the chasm.
Figure 24: Chemical (acid 12.3M, 8 minutes) Site 2
Figure 24 depicts the chemical (acid 12.3M, 8 minutes) sample at 350, 500, 750, 1000,
and 1500 (left to right, top to bottom) magnification at site 2. Very deep crevasse caused by acid.
Epithelial tissue attached to both sides. Large bubbles.
Page 22
P a g e | 22
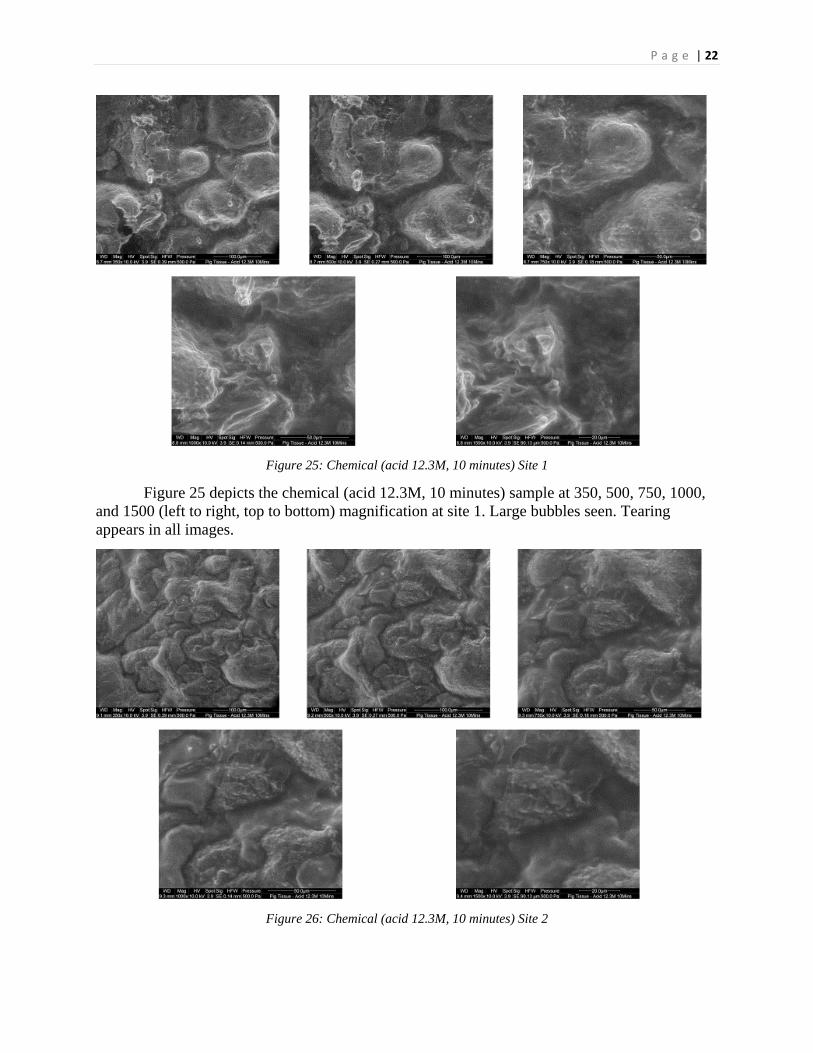
Figure 25: Chemical (acid 12.3M, 10 minutes) Site 1
Figure 25 depicts the chemical (acid 12.3M, 10 minutes) sample at 350, 500, 750, 1000,
and 1500 (left to right, top to bottom) magnification at site 1. Large bubbles seen. Tearing
appears in all images.
Figure 26: Chemical (acid 12.3M, 10 minutes) Site 2
Page 23
P a g e | 23
Figure 26 depicts the chemical (acid 12.3M, 10 minutes) sample at 350, 500, 750, 1000,
and 1500 (left to right, top to bottom) magnification at site 2. Many bubbles surrounded by deep
pockets. Fat layer can be seen in the 750 magnifications and above.
Figure 27: Chemical (acid 6.2M, 1 minute) Site 1
Figure 27 depicts the chemical (acid 6.2M, 1 minute) sample at 350, 500, 750, 1000, and
1500 (left to right, top to bottom) magnification at site 1. Many large bubbles surrounded by
deep pockets. The fat layer can be seen in 500 and 750 magnifications.
Page 24
P a g e | 24
Figure 28: Chemical (acid 6.2M, 1 minute) Site 2
Figure 28 depicts the chemical (acid 6.2M, 1 minute) sample at 350, 500, 750, 1000, and
1500 (left to right, top to bottom) magnification at site 2. Tearing is seen in all images. Large
bubbles also seen. Pocketing is not very deep.
Figure 29: Chemical (acid 6.2M, 3 minutes) Site 1
Page 25
P a g e | 25
Figure 29 depicts the chemical (acid 6.2M, 3 minutes) sample at 350, 500, 750, 1000, and
1500 (left to right, top to bottom) magnification at site 1. Pocketing becomes deeper. Tearing still
seen.
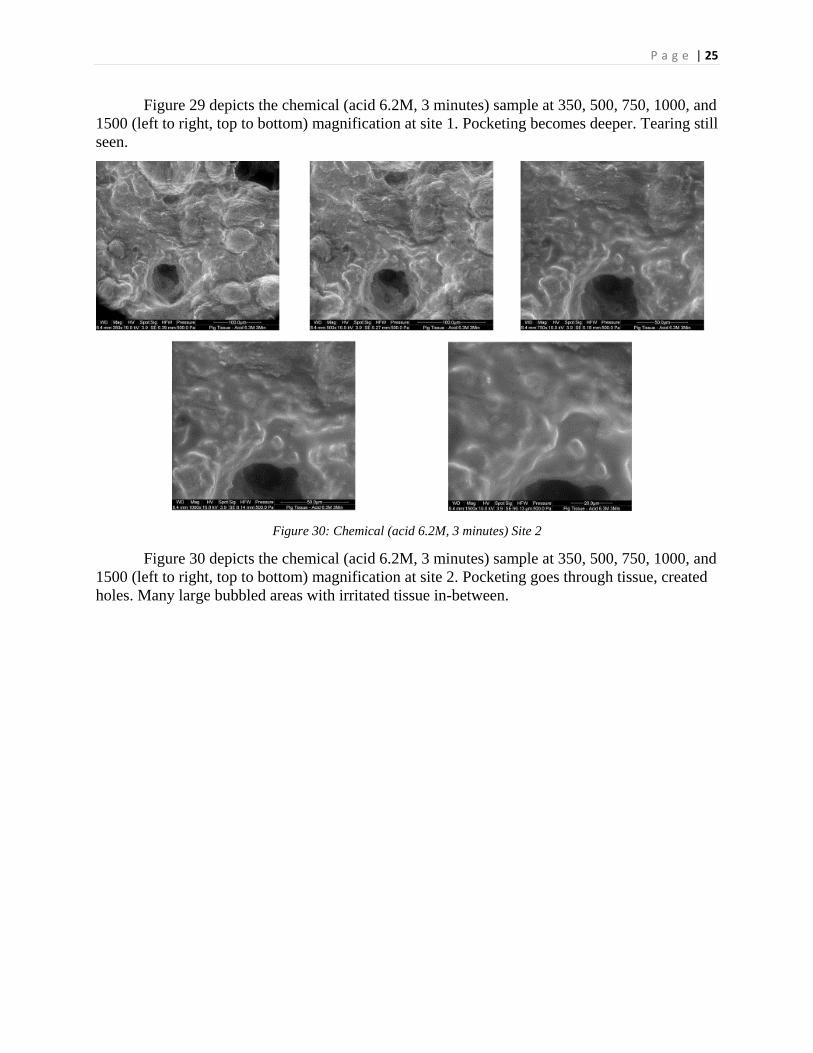
Figure 30: Chemical (acid 6.2M, 3 minutes) Site 2
Figure 30 depicts the chemical (acid 6.2M, 3 minutes) sample at 350, 500, 750, 1000, and
1500 (left to right, top to bottom) magnification at site 2. Pocketing goes through tissue, created
holes. Many large bubbled areas with irritated tissue in-between.
Page 26
P a g e | 26
Figure 31: Chemical (acid 6.2M, 5 minutes) Site 1
Figure 31 depicts the chemical (acid 6.2M, 5 minutes) sample at 350, 500, 750, 1000, and
1500 (left to right, top to bottom) magnification at site 1. Pocketing not as deep but more
frequent. Bubbles large and tearing is seen on top of the largest bubble.
Figure 32: Chemical (acid 6.2M, 5 minutes) Site 2
Page 27
P a g e | 27
Figure 32 depicts the chemical (acid 6.2M, 5 minutes) sample at 350, 500, 750, 1000, and
1500 (left to right, top to bottom) magnification at site 2. Tearing is seen on top of all the
bubbles. Pockets do not appear any deeper than Figure 31, but fat layer can be seen.
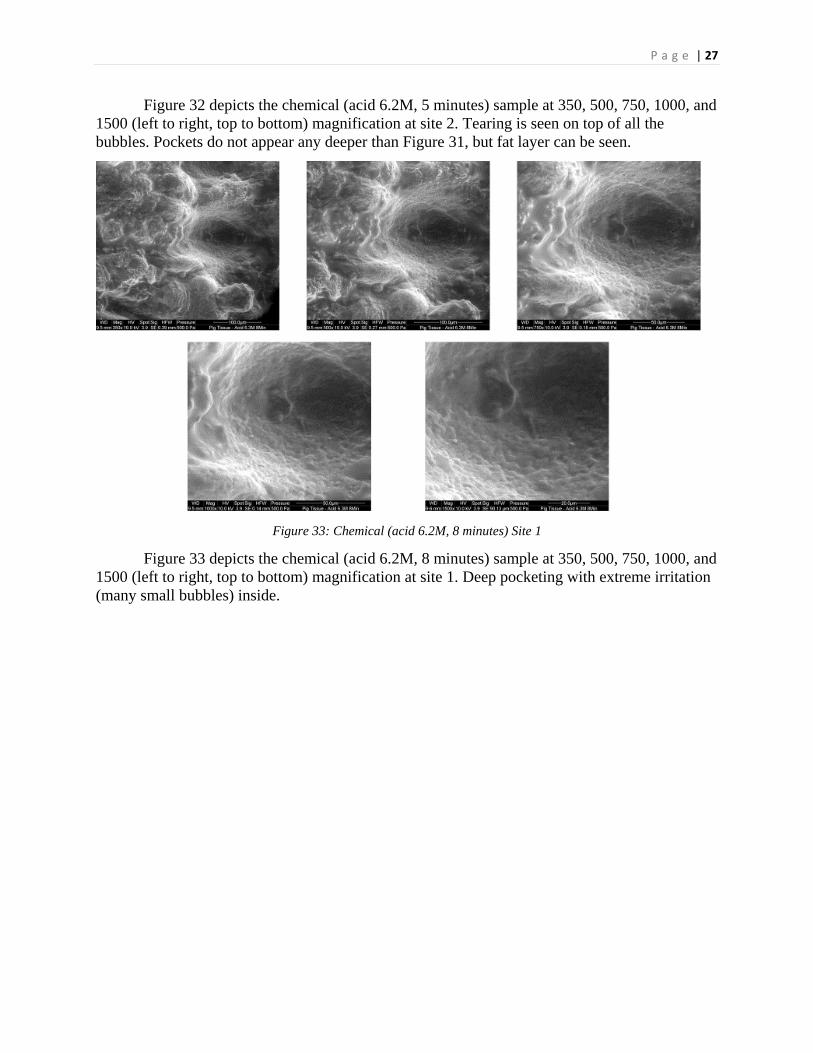
Figure 33: Chemical (acid 6.2M, 8 minutes) Site 1
Figure 33 depicts the chemical (acid 6.2M, 8 minutes) sample at 350, 500, 750, 1000, and
1500 (left to right, top to bottom) magnification at site 1. Deep pocketing with extreme irritation
(many small bubbles) inside.
Page 28
P a g e | 28
Figure 34: Chemical (acid 6.2M, 8 minutes) Site 2
Figure 34 depicts the chemical (acid 6.2M, 8 minutes) sample at 350, 500, 750, 1000, and
1500 (left to right, top to bottom) magnification at site 2. Hole-like pocketing, many large
bubbles. Topography goes from very high (bottom left of 350 magnification) to very low (hole).
Minimal tearing observed on bubbles.
Figure 35: Chemical (acid 6.2M, 10 minutes) Site 1
Page 29
P a g e | 29
Figure 35 depicts the chemical (acid 6.2M, 10 minutes) sample at 350, 500, 750, 1000,
and 1500 (left to right, top to bottom) magnification at site 1. Few large bubbles surrounded by
pocketing and many small irritated bubbles. Tearing observed on all large bubbles (refer to 500
magnification).
Figure 36: Chemical (acid 6.2M, 10 minutes) Site 2
Figure 36 depicts the chemical (acid 6.2M, 10 minutes) sample at 350, 500, 750, 1000,
and 1500 (left to right, top to bottom) magnification at site 2. Topography extremely bubbled,
large pockets between all bubbles. Tearing seen in 350, 500, and 750 magnifications.
Through this research, it can be concluded that as the time interval increases, more
artifacts are observed on the epithelial tissue. Due to this, the examiner can determine an
approximate time interval of exposure. The best way to determine the period the tissue was
exposed is to examine the bubbling and pocketing in the skin.
Discussion
As aforementioned, while the time of exposure increases, the number of artifacts seen on
the tissue also increases. In the cold burns, it was seen that the bubbling in Figures 3-8 was very
large, with only small bubbles seen occasionally. This bubbling is due to water in the fat layer
which had frozen and created large mountainous lumps of crystallized water in the tissue. Once
the water melted, it left these large mountains where the tissue around it had shrunk due to the
cold temperature. This freeze-thaw cycle is consistent with the tissue freezing exhibited by
Schäfer6.
Similarly, in the heat, small bubbles were seen throughout (Figures 9-16). These bubbles
could also be due to water, but rather than freezing, the water boiled off leaving the artifacts seen
in Figure 9. The water boiling out of the tissue left a slight blistering effect on the epidermis,
leaving many small pockets and small bubbles.
Page 30
P a g e | 30
Lastly, the chemical burns were observed. In these cases, many small bubbles were seen
at first, as if the skin is irritated. Once the exposure time increases, deep pocketing is seen
(Figures 20, 24, 29, 30, 33, 35, and 36). In Figure 24 we can see that the tissue has been cleaved
in half by the acid eating away at it, leaving a crevasse in the epithelial layer. The fat layer can
also be seen in these trials. In Figure 27, a “smooth” or “blurry” part of the tissue can be seen
(specifically at 750 magnification) wherein the epithelial tissue has been eaten away and the fat
is visible.
In the 6.2M experiment it observed that the tissue seemed to be more severely affected
than the 12.3M acid experiment. This could be due to the water added to dilute the solution. In
this case, the water could have created a barrier between the acid and the environment, allowing
the water to evaporate first before the acid could be removed from the tissue. Due to this, the
acid would be spread out for a longer period than on the 12.3M tissue.
This research contains a few variables which could have affected results. The first
constraint was the pig tissue that was used for experimentation. Generally, the pig tissue is fattier
than human, which is why the hock of a pig was used (to reduce fat layer differences). However,
the layer of fat in this experiment was not a constant and therefore was not controlled for. This
could have affected the frozen tissue, for example, by increasing the amount of water that was
available in the fat layer underneath thereby increasing or decreasing the number of artifacts in
the tissue. Penultimately, as mentioned earlier, the ESEM can leave artifacts when the sample is
under the beam for too long. In the control sample, it was noted that if the electron beam was left
on a specific area for longer than 10 minutes, the bubbles would disappear slowly, creating a
pocket in the tissue. These artifacts were often seen in the 1000 and 1500 magnification due to
the electron beam becoming more focused on an area for a long period of time. Lastly, the time
constraint of this experiment left more time intervals to be desired. If the amount of time
intervals could be extended, a more accurate representation of what the skin looks like at certain
intervals could be obtained.
Conclusion
The results of this experiment support the hypothesis that as exposure time is increased,
the artifacts on the tissue will also increase. However, due to the time constraint and funding
limitations of this research, more time intervals will be needed to justify the approximation of
time exposed.
Page 31
P a g e | 31
Acknowledgments
The authors sincerely thank the University of Windsor, Forensic Science (Faculty of
Sciences) for funding this research. We also thank Sharon Leckie and the Great Lakes Institute
for Environmental Research for always being so kind and allowing us to utilize the Scanning
Electron Microscope throughout the semester.
Page 32
P a g e | 32
References
1 Danilatos, G. (1994). “Environmental Scanning Electron Microscopy and Microanalysis.”
Microchimica Acta, 114-115 (1): 143-155. doi:10.1007/BF01244538
2 Kolios, L., Striepling, E., Kolios, G., Rudolf, K., Dresing, K., Dörges, J., Stürmer, E. K.
(2010). “The Nitric Acid Burn Trauma of the Skin.” Journal of Plastic, Reconstructive &
Aesthetic Surgery, 63(4): 358-e363. doi:10.1016/j.bjps.2009.09.001
3 Kozawa, S., Kakizaki, E., Muraoka, E., Koketsu, H., Setoyama, M., & Yukawa, N. (2009).
“An Autopsy Case of Chemical Burns by Hydrochloric Acid.” Legal Medicine, 11: 535-
537. doi:10.1016/j.legalmed.2009.01.008
4 Reddy, K., & Lowenstein, E. J. (2011). “Forensics in Dermatology: Part I.” Journal of the
American Academy of Dermatology, 64(5): 801-808. doi:10.1016/j.jaad.2010.05.050
5 Selby, C. (1955). “An Electron Microscope Study of the Epidermis of Mammalian Skin in
Thin Sections: I. Dermo-Epidermal Junction and Basal Cell Layer.” The Journal of
Biophysical and Biochemical Cytology, 1(5): 429–444.
6 Schäfer, A. T., & Kaufmann, J. D. (1999). “What Happens in Freezing Bodies?” Forensic
Science International, 102(2-3): 149-158. doi:10.1016/S0379-0738(99)00043-2
7 Schmook, F. P., Meingassner, J. G., & Billich, A. (2001). “Comparison of Human Skin or
Epidermis Models with Human and Animal Skin in In-Vitro Percutaneous Absorption.”
International Journal of Pharmaceutics, 215(1-2): 51-56. doi:10.1016/S0378-
5173(00)00665-7
8 Songur, M. K., Akdemir, O., Lineaweaver, W. C., Cavusoglu, T., Ozsarac, M., Aktug, H.,
Tiftikcioglu, Y. O. (2015). “Comparison of Skin Effects of Immediate Treatment
Modalities in Experimentally Induced Hydrofluoric Acid Skin Burns.” International
Wound Journal, 12(6): 716-723. doi:10.1111/iwj.12214
9 Yoo, J., Roh, S., Lee, N., Yang, K., & Moon, J. (2010). “A Case Report of a Chemical Burn
Due To The Misuse of Glacial Acetic Acid.” Journal of Plastic, Reconstructive &
Aesthetic Surgery, 63(12): 829-e831. doi: 10.1016/j.bjps.2010.07.007
10 Tintinalli, J. E. (2010). “Emergency Medicine: A Comprehensive Study Guide (Emergency
Medicine (Tintinalli)).” New York: McGraw-Hill Companies. pp. 1374–1386. ISBN 0-
07-148480-9.
11 “Are You Storing Food Safely?” (2016). U.S. Food & Drug Administration, Silver Spring,
MD. Retrieved from
https://www.fda.gov/ForConsumers/ConsumerUpdates/ucm093704.htm