53
Defining Flood Risk on Alluvial Fans Jim O'Brien FLO‐2D Software, Inc.

Defining Flood Risk on Alluvial Fans
Jim O'BrienFLO‐2D Software, Inc.

Topics• Flood hazard uncertainty vs complexity
• Possibility vs probability
• Flood risk ≠ flood hazard
• Stochastic vs deterministic flood hazard analyses
• Linking stochastic and deterministic methods
• Integrating hazard mapping and damage assessment
• Managing risk
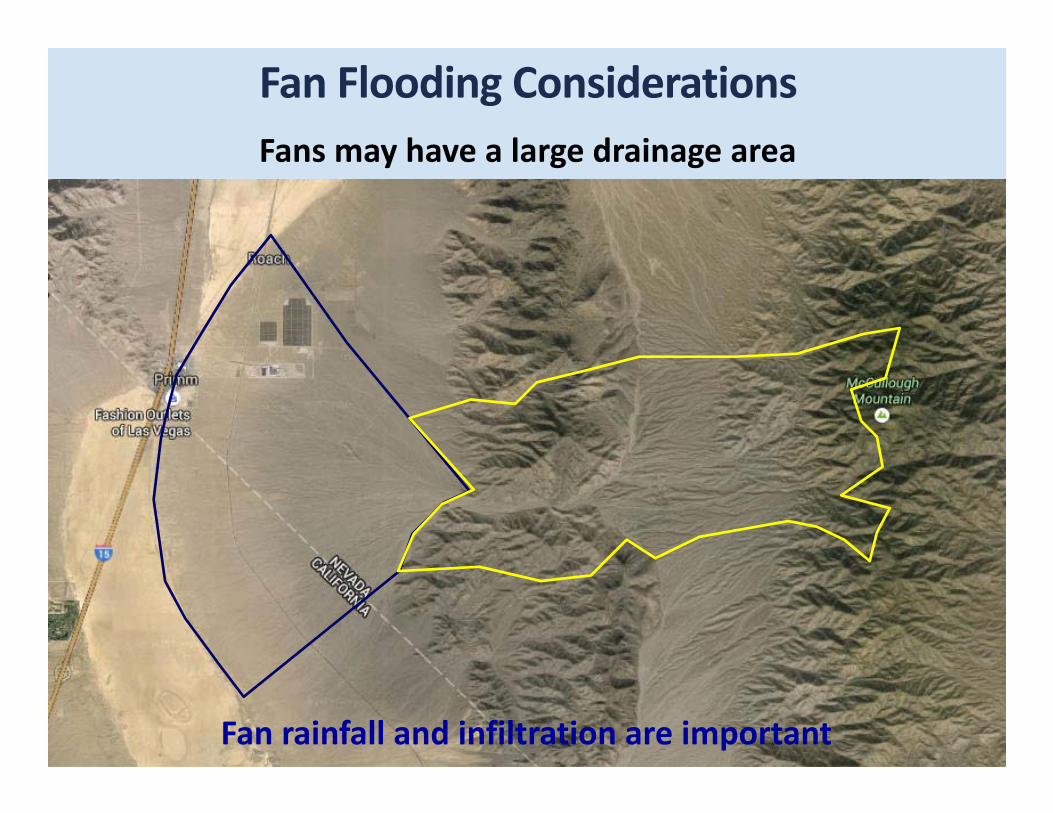
Fan Flooding ConsiderationsFans may have a large drainage area
Fan rainfall and infiltration are important

Fan Flooding Considerations
• Large flood events ‐ but small apex channel capacity (2‐5 yr return event capacity)
• Fan apex avulsions at the fan apex – are not the dominant process for the 100‐year flood

Fan Flooding Considerations
Flooding hazard and risk is not always predispositioned by fan morphology, existing conditions or rainfall frequency

Fan Sedimentation Issues
• Scour and deposition – flow paths: Issue for frequent events, but not for the 100‐year flood
• For arid fans (not mudflows) assume 10% to 20% sediment concentration by volume –increases flood volume
• Loss of channel conveyance – causes avulsion

Fan Flooding ‐ Important Factors• Flood Volume = flood hydrographs + rainfall
• Floodwave attenuation
• Losses – infiltration = 40%
• Sediment concentration (increases flood volume)
• Topography
• Obstructions
Minor Factors: avulsion, apex channels, roughness

Key Words
• Uncertainty
• Risk
• Hazard
• Probability

Word Application
• “Risk analysis and uncertainty in flood damage reduction studies”
• “Extreme storms create serious flood hazards in the Colorado Front Range, making flood risk an important aspect of state and local planning. However, in areas of steep topography such as Colorado, estimates of flood risk are highly uncertain because of the sparsity of data and the high spatial and temporal variability in precipitation.”
• “Sources of uncertainty in flood inundation maps”

Fan Flooding ‐ Uncertainty
Flood path uncertainty occurs with:
• Variable topography – unconfined flow• Sediment load – incision and avulsion• Hydrology ‐ deviate from design storm• Floodwave attenuation

Fan Flooding – Possibility vs Probability
Is it possible to flood this site?
Anything is possible. Is it probable? What is the likelihood that this location will be flooded during
the 100‐year rainfall?

Flood Probability100‐yr design storm – 1% chance in any given year with roughly a 63% chance in a 100 yr period •Water only flood?
•Hyperconcentrated sediment flow (mudflood, mud flow, debris flow) Cv > 20%

Hazard ≠ Risk
Hazard• An event that poses a danger
Vulnerability• Susceptibility to specific hazard
Risk• Probability of suffering harm or loss

Hazard
“…a potentially damaging physical event…that may cause the loss of life or injury, property damage, social and economic disruption or environmental degradation.” UN‐ISDR (2004)
Flood hazard is defined as exposure to flooding.

Risk
“…the probability of harmful consequences, or expected losses (deaths, injuries, property, livelihoods, economic activity disrupted or environment damaged) resulting from interactions between natural or human‐induced hazards and vulnerable conditions.” UN‐ISDR (2004)
When people discuss risk, they typically mean hazard.

Hazard ≠ Risk
Risk = Hazard ∩ Vulnerability For specific event

Sacramento
Assume 3 ft of flood hazard on each side of the river. Similar hazard but significantly different risk.
Stochastic vs Deterministic Models
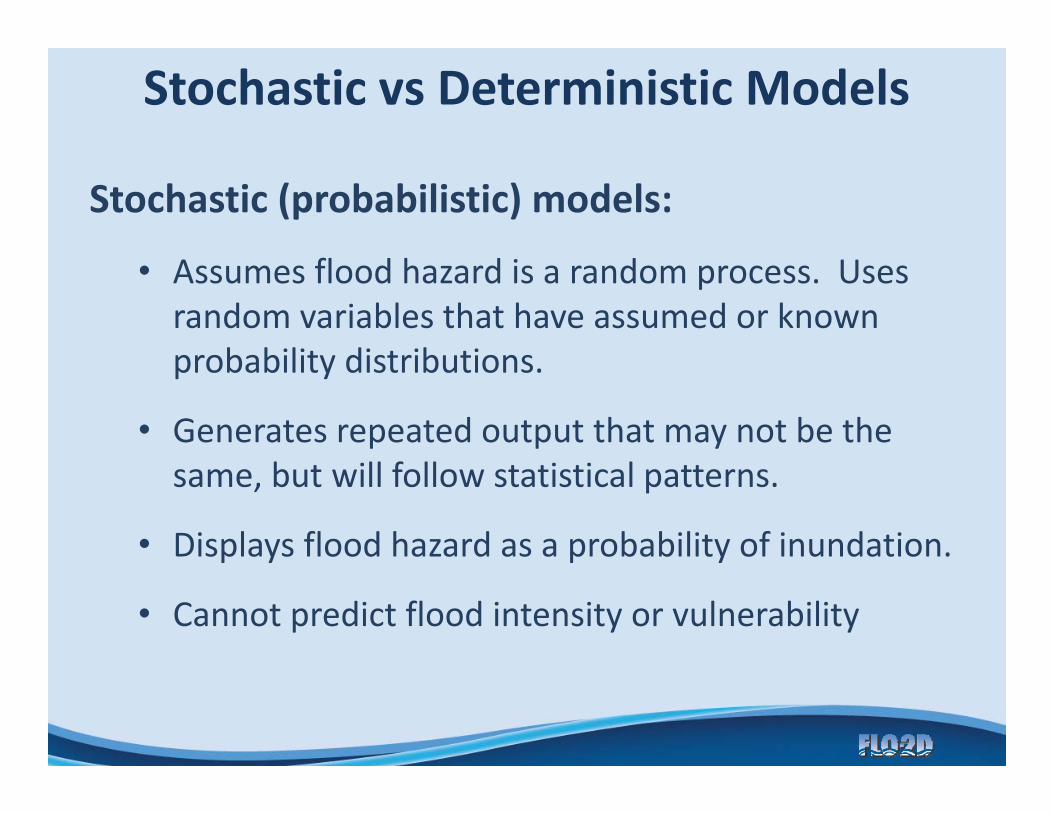
Stochastic (probabilistic) models:
• Assumes flood hazard is a random process. Uses random variables that have assumed or known probability distributions.
• Generates repeated output that may not be the same, but will follow statistical patterns.
• Displays flood hazard as a probability of inundation.
• Cannot predict flood intensity or vulnerability

Stochastic vs Deterministic ModelsDeterministic models:
• Based on physical relationships. Predicts solutions/outcomes based on existing fan conditions.
• Always produces the same output from the same set of input data.
• Cannot establish the probability of flood inundation for varying future conditions.

FEMA FAN Model ‐ Stochastic?
5 fps 4 ft
3 fps 2 ft
2 fps 1 ft
1 fps 0.5 ft
Stochastic vs Deterministic Models
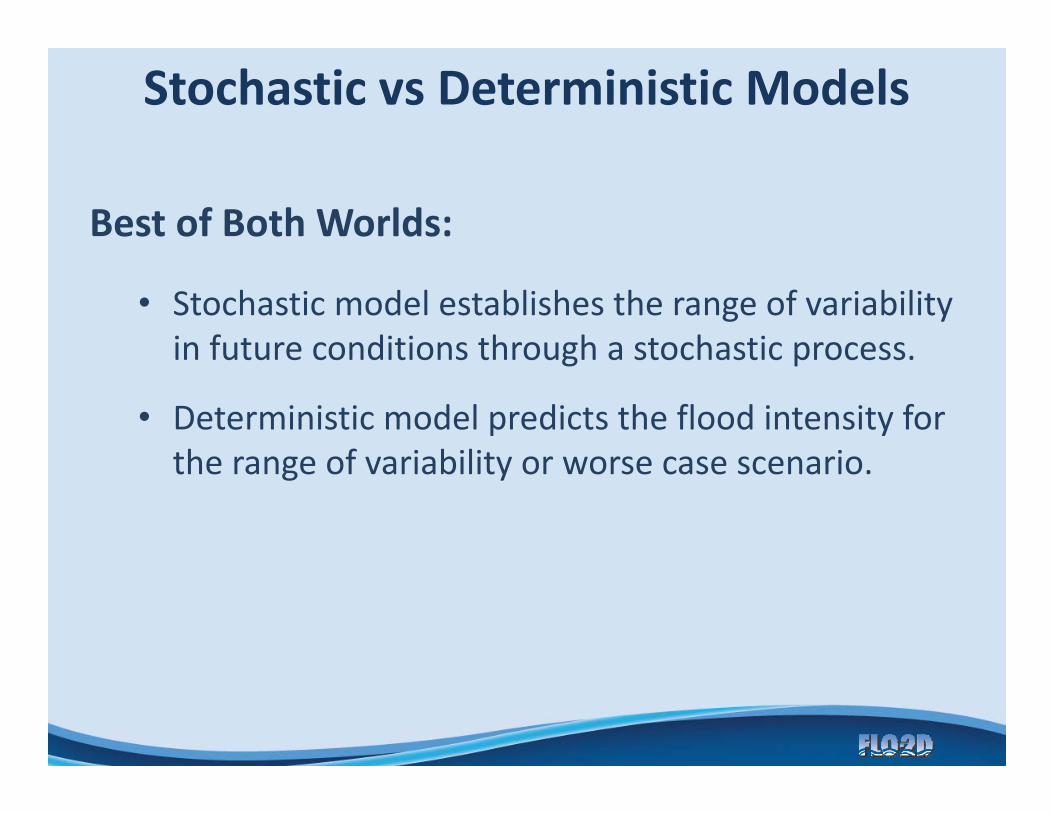
Best of Both Worlds:
• Stochastic model establishes the range of variability in future conditions through a stochastic process.
• Deterministic model predicts the flood intensity for the range of variability or worse case scenario.

Conceptual Model: Linking Stochastic and Deterministic Approaches to Alluvial Fan Flooding
General Approach Concepts
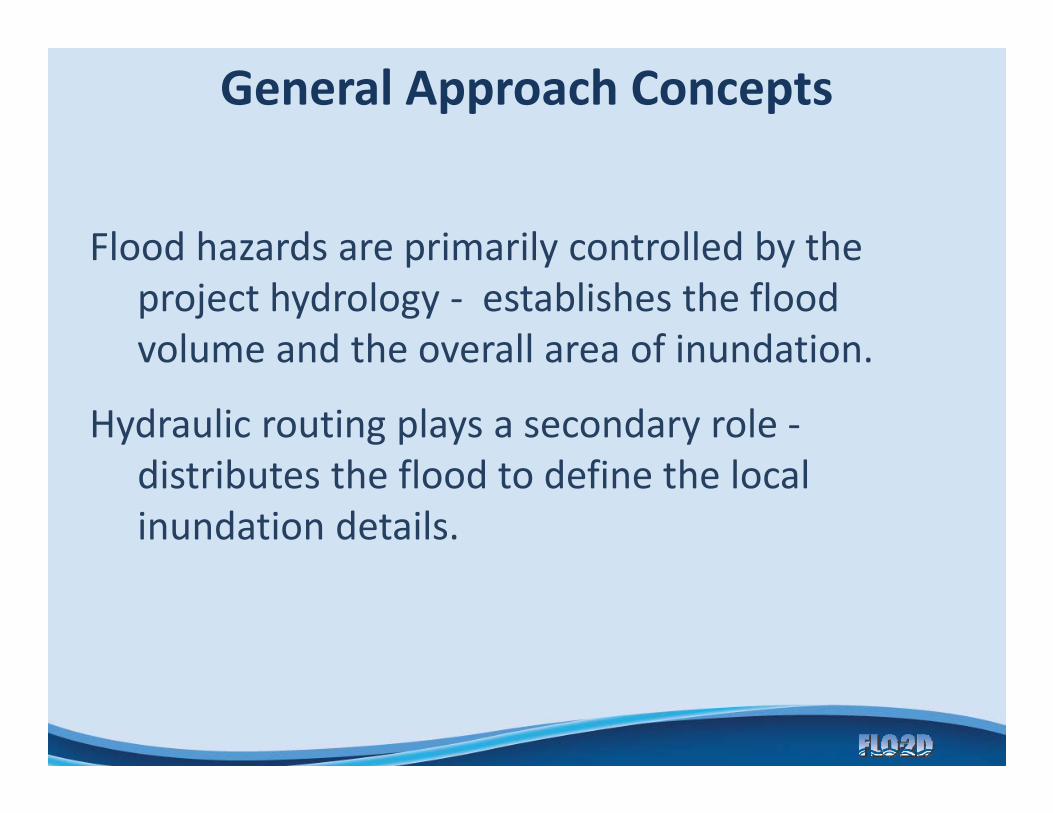
Flood hazards are primarily controlled by the project hydrology ‐ establishes the flood volume and the overall area of inundation.
Hydraulic routing plays a secondary role ‐distributes the flood to define the local inundation details.

General Approach Concepts
Methods for conducting uncertainty analyses for hydrologic or hydraulic models:
• First‐order, second moment approximation methods
• Probabilitistic point methods
• Monte Carlo simulations
• Integral transformation methods
Alluvial Fan Flooding as a Stochastic Process
The number of variables affecting the flood depth may exceed the capabilities of deterministic models.
Stochastic models define the flood by treating the physical system as an indexed collection of random variables

Monte Carlo Simulations
Hydrologic/hydraulic parameters vary randomly but follow known/assumed probability distributions
Requires repeated simulations using prescribed values of the random variables generated from the probability distribution
Results are statistically significant if the sample results reflect the observed results

Monte Carlo (MC) SimulationsCritical task is generating the parameter probability
distribution
Alluvial fans Monte Carlo studies: ‐ Calvo and Savi, 2008‐ Wichmann and Becht, 2003‐ Price, 1974
Applying MC is problematic because the hydraulic models take hour(s) to complete one simulation
Required number of MC simulations ~ 10,000

Possible New Alluvial Hazard Delineation Method
Random Walk Model: MC method that doesn’t require repeated flood simulations (Price, 1974; Wichmann and Becht, 2003).
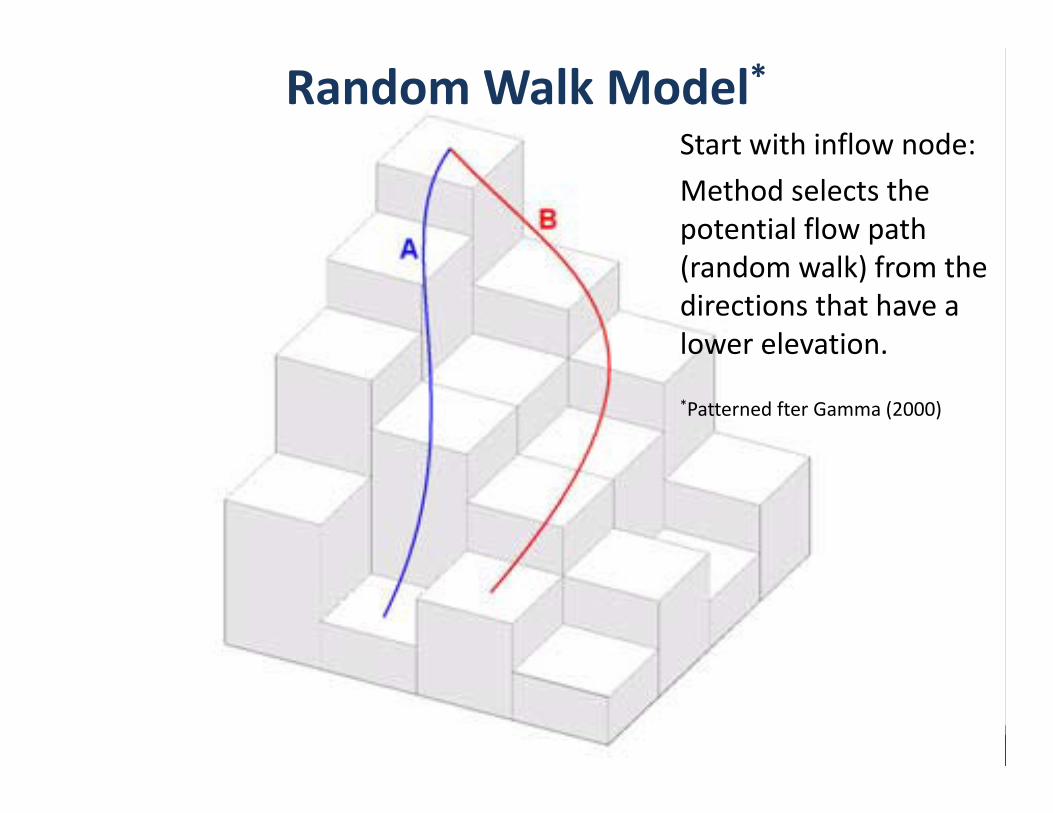
Random Walk Model*Start with inflow node:Method selects the potential flow path (random walk) from the directions that have a lower elevation.
*Patterned fter Gamma (2000)

Alluvial Fan Parameters
Uncertainty parameters:
• Topography, slope
• Roughness value
• Momentum change
• Obstructions (levees, buildings)
• Flow path preference or persistence (channels, streets, distributary channels)
• Sediment concentration (optional)
• Scour and deposition (channel avulsion)
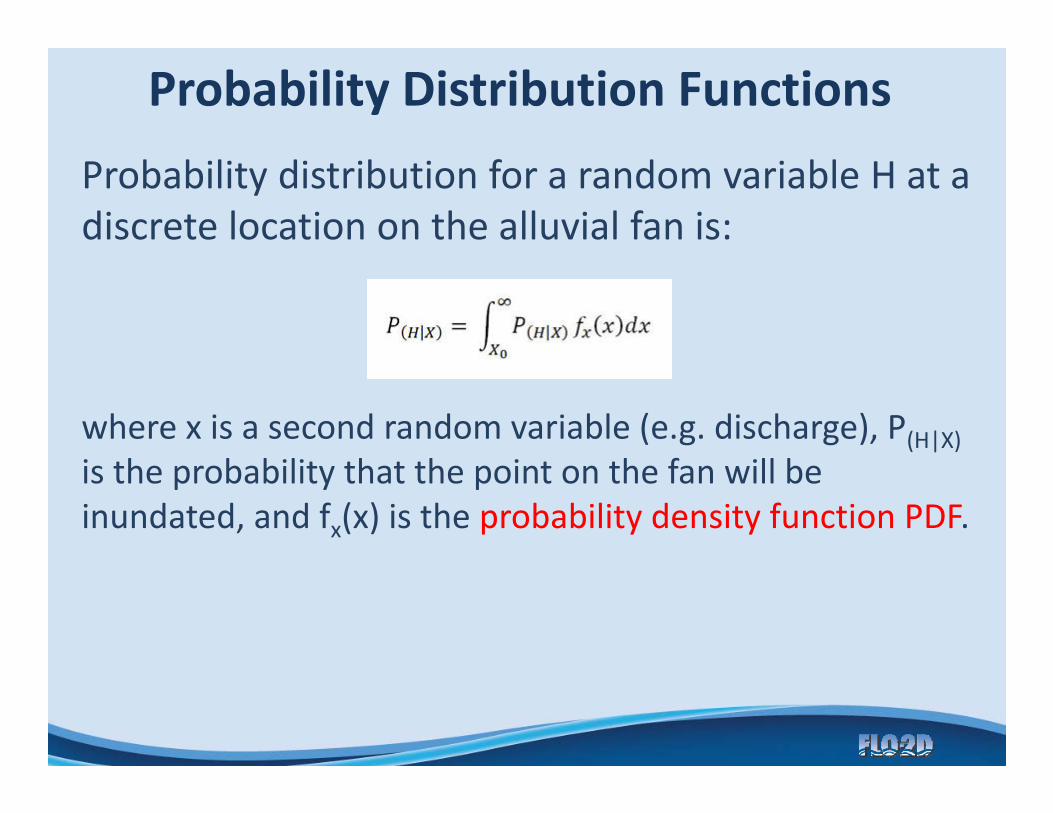
Probability Distribution FunctionsProbability distribution for a random variable H at a discrete location on the alluvial fan is:
where x is a second random variable (e.g. discharge), P(H|X)is the probability that the point on the fan will be inundated, and fx(x) is the probability density function PDF.
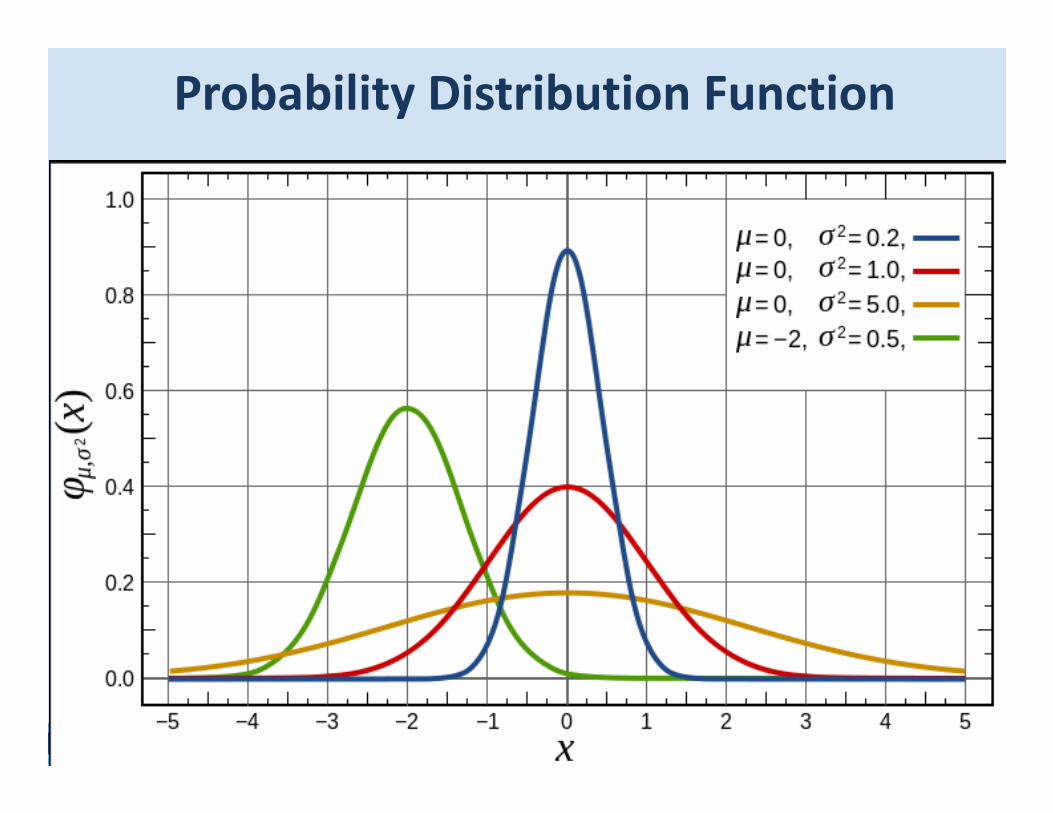
Probability Distribution Function

Simple Example PDF: Avulsion Function*
Avulsion (av) or obstruction (ob):
• No opportunity for avulsion or obstruction: av = 0. or ob = 0.
probability (P = 1.0) for the given flow direction
• For an occurrence of avulsion or obstruction av = 1. or ob = 1.
no probability for flow (P = 0.0) in that direction
*From Heggen (1994)

Another Example PDF: Slope
Price (1974) computes the probability for the slope (s) as:
P = 0.25 + 0.75s
If the slope is 0.0, there is a 25% probability for a typical four paths uniform grid system (or 0.125 probability for the 8‐direction FLO‐2D model)

Probability Assignment
Probabilities based on a random estimate within a given range of the prescribed probability function.
Generate uniformly distributed random numbers between 0 and 1 to assign a probability for:
• Potential scour and deposition• Variation in flow roughness• Changes in flow path direction• Obstructions, flow path preference and avulsion are
assigned probabilities = switch (on or off).
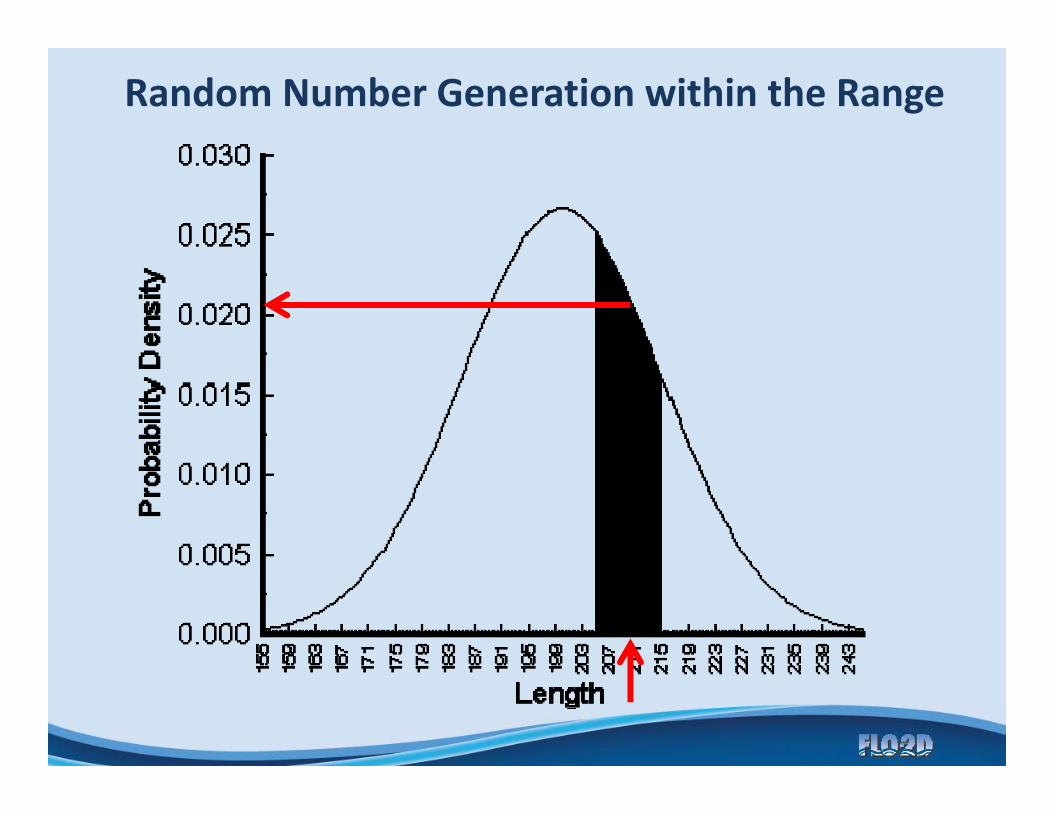
Random Number Generation within the Range

Random Walk ModelThe probability for each grid element to be selected
from the set of potential path elements is given by:
where N is the set of potential flow directions for the given element, βi is the bed slope to neighbor element i, p is a persistence factor and k is the previous flow direction.
The calculated transition probabilities are scaled to cumulative values in the [0,1] interval and a random number generator selects one flow path element from the N set.

Creating the Linkage between the Stochastic and Deterministic Models
The inundation probability is established through a large number of random walk path simulations (e.g. 10,000 runs). The procedure is:
• Identify the primary parameters;• Select PDF to represent the parameters;• Perform the MC random number calculation and conduct
the random walk path simulations;• Calculate the inundation probability of the each grid
element (based on the number of hits that each grid element received out of total number of path simulations).

Final Hazard and Risk Maps
Series of four overlaid maps consisting of:
• Predicted maximum flow depths/velocity for the existing conditions – Deterministic Model
• Hazard Map ‐ High, moderate, low hazard ‐Deterministic Model
• Inundation probability – Stochastic Model
• Damage or Risk Map
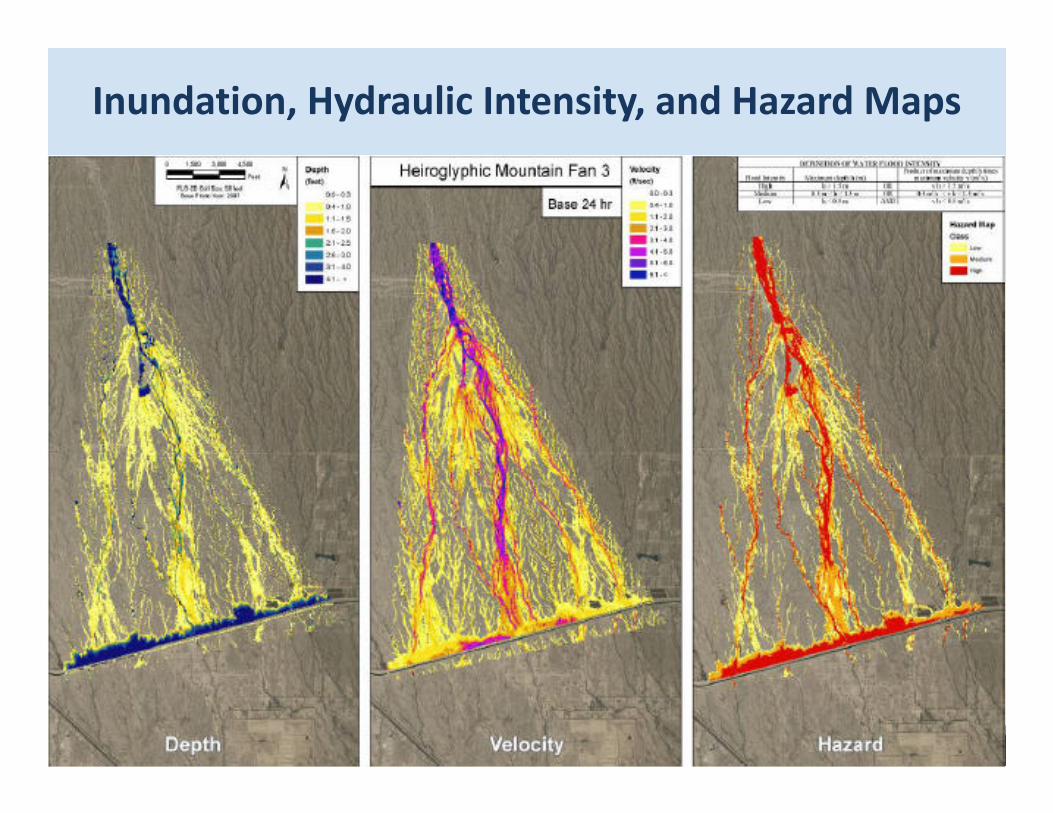
Inundation, Hydraulic Intensity, and Hazard Maps

Hazard Maps

Hazard Definition
.HazardLevel
Map color Description
High RedPeople are in danger both inside and outside of structures. Buildings are in danger of being destroyed.
Medium OrangePeople are in danger outside or structures. Buildings may suffer damage or possible destruction depending on construction materials.
Low Yellow
Danger to people is low. Buildings may suffer limited damage, but flooding or sedimentation may affect structures.

Hazard Map

Probability Map Based on the Random Walk Method
1.00.80.60.40.20.0
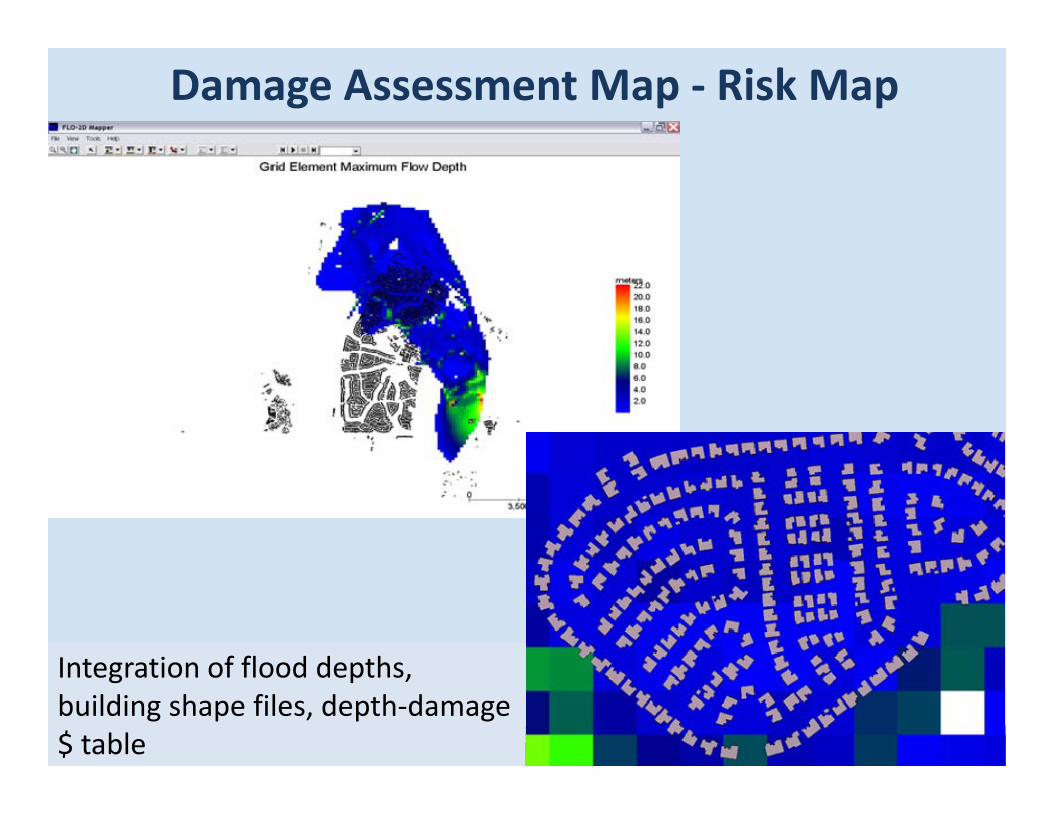
Damage Assessment Map ‐ Risk Map
Integration of flood depths, building shape files, depth‐damage $ table
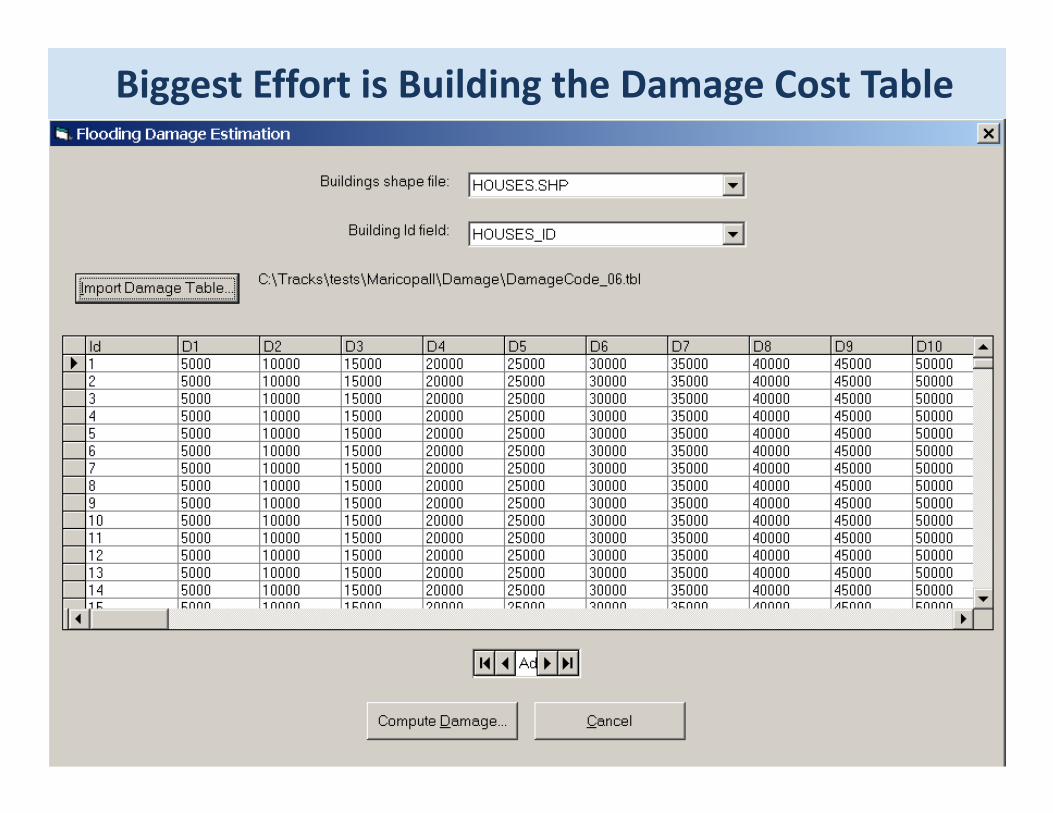
Biggest Effort is Building the Damage Cost Table

Integration Takes a Few Minutes

Managing Risk
Eliminate or manage risk by:
•Identify the potential area of inundation•Review the high hazard areas•Overlay the probability map with the damage map
Select mitigation where it will do the most good!

Managing Risk – Real World
Show Movie

Manage Risk Practical Application – Storm DrainsNo Storm Drains

Manage Risk Practical Application – Storm DrainsWith Storm Drains
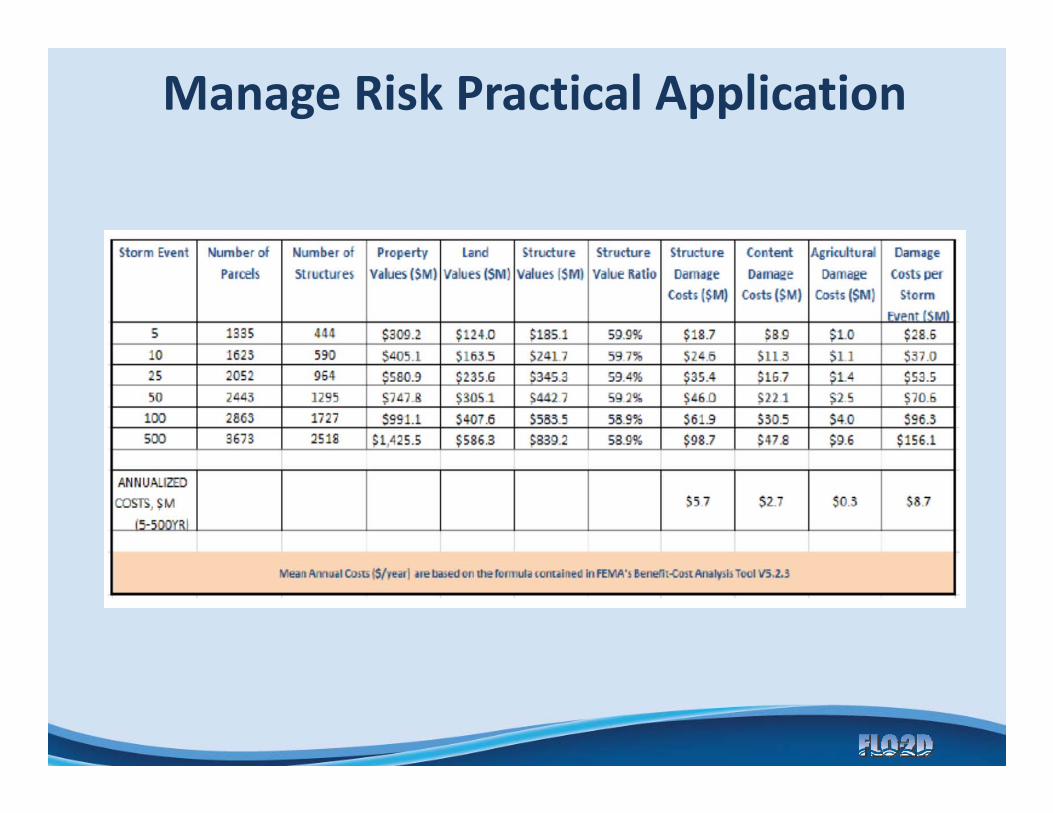
Manage Risk Practical Application

Save your comments/questions for the Panel Discussion


