72
Defining Priorities for Quality Education by Geeta Gandhi Kingdon
Defining Priorities for Quality Education
by
Geeta Gandhi Kingdon
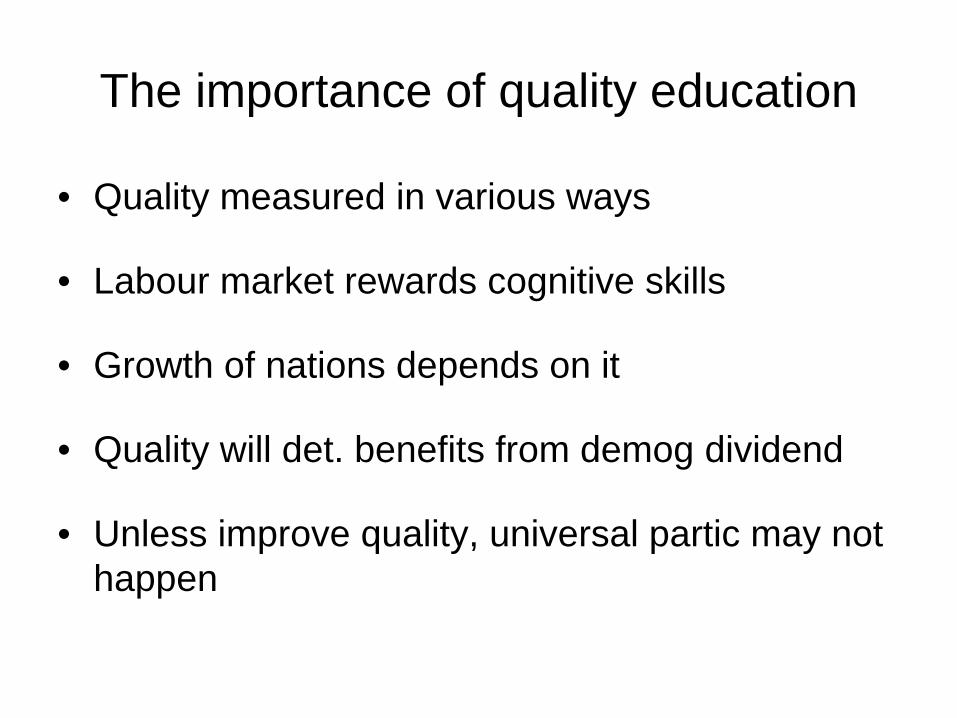
The importance of quality education
• Quality measured in various ways
• Labour market rewards cognitive skills
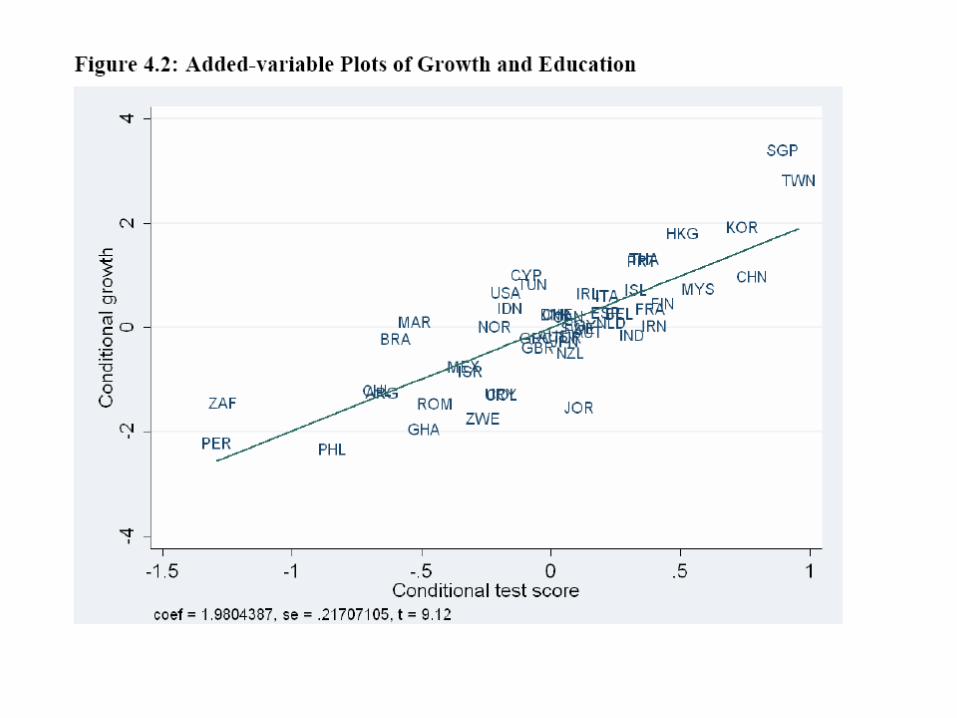
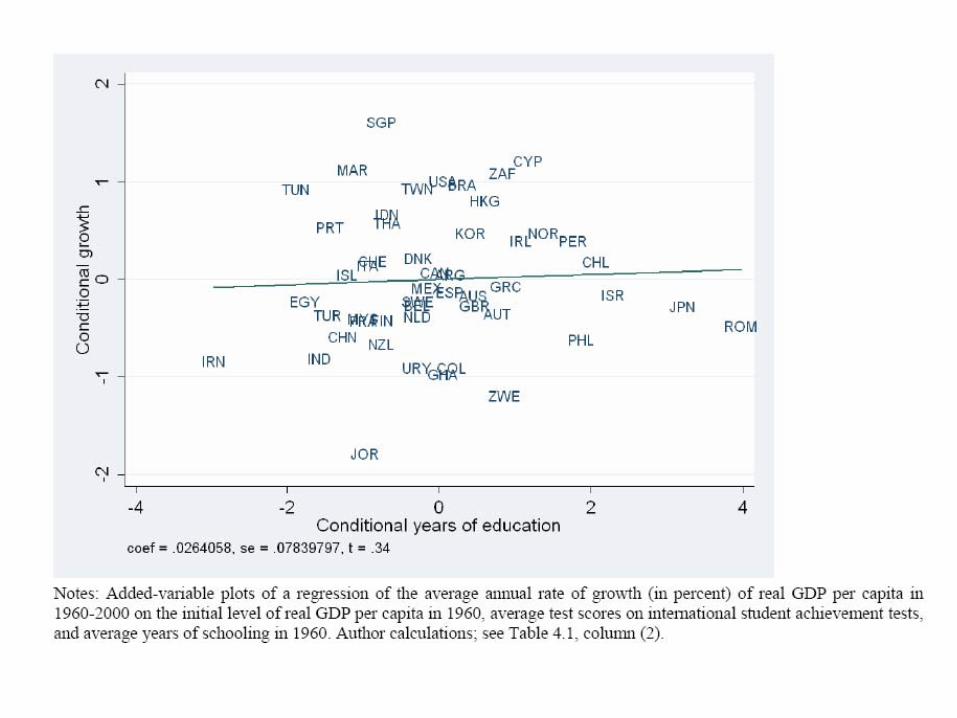
• Growth of nations depends on it
• Quality will det. benefits from demog dividend
• Unless improve quality, universal partic may not happen
Plan
• Description
• Diagnosis
• RTE Act’s solutions; other solutions
• Obstacles to reform & overcoming them
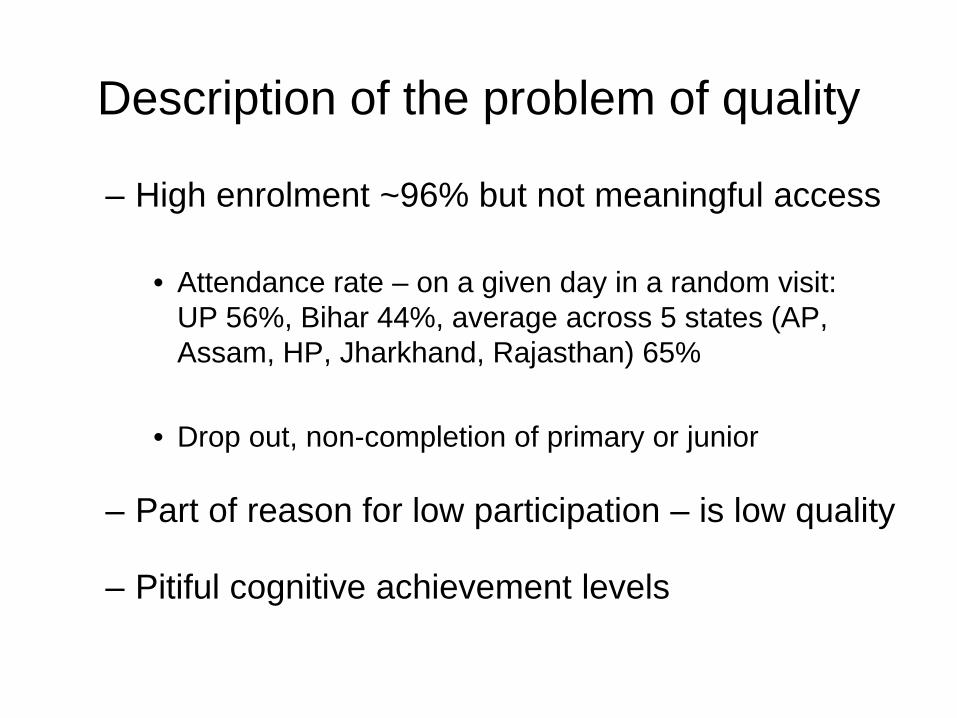
Description of the problem of quality
– High enrolment ~96% but not meaningful access
• Attendance rate – on a given day in a random visit: UP 56%, Bihar 44%, average across 5 states (AP, Assam, HP, Jharkhand, Rajasthan) 65%
• Drop out, non-completion of primary or junior
– Part of reason for low participation – is low quality
– Pitiful cognitive achievement levels
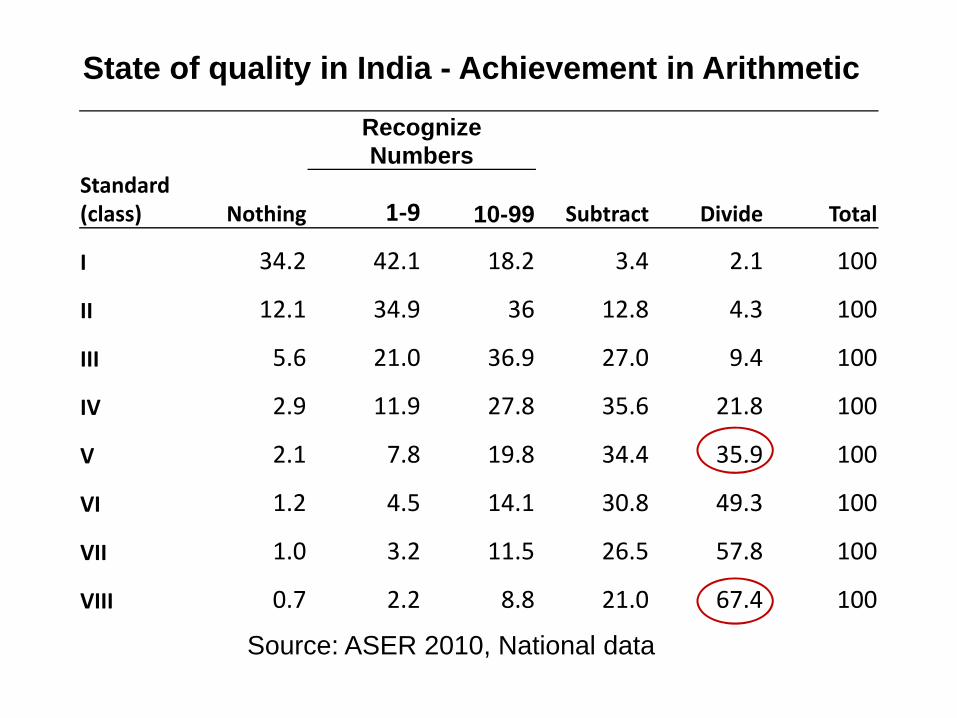
Recognize Numbers
Standard(class) Nothing 1‐9 10-99 Subtract Divide Total
I 34.2 42.1 18.2 3.4 2.1 100
II 12.1 34.9 36 12.8 4.3 100
III 5.6 21.0 36.9 27.0 9.4 100
IV 2.9 11.9 27.8 35.6 21.8 100
V 2.1 7.8 19.8 34.4 35.9 100
VI 1.2 4.5 14.1 30.8 49.3 100
VII 1.0 3.2 11.5 26.5 57.8 100
VIII 0.7 2.2 8.8 21.0 67.4 100
State of quality in India - Achievement in Arithmetic
Source: ASER 2010, National data
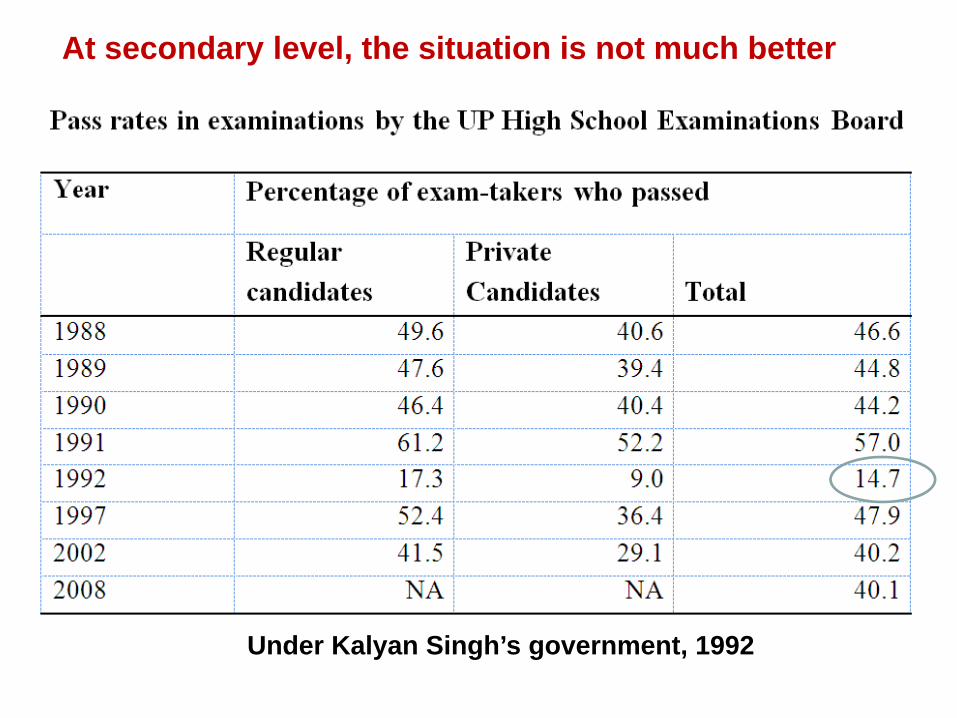
At secondary level, the situation is not much better
Under Kalyan Singh’s government, 1992
Diagnoses
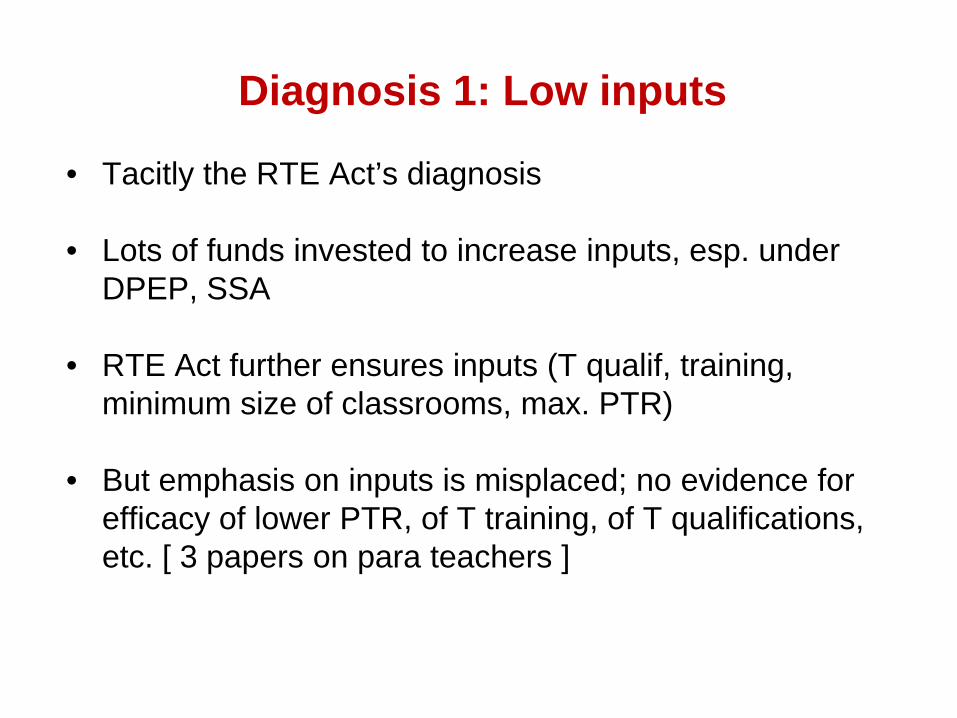
Diagnosis 1: Low inputs
• Tacitly the RTE Act’s diagnosis
• Lots of funds invested to increase inputs, esp. under DPEP, SSA
• RTE Act further ensures inputs (T qualif, training, minimum size of classrooms, max. PTR)
• But emphasis on inputs is misplaced; no evidence for efficacy of lower PTR, of T training, of T qualifications, etc. [ 3 papers on para teachers ]
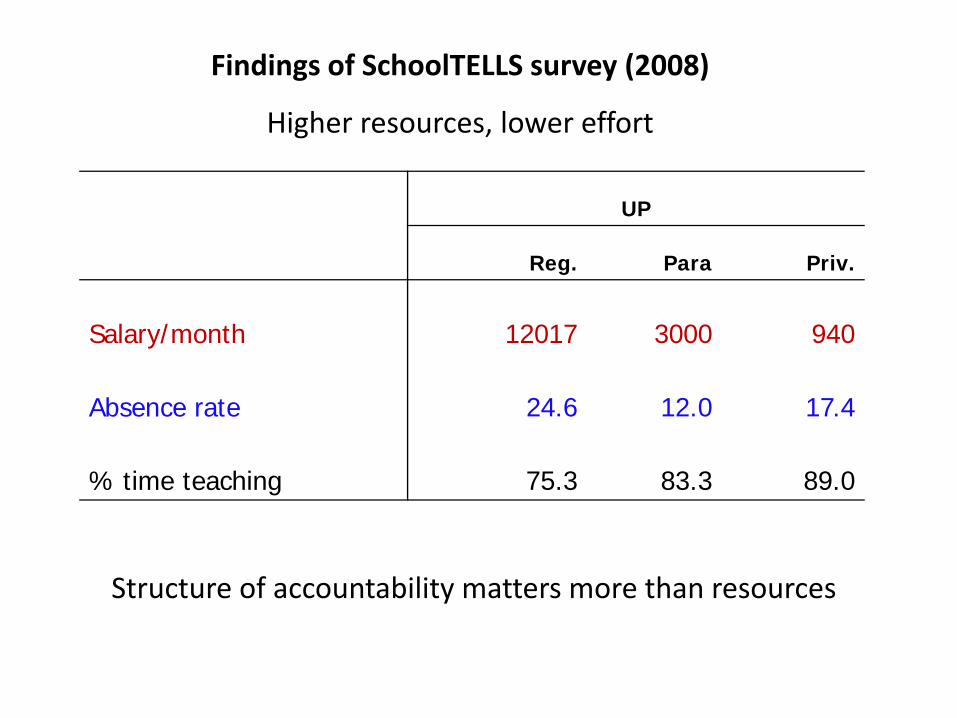
UP
Reg. Para Priv.
Salary/month 12017 3000 940
Absence rate 24.6 12.0 17.4
% time teaching 75.3 83.3 89.0
Findings of SchoolTELLS survey (2008)
Higher resources, lower effort
Structure of accountability matters more than resources
Importance of evidence-based policy making in education
• Education policy needs to be increasingly made on basis of evidence
• Imp role of methodology in gathering evidence
• Imp to carefully analyse data to establish causal relations
Diagnosis 2 – low teacher competence
• Evidence
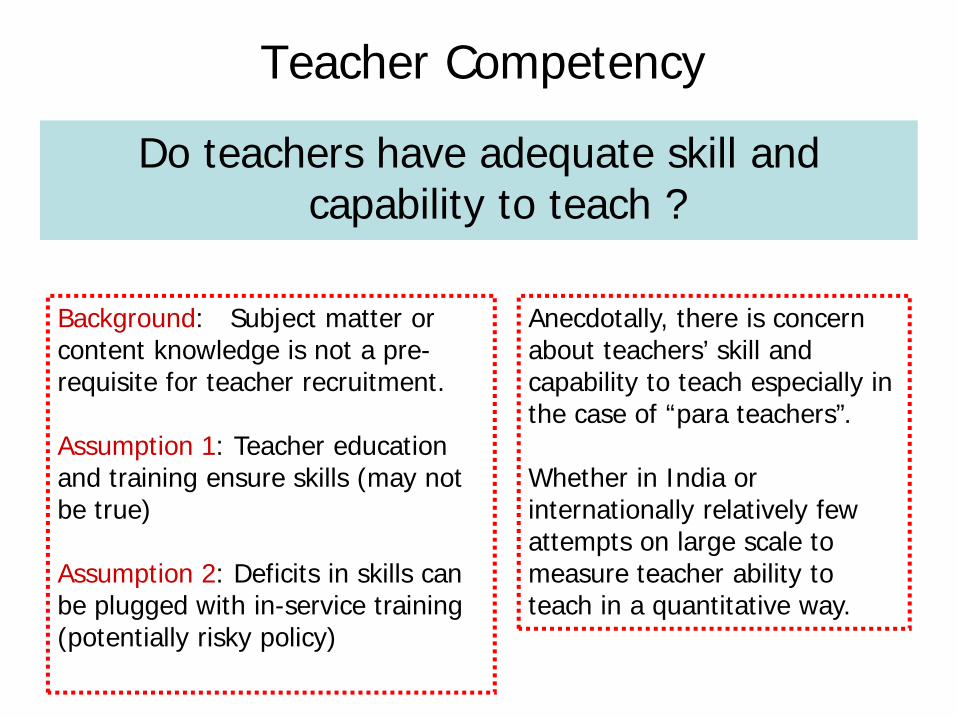
Teacher Competency
Do teachers have adequate skill and capability to teach ?
Background: Subject matter or content knowledge is not a pre-requisite for teacher recruitment.
Assumption 1: Teacher education and training ensure skills (may not be true)
Assumption 2: Deficits in skills can be plugged with in-service training (potentially risky policy)
Anecdotally, there is concern about teachers’ skill and capability to teach especially in the case of “para teachers”.
Whether in India or internationally relatively few attempts on large scale to measure teacher ability to teach in a quantitative way.
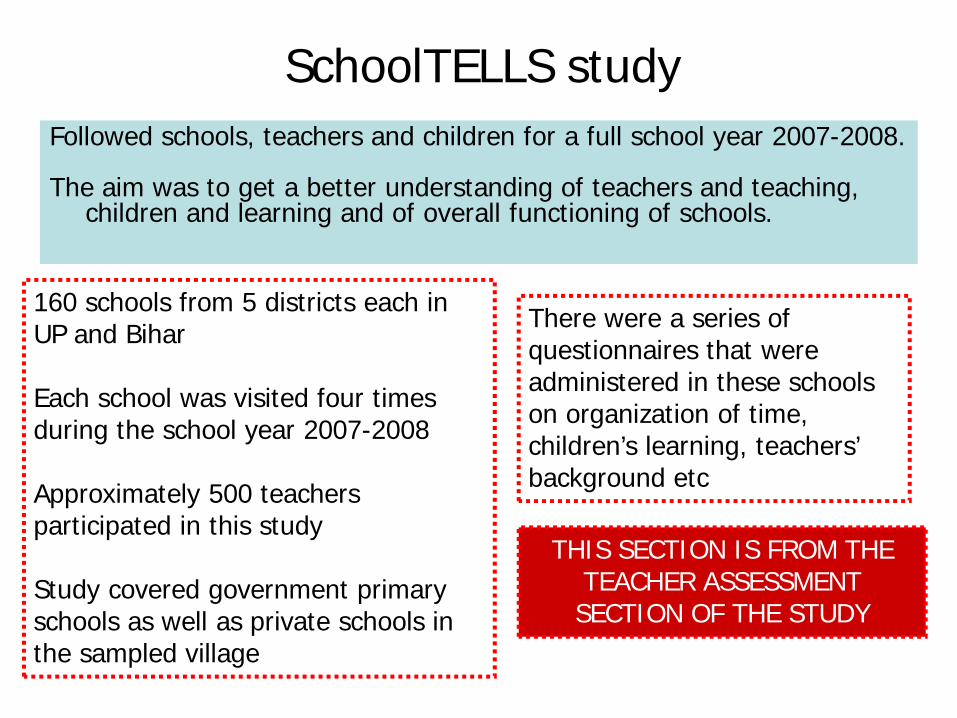
SchoolTELLS study Followed schools, teachers and children for a full school year 2007-2008.
The aim was to get a better understanding of teachers and teaching, children and learning and of overall functioning of schools.
160 schools from 5 districts each in UP and Bihar
Each school was visited four times during the school year 2007-2008
Approximately 500 teachers participated in this study
Study covered government primary schools as well as private schools in the sampled village
There were a series of questionnaires that were administered in these schools on organization of time, children’s learning, teachers’ background etc
THIS SECTION IS FROM THE TEACHER ASSESSMENT SECTION OF THE STUDY
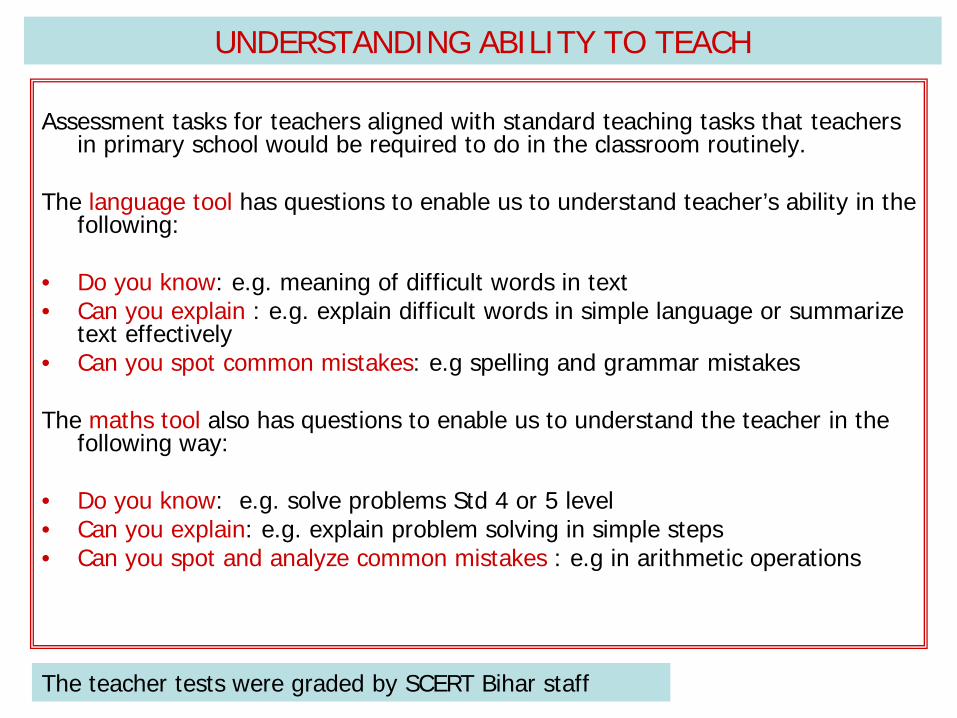
UNDERSTANDING ABILITY TO TEACH
Assessment tasks for teachers aligned with standard teaching tasks that teachers in primary school would be required to do in the classroom routinely.
The language tool has questions to enable us to understand teacher’s ability in the following:
• Do you know: e.g. meaning of difficult words in text • Can you explain : e.g. explain difficult words in simple language or summarize
text effectively• Can you spot common mistakes: e.g spelling and grammar mistakes
The maths tool also has questions to enable us to understand the teacher in the following way:
• Do you know: e.g. solve problems Std 4 or 5 level • Can you explain: e.g. explain problem solving in simple steps • Can you spot and analyze common mistakes : e.g in arithmetic operations
The teacher tests were graded by SCERT Bihar staff
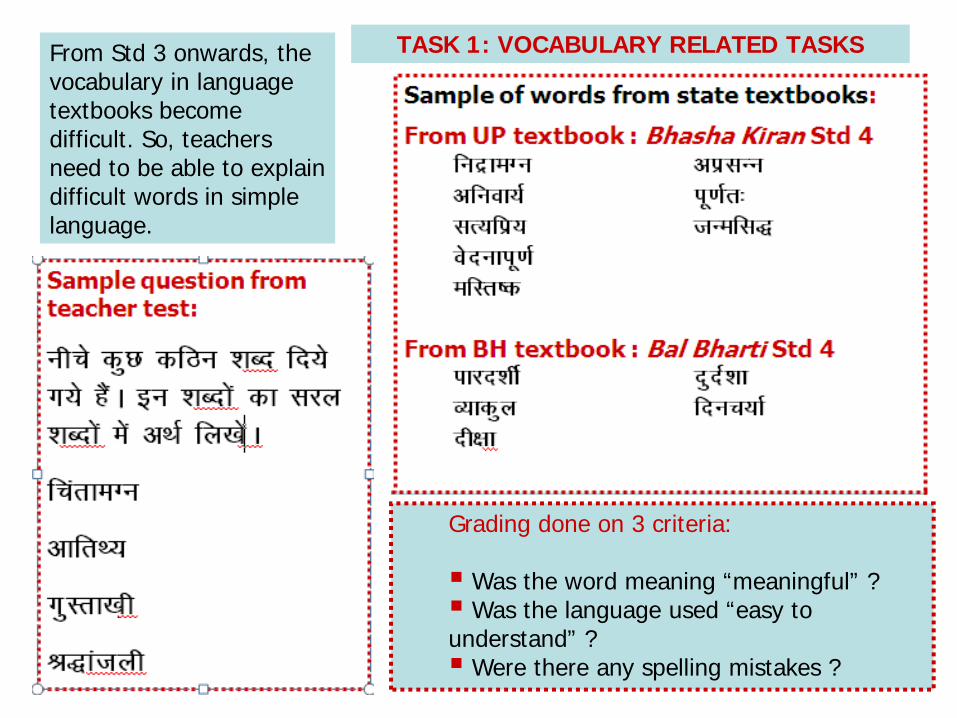
TASK 1: VOCABULARY RELATED TASKS
Grading done on 3 criteria:
Was the word meaning “meaningful” ?Was the language used “easy to
understand” ?Were there any spelling mistakes ?
From Std 3 onwards, the vocabulary in language textbooks become difficult. So, teachers need to be able to explain difficult words in simple language.
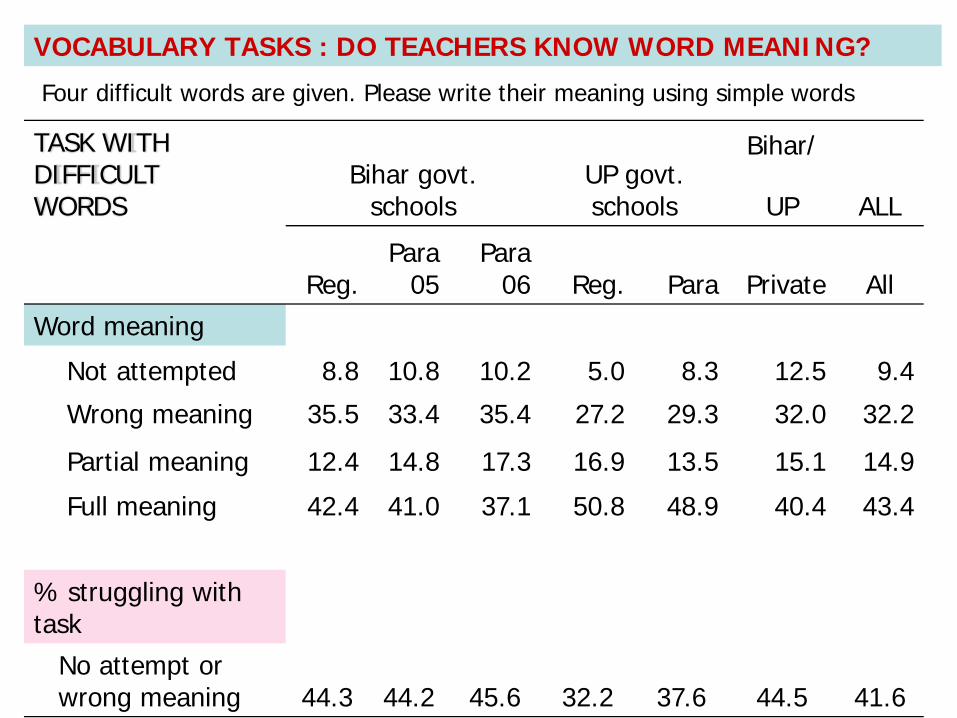
TASK WITH DIFFICULT WORDS
Bihar govt. schools
UP govt. schools
Bihar/
ALLUP
Reg.Para
05Para
06 Reg. Para Private AllWord meaning
Not attempted 8.8 10.8 10.2 5.0 8.3 12.5 9.4
Wrong meaning 35.5 33.4 35.4 27.2 29.3 32.0 32.2
Partial meaning 12.4 14.8 17.3 16.9 13.5 15.1 14.9
Full meaning 42.4 41.0 37.1 50.8 48.9 40.4 43.4
% struggling with task
No attempt or wrong meaning 44.3 44.2 45.6 32.2 37.6 44.5 41.6
Four difficult words are given. Please write their meaning using simple words
VOCABULARY TASKS : DO TEACHERS KNOW WORD MEANING?
TASK WITH
DIFFICULT WORDSBihar govt.
schoolsUP govt. schools
Bihar/
ALLUP
Reg.Para
05Para
06 Reg. Para Private All
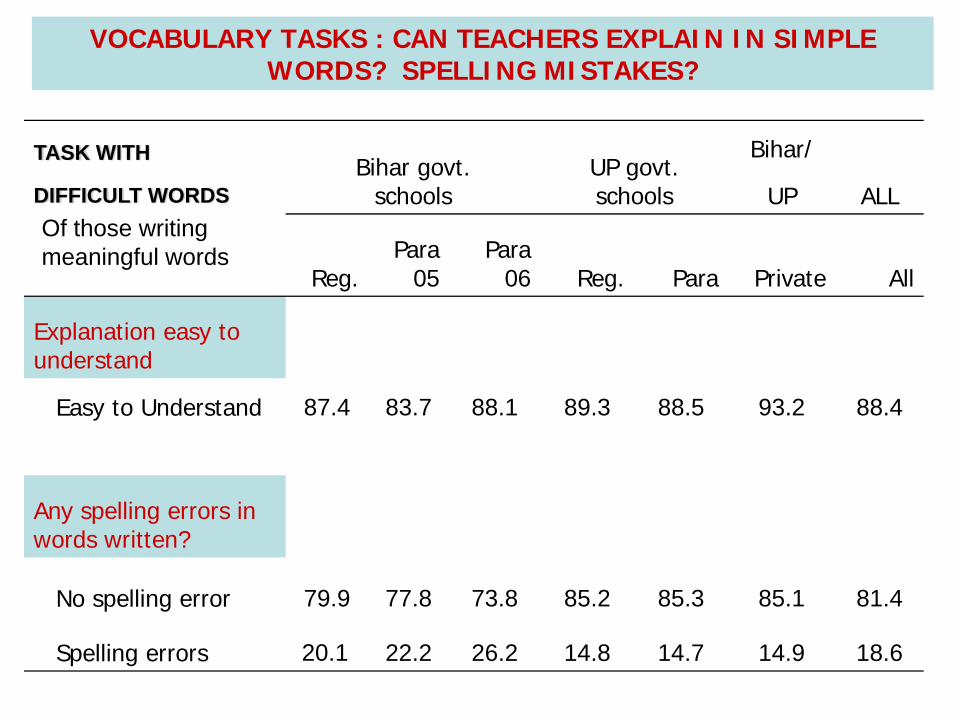
Explanation easy to understand
Easy to Understand 87.4 83.7 88.1 89.3 88.5 93.2 88.4
Any spelling errors in words written?
No spelling error 79.9 77.8 73.8 85.2 85.3 85.1 81.4
Spelling errors 20.1 22.2 26.2 14.8 14.7 14.9 18.6
VOCABULARY TASKS : CAN TEACHERS EXPLAIN IN SIMPLE WORDS? SPELLING MISTAKES?
Of those writing meaningful words
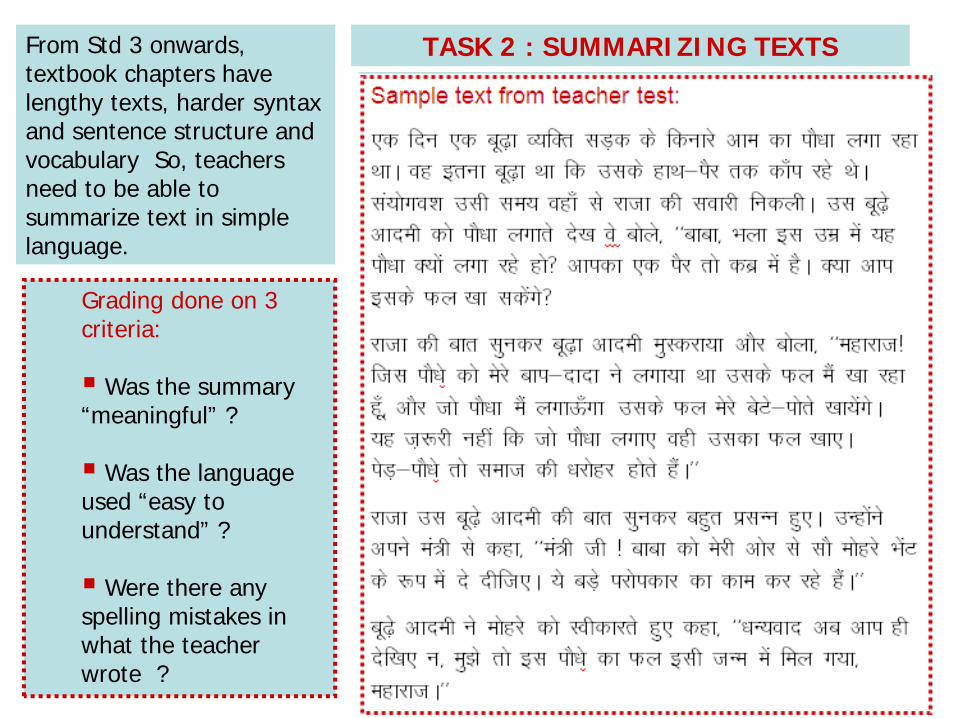
TASK 2 : SUMMARIZING TEXTS
Grading done on 3 criteria:
Was the summary “meaningful” ?
Was the language used “easy to understand” ?
Were there any spelling mistakes in what the teacher wrote ?
From Std 3 onwards, textbook chapters have lengthy texts, harder syntax and sentence structure and vocabulary So, teachers need to be able to summarize text in simple language.
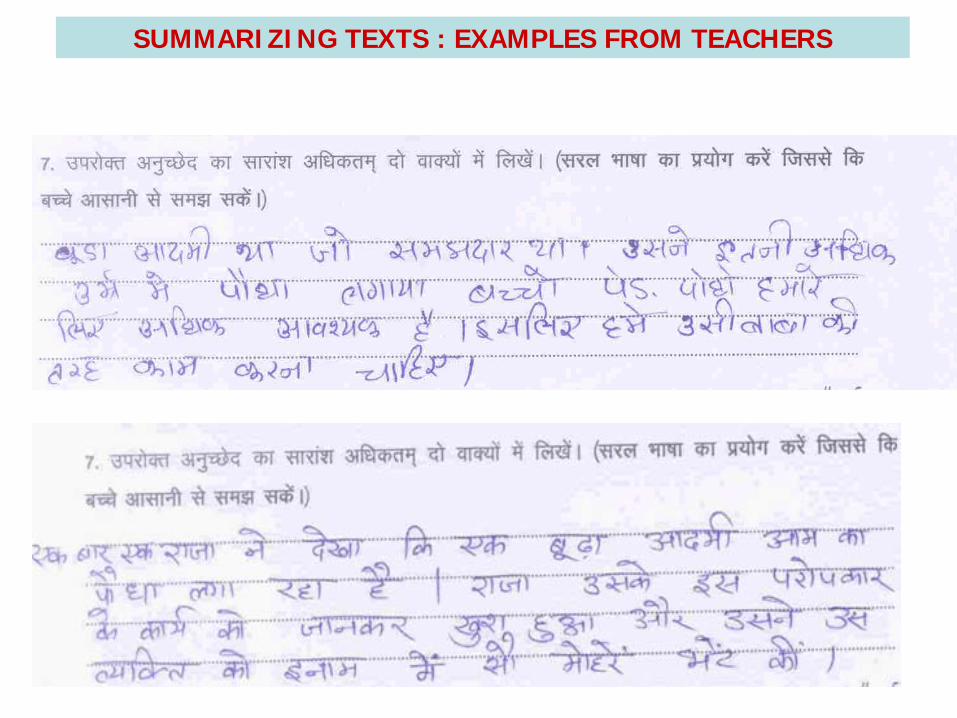
SUMMARIZING TEXTS : EXAMPLES FROM TEACHERS
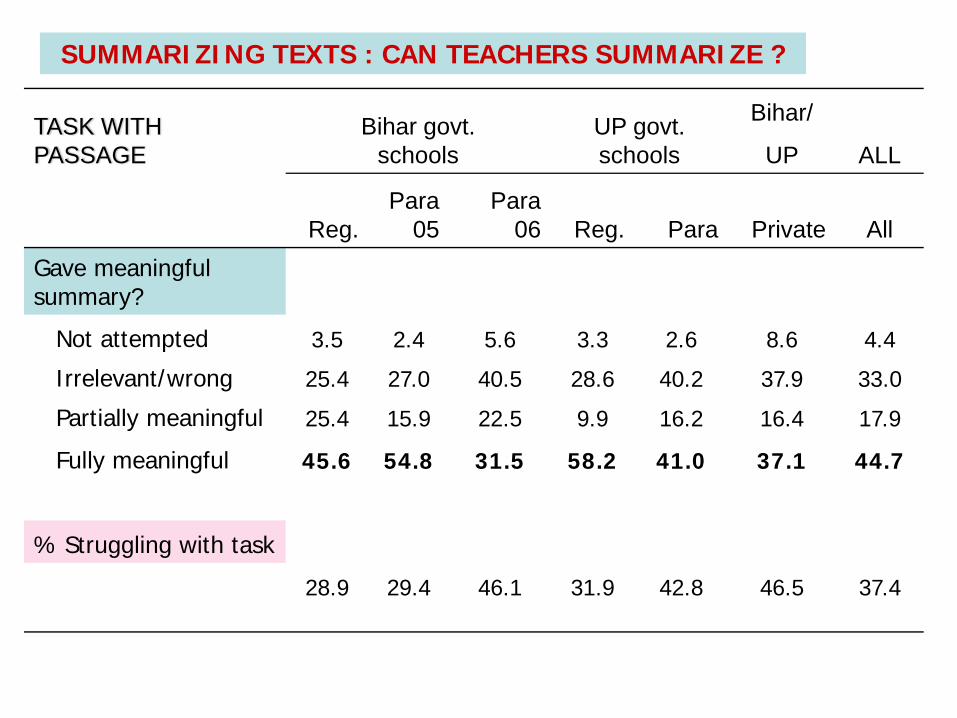
TASK WITH PASSAGE
Bihar govt. schools
UP govt. schools
Bihar/
ALLUP
Reg.Para
05Para
06 Reg. Para Private AllGave meaningful summary?
Not attempted 3.5 2.4 5.6 3.3 2.6 8.6 4.4
Irrelevant/wrong 25.4 27.0 40.5 28.6 40.2 37.9 33.0
Partially meaningful 25.4 15.9 22.5 9.9 16.2 16.4 17.9
Fully meaningful 45.6 54.8 31.5 58.2 41.0 37.1 44.7
% Struggling with task
28.9 29.4 46.1 31.9 42.8 46.5 37.4
SUMMARIZING TEXTS : CAN TEACHERS SUMMARIZE ?
TASK WITH PASSAGE
Bihar govt. schools
UP govt. schools
Bihar/
ALLUP
Reg.Para
05Para
06 Reg. Para Private All
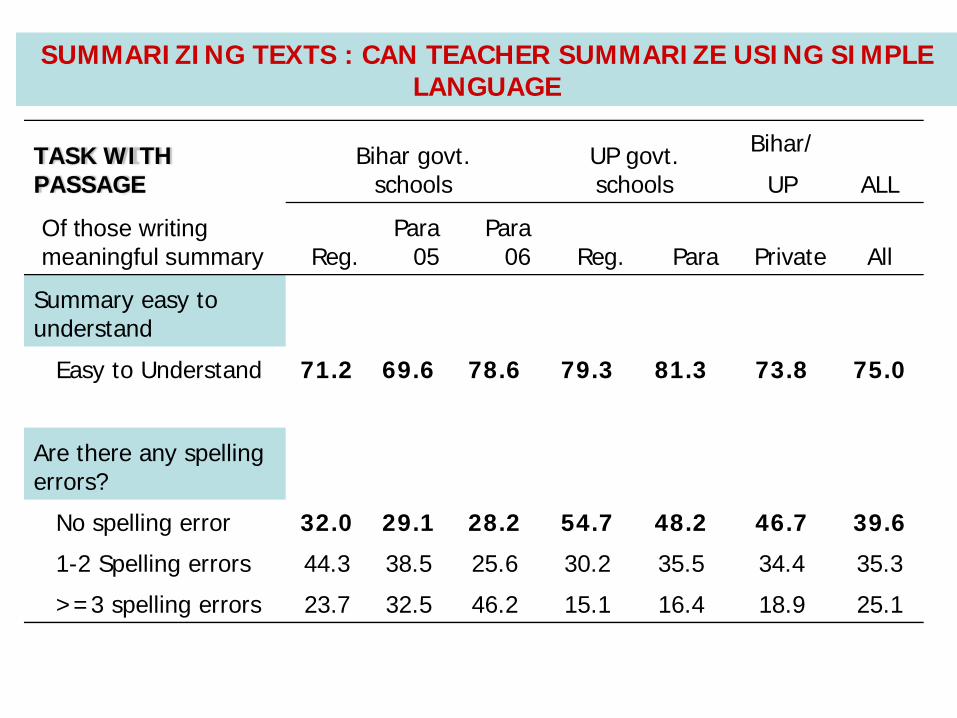
Summary easy to understand
Easy to Understand 71.2 69.6 78.6 79.3 81.3 73.8 75.0
Are there any spelling errors?
No spelling error 32.0 29.1 28.2 54.7 48.2 46.7 39.6
1-2 Spelling errors 44.3 38.5 25.6 30.2 35.5 34.4 35.3
>=3 spelling errors 23.7 32.5 46.2 15.1 16.4 18.9 25.1
SUMMARIZING TEXTS : CAN TEACHER SUMMARIZE USING SIMPLE LANGUAGE
Of those writing meaningful summary
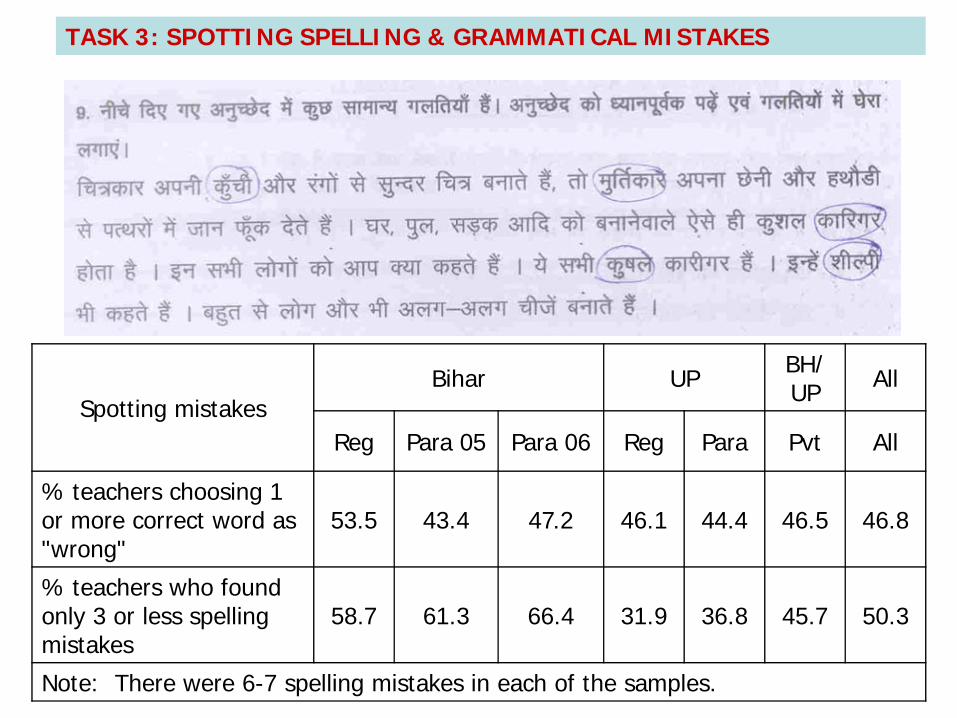
TASK 3: SPOTTING SPELLING & GRAMMATICAL MISTAKES
Spotting mistakes Bihar UP BH/
UP All
Reg Para 05 Para 06 Reg Para Pvt All
% teachers choosing 1 or more correct word as "wrong"
53.5 43.4 47.2 46.1 44.4 46.5 46.8
% teachers who found only 3 or less spelling mistakes
58.7 61.3 66.4 31.9 36.8 45.7 50.3
Note: There were 6-7 spelling mistakes in each of the samples.
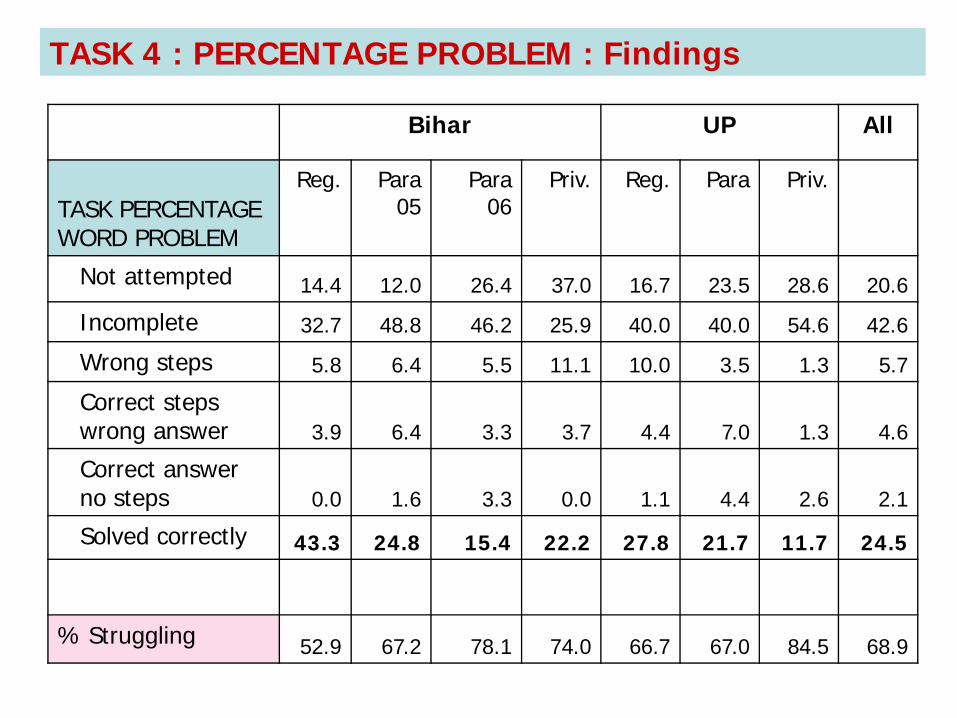
Bihar UP All
TASK PERCENTAGE WORD PROBLEM
Reg. Para05
Para 06
Priv. Reg. Para Priv.
Not attempted 14.4 12.0 26.4 37.0 16.7 23.5 28.6 20.6
Incomplete 32.7 48.8 46.2 25.9 40.0 40.0 54.6 42.6
Wrong steps 5.8 6.4 5.5 11.1 10.0 3.5 1.3 5.7
Correct steps wrong answer 3.9 6.4 3.3 3.7 4.4 7.0 1.3 4.6
Correct answer no steps 0.0 1.6 3.3 0.0 1.1 4.4 2.6 2.1
Solved correctly 43.3 24.8 15.4 22.2 27.8 21.7 11.7 24.5
% Struggling 52.9 67.2 78.1 74.0 66.7 67.0 84.5 68.9
TASK 4 : PERCENTAGE PROBLEM : Findings
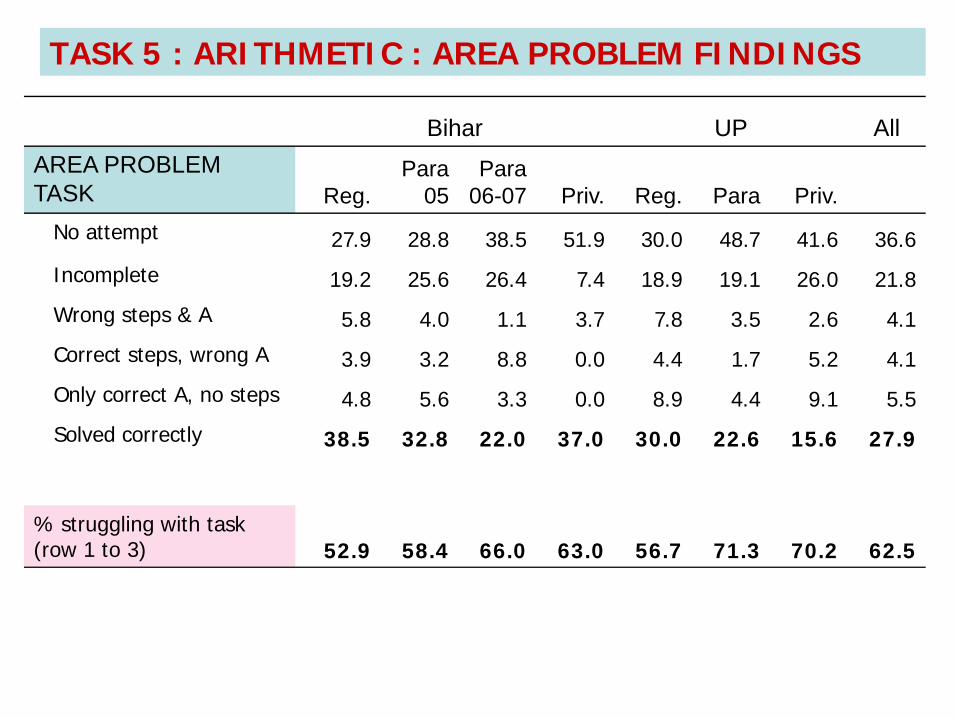
Bihar UP AllAREA PROBLEMTASK Reg.
Para05
Para06-07 Priv. Reg. Para Priv.
No attempt 27.9 28.8 38.5 51.9 30.0 48.7 41.6 36.6
Incomplete 19.2 25.6 26.4 7.4 18.9 19.1 26.0 21.8
Wrong steps & A 5.8 4.0 1.1 3.7 7.8 3.5 2.6 4.1
Correct steps, wrong A 3.9 3.2 8.8 0.0 4.4 1.7 5.2 4.1
Only correct A, no steps 4.8 5.6 3.3 0.0 8.9 4.4 9.1 5.5
Solved correctly 38.5 32.8 22.0 37.0 30.0 22.6 15.6 27.9
% struggling with task(row 1 to 3) 52.9 58.4 66.0 63.0 56.7 71.3 70.2 62.5
TASK 5 : ARITHMETIC : AREA PROBLEM FINDINGS
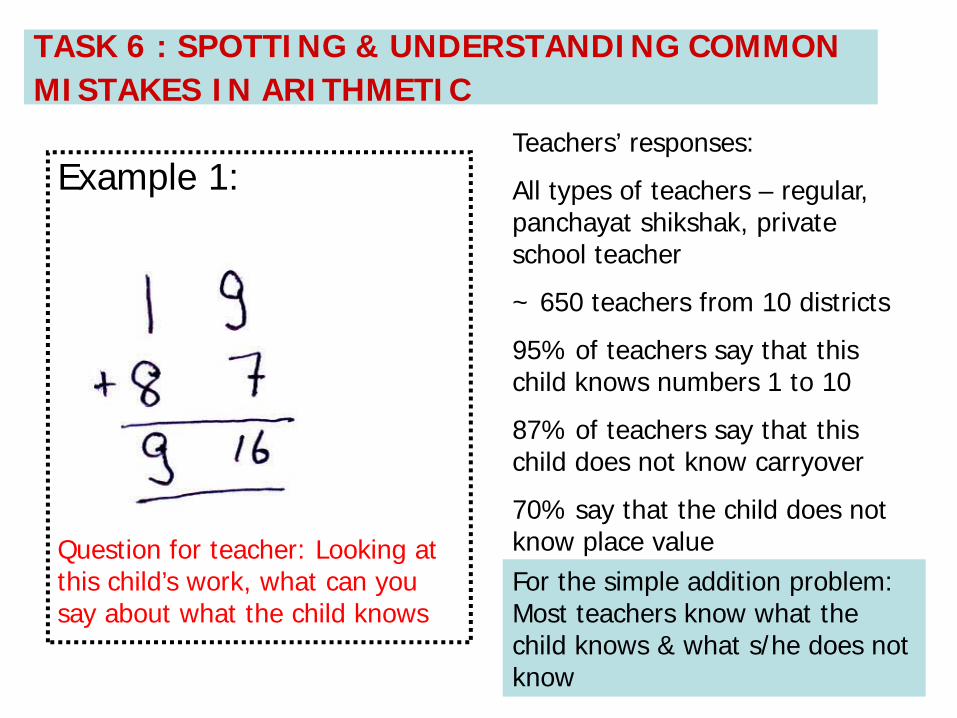
TASK 6 : SPOTTING & UNDERSTANDING COMMON MISTAKES IN ARITHMETIC
Example 1: Teachers’ responses:
All types of teachers – regular, panchayat shikshak, private school teacher
~ 650 teachers from 10 districts
95% of teachers say that this child knows numbers 1 to 10
87% of teachers say that this child does not know carryover
70% say that the child does not know place value For the simple addition problem: Most teachers know what the child knows & what s/he does not know
Question for teacher: Looking at this child’s work, what can you say about what the child knows
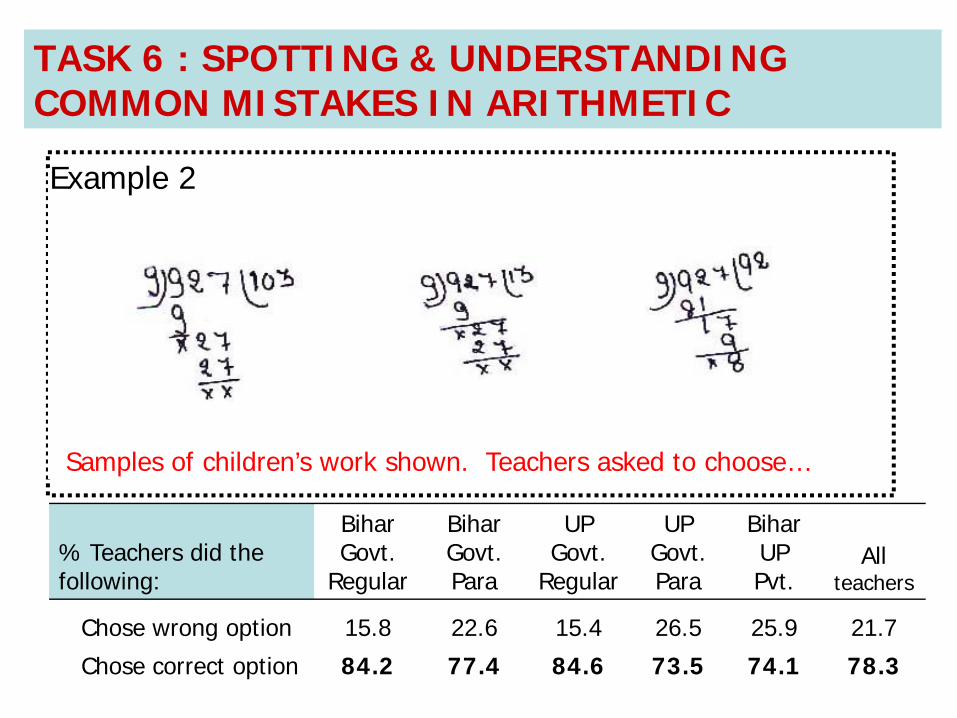
TASK 6 : SPOTTING & UNDERSTANDING COMMON MISTAKES IN ARITHMETIC
Samples of children’s work shown. Teachers asked to choose…
Example 2
% Teachers did the following:
Bihar Govt.
Regular
Bihar Govt. Para
UP Govt.
Regular
UP Govt. Para
Bihar UP Pvt.
All teachers
Chose wrong option 15.8 22.6 15.4 26.5 25.9 21.7
Chose correct option 84.2 77.4 84.6 73.5 74.1 78.3
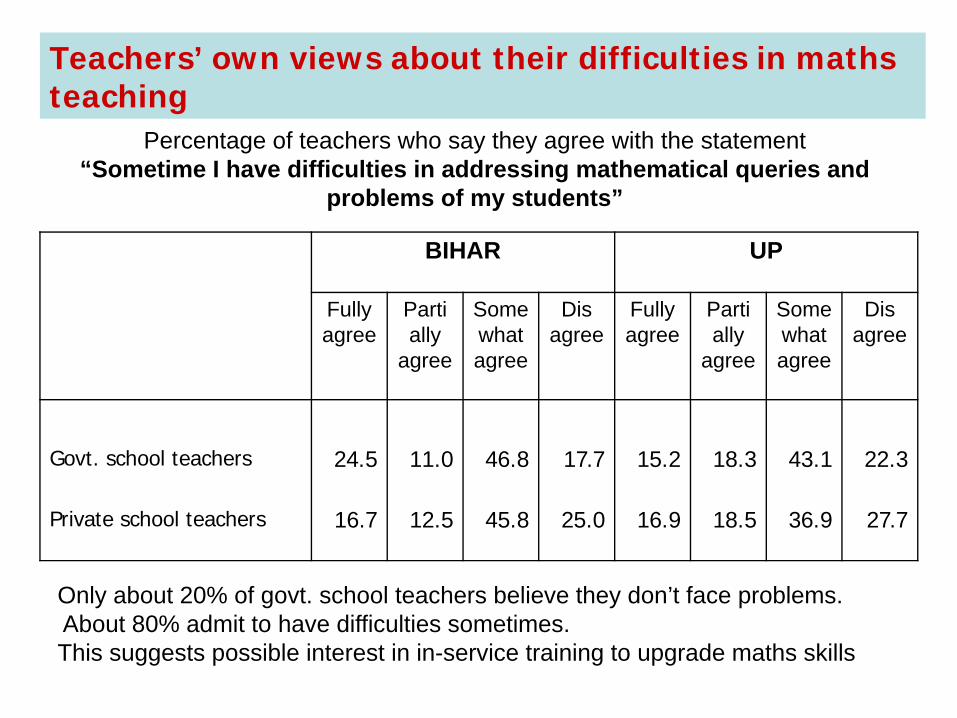
BIHAR UP
Fully agree
Parti ally
agree
Somewhat agree
Dis agree
Fully agree
Parti ally
agree
Somewhat agree
Dis agree
Govt. school teachers 24.5 11.0 46.8 17.7 15.2 18.3 43.1 22.3
Private school teachers 16.7 12.5 45.8 25.0 16.9 18.5 36.9 27.7
Percentage of teachers who say they agree with the statement“Sometime I have difficulties in addressing mathematical queries and
problems of my students”
Teachers’ own views about their difficulties in maths teaching
Only about 20% of govt. school teachers believe they don’t face problems.About 80% admit to have difficulties sometimes. This suggests possible interest in in-service training to upgrade maths skills
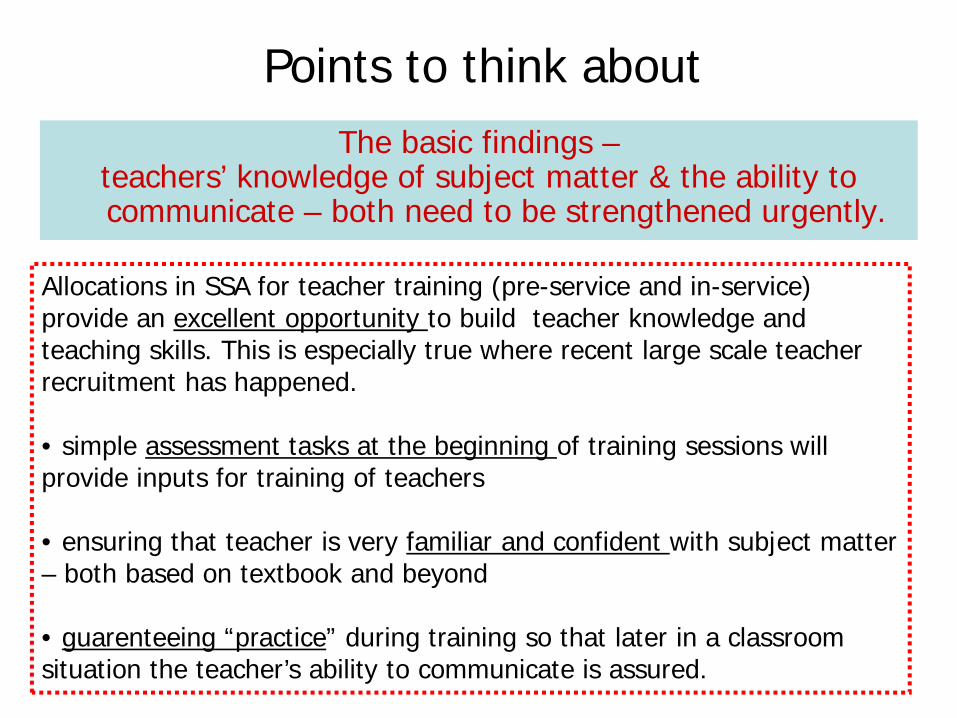
Points to think about The basic findings –
teachers’ knowledge of subject matter & the ability to communicate – both need to be strengthened urgently.
Allocations in SSA for teacher training (pre-service and in-service) provide an excellent opportunity to build teacher knowledge and teaching skills. This is especially true where recent large scale teacher recruitment has happened.
• simple assessment tasks at the beginning of training sessions will provide inputs for training of teachers
• ensuring that teacher is very familiar and confident with subject matter – both based on textbook and beyond
• guarenteeing “practice” during training so that later in a classroom situation the teacher’s ability to communicate is assured.
Diagnosis 3 – low teacher effort
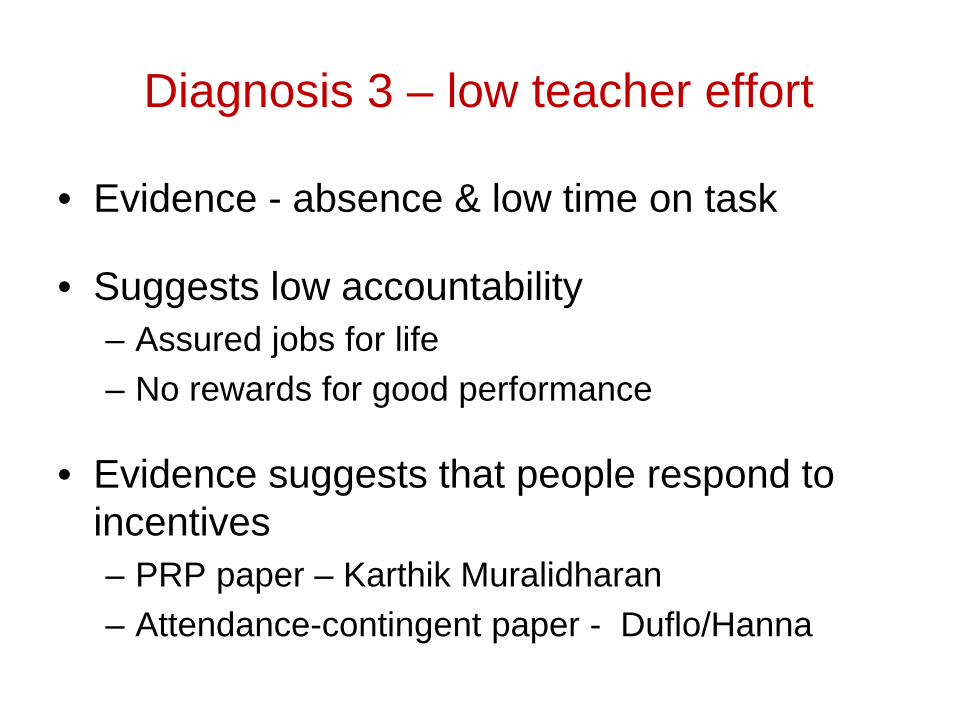
Diagnosis 3 – low teacher effort
• Evidence - absence & low time on task
• Suggests low accountability– Assured jobs for life– No rewards for good performance
• Evidence suggests that people respond to incentives– PRP paper – Karthik Muralidharan– Attendance-contingent paper - Duflo/Hanna
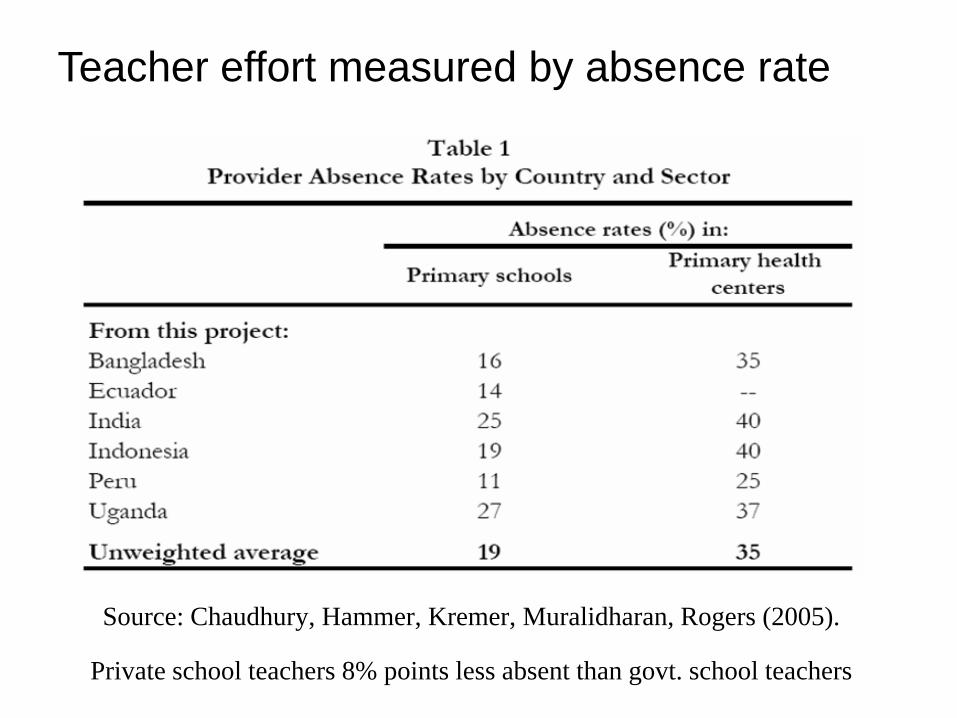
Source: Chaudhury, Hammer, Kremer, Muralidharan, Rogers (2005).
Private school teachers 8% points less absent than govt. school teachers
Teacher effort measured by absence rate
Obstacles to increasing school accountability
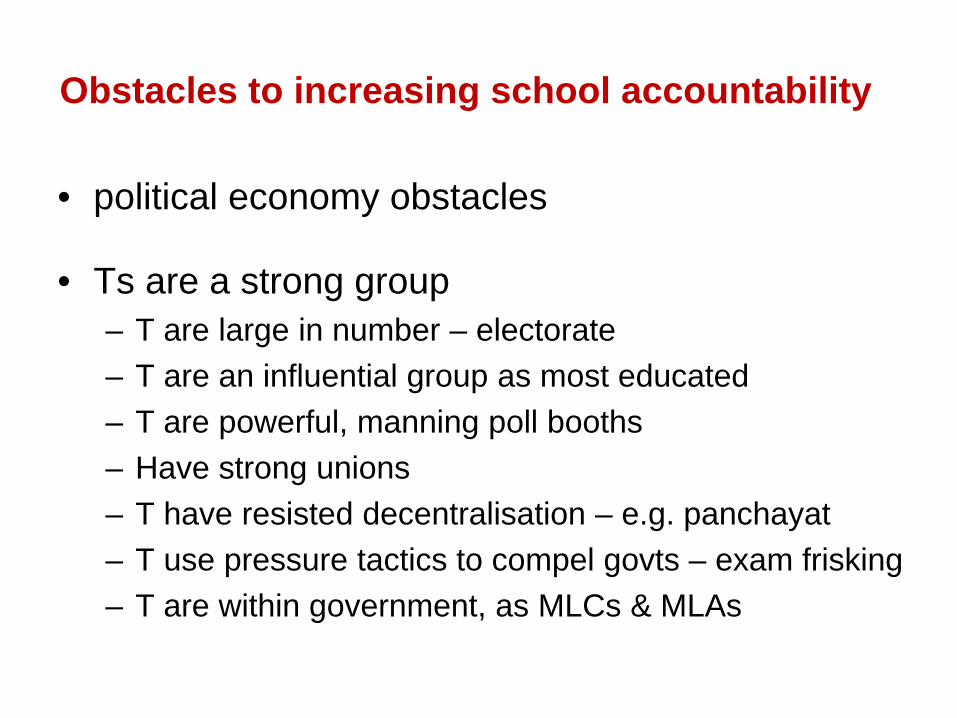
Obstacles to increasing school accountability
• political economy obstacles
• Ts are a strong group– T are large in number – electorate– T are an influential group as most educated– T are powerful, manning poll booths– Have strong unions– T have resisted decentralisation – e.g. panchayat– T use pressure tactics to compel govts – exam frisking– T are within government, as MLCs & MLAs
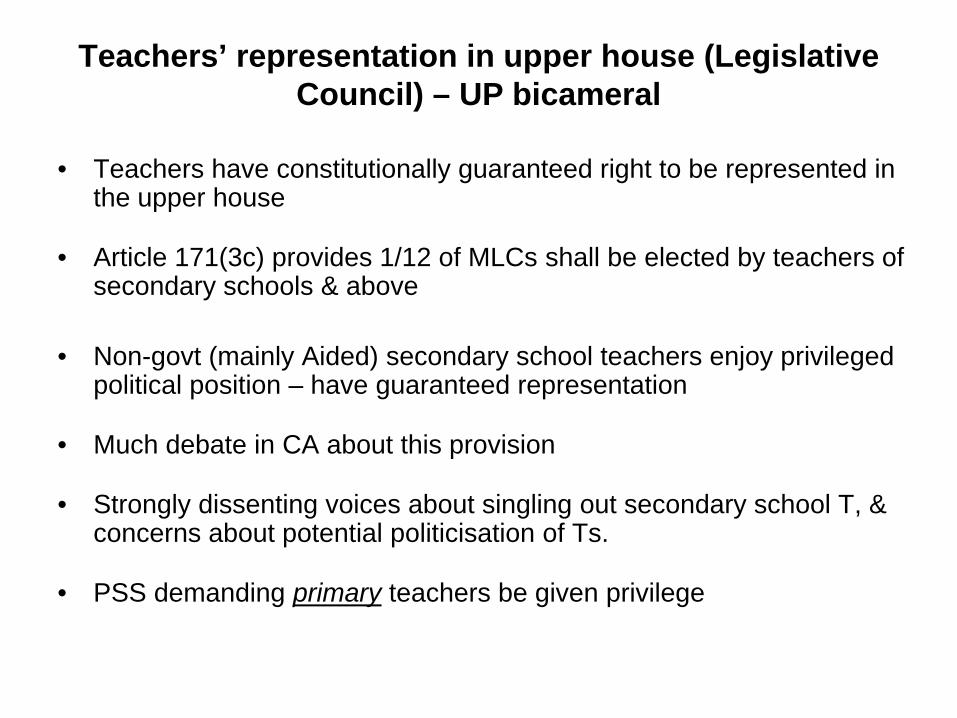
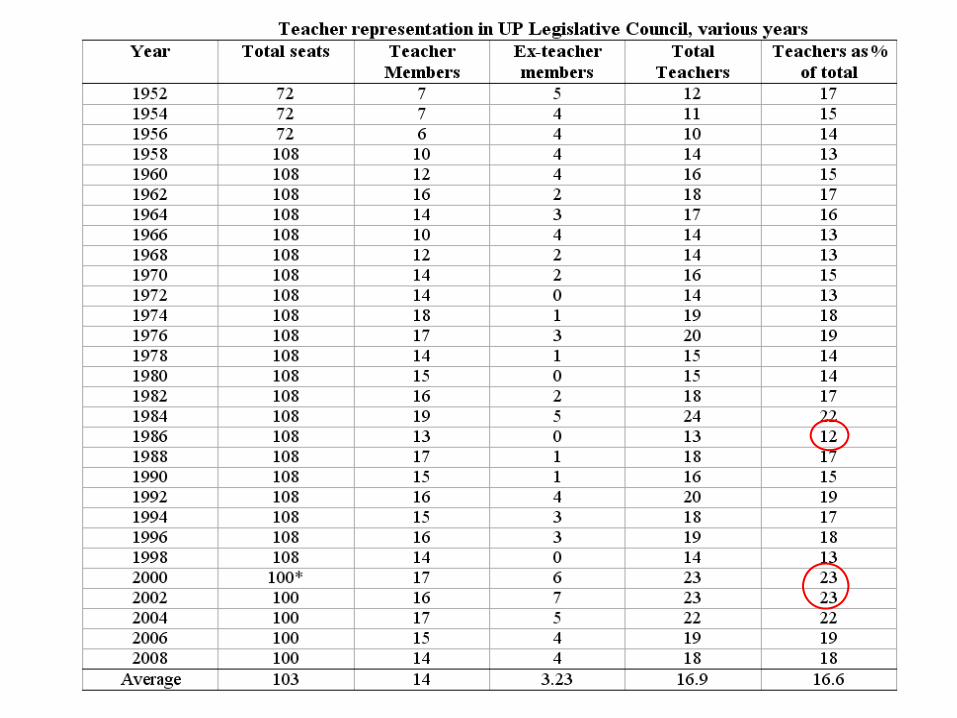
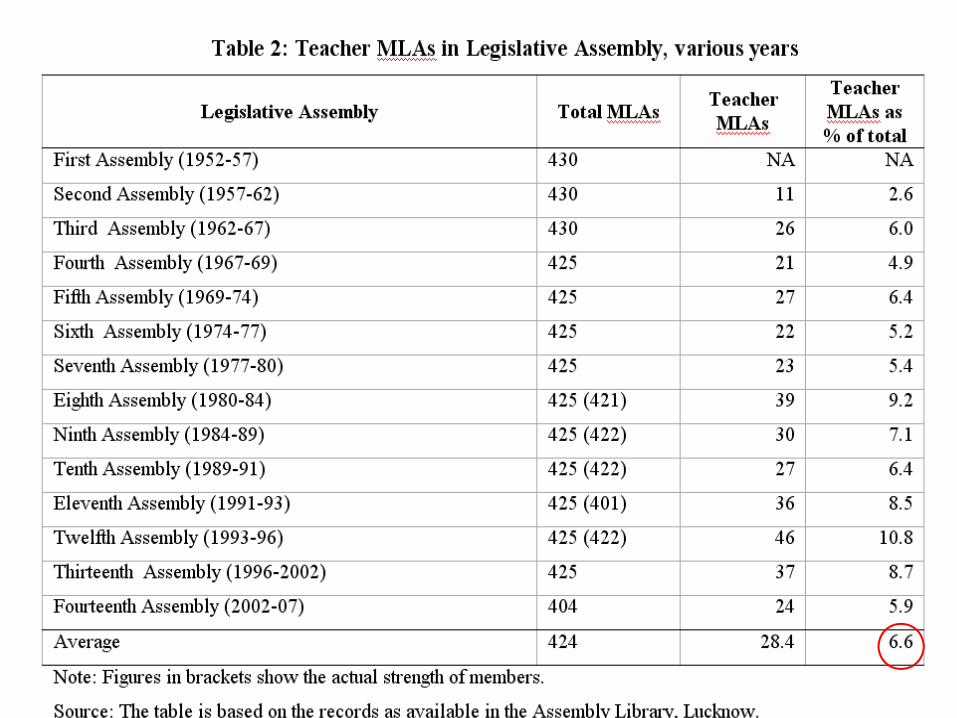
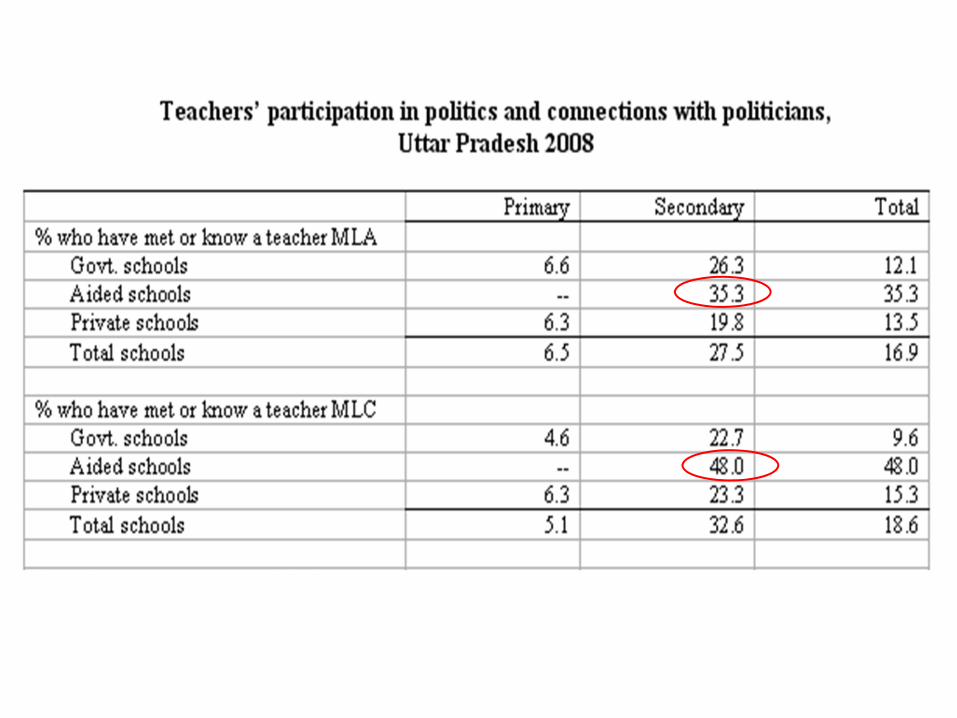
Teachers’ representation in upper house (Legislative Council) – UP bicameral
• Teachers have constitutionally guaranteed right to be represented in the upper house
• Article 171(3c) provides 1/12 of MLCs shall be elected by teachers of secondary schools & above
• Non-govt (mainly Aided) secondary school teachers enjoy privileged political position – have guaranteed representation
• Much debate in CA about this provision
• Strongly dissenting voices about singling out secondary school T, & concerns about potential politicisation of Ts.
• PSS demanding primary teachers be given privilege
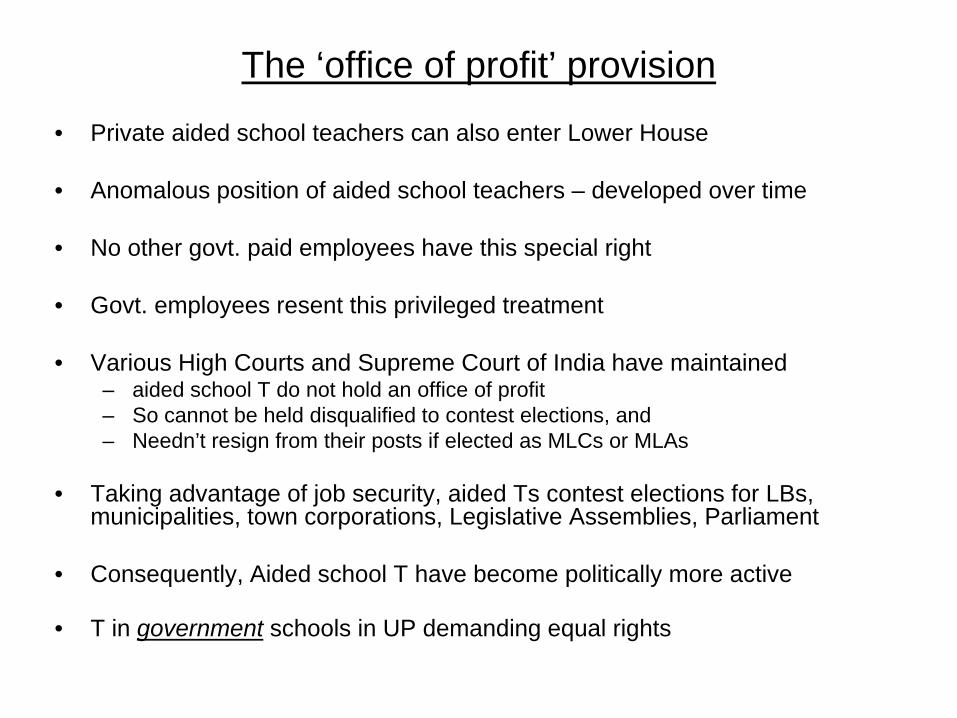
The ‘office of profit’ provision
• Private aided school teachers can also enter Lower House
• Anomalous position of aided school teachers – developed over time
• No other govt. paid employees have this special right
• Govt. employees resent this privileged treatment
• Various High Courts and Supreme Court of India have maintained – aided school T do not hold an office of profit– So cannot be held disqualified to contest elections, and – Needn’t resign from their posts if elected as MLCs or MLAs
• Taking advantage of job security, aided Ts contest elections for LBs, municipalities, town corporations, Legislative Assemblies, Parliament
• Consequently, Aided school T have become politically more active
• T in government schools in UP demanding equal rights

Attempts to abolish guaranteed representation of teachers
• The Chief Election Commissioner of India in 1965 suggested the abolition of teacher constituencies, on the grounds that ‘apart from there being no justification for singling out the teaching profession for special treatment, it seems to me undesirable that teachers should be dragged into party politics in this manner.’
• Matter also considered by Central Government on 7 occasions between 1957 and 1979; no change in status quo
• In early 1990s, Central Advisory Board on Education (CABE) also sought states’ views. Based on these, the CABE committee report stated: “the nature and extent of politicisation of teachers through involvement in elections in the context of the constitutional provision for their representation in Legislative Councils came up for discussion in various aspects. An apprehension was expressed that extending voting rights to elementary (school) teachers would further aggravate the situation. The sufferers would be the children in particular and the elementary education system in general. Such a situation would not be in accordance with the spirit of the provisions of the Constitution…..The Committee, therefore, is of the opinion that there is no need to retain the present provision of separate constituency for teachers in Legislative Councils” (CABE, 1992).
• Its recommendations never carried out
• Special status of teachers continues as is
Implications
• Guaranteed representation has led to substantial political penetration in both upper and lower house
Why teachers maintain such high levels of contact with teacher MLCs / MLAs ?
• Reason – Teacher MLCs / MLAs are effective in helping teachers:– Transfers– Dispute resolution– Cases of suspension– Getting ministerial appointments
• This is the logic why teacher candidates for MLA are supported by teachers, and once in office they help teachers, even though elected from general constituency
• However, still teacher MLCs greater help than MLAs
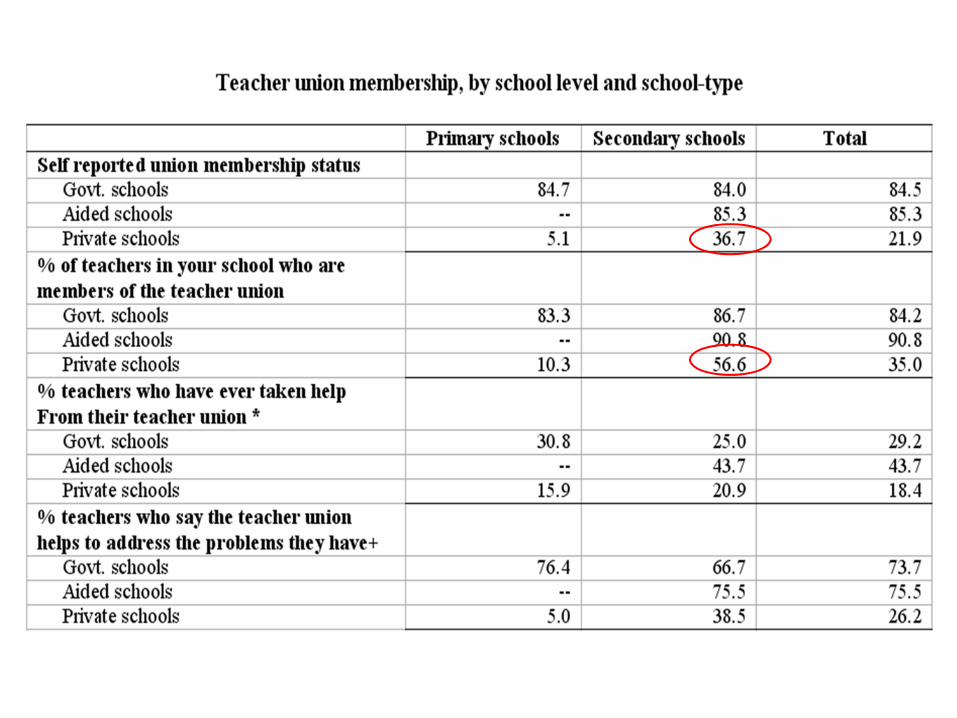
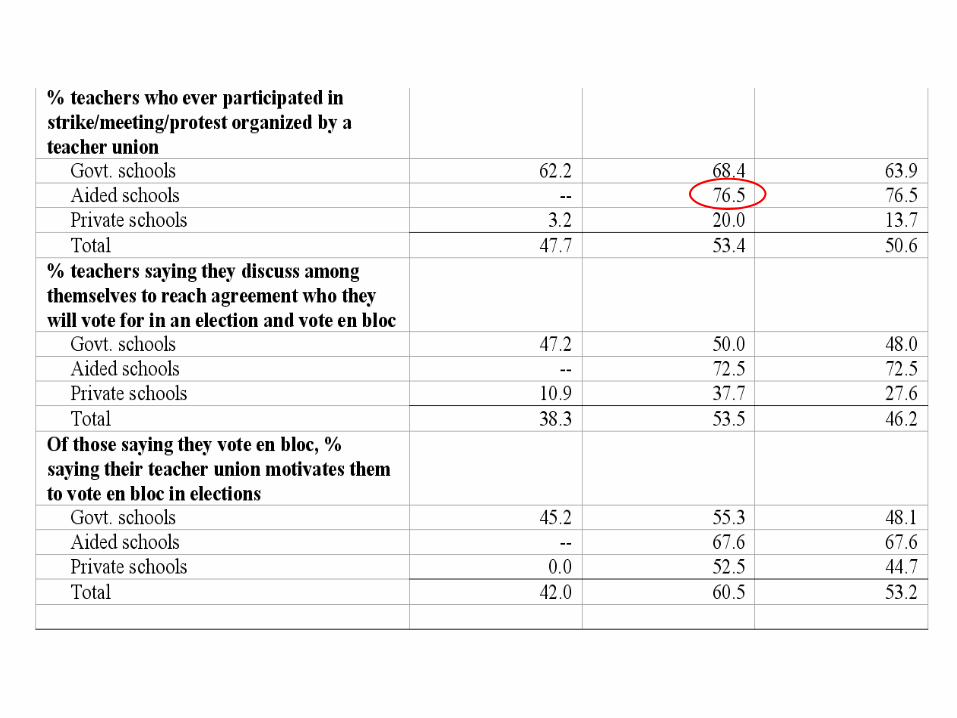
Teacher Unions
• Teacher unions key stakeholders shaping school governance environment
• Different TUs for different teacher groups• RSS for govt. secondary school teachers• PSS for govt. primary school teachers• MSS for aided sec. school teachers• VSS for private school teachers
• Influence of unions gauged • Partly by % paid up members, active, take union help, voting• Partly by success with which unions have lobbied
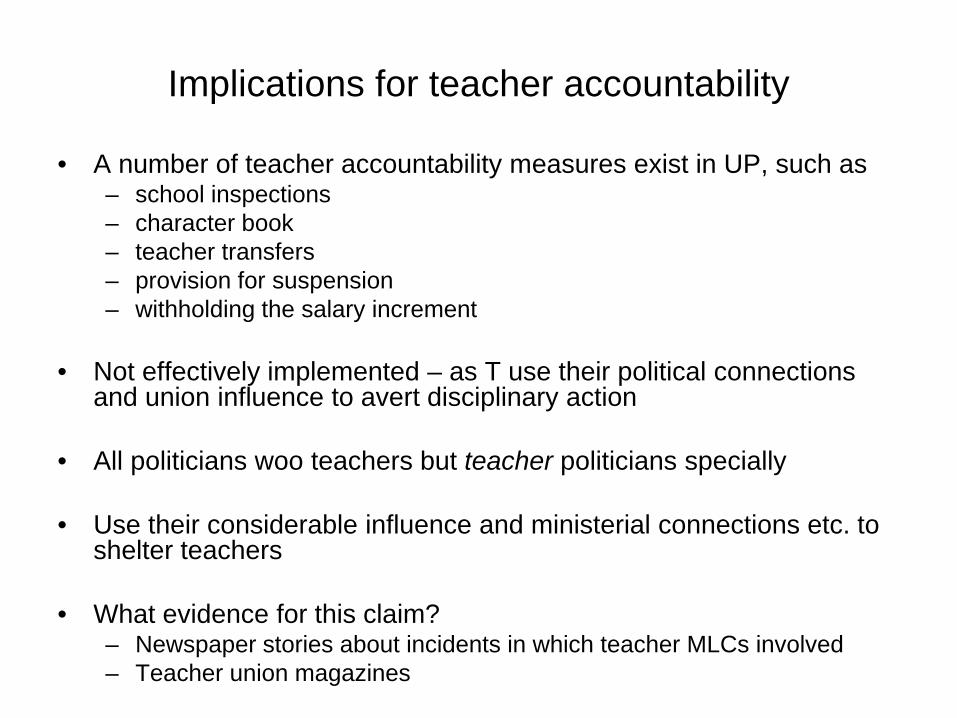
Implications for teacher accountability
• A number of teacher accountability measures exist in UP, such as – school inspections – character book– teacher transfers– provision for suspension– withholding the salary increment
• Not effectively implemented – as T use their political connections and union influence to avert disciplinary action
• All politicians woo teachers but teacher politicians specially
• Use their considerable influence and ministerial connections etc. to shelter teachers
• What evidence for this claim? – Newspaper stories about incidents in which teacher MLCs involved– Teacher union magazines
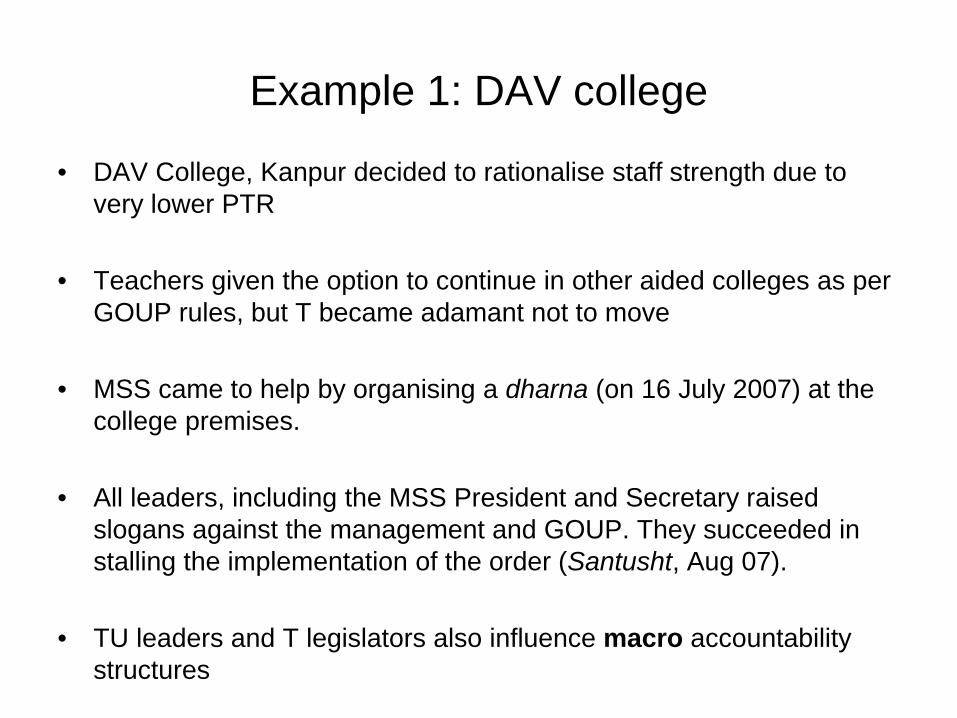
Example 1: DAV college
• DAV College, Kanpur decided to rationalise staff strength due to very lower PTR
• Teachers given the option to continue in other aided colleges as per GOUP rules, but T became adamant not to move
• MSS came to help by organising a dharna (on 16 July 2007) at the college premises.
• All leaders, including the MSS President and Secretary raised slogans against the management and GOUP. They succeeded in stalling the implementation of the order (Santusht, Aug 07).
• TU leaders and T legislators also influence macro accountability structures
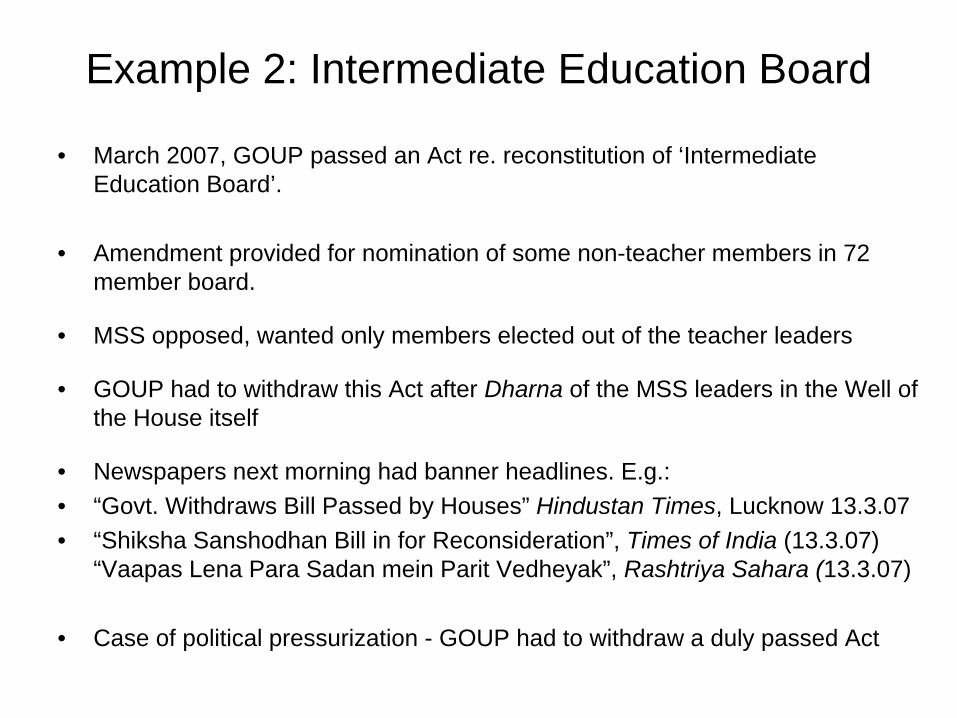
Example 2: Intermediate Education Board
• March 2007, GOUP passed an Act re. reconstitution of ‘Intermediate Education Board’.
• Amendment provided for nomination of some non-teacher members in 72 member board.
• MSS opposed, wanted only members elected out of the teacher leaders
• GOUP had to withdraw this Act after Dharna of the MSS leaders in the Well of the House itself
• Newspapers next morning had banner headlines. E.g.:• “Govt. Withdraws Bill Passed by Houses” Hindustan Times, Lucknow 13.3.07 • “Shiksha Sanshodhan Bill in for Reconsideration”, Times of India (13.3.07)
“Vaapas Lena Para Sadan mein Parit Vedheyak”, Rashtriya Sahara (13.3.07)
• Case of political pressurization - GOUP had to withdraw a duly passed Act
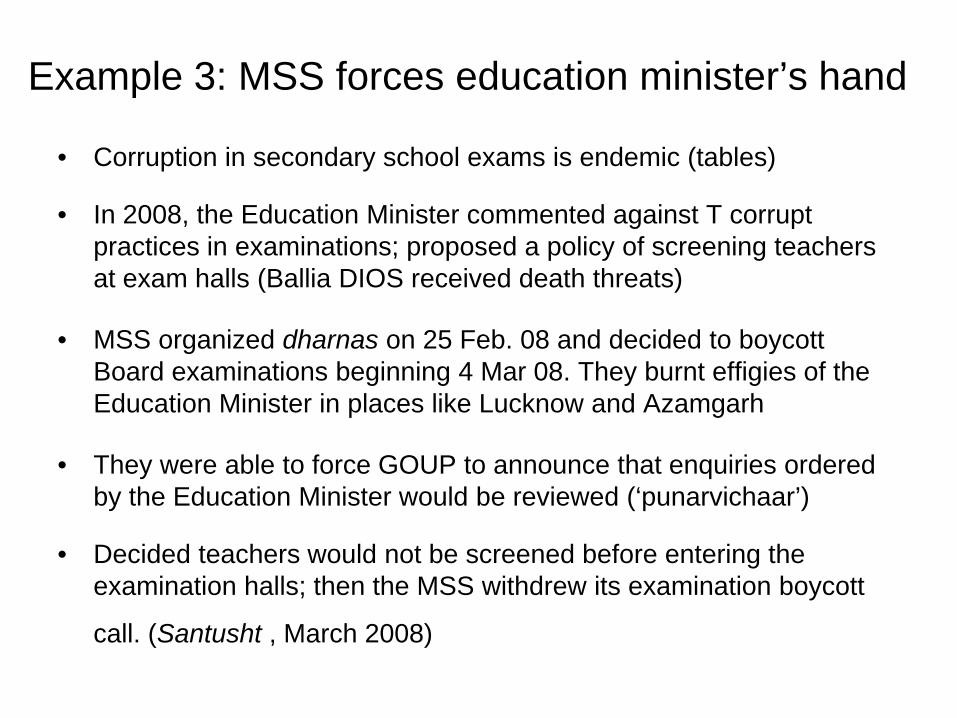
Example 3: MSS forces education minister’s hand
• Corruption in secondary school exams is endemic (tables)
• In 2008, the Education Minister commented against T corrupt practices in examinations; proposed a policy of screening teachers at exam halls (Ballia DIOS received death threats)
• MSS organized dharnas on 25 Feb. 08 and decided to boycott Board examinations beginning 4 Mar 08. They burnt effigies of the Education Minister in places like Lucknow and Azamgarh
• They were able to force GOUP to announce that enquiries ordered by the Education Minister would be reviewed (‘punarvichaar’)
• Decided teachers would not be screened before entering the examination halls; then the MSS withdrew its examination boycott
call. (Santusht , March 2008)
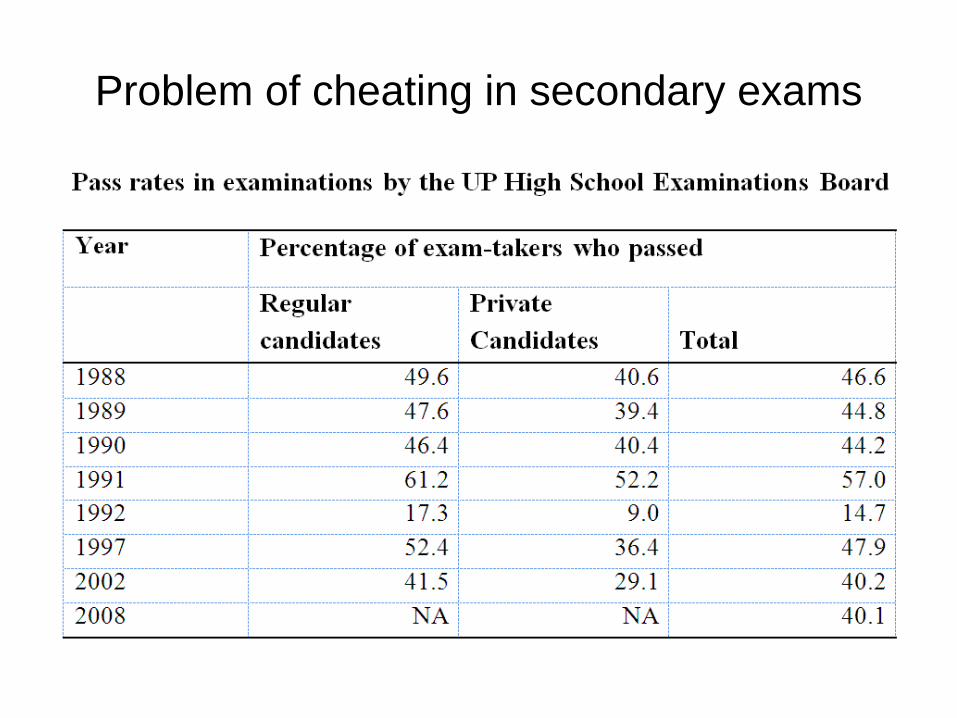
Problem of cheating in secondary exams
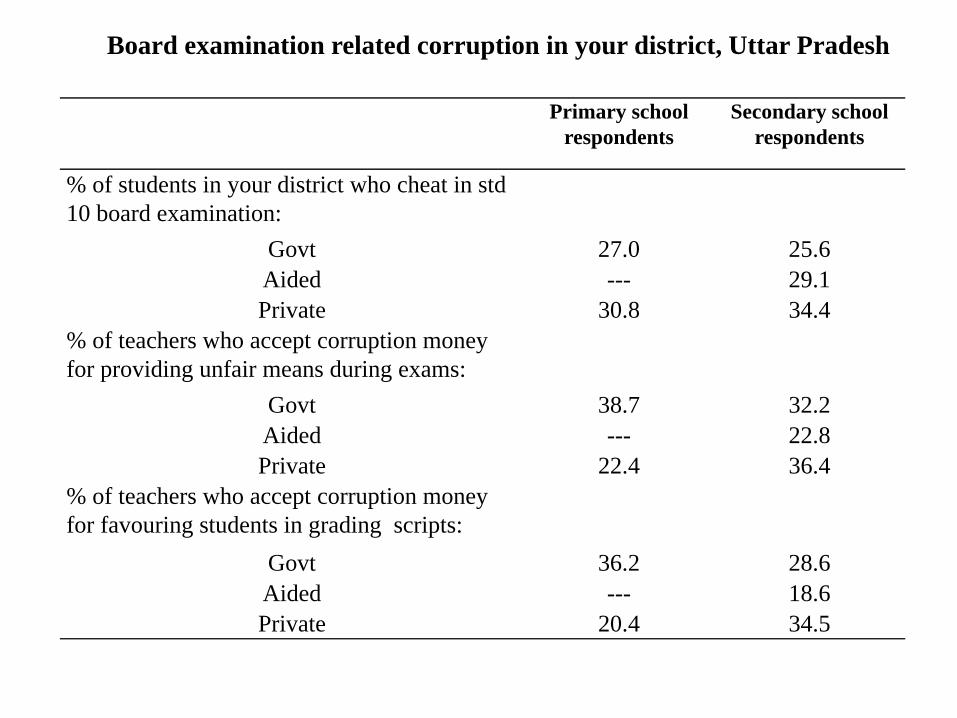
Primary school respondents
Secondary school respondents
% of students in your district who cheat in std 10 board examination:
Govt 27.0 25.6Aided --- 29.1Private 30.8 34.4
% of teachers who accept corruption money for providing unfair means during exams:
Govt 38.7 32.2Aided --- 22.8Private 22.4 36.4
% of teachers who accept corruption money for favouring students in grading scripts:
Govt 36.2 28.6Aided --- 18.6Private 20.4 34.5
Board examination related corruption in your district, Uttar Pradesh
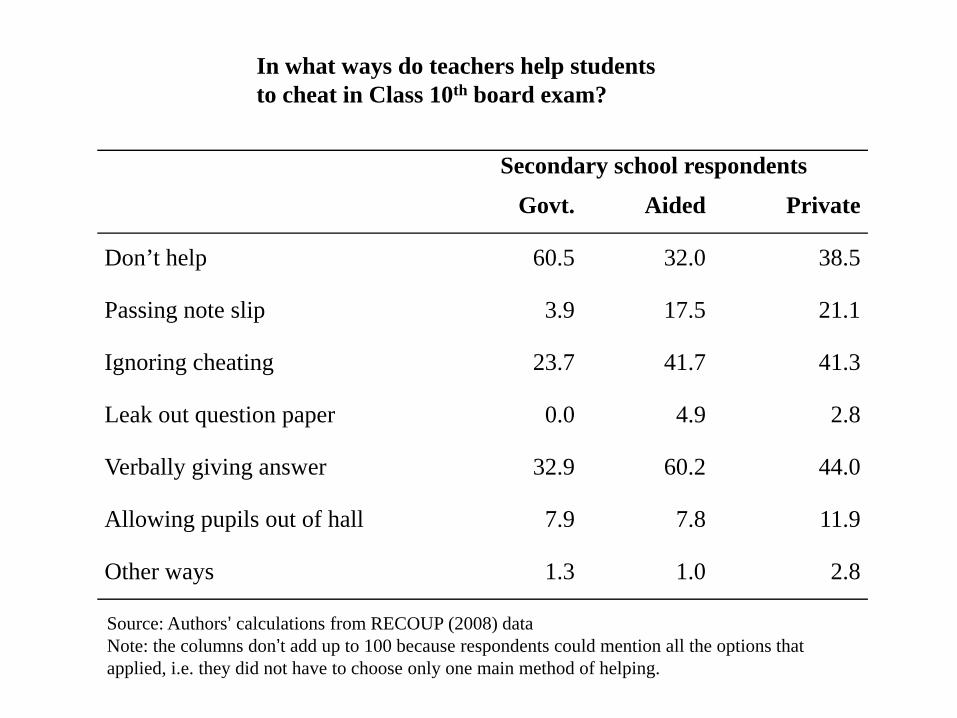
Secondary school respondents
Govt. Aided Private
Don’t help 60.5 32.0 38.5
Passing note slip 3.9 17.5 21.1
Ignoring cheating 23.7 41.7 41.3
Leak out question paper 0.0 4.9 2.8
Verbally giving answer 32.9 60.2 44.0
Allowing pupils out of hall 7.9 7.8 11.9
Other ways 1.3 1.0 2.8
In what ways do teachers help students to cheat in Class 10th board exam?
Source: Authors’ calculations from RECOUP (2008) dataNote: the columns don’t add up to 100 because respondents could mention all the options that applied, i.e. they did not have to choose only one main method of helping.
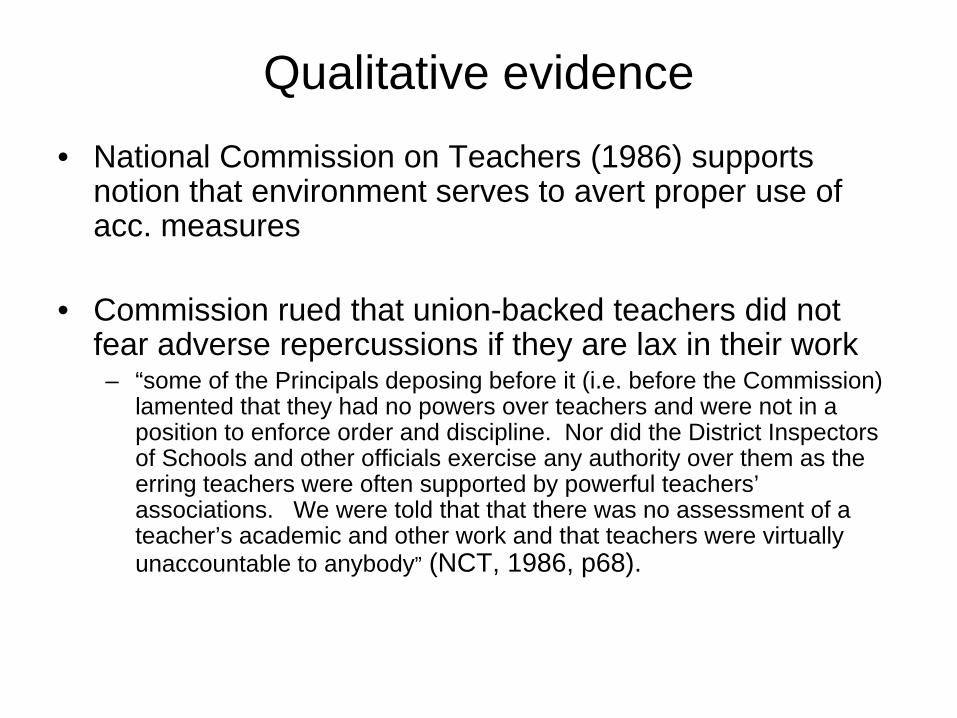
Qualitative evidence• National Commission on Teachers (1986) supports
notion that environment serves to avert proper use of acc. measures
• Commission rued that union-backed teachers did not fear adverse repercussions if they are lax in their work – “some of the Principals deposing before it (i.e. before the Commission)
lamented that they had no powers over teachers and were not in a position to enforce order and discipline. Nor did the District Inspectors of Schools and other officials exercise any authority over them as the erring teachers were often supported by powerful teachers’ associations. We were told that that there was no assessment of a teacher’s academic and other work and that teachers were virtually unaccountable to anybody” (NCT, 1986, p68).
Teacher union stances (and influence) on decentralising reform proposals
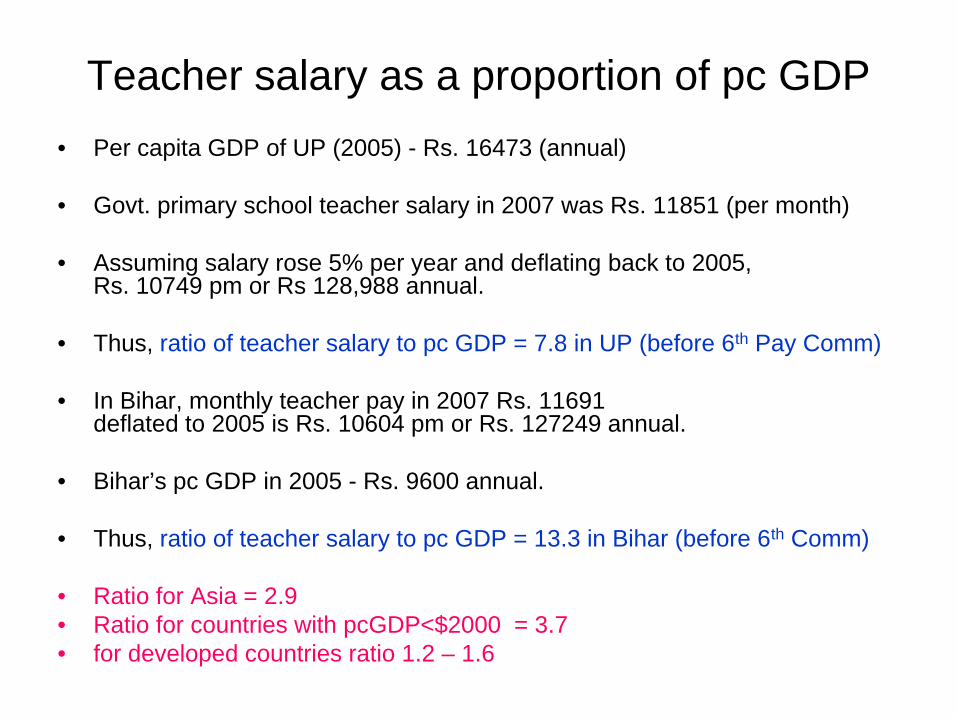
Teacher salary as a proportion of pc GDP• Per capita GDP of UP (2005) - Rs. 16473 (annual)
• Govt. primary school teacher salary in 2007 was Rs. 11851 (per month)
• Assuming salary rose 5% per year and deflating back to 2005, Rs. 10749 pm or Rs 128,988 annual.
• Thus, ratio of teacher salary to pc GDP = 7.8 in UP (before 6th Pay Comm)
• In Bihar, monthly teacher pay in 2007 Rs. 11691 deflated to 2005 is Rs. 10604 pm or Rs. 127249 annual.
• Bihar’s pc GDP in 2005 - Rs. 9600 annual.
• Thus, ratio of teacher salary to pc GDP = 13.3 in Bihar (before 6th Comm)
• Ratio for Asia = 2.9• Ratio for countries with pcGDP<$2000 = 3.7• for developed countries ratio 1.2 – 1.6
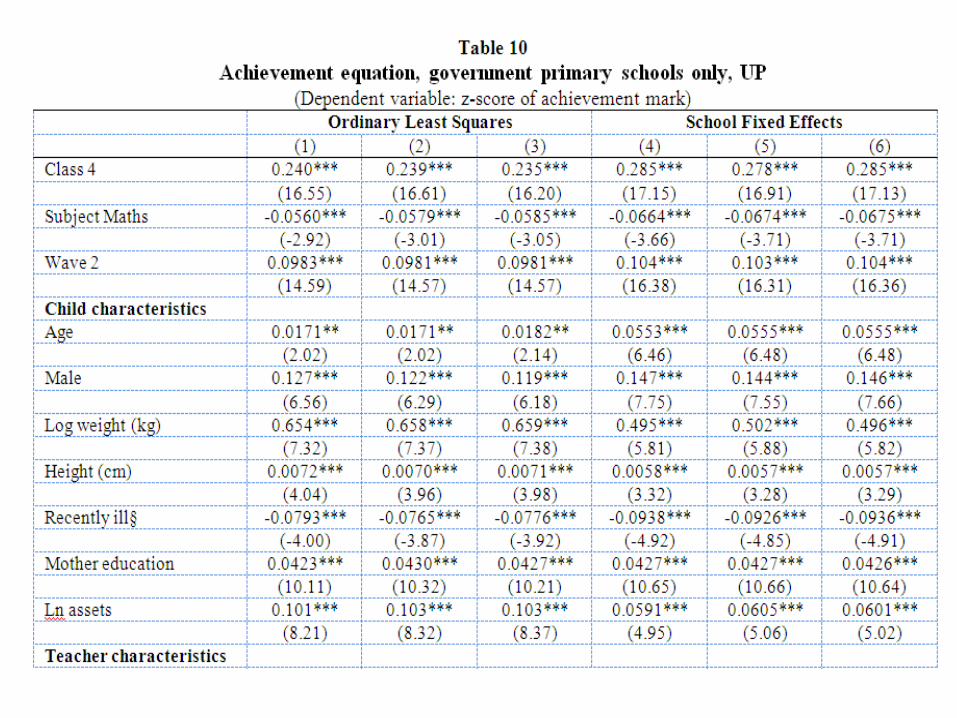
Effects on pupil learning outcomes
• Survey of teachers merged with SchoolTELLS survey –only for sample primary schools
• Tested students of grades 2 and 4
• Achievement levels in language and maths
• Converted into z-scores
• School FE estimator – reduces endogeneity bias
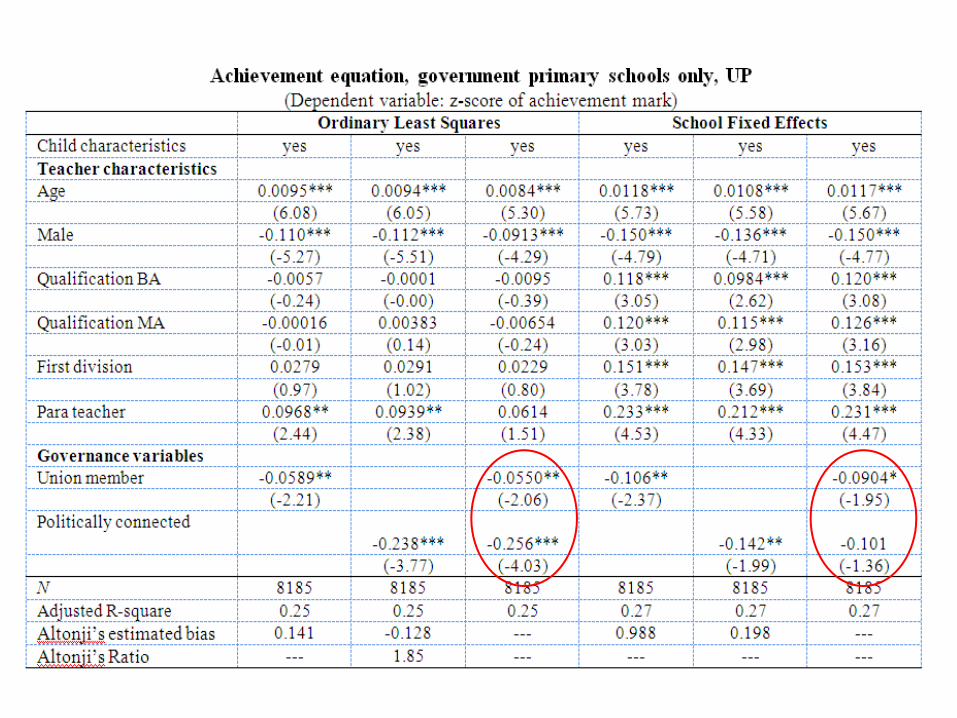
Why should TU and PC reduce learning?
• Do TU / PC reduce teacher effort?
• We have several measures of effort
• Regressed each of these on TU & PC – Controls for teacher characteristics– School FE estimator– Not necessarily causal
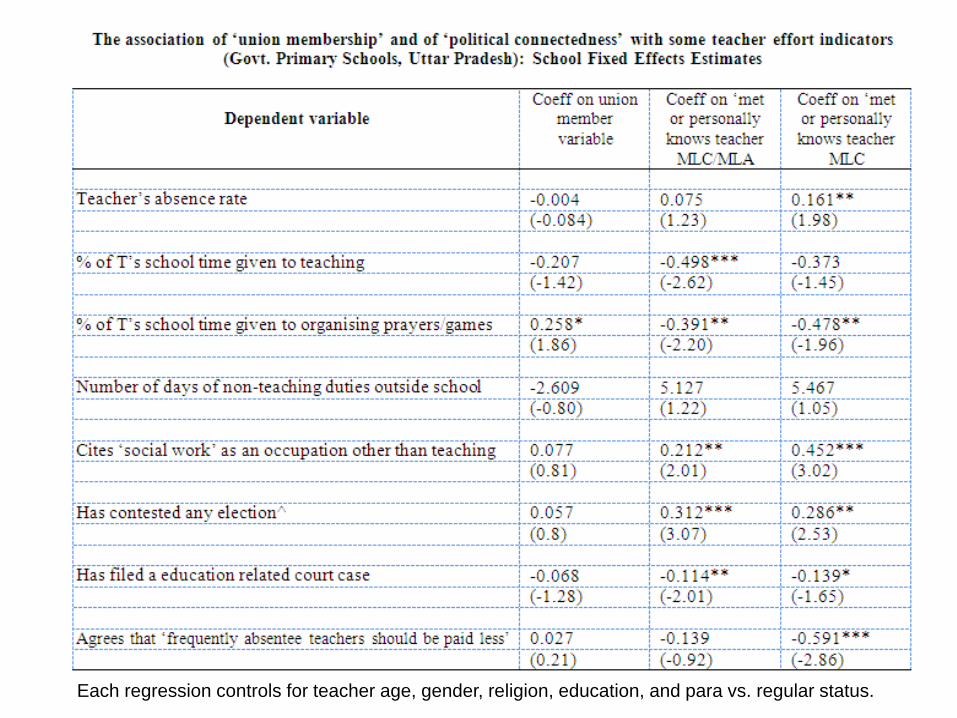
Each regression controls for teacher age, gender, religion, education, and para vs. regular status.
• Coeff on TU and PC could be biased by T unobs characteristics
• Moreover, relative small sample (n=235)
• Results are suggestive
Conclusions• Not the first time someone has looked at the role of T in
school governance
• National Commission on Teachers (1984-86)
• Tried to make a contribution
• Mustered evidence
Conclusions• T profoundly influenced school governance environment
• Influenced governance through their organisations
• Guaranteed representation has increased influence – one can hardly blame teachers/TUs for using that privilege
• TU mem’ship and pol. connections associated with lower ach.
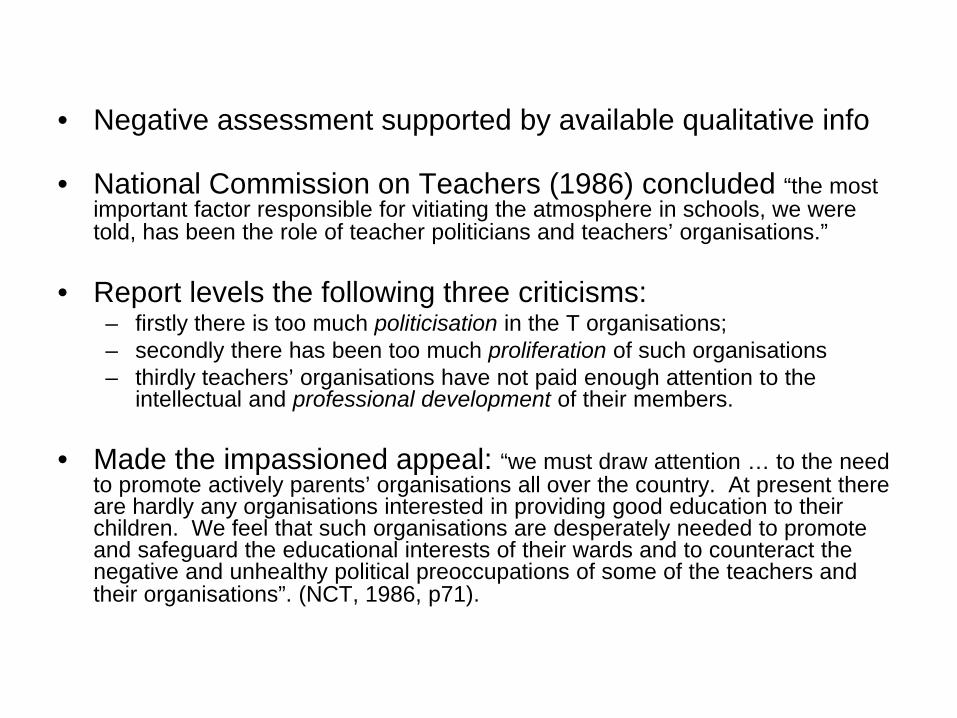
• Negative assessment supported by available qualitative info
• National Commission on Teachers (1986) concluded “the most important factor responsible for vitiating the atmosphere in schools, we were told, has been the role of teacher politicians and teachers’ organisations.”
• Report levels the following three criticisms: – firstly there is too much politicisation in the T organisations; – secondly there has been too much proliferation of such organisations – thirdly teachers’ organisations have not paid enough attention to the
intellectual and professional development of their members.
• Made the impassioned appeal: “we must draw attention … to the need to promote actively parents’ organisations all over the country. At present there are hardly any organisations interested in providing good education to their children. We feel that such organisations are desperately needed to promote and safeguard the educational interests of their wards and to counteract the negative and unhealthy political preoccupations of some of the teachers and their organisations”. (NCT, 1986, p71).
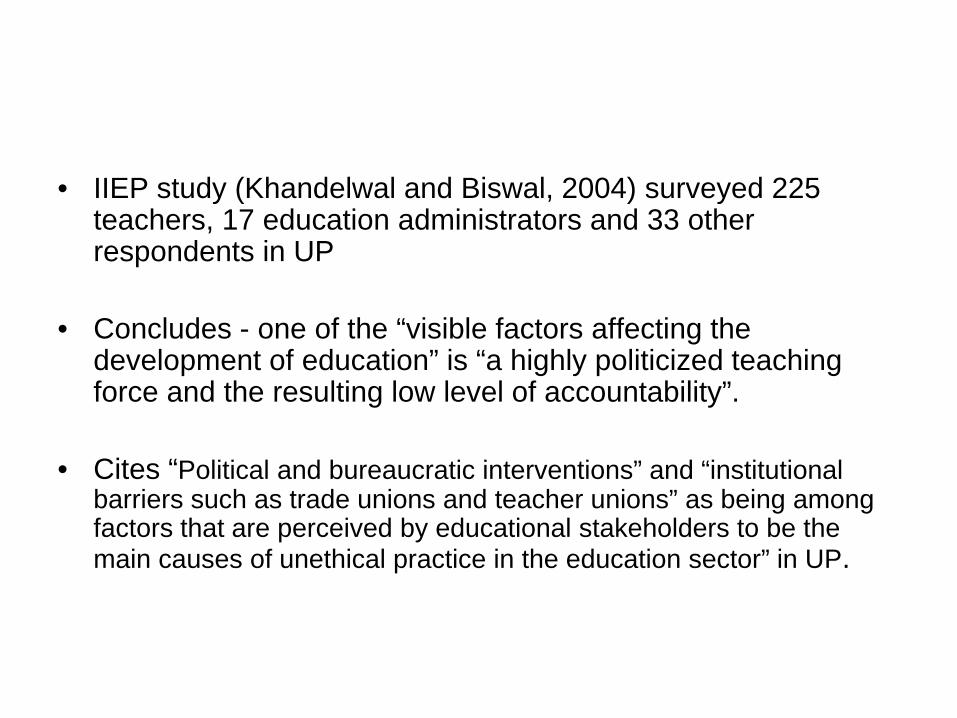
• IIEP study (Khandelwal and Biswal, 2004) surveyed 225 teachers, 17 education administrators and 33 other respondents in UP
• Concludes - one of the “visible factors affecting the development of education” is “a highly politicized teaching force and the resulting low level of accountability”.
• Cites “Political and bureaucratic interventions” and “institutional barriers such as trade unions and teacher unions” as being among factors that are perceived by educational stakeholders to be the main causes of unethical practice in the education sector” in UP.
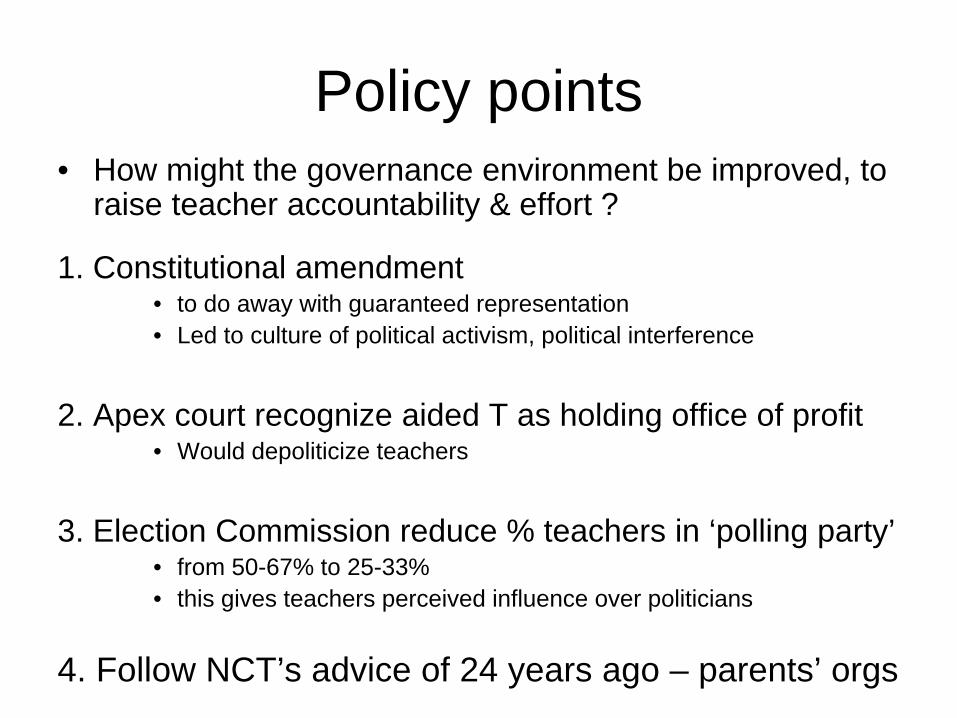
Policy points• How might the governance environment be improved, to
raise teacher accountability & effort ?
1. Constitutional amendment • to do away with guaranteed representation• Led to culture of political activism, political interference
2. Apex court recognize aided T as holding office of profit• Would depoliticize teachers
3. Election Commission reduce % teachers in ‘polling party’• from 50-67% to 25-33%• this gives teachers perceived influence over politicians
4. Follow NCT’s advice of 24 years ago – parents’ orgs
PPPs in education• Apart from attempting to improve matters within
the govt. school sector, an alternative policy choice is to opt for private production of education with public money, a PPP
• PPP is not a panacea, irrespective of design
• RTE Act 2009 has chosen to set up a particular type of PPP
25% seats provision in RTE Act
• RTE Act smart in recognising that the one part of educsector that retains T accountability is private sector
• It seeks to co-opt that sector in a PPP
• Smart move –• will increase the number of disadvantaged children who get
access to better quality education, and • reduce the cost of providing education.
• Studies of the relative effectiveness of private and public schools consistently show ach advantage of private schools (Desai et al, 2008; Tooley & Dixon, 2005; Goyal & Pandey, 2009; French & Kingdon, 2010)
– Schools reimbursed on lower of the two: • per pupil expenditure in govt schools in the state• the private school’s own fee level
– Private schools’ ability to pay market clearing wages means they have dramatically lower PPE (taking out the elite schools)
• ROR to RMSA is 50% greater if we allow 50% of secondary expansion to occur via PPP
• Several issues not thought about: • To increase size / number of private schools • To raise fee rates• Increase government interference
• So the 25% provision is smart in that it harnesses the advantages of private sector: – its ability to get teachers to work, – its ability therefore to produce higher learning levels, – its ability to produce education at a sig. cheaper cost
• But still, the tax payer may not be getting the best value for money
• RTE Act bring in the biggest form of PPP in education, but why this particular way of giving public money to the private schools ?
• There are many diff potential ways of setting up a PPP. A particular form of PPP has been chosen without considering alternatives, or articulating/justifying why this form of PPP is better as against others
• Its an example of supply side funding of schools; its argued that demand side funding works better – vouchers. Issues of school choice and school competition not seriously considered


