Midwest State’s Regional Pooled Fund Research Program Fiscal Year 1998-1999 (Year 9) NDOR Research Project Number SPR-3(017) DEFLECTION LIMITS FOR TEMPORARY CONCRETE BARRIERS Submitted by Dean L. Sicking, Ph.D., P.E. Professor and MwRSF Director John D. Reid, Ph.D. Associate Professor Karla A. Polivka, M.S.M.E., E.I.T. Research Associate Engineer MIDWEST ROADSIDE SAFETY FACILITY University of Nebraska-Lincoln 527 Nebraska Hall Lincoln, Nebraska 68588-0529 (402) 472-6864 Submitted to MIDWEST STATE’S REGIONAL POOLED FUND PROGRAM Nebraska Department of Roads 1500 Nebraska Highway 2 Lincoln, Nebraska 68502 MwRSF Research Report No. TRP-03-113-03 (revised) June 18, 2003
Transcript
Midwest State’s Regional Pooled Fund Research ProgramFiscal Year 1998-1999 (Year 9)
NDOR Research Project Number SPR-3(017)
DEFLECTION LIMITS FOR
TEMPORARY CONCRETE BARRIERS
Submitted by
Dean L. Sicking, Ph.D., P.E.Professor and MwRSF Director
John D. Reid, Ph.D.Associate Professor
Karla A. Polivka, M.S.M.E., E.I.T.Research Associate Engineer
MIDWEST ROADSIDE SAFETY FACILITYUniversity of Nebraska-Lincoln
527 Nebraska HallLincoln, Nebraska 68588-0529
(402) 472-6864
Submitted to
MIDWEST STATE’S REGIONAL POOLED FUND PROGRAMNebraska Department of Roads
SPR-3(017)12. Sponsoring Organization Name and Address 13. Type of Report and Period Covered
Midwest States Regional Pooled Fund ProgramNebraska Department of Roads1500 Nebraska Highway 2Lincoln, Nebraska 68502
Final Report 2001-2003 (revised)14. Sponsoring Agency Code
15. Supplementary Notes
Prepared in cooperation with U.S. Department of Transportation, Federal Highway Administration16. Abstract (Limit: 200 words)
Whenever a traffic control plan is developed that utilizes temporary barriers, it is important to define acceptable barrierdeflection criteria. However, the acceptable deflection criteria can be expected to vary, depending on the application. Whentemporary concrete barriers are used on the edge of a bridge, the risk of the entire line of barriers falling off of the deck requiresthat deflection limits be selected to preclude such behavior in almost all impact scenarios. Hence, it is recommended that at theedge of a bridge deck, design deflection limits should be selected to contain more than 95 percent of all crashes. In all other barrierapplications, the consequences of a barrier exceeding the design deflection criteria are not severe. In these situations, a moremodest deflection limit criterion based on an 85th percentile impact condition is more appropriate.
Previous crash testing according to NCHRP Report No. 350 has shown that most temporary barrier systems have producedlarge lateral deflections, high vehicle climb, and high roll angles when subjected to such an extreme impact. However, it is generallyaccepted that the Test Level 3 (TL-3) strength test with a ¾-ton pickup truck represents an extreme impact severity that isinfrequently encountered in real world accidents. Additional crash tests could be conducted to determine the deflection oftemporary barriers at reduced impact condition but the cost would be extremely high. Therefore, computer simulation was usedto estimate the deflection of barriers impacted under the 85th percentile impact conditions. Finally, recommendations were madepertaining to the two different design deflection limits that should be used for the Iowa temporary concrete barrier.
Temporary concrete barriers are normally used to protect motorists from serious work zone
hazards, such as deep drop-offs, heavy construction equipment, and opposing traffic. Temporary
barriers are also used to protect highway workers from the risk of being struck by an errant vehicle.
Whenever a traffic control plan is developed that utilizes temporary barriers, it is important to define
acceptable barrier deflection criteria. However, the acceptable deflection criteria can be expected
to vary, depending on the application. In some cases, the deflection criteria should be selected to
virtually eliminate any chance of the barrier being displaced too far. The best example of such a
situation is where the barrier is used on the edge of a bridge deck. A conventional temporary
concrete barrier can be pulled off of the bridge by a single segment that is pushed off of the deck.
As a result, the risk to workers and traffic below the bridge is extremely high, and deflections that
could lead to such behavior should be avoided if possible. Under this situation it is generally
accepted that barriers should be designed to contain almost all impacts without allowing the center
of gravity of any barrier segment to extend beyond the edge of the bridge.
On the other hand, temporary concrete barriers are more frequently used in applications
where high lateral deflections are less catastrophic. Examples of these situations include barriers
used to separate traffic on two-lane, two-way traffic operations, protect motorists from heavy
construction equipment, or protect workers on the ground in the construction zone. When used to
separate traffic, barrier deflections up to 600 mm (2 ft) would not cause a significant problem for
opposing traffic. Even in narrow construction zones, traffic lanes of less than 3-m (10-ft) wide are
rare, and a 600-mm (2-ft) lateral barrier displacement would not intrude significantly into the paths
of oncoming traffic. Although larger deflections could begin to intrude into the normal paths of
2
oncoming traffic, the risk of an accident involving opposing traffic is still relatively low. Even when
a vehicle in the opposing lane strikes a deflected barrier, the impact angle associated with any
resulting crash would be expected to be extremely low. For this situation, the consequences of
exceeding the deflection limit are not catastrophic.
Further, when barriers are used to protect motorists from heavy construction equipment, the
risk of a catastrophic accident would be relatively low. Although heavy construction equipment is
often used in highway work zones, the period of time that such equipment is in close proximity to
any given section of the barrier is relatively limited. Remember that much of a temporary barrier’s
deflection occurs after the impacting vehicle has been redirected and the barrier is sliding freely
along the ground. Hence, even when heavy equipment is placed close to a barrier and a high energy
impact occurs immediately adjacent to the hazard, the impacting vehicle would likely be
successfully redirected without incident. Thus, the risk to motorists of a barrier deflecting beyond
the design limit is very low in this application.
There is a similar effect for temporary barriers used to protect construction workers. When
compared to the total period of construction, the time that workers are immediately behind the
barrier is relatively limited. Again, since vehicles are redirected long before the barrier reaches its
maximum lateral displacement, an impacting vehicle would not directly contact workers standing
near the barrier. Instead, the barrier could be expected to slide into the workers at a very low speed.
Again even when temporary barriers are used to protect construction workers, the consequences
associated with a barrier deflecting beyond the design criteria are relatively modest.
In summary, when temporary concrete barriers are used on the edge of a bridge, the risk of
the entire line of barriers falling off the deck requires that deflection limits be selected to preclude
3
such behavior in almost all impact scenarios. Hence, it is recommended that at the edge of a bridge
deck, design deflection limits should be selected to contain more than 95 percent of all crashes. In
all other barrier applications, the consequences of a barrier exceeding the design deflection criteria
are not severe. In these situations, a more modest deflection limit criterion based on an 85th
percentile impact condition is more appropriate.
4
[ ]IS m v=12
2sinθ
2 IMPACT CONDITIONS
NCHRP Report No. 350 (1) recommends that temporary barriers be tested under the same
criteria as permanent barrier systems. Therefore, in order to be used on high speed facilities,
temporary barriers are tested under the Test Level 3 (TL-3) criteria which involves a 2,000-kg
(4,409-lb), ¾-ton pickup truck impacting the barrier at a speed of 100.0 km/hr (62.1 mph) and at an
angle of 25 degrees. When subjected to such an extreme impact, most temporary barrier systems
have produced large lateral deflections, high vehicle climb, and high roll angles. Most pin and loop
barrier systems have deflected more than 1200 mm (4 ft) when subjected to the TL-3 testing criteria.
However, it is generally accepted that the TL-3 strength test with a ¾-ton pickup truck represents
an extreme impact severity that is infrequently encountered in real world accidents.
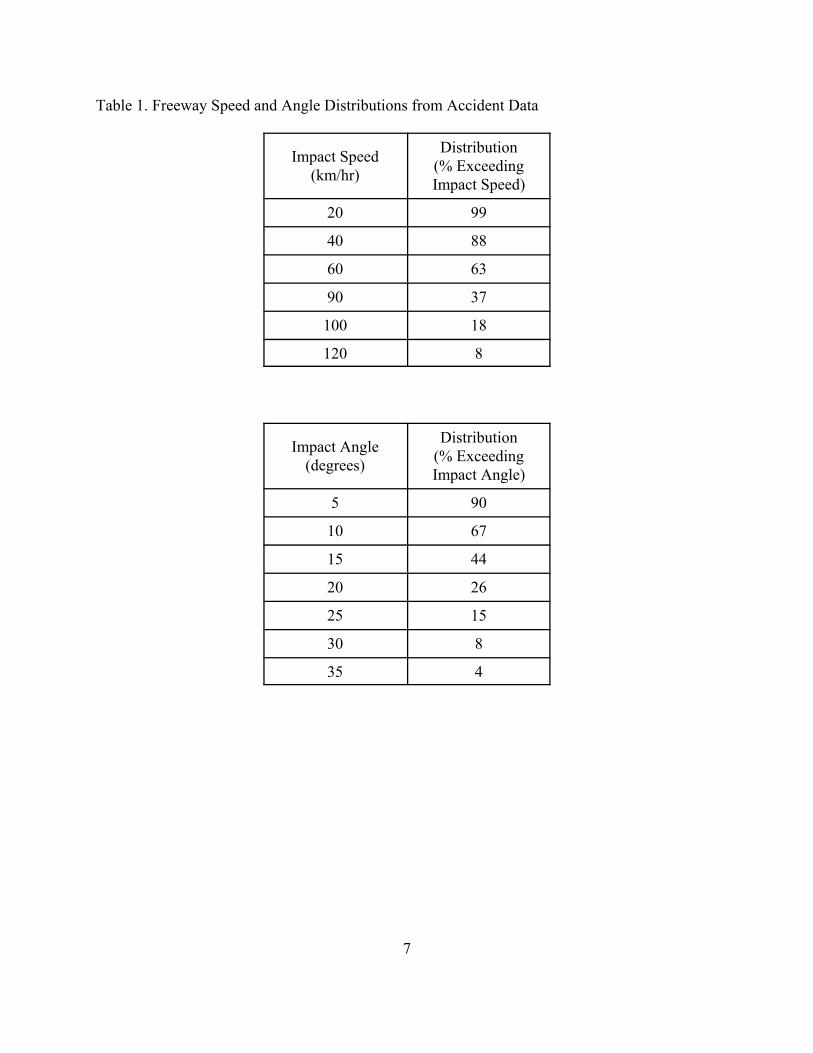
Data collected from crashes with poles and narrow bridges have been used to estimate
distributions of speeds and angles associated with ran-off-road crashes (2). As shown in Table 1,
only 18 percent of freeway accidents involve impact speeds greater than 100.0 km/hr (62.1 mph) and
only 15 percent involve impact angles greater than 25 degrees. Further analysis of the data from
reference 2 indicates that less than 3 percent of all accidents involve both an impact speed greater
than or equal to 100.0 km/hr (62.1 mph) and an impact angle greater than or equal to 25 degrees.
Although data from reference 2 clearly indicates that the TL-3 strength test represents an
extreme impact condition, it is not sufficient for identifying expected barrier deflections. A number
of research studies have shown that the Impact Severity (IS), as defined below, is a good indicator
of the degree of loading and the lateral deflections of longitudinal barriers (3-5).
5
where:
m = mass of impacting vehiclev = velocity of impacting vehicle 2 = angle of impact.
IS adds the effect of the mass of the impacting vehicle to provide a good measure of the
severity of impact and the magnitude of the resulting barrier deflections. Although vehicle impact
conditions may be somewhat correlated to vehicle weight, there has been no research to date that
either indicates such a correlation or that it would be very strong. Further, speed studies have shown
very modest correlations between passenger vehicle mass and operating speed which indicates that
the correlation between accident speed and vehicle mass should be very weak. Therefore, in order
to estimate the expected distribution of impact severities, the mass distribution for vehicles involved
in ran-off-road crashes was assumed to be independent of the impact speed and angle distributions.
Mass distributions for vehicles involved in ran-off-road crashes, shown in Table 2, have been
determined from the National Accident Sampling System - Crashworthiness Data System (6).
When the mass distribution shown in Table 2 is combined with the speed and angle
distributions from reference 2, the distribution of IS values for passenger cars and light trucks can
be developed. The distribution shown in Figure 1 was developed by assuming that impact speed and
angle distributions for freeways from reference 2 are independent of the vehicle mass distributions.
Impact severity distributions were first developed for each vehicle class shown in Table 2, and the
separate distributions were then combined based on the portion of traffic represented by each class.
Note that impact speeds and angles used to develop Figure 1 were based on accidents that occurred
during the time when the national speed limit reduced operating speeds on rural freeways. However,
remember that this data is being used to evaluate accidents in construction zones where operating
6
speeds are generally reduced in a manner similar to that associated with the national speed limit.
Therefore, although the distribution of IS values shown in Figure 1 may be too low for modern, free-
flowing, rural freeways, it should provide a reasonable estimate of impact conditions for
construction zones where temporary barriers are utilized.
As shown in Figure 1, the 95th percentile IS value is just below 120 kJ (88.5 kip-ft). This
value is not far below the IS value associated with the TL-3 strength test of 138 kJ (101.7 kip-ft).
Therefore, it is reasonable to utilize deflections measured during full-scale crash testing under TL-3
impact conditions when selecting barrier deflection limits for use on the edge of a bridge deck.
However, the 85th percentile IS value, which is more appropriate for all other applications of
temporary concrete barriers, is closer to 55 kJ (40.5 kip-ft). An IS value of 55 kJ (40.5 kip-ft) would
correspond to a ¾-ton pickup truck impacting the barrier at a speed of 58 km/hr (36 mph) and at an
angle of 27.1 degrees. Barrier deflections under this impact condition would be much less than
those observed when a barrier is subjected to crash testing under the NCHRP Report No. 350
recommendations.
7
Table 1. Freeway Speed and Angle Distributions from Accident Data
Impact Speed(km/hr)
Distribution(% ExceedingImpact Speed)
20 99
40 88
60 63
90 37
100 18
120 8
Impact Angle(degrees)
Distribution(% ExceedingImpact Angle)
5 90
10 67
15 44
20 26
25 15
30 8
35 4
8
Table 2. Mass Distribution
Vehicle Type Vehicle Makeand Model
AverageWeight
(lbs)
GESDistribution
(%)
PassengerVehicle
Small Sedan Toyota TercelGeo Metro 1835 11.5
Small Sedan Ford EscortToyota Corolla 2408 17.5
Medium Sedan Toyota CamryHonda Civic 2718 24.6
Medium Sedan Ford TaurusHonda Accord 3065 7.4
Large Sedan Cadillac DevilleBuick LeSabre 3553 3.2
Large Sedan Lincoln Town CarFord Crown Victoria 3930 3.1
LightTrucks
Small Van Plymouth VoyagerFord Aerostar 3257 3.8
Large Van Ford E-150 4189 2.5
Small Pickup Ford RangerChevrolet S10 3023
19.6Standard Pickup Chevrolet 1500, 2500Ford F-150, 250 4258
All Pickups 3711
Sport UtilityVehicle
Small SUV Suzuki SamuriGeo Tracker 2150
6.8Mid-size SUV Ford Explorer
Jeep Cherokee 3668
Large SUV Chevrolet SuburbanFord Expedition 4940
All SUV 3544
9
Figure 1. Impact Severity Distributions for Freeways
10
3 IMPACT MODELING
Although additional crash tests could be conducted to determine the deflection of temporary
barriers at this reduced impact condition, the cost would be extremely high. Computer simulation
of the impact conditions can be used to estimate the deflection of barriers impacted under the 85th
percentile impact conditions. This process involves using LS-Dyna to model the behavior of the
barrier system when subjected to full-scale crash testing. After the model has been calibrated to
accurately predict barrier deflections for the high energy crash test conditions, the impact conditions
are revised and the barrier deflections are estimated for the lower energy crash. Figure 2 shows the
LS-Dyna model of the Iowa temporary barrier (7-8), and Figure 3 plots the predicted and actual
deflections of the barrier subjected to full-scale crash testing. Note that simulation predicted both
the general shape and maximum extent of barrier deflections with a reasonable degree of accuracy.
Based on the findings of these simulations, it was concluded that LS-Dyna could be used to estimate
the barrier deflections associated with the 85th percentile impact condition.
Results of the LS-Dyna model of the ¾-ton pickup truck impacting the Iowa temporary
barrier under the 85th percentile impact condition at a speed of 58 km/hr (36 mph) and 27.1 degrees
is shown in Figure 4. The maximum deflection predicted during this crash test was 600 mm (2 ft).
Based on this analysis, the design deflection limit for the Iowa temporary barrier should be set at 600
mm (2 ft) for all applications except when it is used at the edge of a bridge deck.
11
Figure 2. LS-Dyna model of the Iowa temporary barrier
12
Figure 3. Predicted and actual deflections of the temporary concrete barrier subjected to full-scale crash testing
13
Figure 4. 85th percentile impact results of the LS-Dyna model of the Iowa temporary barrier (58 km/hr and 27.1 degrees)
14
4 CONCLUSIONS
As summarized within this report, two different design deflection limits should be used for
the Iowa temporary concrete barrier. When the barrier is used in a free standing mode, immediately
adjacent to the edge of a bridge deck, the design deflection limit should be the distance that the
barrier was deflected during full-scale crash testing, 1.15 m (45.3 in.). For all other applications,
the design deflection limit should be set at 600 mm (2 ft). This distance corresponds to the distance
that the Iowa temporary barrier could be expected to deflect under the 85th percentile impact for
passenger cars and light trucks.
15
5 REFERENCES
1. Ross, H.E., Sicking, D.L., Zimmer, R.A., and Michie, J.D., Recommended Procedures forthe Safety Performance Evaluation of Highway Features, National Cooperative HighwayResearch Program (NCHRP) Report No. 350, Transportation Research Board, Washington,D.C., 1993.
2. Mak, K.K., Sicking, D.L., and Ross, Jr., H.E., Real World Impact Conditions for Ran-Off-the-Road Accidents, Transportation Research Record No. 1065, Transportation ResearchBoard, National Research Council, Washington, D.C., 1986.
3. Bronstad, M.E., and Michie, J.D., Multiple-Service-Level Highway Bridge Railing SelectionProcedures, National Cooperative Highway Research Program (NCHRP) Report No. 239,Transportation Research Board, Washington, D.C., November 1981.
4. Sicking, D.L., Guidelines for Positive Barrier Use in Construction Zones, TransportationResearch Record No. 1035, Transportation Research Board, National Research Council,Washington, D.C., 1985.
5. Mak, K.K., and Sicking, D.L., Evaluation of Performance Level Selection Criteria forBridge Railings, Final Report, NCHRP Project 22-8, Texas Transportation Institute, TexasA&M University, September 1993.
6. Ray, M.H., Impact Conditions of Side Impact Collisions with Fixed Roadside Objects,Accident Analysis and Prevention, Volume 31, No. 1, Pergamon Press, March 1999.
7. Faller, R.K., Rohde, R.R., Rosson, B.T., Smith, R.P., and Addink, K.H., Development of aTL-3 F-Shape Temporary Concrete Median Barrier, Final Report to the Iowa Departmentof Transportation, Project SPR-3(017), Transportation Report No. TRP-03-64-96, MidwestRoadside Safety Facility, University of Nebraska-Lincoln, December 1996.
8. Horne, D.A., FHWA NCHRP Report No. 350 approval letter B-41 of F-Shape TemporaryConcrete Barrier with Pin and Loop Connection design, To Dean L. Sicking, MidwestRoadside Safety Facility, Lincoln, NE, October 10, 1997.