Deformation-Controlled Design of Reinforced ConcreteFlexural Members Subjected to Blast Loadings
Hai-Cheng Rong1 and Bing Li2
Abstract: Both maximum displacement and displacement ductility factors should be considered in the design of a blast-resistant structuresince both parameters correlate with an expected performance level of a reinforced concrete �RC� structural member during a blast event.The blast-resistant design procedure discussed in this paper takes into account both the maximum displacement and displacement ductilityresponses of an equivalent single-degree-of-freedom �SDOF� system, while the response of the SDOF system is made equivalent to thecorresponding targets of design performance. Some approximate errors are present when comparing the actual responses of the structuralmember, which has been designed for blast loading, and their corresponding design performance targets. Two indices are defined toquantify the approximation errors, and their expressions are obtained through comprehensive numerical and statistical analyses. By usingthe error indices, the design procedure is then modified such that the approximate responses of the RC member are equivalent to thetargets of the design performance. The modified procedure is implemented in three design examples and numerically evaluated. It isconcluded that the modified procedure can be used more effectively in order to ensure that the actual responses of designed membersreflect the respective targets of design performance.
The design of reinforced concrete �RC� structural membersagainst accidental or deliberate explosions is deemed necessarywith an increasing emphasis on blast loading on structures. Theblast load exerted on a structural member can be adequately sim-plified as a uniformly distributed dynamic loading, characterizedby its peak pressure and duration, with the exception of veryclose-in explosion situations. Some level of inelastic deformationof the structural member is allowed in the blast-resistant designwhen subjected to severe blast loadings to dissipate energy, there-fore, most of blast design guidelines �ASCE 1985; NFEC 1986;U.S. Army 1986, 1990; Biggs 1964�, with explicit considerationof inelastic deformation, have been proposed in recent years.These design guidelines help to ensure that a RC memberis designed such that its response is equivalent to the predefinedperformance level under blast loading. Thus, the proposeddesign procedure seeks to reconcile the differences between apossibly lower response as determined by numerical methodsand a possibly higher level response as predetermined by designperformance.
In this paper, a new deformation-controlled blast-resistant de-sign procedure using nondimensional energy spectra �NES� wasdeveloped. The effective depth �d� and longitudinal reinforcement
1Research Associate, School of Civil and Environmental Engineering,Nanyang Technological Univ., Singapore 639798.
2Associate Professor, School of Civil and Environmental Engineering,Nanyang Technological Univ., Singapore 639798.
Note. Associate Editor: Gary Consolazio. Discussion open untilMarch 1, 2009. Separate discussions must be submitted for individualpapers. The manuscript for this paper was submitted for review and pos-sible publication on May 9, 2007; approved on February 29, 2008. Thispaper is part of the Journal of Structural Engineering, Vol. 134, No. 10,
ratio ��� of a RC member can be determined by representing acontinuous RC member as an equivalent elastic–plastic single-degree-of-freedom �SDOF� system. Subsequently, the maximumdisplacement and displacement ductility responses �ym
eq and �eq�can be made equivalent to the corresponding design performancetargets, which are defined by its target displacement and targetdisplacement ductility factor �yt and �t� �ASCE 1985; NFEC1986; U.S. Army 1986, 1990; Kottegoda and Rosso 1996�. Thisprocedure is based on an underlying assumption that the re-sponses �ym
rc and �rc� of the designed RC member at a criticallocation �for a fixed–fixed member, the critical location is themidspan; for a cantilever member, the critical location is the freeend� can be represented by the responses of its equivalent SDOFsystem �ym
eq and �eq� for a defined blast loading. However, thedifference of ym
rc and �rc with its respective ymeq and �eq can be
expected due to the complexities of the nonlinear dynamic re-sponse of RC members under blast loading conditions, whichcannot be captured by the equivalent elastic–plastic SDOF sys-tem. This manifests itself in the errors between the displacementductility responses �ym
rc and �rc� and the corresponding designperformance targets �yt and �t�.
In principle, a response analysis should be capable of control-ling the actual responses of a RC member �ym
rc and �rc� rather thanthose of the corresponding equivalent SDOF system �ym
eq and �eq�,for a given design performance targets �yt and �t�. Thus, it isworthwhile determining the errors between the actual responses�ym
rc and �rc� and the corresponding performance targets �yt and�t� of a RC member. Application of these errors in modifying thedeformation-controlled blast-resistant design procedure will actu-ally help in controlling the responses of ym
rc and �rc. This paperdiscusses some numerical examples to demonstrate the analysisprocedure using the modified design method. Numerical simula-
tions of the displacement and the displacement ductility responses
008
under blast loading are performed, and the results are comparedwith the performance targets.
Deformation-Controlled Design Procedure
Nondimensional Energy Spectrum
A nondimensional energy spectrum is an important tool in theincorporation of the target displacements and target displacementductility factors �yt and �t�, which allows for determining designparameters of d and � for RC members. The nondimensionalenergy factor �C� is introduced into an elastic–plastic SDOF sys-tem �see Fig. 1�, expressing the ratio of maximum strain energyEmax to the ultimate elastic energy Eel and is given in Eq. �1�
C = Emax/Eel �1�
where Eel=keye2 /2; and Emax=keye�ymax−ye /2�. Substituting them
into Eq. �1�, C becomes
C = 2� − 1 �2�
where �=ymax /ye. The displacement ductility factor ��� is a func-tion of F1 /Rm �where F1=peak value of the force�; and td /T andtheir distributions can be found in Biggs �1964�. A group ofcurves, which represent the factor C against the ratio td /T withrespect to various F1 /Rm, are defined as NES and are shown inFig. 2.
Design of RC Flexural Member Using NES
A structural member with continuous mass and stiffness can berepresented by an equivalent elastic–plastic SDOF system with anequivalent mass and stiffness �Biggs 1964�. The equivalent SDOFsystem is such that the deformation response of the concentratedmass is assumed to be the same as that for the critical point on thestructural member �e.g., the midspan of a member with two endsconstrained or the free end of a cantilever member�. Thus, theresponses of the equivalent SDOF system under a given blastloading should achieve the expected performance level defined byyt and �t. To achieve this objective, there exists only one solutionin the form of the initial stiffness �ke� and ultimate strength �Rm�for the equivalent system. Therefore, it is clear with the conditionye=yt /�t having been satisfied, and the maximum displacementresponse of the equivalent SDOF system ke having reached yt
exactly, the maximum displacements of equivalent systems withinitial stiffness are either larger or smaller than ke but not equal toyt. The specific solution for ke and Rm of the equivalent SDOF
Fig. 1. Resistance function for an elastic–perfectly plastic SDOFsystem
system can then be obtained by an iterative procedure. Assuming
JOURNAL
an initial stiffness ke, the parameters F1 /Rm and td /T of the sys-tem are obtained and then the values, C and Emax are found byreferring to the NES curves in Fig. 2. However, the value of Emax
will result in a new stiffness kel with
kel =Emax
yeyt − ye2/2
�3�
In order to make ke=kel, the above procedure is repeated until theconvergent condition of �kel−ke��� �where �=convergence toler-ance� is fulfilled.
A few methods to compute d and � for a RC member from ke
and Rm of the corresponding equivalent SDOF system are dis-cussed in blast design guidelines �ASCE 1985; NFEC 1986; U.S.Army 1986, 1990; Biggs 1964�. These ways consider the charac-teristics of concrete and the embedded reinforcements. The equa-tions are summarized as follows �Li et al. 2006�:
d = � 24l3ke
�� + 1��KLEEcbw�1/3
�4�
� =�Rml
KLEfdsbwd�d − d���5�
�v = �Vu − Vc�/�fdvbwd �6�
where l=length of member; KLE=load transformation factor;� and �=coefficients for different boundary conditions;Ec=Young’s modulus of concrete; bw=member width; and theparameter of � can be obtained from Fig. 3. It is observed that thecoefficient varies with � as well as the modulus ratio �Es /Ec�,where Es=Young’s modulus of steel �U.S. Army 1986, 1990�;Vu=ultimate shear force; and Vc=shear capacity of the concrete.fds and fdv=dynamic yield strength for longitudinal and shearreinforcements, respectively, in which the dynamic increase fac-tors �DIFs� are used in the design according to TM5-1300 �U.S.Army 1990�.
Eq. �4� demonstrates that d is a function of �. Since � varieswith � as shown by Fig. 3, d such that it considers �. On the otherhand, Eq. �5� indicates that � is determined by d. Therefore, an
Fig. 2. NES of an undamped elastic–perfectly plastic SDOF systemdue to triangular load pulses with zero rise time with differentreinforcement layouts
iterative computational procedure needs to be employed to deter-
mine d and � of a RC member against the given blast loading.Combining it with the previous iterative procedure of determiningke and Rm of the equivalent SDOF system for a given blast load-ing and the dual targets of yt and �t, the design flow chart fordetermining d and � based on NES is shown in Fig. 4. In theabove developed design procedure, an initial data of d0 and �0 isassumed such that the value of Emax for the equivalent SDOF
Fig. 3. Reduction coefficient for moment of inertia of cracked sectopposite faces
Fig. 4. Flow chart of deformation-controlled blast resistant design ofRC members using NES �where �1 ,�2 are arbitrarily small values�
system can be obtained. However, this Emax will result in a newsolution of d1 and �1 and the process must be repeated until d and� are consistent.
Implementation of the Design Procedure
To evaluate the effectiveness of applying the presented designprocedure, a demonstration is given by implementing it on thedesign of a RC wall subjected to blast loading. The RC wall isdesigned to resist the blast loading perpendicular to its plane. Theblast loading is simplified into a triangular pulse with the peakpressure and duration as shown in Fig. 5. The design is requiredto achieve the expected performance level defined by �t=9 andt=4°. Thus, yt of the wall at the free end under the given blastcondition can be obtained with an approximate expression of yt
� l tan�t�. The area of compression reinforcement is taken to beequal to that of the tension reinforcement. This equivalent of re-inforcement would consider the rebound effect of the membersubsequent to its maximum displacement response, and makesprovision for the possibility of the explosion occurring in theopposite side of the wall.
The design procedures for the iterative step are illustrated inTable 1. During the design process, the value of the initial effec-tive depth �d0� is taken as 2.0 m and the initial �0 to be 3.0%. Theconvergence limit employed in the design is 0.001. It can be seenfrom Table 1 that the design procedure is insensitive to the initialvalues of d0 and �0. Therefore, there is no difficulty in achievingcomputational convergence during the iterations. It takes onlyseven iterative steps in this example to find the solution and sat-isfy the condition of ��d1−d0� /d0��0.001 and ���1−�0� /�0�
� with tension reinforcement only; �b� with equal reinforcement on
Fig. 5. Sketch of a RC wall
ion: �a
008
T � 1 1 0 1 0 0 0 N b
JOURNAL
�0.001. The time taken for the computation of this design ex-ample is only 0.12 s using a program written with MATLAB�2001�.
Numerical Verification
Verification of the Responses for the Equivalent SDOFSystem
To assess whether the responses of the equivalent SDOF systemfor the designed RC member under the given blast loading arecontrolled to be exactly equal to their performance targets, thenonlinear time–history analysis is carried out upon the equivalentSDOF system having ke and Rm. The displacement responses areshown in Fig. 6. It is observed that ym
eq and �eq of the equivalentSDOF system meet their targets exactly.
Verification of the Actual Responses of RC Member
Due to the complicated behaviors of continuous RC members,some differences between the responses of the equivalent SDOFsystem �ym
eq and �eq� and those of the designed member �ymrc and
�rc� are conceivable, as shown in Fig. 7. Therefore, some approxi-mate errors are noticed between the actual response �ym
rc and �rc�and the corresponding targets �yt and �t�. To evaluate the effec-tiveness of the presented design procedure in controlling the re-sponses of the designed member, ym
rc and �rc of the member underthe same blast loading were determined using the ABAQUS soft-ware �ABAQUS 2003�. The values of ym
rc and �rc were comparedwith their respective design performance targets �yt and �t�.
The smeared cracking model for concrete is utilized consider-ing that the failure of RC members under blast conditions is char-acterized by concrete crushing accompanied by concretecracking. In this model, a crack appears when the maximum prin-cipal tensile stresses reach a failure surface. The von Mises yieldcriterion is used to describe the constitutive behavior of the rein-forcement. The stress–strain relationship of reinforcement is mod-eled with an elastoplastic curve. The strain hardening ofreinforcement is not considered in this analysis since it is hard todefine under the blast conditions due to lack of experimental data.The ultimate strain value is never reported in the current literaturedue to the difficulty of determining exactly when the peak stress
Fig. 6. Deflection history of the equivalent SDOF system for thedesigned RC wall under the given blast loading
able
1.It
erat
ive
Proc
edur
efo
rth
eD
esig
nof
aC
antil
ever
Wal
lU
sing
NE
S
0
�0
�%�
d 0 �m�
m �kg�
I�m
4 �k e
�N/m
�T �s�
Rm
�N�
T/t
dF
1/R
m
Eel
�Nm
�C
Em
ax
�Nm
�K
e1
�N/m
�q u
�N/m
�M
u
�Nm
�d 1 �m
��
1
�%�
�1
.000
03.
000
2.00
0039
790.
667
2.21
e98.
43e−
35.
16e7
0.57
310.
048
6.02
e53.
82e−
32.
30e3
4.97
e54.
30e7
1.93
6e8
0.12
169.
858
1.00
00
.000
09.
858
0.12
1624
21.
498e
−4
4.97
e51.
39e−
11.
16e4
0.03
4821
5.1
135.
3828
89.5
3.91
e58.
45e7
9.67
e34.
351e
40.
6736
1.02
50.
7494
.749
41.
025
0.67
3613
401.
909e
−2
6.33
e72.
89e−
21.
48e6
0.16
711.
689
1,72
440.
742
1.28
e42.
76e6
1.23
e65.
542e
60.
2371
2.64
41.
0000
.000
02.
644
0.23
7147
21.
111e
−3
3.69
e67.
11e−
28.
60e4
0.06
7929
.01
1,00
3.7
38.0
43.
82e4
8.25
e67.
17e4
3.22
6e5
0.31
021.
486
0.86
17
.861
71.
486
0.31
0261
72.
142e
−3
7.11
e65.
85e−
21.
66e5
0.08
2515
.05
1,93
5.3
14.9
82.
90e4
6.27
e61.
38e5
6.22
1e5
0.29
741.
566
0.88
11
.881
11.
566
0.29
7459
11.
931e
−3
6.41
e66.
04e−
21.
49e5
0.08
0016
.69
1,74
4.4
17.3
63.
02e4
6.54
e61.
24e5
5.60
7e5
0.29
951.
550
0.87
72
.877
21.
550
0.29
9559
51.
963e
−3
6.51
e66.
01e−
21.
52e5
0.08
0416
.42
1,77
3.4
16.9
53.
01e4
6.50
e61.
26e5
5.70
0e5
0.29
921.
551
0.87
75
ote:
Des
ign
resu
lts:
d=
299.
2m
m;
�or
��=
1.55
1%;
�v=
0.15
%.
Initi
alda
ta:
Es=
200
GPa
;E
c=
28G
Pa;
f s=
460
MPa
;f d
s=50
6M
Pa;
f c=
33M
Pa;
f dc=
40M
Pa;
f v=
250
MPa
;f d
v=
275
MPa
;l=
3.0
m;
w=
1.0
m;
Pr=
2,08
0K
Pa;
t d=
4.83
ms;
and
dens
ityof
conc
rete
�de
n=
2,50
0kg
/m.
occurs as well as the confusion between ultimate strain and rup-
ture strain. To simulate the softening effect of the concrete intension, a bilinear tension stress–strain curve is used after crack-ing, where the failure strain �u
cr is taken as 10−3. The selection ofthis value is based on the assumption that the strain softeningafter failure reduces the stress linearly to zero at a total strain ofabout 10 times of the strain at failure of concrete in tension,which is, typically, 10−4 in standard concretes �Hilleborg et al.1976�. For strain failure of concrete in compression, it is simu-lated with an elastic–plastic mode and the elastic stress state islimited by a yield surface. Once yielding had occurred, an asso-ciated flow rule with isotropic hardening is used.
Considering that both concrete and reinforcement exhibit in-creased strength under higher loading rates, the expressions ofDIFs �Malvar and Crawford 1998a,b� are adopted. The user sub-routine was developed to consider DIFs in the analysis, whichallows the user to define the field variable of a material at anypoint as a function of any available material point quantity. Thus,by making the strain rate a variable, the strain rate-dependentmaterial properties can be introduced in the analysis. Timoshenkobeam elements were assigned to model the members while therebar option was utilized to place each reinforcement at its exactlocation. A perfect bond between rebar and concrete was as-sumed. The finite-element models have been verified for a simplysupported RC beam and a slab subjected to blast loading, wherenumerically determined responses are similar to experimentalones �Rong 2005; Rong and Li 2007�.
Nonlinear dynamic analysis was performed on a design of acantilever RC wall designed for a given blast loading. The plot offree-end responses of the wall in terms of displacement versustime is illustrated in Fig. 8. It is observed that ym
rc for the designedRC walls under the given blast loading is slightly less than yt. Adeviation of about 10% of yt was observed while �rc was equal to5.18 as compared to �t=9. The difference between �rc and �t wasabout 42.4% of �t, and the error between �rc and �t was largerthan that between ym
rc and yt.Comparisons of Figs. 6 and 8 demonstrate that values of ym
eq
and �eq of the equivalent SDOF system met their targets. Therestill existed some errors between the actual responses �ym
rc an �rc�of the RC member and the corresponding design performancetargets �yt and �t�. This indicated that the errors occurred due tothe derivation of d and � from ke and Rm in the design process.Several points accounting for the errors are explained as follows:• The load and mass factors �KLE and KME� are necessary in
Fig. 7. Response differences between the RC member and
considering the continuous RC member as the equivalent
elastic–perfectly plastic SDOF system, whereby these factorsare obtained in an approximate way, which is because the con-tinuous resistance function was represented in two or threeindependent linear stages during the design process as a sim-plification. Thus, the utilization of KLE and KME will causesome errors between the responses of the designed memberand their design targets.
• It is known that the embedded reinforcement and the crackingpropagation of the concrete have a great effect on the value ofI. To simplify this problem in the design process, I obtainedfrom the expression of ��+1�bwd3 /24 was used to calculatethe RC member stiffness �ka� and the corresponding deforma-tion. However, the adoption of �, which is dependent on thefitting experimental data, will incur some error in the design ofRC members.
• It is difficult to determine � accurately, from which the ulti-mate strength of the designed member equates to the antici-pated value �Rm�. The use of Eq. �5� to determine � is quiteconservative since it is assumed that concrete in the compres-sion zone did not contribute towards the ultimate strength of aRC structural member. Thus, the reinforcement ratio � tends tobe enlarged in the design, which causes some errors in fulfill-ing the design targets.
• DIFs are employed for concrete and reinforcement during thedesign process while the varying DIFs with the strain rate are
ivalent SDOF system �where �rc=ymrc /ye
rc and �eq=ymeq /ye
eq�
Fig. 8. Deflection history of the designed cantilever wall under thegiven blast loading
its equ
008
used in the numerical analysis. The inconsistent usage of DIF,in the design and analysis produces errors between the actualresponses of the designed member and their design targets.The deformation-controlled design procedure presented at-
tempts to equate the responses of the equivalent SDOF system tothe design performance targets �i.e., �eq=�t and ym
eq=yt�. How-ever, the numerical verification indicated that some errors existedbetween the responses of the designed RC member �ym
rc and �rc�and the corresponding design targets �yt and �t�. Since the RCmember was specifically designed under a given blast loadingcondition, the following part shows the derivation of the formulasfor quantifying the errors. Also, the method used to combine theformulas for the iterative design procedure to achieve ym
rc and �rc
is shown.
Error Analysis
Definition of Error Indices
To obtain a consistent measurement of the degree of the errorsbetween the actual responses �ym
rc and �rc� and their respectiveperformance targets �yt and �t�, two nondimensional error indicesare defined as
yrc =
yt − ymrc
yt�7�
�rc =
�t − �rc
�t�8�
where yrc=displacement error index for the error between ym
rc andyt; and �
rc=displacement ductility error index representing theerror between �rc and �t. With y
rc and �rc initially known, con-
trolling of ymrc and �rc is possible in the design of blast-resistant
structural members.
Analytical Approach
It is almost impractical to derive explicit expressions of Eqs. �7�and �8� since the behaviors of RC members will exhibit signifi-cantly complicated geometric and material nonlinearity undermost blast conditions. A curve fitting technique with a largeamount of reliable data for y
rc and �rc, which are determined ac-
cording to Eqs. �7� and �8�, was used. ymrc and �rc obtained through
nonlinear finite-element analyses of the designed members wasexecuted together with the statistical analyses so as to find sim-plified explicit expressions of y
rc and �rc. The procedure is listed
as follows:1. Select the type of support conditions �SCs� of RC members
to be designed;2. Sample the design variable vector of �Pr , td ,yt ,�t , l , fdc ,Ec ,
fds ,Es , fdv��, where 2,000 samples are randomly taken to en-sure the accuracy of the statistical analysis;
3. Design an RC member using the above procedure with eachsample of the design variable vector to obtain d, �, and ��,�v, and bw as a ratio of d;
4. Repeat Step 3 until 2,000 sampled design cases are accom-plished;
5. Select 500 design cases with � ranging from 0.31 to 2.2%;6. Perform the numerical analyses on the selected 500 design
rc rc
cases to find ym and � using ABAQUS �2003�;
JOURNAL
7. Compute yrc and �
rc of the 500 design cases with Eqs. �7� and�8�;
8. Plot the distributions of yrc and �
rc with the basic designvariables;
9. Carry out the curve fitting of the distributions of yrc and �
rc
followed by statistical analyses;10. Establish the simplified formulas to estimate y
rc and �rc; and
11. Change the type of SCs of the members and repeat the abovesteps.
Based on the above analytical procedure, the distributions ofy
rc and �rc versus � for the designed RC members under various
support conditions are shown in Fig. 9.
Formulas of Error Indices
Nonlinear curve fittings of yrc and �
rc versus � for various SCs arecarried out as shown in Fig. 9, where the functions are expressedas f�� ,SC� and g�� ,SC�, respectively. The effects of variablesother than � and SC are dealt with by introducing two nominalrandom variables of ey and e�, which are assumed to represent thedeviation of �y
rc and ��rc around the fitting curves. As a result, y
rc
and �rc are written as
yrc = f��,SC� + ey �9�
�rc = g��,SC� + e� �10�
A second-order polynomial function is selected for the curve fit-ting given by
f��,SC� and g��,SC� = a1 + a2� + a3�2 �11�
With the result functions of f�� ,SC� and g�� ,SC�, the nominalrandom variables of ey and e� can be obtained with
ey = �yrc − f��,SC� �12�
e� = ��rc − g��,SC� �13�
For members with various SCs, the results of the parameters a1,a2, and a3 are listed in Table 2. The histograms of ey and e�,which demonstrated that ey and e� follow a normal distributionwith the mean values of ey and e� �Eey
and Ee�� approximated to
zero. Also, the standard deviations of ey and e� ��eyand �e�
�being relatively minor, which indicates that the least effect of thevariables other than � and SC, can be found in the reference�Rong 2005�.
Modification of the Design Procedure with ErrorIndices
Eqs. �7� and �8� provide a valuable tool for modifying the designprocedure in order to keep the actual responses �ym
rc and �rc� undercontrol rather than those of equivalent SDOF system response�ym
eq and �eq�, with respect to the design performance targets �yt
and �t�. For the convenience of the following discussion, thedesign targets are distinguished from two different viewpoints.From a physical viewpoint, design targets are the final goals fordesigned members under certain blast loading conditions andshould remain unchanged within the design. They are called thephysical design targets �PHY-DTs�. However, from another pointof view, design targets are only part of the primary parametersinvolved in the design to control the responses of the designed
members in reaching their PHY-DTs. In this sense, they are
named the parametric design targets �PAR-DTs�. For the blastdesign procedure presented above, the values of PAR-DTs aresimply fixed to be equal to those of PHY-DTs. However, thisaction induces some inevitable errors between the member’s re-sponses �ym
rc and �rc� and the PHY-DTs. By properly adjusting thevalues of PAR-DTs within the design, such errors can easily beeliminated.
Denoting the PHY-DTs for maximum displacement and dis-placement ductility responses as yt and �t while those for PAR-DTs as yte and �te, the two error indices can be expressed anotherform
�yrc =
yte − ymrc
yte= f��,SC� + ey �14�
��rc =
�te − �rc
�te= g��,SC� + e� �15�
In the design process, the responses of ymrc and �rc are required to
be controlled for achieving the PHY-DTs of yt and �t �i.e., ymrc
=yt and �rc=�t�. By substituting them into Eqs. �14� and �15�, thePAR-DTs of yte and �te are obtained as
yte =yt
1 − f��,SC� − ey�16�
�te =�t
1 − g��,SC� − e�
�17�
Eqs. �16� and �17� can be utilized to adjust the PAR-DTs so as togain better control of the responses of ym
rc and �rc within thedesign. The random variables ey and e� indicate the uncertaininfluences of the design variables other than � and SC on errorindices. Certain quantities of ey,n and e�,m corresponding to n andm percentages of nonexceedance probabilities for ey and e�, haveto be selected �Kottegoda and Rosso �1996��. Hence, Eqs. �16�and �17� are modified into
yte =yt
1 − f��,SC� − ey,n�18�
�te =�t
1 − g��,SC� − e�,m�19�
The physical meaning of such an action can be explained as fol-lows. Subtracting Eqs. �18� and �19� from Eqs. �14� and �15�,respectively, and rearranging them leads to
yt − yrc = yte�ey − ey,n� �20�
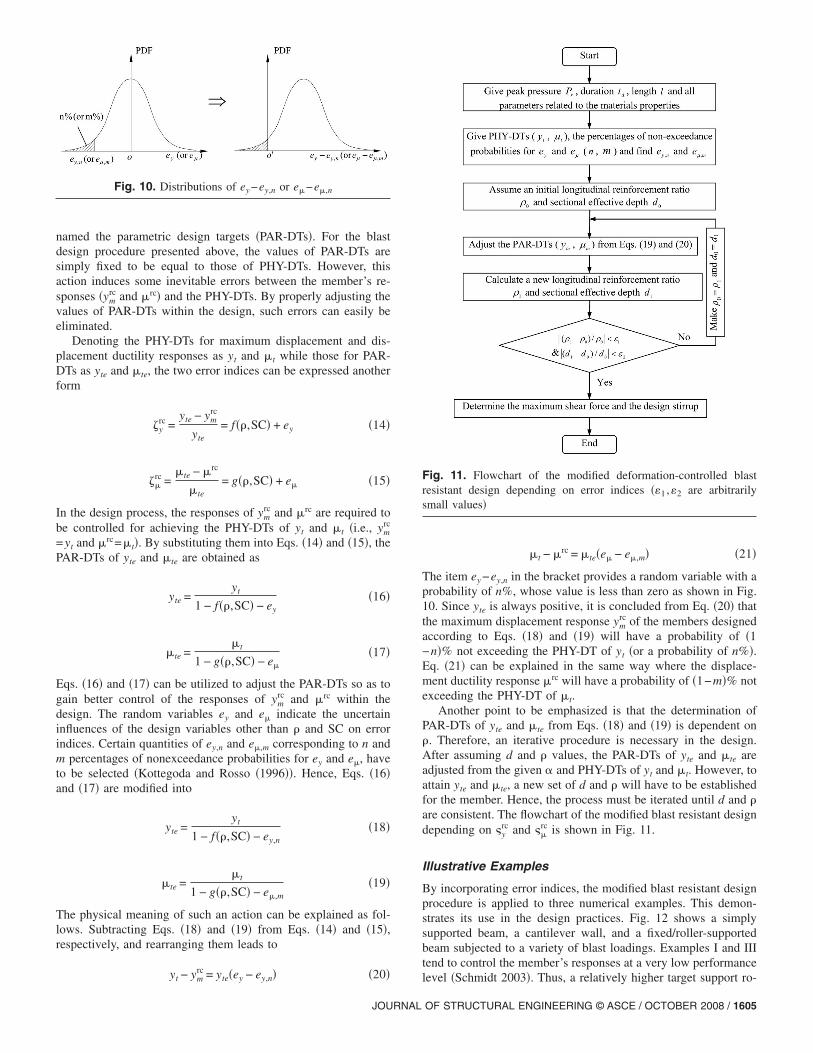
Fig. 10. Distributions of ey −ey,n or e�−e�,n
m
JOURNAL
�t − �rc = �te�e� − e�,m� �21�
The item ey −ey,n in the bracket provides a random variable with aprobability of n%, whose value is less than zero as shown in Fig.10. Since yte is always positive, it is concluded from Eq. �20� thatthe maximum displacement response ym
rc of the members designedaccording to Eqs. �18� and �19� will have a probability of �1−n�% not exceeding the PHY-DT of yt �or a probability of n%�.Eq. �21� can be explained in the same way where the displace-ment ductility response �rc will have a probability of �1−m�% notexceeding the PHY-DT of �t.
Another point to be emphasized is that the determination ofPAR-DTs of yte and �te from Eqs. �18� and �19� is dependent on�. Therefore, an iterative procedure is necessary in the design.After assuming d and � values, the PAR-DTs of yte and �te areadjusted from the given � and PHY-DTs of yt and �t. However, toattain yte and �te, a new set of d and � will have to be establishedfor the member. Hence, the process must be iterated until d and �are consistent. The flowchart of the modified blast resistant designdepending on y
rc and �rc is shown in Fig. 11.
Illustrative Examples
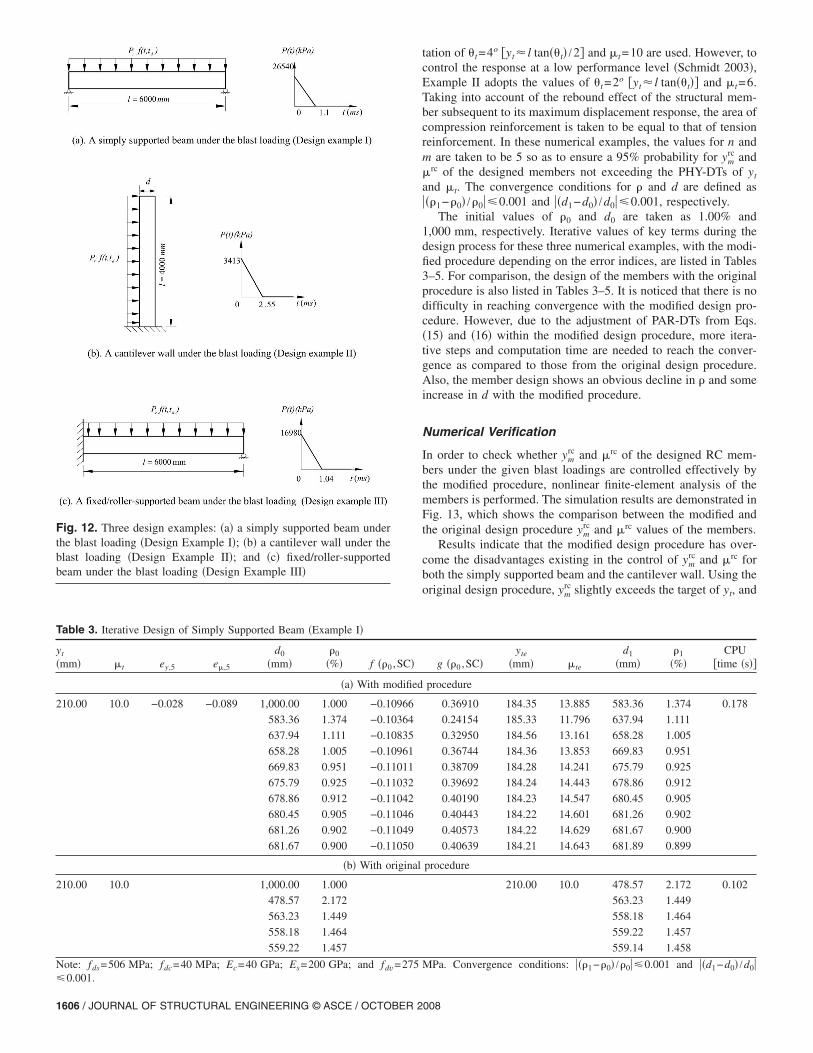
By incorporating error indices, the modified blast resistant designprocedure is applied to three numerical examples. This demon-strates its use in the design practices. Fig. 12 shows a simplysupported beam, a cantilever wall, and a fixed/roller-supportedbeam subjected to a variety of blast loadings. Examples I and IIItend to control the member’s responses at a very low performance
Fig. 11. Flowchart of the modified deformation-controlled blastresistant design depending on error indices ��1 ,�2 are arbitrarilysmall values�
level �Schmidt 2003�. Thus, a relatively higher target support ro-
tation of t=4o yt� l tan�t� /2 and �t=10 are used. However, tocontrol the response at a low performance level �Schmidt 2003�,Example II adopts the values of t=2o yt� l tan�t� and �t=6.Taking into account of the rebound effect of the structural mem-ber subsequent to its maximum displacement response, the area ofcompression reinforcement is taken to be equal to that of tensionreinforcement. In these numerical examples, the values for n andm are taken to be 5 so as to ensure a 95% probability for ym
rc and�rc of the designed members not exceeding the PHY-DTs of yt
and �t. The convergence conditions for � and d are defined as���1−�0� /�0� 0.001 and ��d1−d0� /d0� 0.001, respectively.
The initial values of �0 and d0 are taken as 1.00% and1,000 mm, respectively. Iterative values of key terms during thedesign process for these three numerical examples, with the modi-fied procedure depending on the error indices, are listed in Tables3–5. For comparison, the design of the members with the originalprocedure is also listed in Tables 3–5. It is noticed that there is nodifficulty in reaching convergence with the modified design pro-cedure. However, due to the adjustment of PAR-DTs from Eqs.�15� and �16� within the modified design procedure, more itera-tive steps and computation time are needed to reach the conver-gence as compared to those from the original design procedure.Also, the member design shows an obvious decline in � and someincrease in d with the modified procedure.
Numerical Verification
In order to check whether ymrc and �rc of the designed RC mem-
bers under the given blast loadings are controlled effectively bythe modified procedure, nonlinear finite-element analysis of themembers is performed. The simulation results are demonstrated inFig. 13, which shows the comparison between the modified andthe original design procedure ym
rc and �rc values of the members.Results indicate that the modified design procedure has over-
come the disadvantages existing in the control of ymrc and �rc for
both the simply supported beam and the cantilever wall. Using theoriginal design procedure, ym
rc slightly exceeds the target of yt, and
g ��0 ,SC�yte
�mm� �te
d1
�mm��1
�%�CPU
�time �s��
procedure
0.36910 184.35 13.885 583.36 1.374 0.178
0.24154 185.33 11.796 637.94 1.111
0.32950 184.56 13.161 658.28 1.005
0.36744 184.36 13.853 669.83 0.951
0.38709 184.28 14.241 675.79 0.925
0.39692 184.24 14.443 678.86 0.912
0.40190 184.23 14.547 680.45 0.905
0.40443 184.22 14.601 681.26 0.902
0.40573 184.22 14.629 681.67 0.900
0.40639 184.21 14.643 681.89 0.899
procedure
210.00 10.0 478.57 2.172 0.102
563.23 1.449
558.18 1.464
559.22 1.457
559.14 1.458
MPa. Convergence conditions: ���1−�0� /�0� 0.001 and ��d1−d0� /d0�
Table 3. Iterative Design of Simply Supported Beam �Example I�
Fig. 12. Three design examples: �a� a simply supported beam underthe blast loading �Design Example I�; �b� a cantilever wall under theblast loading �Design Example II�; and �c� fixed/roller-supportedbeam under the blast loading �Design Example III�
008
�rc is too conservative. The modified design procedure values ofym
rc and �rc for these two members both are approximated to theirrespective targets and restricted to be a little on the conservativeside. Besides, ym
rc seems to be controlled closer to its target than�rc due to the smaller standard deviation of ey. As for the fixed/roller-supported beam, due to the strict requirement of 95% prob-ability for ym
rc not exceeding yt, the control of ymrc seems to be
slightly more conservative than that by the original design proce-dure. However, in this example, �rc controlled is still much closerto �t by the modified procedure. Therefore, comparison of these
Table 4. Iterative Design of Cantilever Wall �Example II�
results demonstrates that the modified procedure by keeping ymrc
and �rc under control with respect to the design performancetargets is quite effective.
Conclusions
A blast-resistant design procedure for RC flexural members hasbeen presented in this paper. For blast-resistant designs, it wouldbe more ideal that the RC member does not exhibit a brittle fail-
g ��0 ,SC�yte
�mm� �te
d1
�mm��1
�%�CPU
�time �s��
procedure
0.45148 132.95 9.418 359.94 1.370 0.172
0.35733 134.08 8.205 467.57 0.731
0.53560 132.28 10.850 503.69 0.567
0.59327 131.94 12.113 520.56 0.509
0.61479 131.83 12.663 526.68 0.490
0.62222 131.79 12.865 528.77 0.483
0.62471 131.78 12.934 529.47 0.481
0.62553 131.78 12.957 529.70 0.481
0.62580 131.77 12.965 529.77 0.480
procedure
139.70 6.0 299.68 2.259 0.109
414.93 1.041
403.24 1.076
405.70 1.062
405.42 1.064
MPa. Convergence conditions: ���1−�0� /�0� 0.001 and ��d1−d0� /d0�
g ��0 ,SC�yte
�mm� �te
d1
�m��1
�%�CPU
�time �s��
procedure
0.47134 204.14 16.371 318.17 1.793 0.171
0.28944 205.96 12.614 400.33 1.071
0.45110 204.19 15.846 425.99 0.865
0.51233 204.08 17.548 441.04 0.774
0.54162 204.08 18.499 447.94 0.735
0.55445 204.09 18.949 451.09 0.719
0.56010 204.10 19.154 452.52 0.711
0.56262 204.10 19.247 453.16 0.708
0.56375 204.11 19.289 453.44 0.706
0.56425 204.11 19.307 453.57 0.706
procedure
210.00 10 263.55 3.016 0.109
356.72 1.201
367.90 1.330
360.55 1.401
360.90 1.402
MPa. Convergence conditions: ���1−�0� /�0� 0.001 and ��d1−d0� /d0�
ure associated with shear failure during loading, and is allowed toexperience flexural deformation. For this, adequate shear rein-forcement should be present to mitigate against the brittle failureassociated with shear failure. The proposed design method aimsto provide an iterative procedure for the design of the longitudinalreinforcement and effective depth more closely related to the de-sign of members for flexure. It has been demonstrated that theproposed procedure could incorporate the design performance cri-teria of maximum displacement and displacement ductility simul-taneously to give a unique design of a RC member under a givenblast loading on the basis of nondimensional energy spectra.Thus, the design values of d and � of the RC member can bespecifically determined. It could also keep the actual deformationresponses of the designed member under control in meeting de-sign performance criteria.
Although the design procedure presented tries to keep the re-sponses of the equivalent SDOF system under control such thatthe design performance targets are met �i.e., �eq=�t and ym
eq=yt�,numerical verification indicates that some errors do exist betweenthe responses of designed RC member �ym
rc and �rc� and theirrespective design targets �yt and �t�. This is due to some simpli-fying assumptions made in the derivation of d and � by convert-ing a continuous RC member into its equivalent SDOF system.However, since the RC member specifically is designed under agiven blast loading condition by the modified procedure, the for-mulas for quantifying the approximate errors are derived fromextensive numerical analysis and used for modifying the designprocedures.
Through the adjustment of parametric design targets using theformulas for y
rc and �rc, the modification of the design procedure
is accomplished to keep ymrc and �rc under control. The implemen-
tation of the modified design procedure into three numerical ex-amples indicates that more iterative steps are needed to reachconvergence as compared to those of the original design proce-dure. However, the responses of ym
rc and �rc for the member de-signed by the modified procedure from the nonlinear numericalanalysis are controlled. These are controlled approximately simi-larly to the design performance targets in a conservative manner.
Acknowledgments
This research was supported by Research Grant LEO 99.05 pro-vided by the Defense Science and Technology Agency �DSTA�,Singapore. Special thanks are due to John Crawford, President ofKaragozian and Case for his critical reading of the paper andmany invaluable suggestions for improvement.
Notation
The following symbols are used in this paper:C � Nondimensional energy factor;
DIF � dynamic increase factor;d � effective depth of the element measured from
the extreme compression fiber to the centroidtensile reinforcement;
d� � distance from the extreme compression fiberto the centroid of compression reinforcement;
Ec � Young’s modulus of elasticity for concrete;Eel � ultimate elastic energy;
Emax � maximum strain energy;
JOURNAL
Es � Young’s modulus of elasticity for steel;F1 � peak value of the force;
fc, fdc � strength of concrete in compression for thestatic and dynamic conditions;
fs, fds � strength of flexural steel in static anddynamic conditions, respectively;
f t, fdt � tensile strength of concrete in static anddynamic conditions, respectively;
KLE, KME � transformation load and mass factors,respectively;
ka � equivalent elastic stiffness for the RCelements;
ke � initial stiffness of the equivalent SDOFsystem of the designed RC member;
l � length of the member;m � equivalent mass of the equivalent SDOF
system;ma � mass of the RC member;Rm � ultimate strength of the equivalent SDOF
system;T � period;td � load duration;
Vc � shear capacity;Vu � ultimate shear force;ye
eq � elastic displacement response of the equivalentSDOF system of the designed RC memberunder the given blast loading;
yerc � Elastic displacement response of the designed
RC member at the significant point under thegiven blast loading;
ymeq � maximum displacement response of the
equivalent SDOF system of the designed RCmember under the given blast loading;
ymrc � maximum displacement response of the
designed RC member at the significant pointunder the given blast loading;
yt � target maximum displacement;yte � Parametric design target of displacement;� � convergence tolerance;� � reduction coefficient;
�eq � displacement ductility response of theequivalent SDOF system of the designed RCmember under the given blast loading;
�rc � displacement ductility response of thedesigned RC member at the significant pointunder the given blast loading;
crack formation and crack growth in concrete by means of fracturemechanics and finite elements.” Cem. Concr. Res., 6, 773–782.
Kottegoda, N. T., and Rosso, R. �1996�. Statistical, probability, and reli-ability for civil and environmental engineers, McGraw-Hill, NewYork.
Li, B., Huang, Z., Rong, H.-C., and Huang, Z. �2006�. “Deformation-controlled design of RC flexural members subjected to blast load-ings.” Proc., 2nd Int. Conf. on Design and Analysis of ProtectiveStructures, November 13–15, Singapore.
Malvar, L. J., and Crawford, J. E. �1998a�. “Dynamic increase factors forconcrete.” Proc., 28th of the Department of Defense Explosives SafetyBoard Seminar, Orlando, Fla., U.S. Department of Defense, Washing-ton, D.C.
Malvar, L. J., and Crawford, J. E. �1998b�. “Dynamic increase factors forsteel reinforcing bars.” Proc., 28th of the Department of Defense Ex-plosives Safety Board Seminar, Orlando, Fla., U.S. Department ofDefense, Washington, D.C.