DEGRADACIÓN FOTOCATALÍTICA DEL COLORANTE ORANGE II USANDO ZEOLITA X, SINTETIZADA A PARTIR DE CENIZAS VOLANTES, COMO SOPORTE CATALÍTICO María Margarita Guerra Núñez Universidad Nacional de Colombia Facultad de ingeniería Departamento de Ingeniería Química Bogotá, Colombia 2016
Transcript
DEGRADACIÓN FOTOCATALÍTICA DEL COLORANTE ORANGE II
USANDO ZEOLITA X, SINTETIZADA A PARTIR DE CENIZAS VOLANTES,
COMO SOPORTE CATALÍTICO
María Margarita Guerra Núñez
Universidad Nacional de Colombia
Facultad de ingeniería
Departamento de Ingeniería Química
Bogotá, Colombia
2016
II Photocatalytic degradation of Orange II dye using zeolite X - Fe catalyst synthesized
from coal fly ash
III
PHOTOCATALYTIC DEGRADATION OF ORANGE II DYE USING ZEOLITE
X - Fe CATALYST SYNTHESIZED FROM COAL FLY ASH
María Margarita Guerra Núñez
Universidad Nacional de Colombia
Facultad de ingeniería
Departamento de Ingeniería Química
Bogotá, Colombia
2016
PHOTOCATALYTIC DEGRADATION OF ORANGE II DYE USING ZEOLITE
X - Fe CATALYST SYNTHESIZED FROM COAL FLY ASH
María Margarita Guerra Núñez
Tesis de investigación presentada como requisito parcial para optar al título de:
Magister en Ingeniería Química
Director:
Ph.D. José Herney Ramírez Franco
Línea de Investigación:
Materiales y Tratamiento de residuos acuosos
Grupo de Investigación:
Materiales, Catálisis y Medio Ambiente
Universidad Nacional de Colombia
Facultad de ingeniería
Departamento de Ingeniería Química
Bogotá, Colombia
2016
To my grandmother, Sandiego, who with her courage
shows me how big and powerful is the soul force.
VIII Photocatalytic degradation of Orange II dye using zeolite X - Fe catalyst synthesized
from coal fly ash
Acknowledgments
I want to express my thanks for the support in the realization of this master's thesis to:
Universidad Nacional de Colombia for the academic and financial support during the master
and the research.
Logistica, Cuidado y Ambiente Ltda. for providing fly ash and the economic support for the
materials characterization.
Stevens Institute of Technology for Scanning Electron Microscopy training, especially to
Tsengming Chou for the support in the catalysts characterization.
My thesis director, José Herney Ramirez Franco for letting me know zeolites, for his
confidence in my work, his scientist advice and encouragement to direct the research toward
achievements.
Hugo Ramirez Zea for his academic support.
Alis Pataquiva, who provided me the tools for the Total Organic Carbon quantification.
Hernán Yanguatin, who with his research allowed me to continue in the way.
Jhon Anderson Aragón Quiroz for his help in analyzing materials by adsorption/desorption
of N2.
Francisco Quintero and Pedro Arias by the companionship, the advice and supervision of
the document.
The operators of Chemical Engineering Laboratory especially to Ricardo Cortés and Edgar
Martinez.
My parents, siblings, grandparents and Julio for their love, support and patience.
IX
Abstract and Resumen XI
Abstract
The degradation of Orange II dye (OII) by a heterogeneous photoFenton process using Fe
catalysts supported on zeolite was studied. Zeolite X was synthesized by hydrothermal
treatment from fly ash, which is a solid waste from the thermoelectric company,
Termotasajero S.A, located in Norte de Santander. The reported synthesis methodology
was optimized, evaluating aging and time of hydrothermal treatment. The synthetic zeolite,
with high BET surface area, was modified by a impregnation process to deposite different
amounts of iron. Iron nitrate nonahydrated, Fe(NO3)3.9H2O, was the precursor salt and the
prepared catalyst had 8.1 wt% y 10.3 wt% of Fe. The support and catalysts were
characterized by Xray diffraction (XRD), N2 adsorption/desorption, X-ray fluorescence
(XRF), Thermogravimetric analysis (TGA) and Scanning Electron Microscopy (SEM). The
effect of the initial concentrations of OII and H2O2, and the iron load in the support on the
degradation rate of OII was investigated by carrying out experiments in a batch reactor and
to a fixed pH value. The experiments were carried out according to an experimental
response surface design and the OII concentration histories (i.e., concentration evolution
along reaction time) were studied by UV spectrophotometry at a wavelength of 486 nm. The
dye photodegradation was described by a simple semi-empirical kinetic model, based on
the Fermi’s equation. The model was fitted to the dye concentration histories, being the
kinetic parameters determined by nonlinear regression. The catalysts showed very good
catalytic performances, with color degradations degrees as high as 90% after 3 hours. The
initial concentration of OII was the most influential variable in the dye degradation and the
iron leaching from the support was negligible, allowing the use of the catalyst in consecutive
reaction cycles. The contribution in color photodegradation due to the presence of 1 wt%
1.3.2 Nature, structure and properties of zeolites ............................................ 11 1.3.2 Zeolites synthesis................................................................................... 13
1.4 Zeolite X ......................................................................................................... 17 1.4.2 Structure, chemical composition and properties ..................................... 17 1.4.2 Zeolite X synthesis ................................................................................. 17
2. Synthesis and characterization of zeolite X from coal fly ash ....................................... 19
2.1.1 Materials and characterization................................................................ 21 2.1.2 Zeolite synthesis .................................................................................... 22
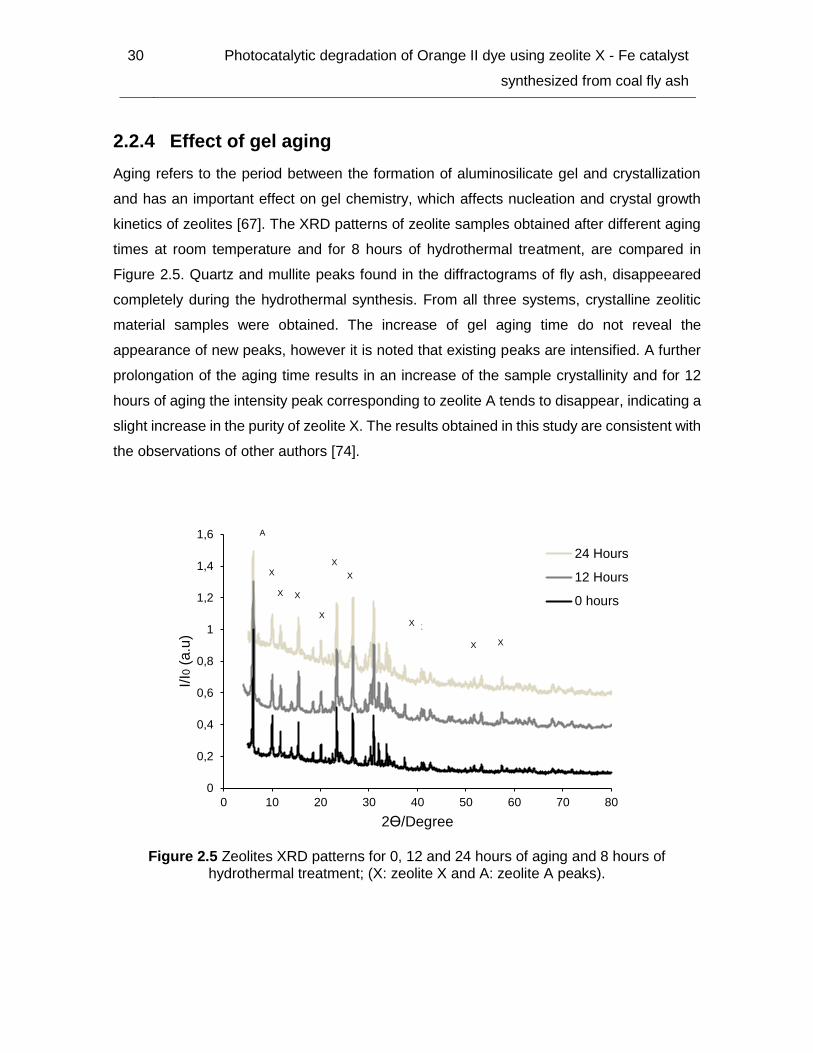
2.2 Results and discussion ................................................................................... 22 2.2.2 Physical and Chemical properties of fly ash ........................................... 22 2.2.3 Effects of time of hydrothermal treatment ............................................... 26 2.2.4 Effect of gel aging .................................................................................. 30
4.2 Results and discussion ................................................................................... 53 4.2.1 Analysis of experimental design ............................................................. 54 4.2.2 Effect of initial Orange II concentration ................................................... 58 4.2.3 Effect of initial H2O2 concentration .......................................................... 60 4.2.4 Effect of Fe load onto support ................................................................ 61 4.2.5 Effect of initial pH ................................................................................... 63 4.2.6 Catalyst stability ..................................................................................... 63 4.2.7 Kinetic model ......................................................................................... 65
Conclusions .................................................................................................................. 71 5. Degradation of wastewater from a clinical laboratory ................................................... 75
The morphology of the catalysts was analyzed by scanning electron microscopy (SEM).
Experiments were carried out with a Zeiss Auriga Small Dual-Beam FIB-SEM microscope.
Chemical composition was analysed by X-ray fluorescence in a Magix Pro PW – Philips
apparatus equipped with a rhodium tube of 4 kW of maximum power. Finally, X-ray
Diffraction (XRD) measurements were performed using a Panalytical X’Pert PRO MPD
diffractometer.
3.2 Results and discussion
3.2.2 Physical and Chemical properties of catalysts
The chemical compositions of the materials, expressed as equivalent wt%, were analyzed
by XRF and results are shown in Table 3.1. The most abundant components in the catalysts
were found to be the oxides SiO2 and Al2O3 which are the constituents of zeolite framework.
There is also, the presence of small amounts of other metallic oxides. The most important
changes in catalysts are the increase in the amount of iron compared to the zeolite. The wet
40 Photocatalytic degradation of Orange II dye using zeolite X - Fe catalyst
synthesized from coal fly ash
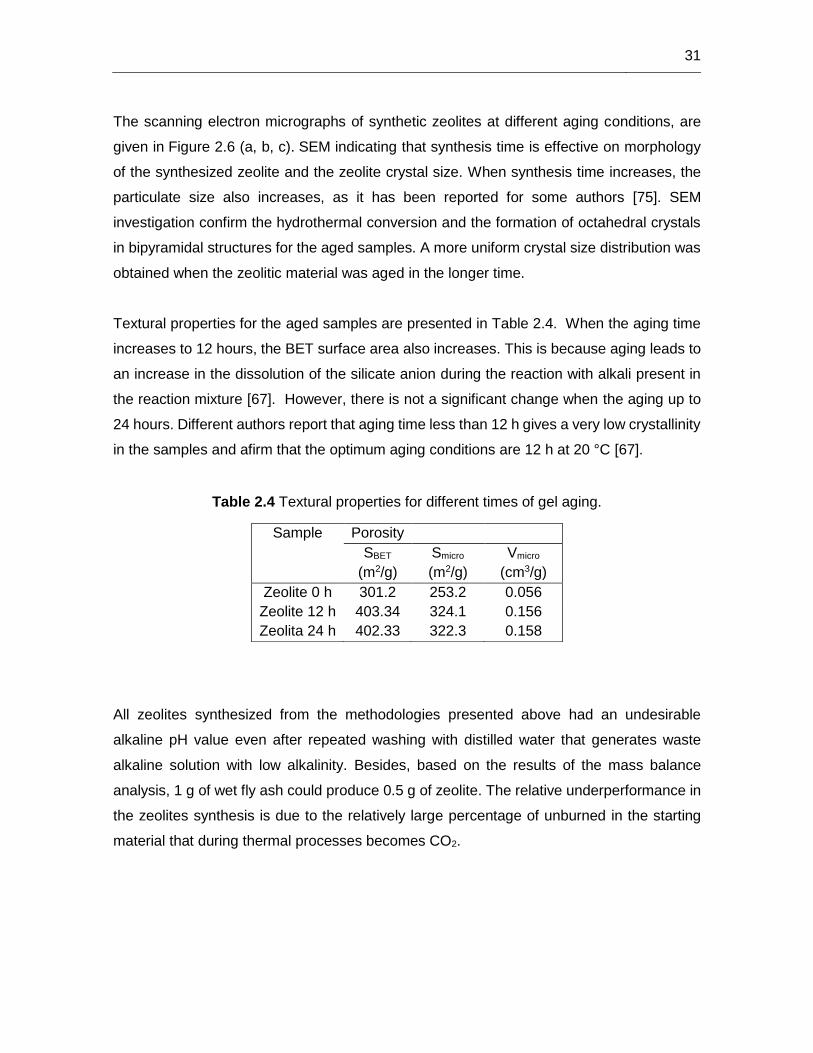
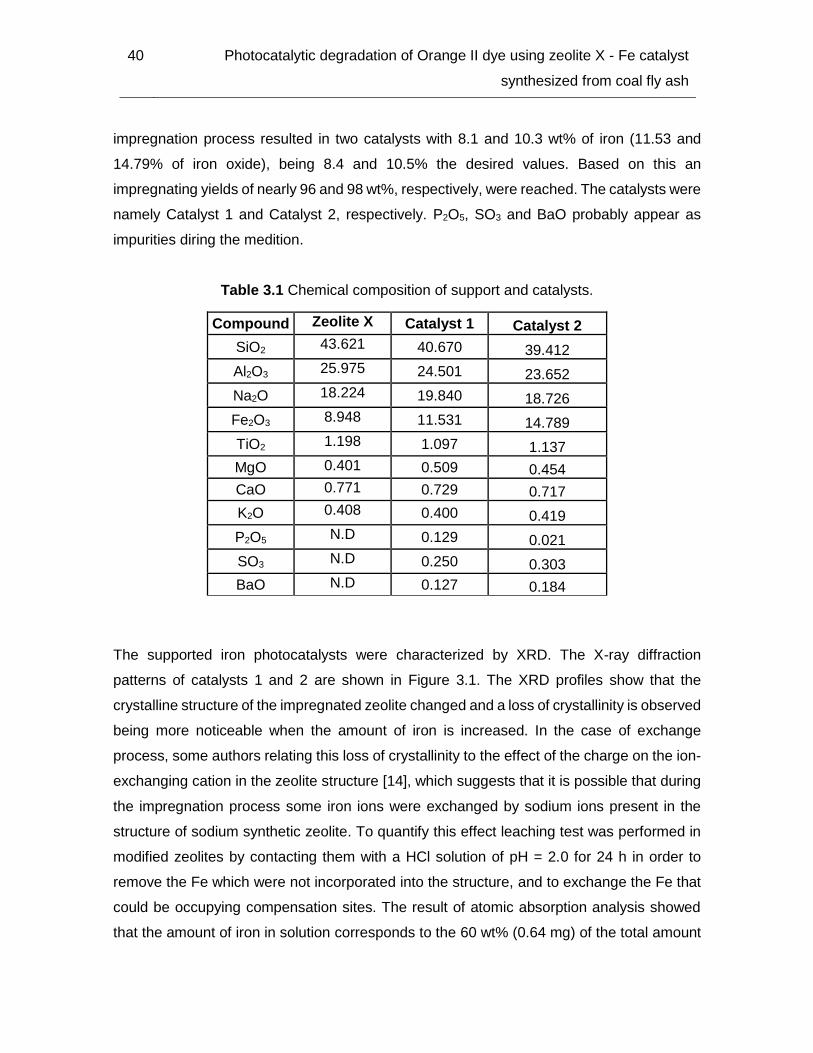
impregnation process resulted in two catalysts with 8.1 and 10.3 wt% of iron (11.53 and
14.79% of iron oxide), being 8.4 and 10.5% the desired values. Based on this an
impregnating yields of nearly 96 and 98 wt%, respectively, were reached. The catalysts were
namely Catalyst 1 and Catalyst 2, respectively. P2O5, SO3 and BaO probably appear as
impurities diring the medition.
Table 3.1 Chemical composition of support and catalysts.
Compound Zeolite X Catalyst 1 Catalyst 2
SiO2 43.621 40.670 39.412
Al2O3 25.975 24.501 23.652
Na2O 18.224 19.840 18.726
Fe2O3 8.948 11.531 14.789
TiO2 1.198 1.097 1.137
MgO 0.401 0.509 0.454
CaO 0.771 0.729 0.717
K2O 0.408 0.400 0.419
P2O5 N.D 0.129 0.021
SO3 N.D 0.250 0.303
BaO N.D 0.127 0.184
The supported iron photocatalysts were characterized by XRD. The X-ray diffraction
patterns of catalysts 1 and 2 are shown in Figure 3.1. The XRD profiles show that the
crystalline structure of the impregnated zeolite changed and a loss of crystallinity is observed
being more noticeable when the amount of iron is increased. In the case of exchange
process, some authors relating this loss of crystallinity to the effect of the charge on the ion-
exchanging cation in the zeolite structure [14], which suggests that it is possible that during
the impregnation process some iron ions were exchanged by sodium ions present in the
structure of sodium synthetic zeolite. To quantify this effect leaching test was performed in
modified zeolites by contacting them with a HCl solution of pH = 2.0 for 24 h in order to
remove the Fe which were not incorporated into the structure, and to exchange the Fe that
could be occupying compensation sites. The result of atomic absorption analysis showed
that the amount of iron in solution corresponds to the 60 wt% (0.64 mg) of the total amount
41
of iron impregnated in the catalyst, aproximately. Thus, there is a possibility that a part of
iron added on zeolite has been exchanged for sodium ions during the impregnation process.
This could explain the loss of crystallinity of the prepared catalysts. Assuming an idealized
cell cubic Fd 3 m (Faujasite), the size of the unit cell of the support corresponds to 25.099
��.
The results of XRD studies of native and Fe-modified zeolites confirmed the stability of all
the zeolite structures against the impregnation and/or calcination procedure. Independently
from the Fe-loading and the small amount of exchanged iron, oxide species were not
recognized in diffractograms of Fe-modified zeolites which has already been reported before
in other work [82]. This point out that Fe is well dispersed. However it is observed that the
impregnation process results in a displacement of the diffraction profiles in the synthesized
catalysts which agrees with the assumption a possible small exchange of sodium ions for
larger iron ions. The representative peak of the zeolite X is then maintained after
impregnation.
Figure 3.1 XRD profiles for support (Zeolite X) and the catalysts.
0
0,5
1
1,5
2
2,5
0 20 40 60 80
I/I0
(a.u
)
2ϴ/Degree
X
AX
X
X
X
XX
X X X
X X XX X X X
A
Zeolite X
Catalyst 1
Catalyst 2
42 Photocatalytic degradation of Orange II dye using zeolite X - Fe catalyst
synthesized from coal fly ash
N2 adsorption/desorption isotherms at 77 K of Zeolite X sample and catalysts are showed in
Figure 3.2. It can be observed that the adsorption and desorption isotherms are not the
same for a specified region of relative pressures.
Figure 3.2 N2 adsorption/desorption isotherms at -196ºC. (a) Zeolite, (b) Catalyst 1 and (c) Catalyst 2.
43
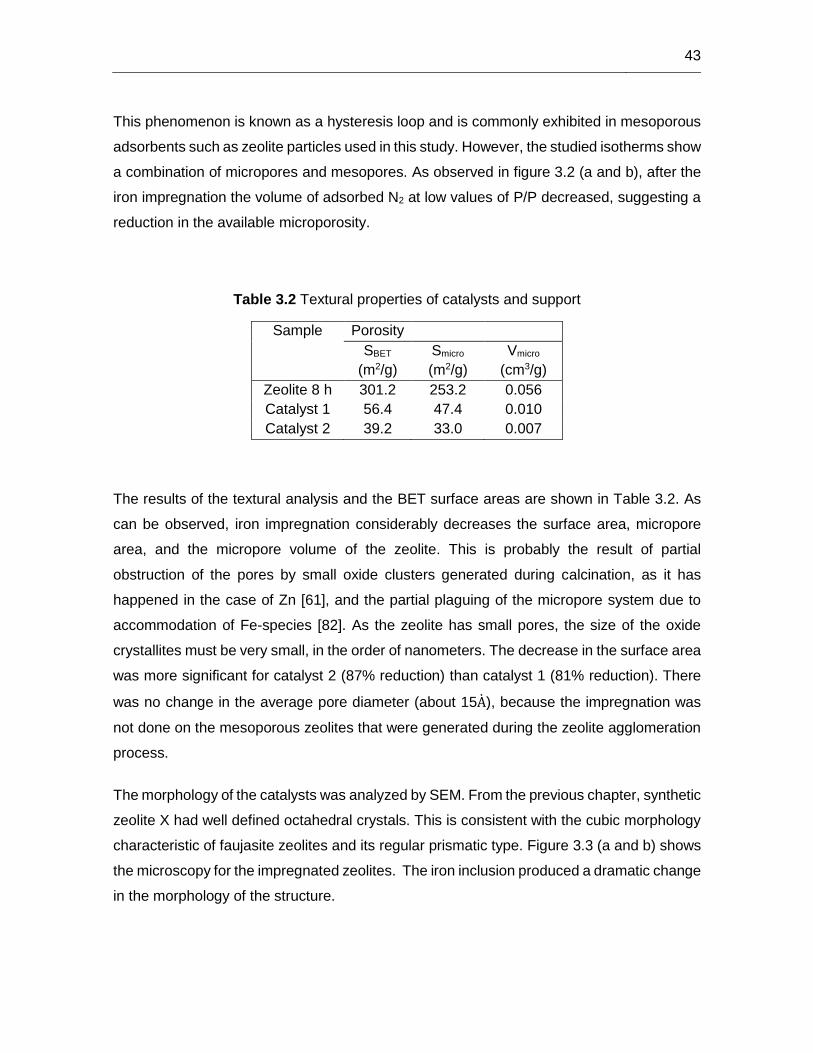
This phenomenon is known as a hysteresis loop and is commonly exhibited in mesoporous
adsorbents such as zeolite particles used in this study. However, the studied isotherms show
a combination of micropores and mesopores. As observed in figure 3.2 (a and b), after the
iron impregnation the volume of adsorbed N2 at low values of P/P decreased, suggesting a
reduction in the available microporosity.
Table 3.2 Textural properties of catalysts and support
Sample Porosity
SBET
(m2/g)
Smicro
(m2/g)
Vmicro
(cm3/g)
Zeolite 8 h 301.2 253.2 0.056
Catalyst 1 56.4 47.4 0.010
Catalyst 2 39.2 33.0 0.007
The results of the textural analysis and the BET surface areas are shown in Table 3.2. As
can be observed, iron impregnation considerably decreases the surface area, micropore
area, and the micropore volume of the zeolite. This is probably the result of partial
obstruction of the pores by small oxide clusters generated during calcination, as it has
happened in the case of Zn [61], and the partial plaguing of the micropore system due to
accommodation of Fe-species [82]. As the zeolite has small pores, the size of the oxide
crystallites must be very small, in the order of nanometers. The decrease in the surface area
was more significant for catalyst 2 (87% reduction) than catalyst 1 (81% reduction). There
was no change in the average pore diameter (about 15A), because the impregnation was
not done on the mesoporous zeolites that were generated during the zeolite agglomeration
process.
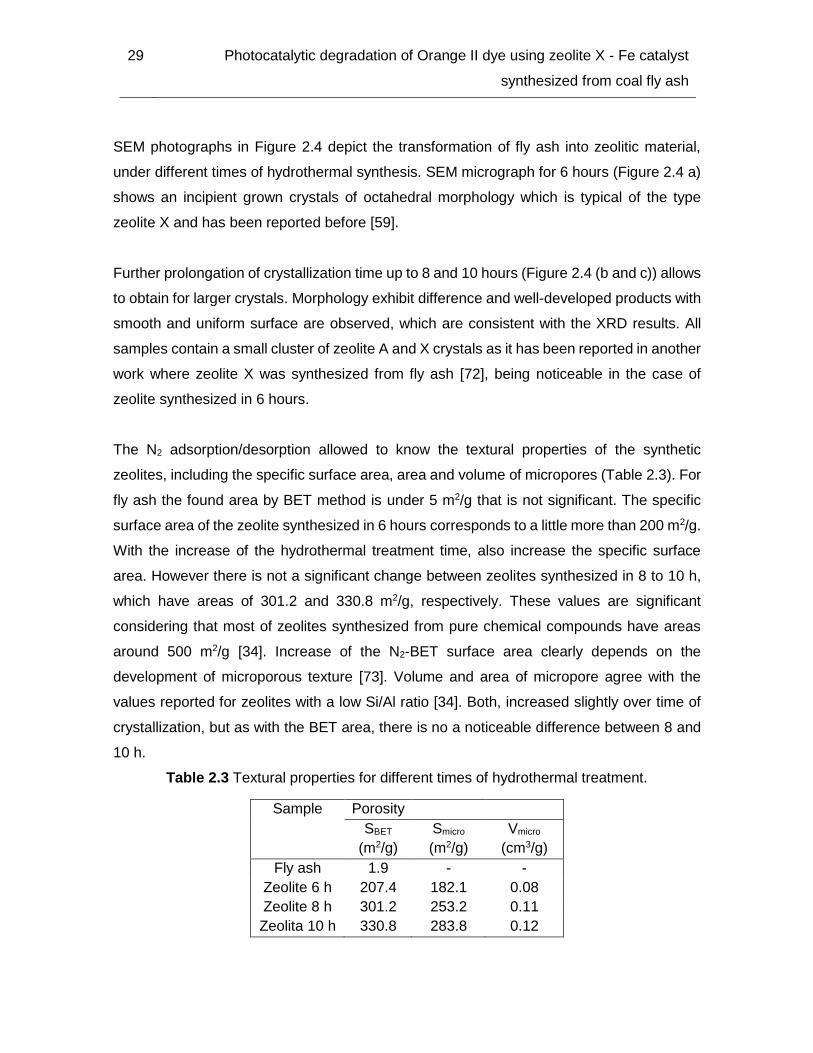
The morphology of the catalysts was analyzed by SEM. From the previous chapter, synthetic
zeolite X had well defined octahedral crystals. This is consistent with the cubic morphology
characteristic of faujasite zeolites and its regular prismatic type. Figure 3.3 (a and b) shows
the microscopy for the impregnated zeolites. The iron inclusion produced a dramatic change
in the morphology of the structure.
44 Photocatalytic degradation of Orange II dye using zeolite X - Fe catalyst
synthesized from coal fly ash
Figure 3.3 SEM images for: a. Catalyst 1 (200 nm) and b. Catalyst 2 (200 nm).
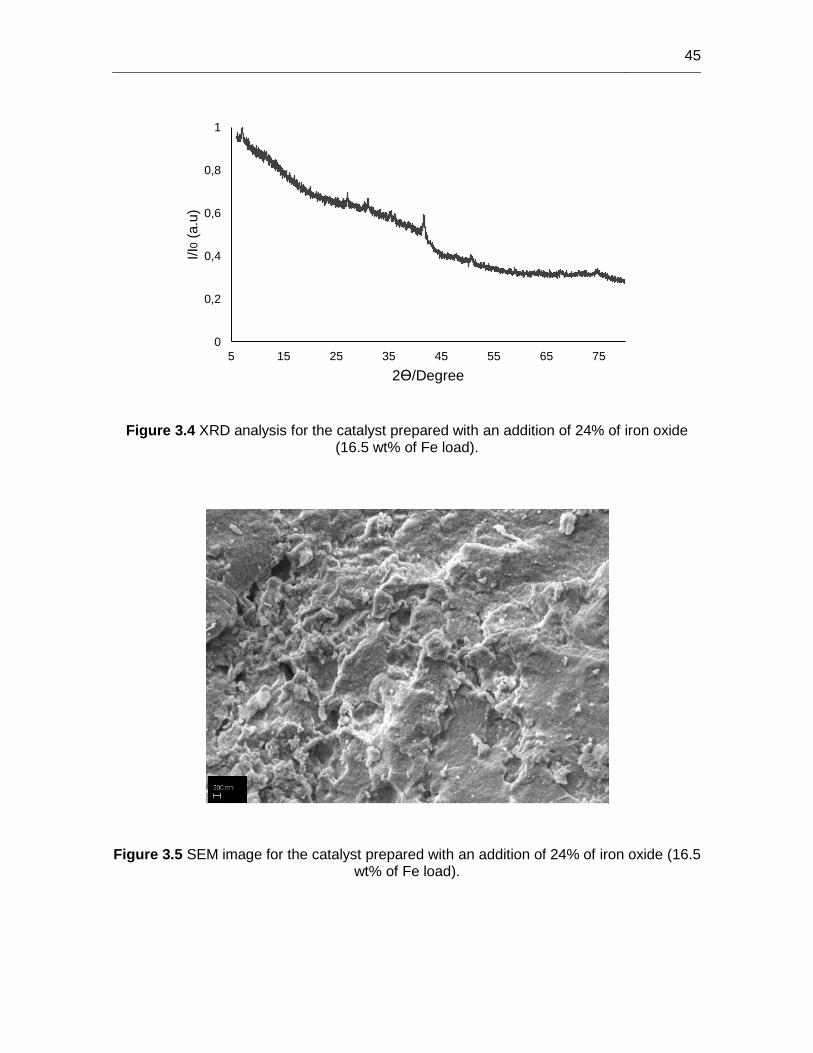
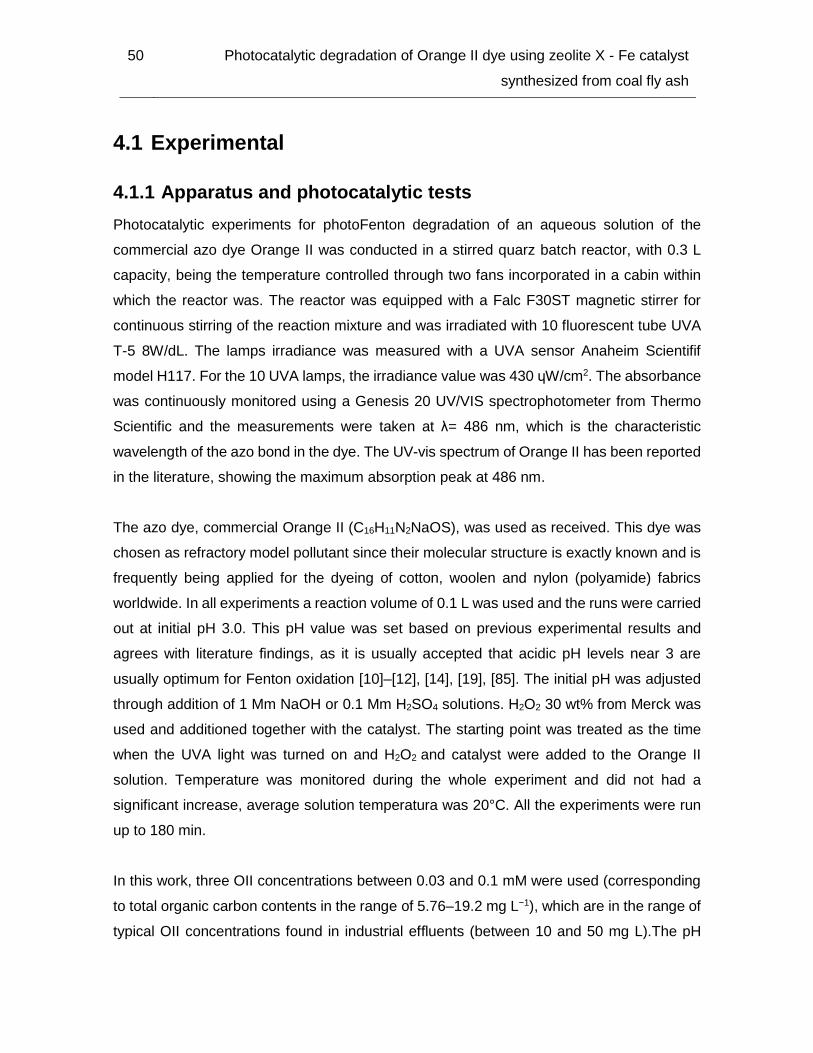
When the Fe load onto the support is increased to 16.5 wt% (24 wt% of iron oxide), there is
a total loss of structure and crystallinity of the zeolite. In addition, the value of the BET
surface area decreases from 301.2 m2/g to 2 m2/g, reflecting that the textural properties are
affected by an increase in the amount of iron greater than 10 wt%. These findings are
demonstrated in the SEM and XRD analysis (Figures 14 and 15).
a
b
45
Figure 3.4 XRD analysis for the catalyst prepared with an addition of 24% of iron oxide (16.5 wt% of Fe load).
Figure 3.5 SEM image for the catalyst prepared with an addition of 24% of iron oxide (16.5 wt% of Fe load).
0
0,2
0,4
0,6
0,8
1
5 15 25 35 45 55 65 75
I/I0
(a.u
)
2ϴ/Degree
46 Photocatalytic degradation of Orange II dye using zeolite X - Fe catalyst
synthesized from coal fly ash
Conclusions
Synthetic zeolite X have been employed as support for iron particles with the aim of using it
in PhotoFenton process. A conventional impregnation process was used as a method for
incorporate iron in zeolite surface from iron nitrate. The characterization analysis showed a
good Fe dispersion onto the surface. X ray diffractograms and SEM images reveal the
crystallinity loss of the catalysts when the amount of impregnated iron increases. Likewise
according the BET area, the surface area of the zeolite decreases 81% in the case of the
catalyst with 12% iron oxide and 87% in the catalyst 2 having 15% iron oxide.
47
48 Photocatalytic degradation of Orange II dye using zeolite X - Fe catalyst
synthesized from coal fly ash
4. Photocatalytic degradation of Orange II dye
Abstract
The main variables during Orange II photodegradation were investigated. An experimental
design was raised to optimize the reaction rate in the oxidation of the dye. Effects of the
initial concentrations of contaminants and hydrogen peroxide, and the iron load in the used
catalysts were determined. A semi-empirical model based on the Fermi´s equation to
describe the rate of degradation of Orange II was used. The multivariate experimental
design allowed to develop a quadratic models for the reaction rate, with adequate predict
responses within the experimental range. It was found that both initial H2O2 and OII
concentration have an important effect in the organic matter degradation efficiency. The
TOC removal at the optimal conditions was closed to 50% after 180 minutes. The TiO2
presence in zeolite and catalysts was evaluated in the Orange II photodegradation.
Introduction
The wastewater toxicity from textile industry is the result of the presence of salts such as
NaCl and Na2SO4, surfactants such as phenols, heavy metals in the dyes, organic
compounds such as chlorinated solvents (from the washing and cleaning machines),
biocides as pentachlorophenol (from contaminated wool fiber) and toxic anions such as
sulfide (present in some dyes), among others (Bae et al., 2005). However, dyes have the
most attention in wastewaters of textile industry because are designed to be highly resistant,
even to microbial degradation, that is why they are difficult to remove in conventional
wastewater treatment plants.
Orange II, sodium salt of 4- (2-hydroxy-1-naphthalene) azo benzene sulfonic acid, it is a
monosulfated acid colorant, monoazo type, much studied. Has a high solubility in water due
49
to the group -SO3- and its color is due mainly to the azo group (-N = N-), common to most
dyes. Degradation and mineralization of this dye has been developed by many technologies
and chemical, physical and biological treatments.
Considering the AOPs technologies, the photofenton heterogeneous process has used a
different variety of catalysts and many variables have been studied. Iron species supported
onto carbon, zeolites, ashes and others has been used in Orange II photodegradation. As
to the variables, the pH is the most important variable because it limits the use and
effectiveness of the photocatalytic process for the pollutant treatment. Many works have
studied Orange II degradation and have ensured that 3 is the optimal value to initite the
oxidation reactions needed. Likewise, the effect of the initial pollutant concentration, as it is
of importance in any process of wastewater treatment, has also been investigated. In
general, the higher the initial dye concentration, the higher is the time required to degrade
and decolorise it completely. The dye concentration histories can be affected by the
hydrogen peroxide concentration. Usually, when the initial load of H2O2 is high, degradation
occurs very quickly. But when the initial dosage change from a narrow range, although
differences between dye concentration histories exist, they are small.
Meanwhile, another AOPs, heterogeneous photocatalysis, commonly uses titanium dioxide
(TiO2) in anatase crystalline form, to generate hydroxyl radicals and oxidize contaminants.
In this regard many works studying the degradation of some pollutants with heterogeneous
photocatalysis from TiO2 have been published [20], [83], [84].
In this chapter photodegradation of acid Orange II was studied in detail using solid Fe-zeolite
as a heterogeneous catalyst. An experimental design based on a Box Behnken with 3 central
points design will be employed to study the effects of the initial dye concentration, initial
H2O2 load and the iron load supported on the color degradation rate. The photodegradation
was described by a simple semi-empirical kinetic model, based on the Fermi’s equation. The
TiO2 contribution in the photocatalytic process was also investigated.
50 Photocatalytic degradation of Orange II dye using zeolite X - Fe catalyst
synthesized from coal fly ash
4.1 Experimental
4.1.1 Apparatus and photocatalytic tests
Photocatalytic experiments for photoFenton degradation of an aqueous solution of the
commercial azo dye Orange II was conducted in a stirred quarz batch reactor, with 0.3 L
capacity, being the temperature controlled through two fans incorporated in a cabin within
which the reactor was. The reactor was equipped with a Falc F30ST magnetic stirrer for
continuous stirring of the reaction mixture and was irradiated with 10 fluorescent tube UVA
T-5 8W/dL. The lamps irradiance was measured with a UVA sensor Anaheim Scientifif
model H117. For the 10 UVA lamps, the irradiance value was 430 ɥW/cm2. The absorbance
was continuously monitored using a Genesis 20 UV/VIS spectrophotometer from Thermo
Scientific and the measurements were taken at λ= 486 nm, which is the characteristic
wavelength of the azo bond in the dye. The UV-vis spectrum of Orange II has been reported
in the literature, showing the maximum absorption peak at 486 nm.
The azo dye, commercial Orange II (C16H11N2NaOS), was used as received. This dye was
chosen as refractory model pollutant since their molecular structure is exactly known and is
frequently being applied for the dyeing of cotton, woolen and nylon (polyamide) fabrics
worldwide. In all experiments a reaction volume of 0.1 L was used and the runs were carried
out at initial pH 3.0. This pH value was set based on previous experimental results and
agrees with literature findings, as it is usually accepted that acidic pH levels near 3 are
usually optimum for Fenton oxidation [10]–[12], [14], [19], [85]. The initial pH was adjusted
through addition of 1 Mm NaOH or 0.1 Mm H2SO4 solutions. H2O2 30 wt% from Merck was
used and additioned together with the catalyst. The starting point was treated as the time
when the UVA light was turned on and H2O2 and catalyst were added to the Orange II
solution. Temperature was monitored during the whole experiment and did not had a
significant increase, average solution temperatura was 20°C. All the experiments were run
up to 180 min.
In this work, three OII concentrations between 0.03 and 0.1 mM were used (corresponding
to total organic carbon contents in the range of 5.76–19.2 mg L−1), which are in the range of
typical OII concentrations found in industrial effluents (between 10 and 50 mg L).The pH
51
value for the 0.1 mM Orange II solution is 6.0. For the calibration a concentration curve of
the dye was elaborated according to the absorbance medition in a range of Orange II
concentration between 0.005-0.1 mM. Samples were withdrawn from the reactor at several
times, for the absorbance monitoring, filtered and the reaction was stopped by adding
excess Na2SO3 (from Merck), which instantaneously consumes the remaining hydrogen
peroxide. At the end of each run, the iron leaching from the support, for catalyst 1 and 2,
was quantified by atomic absorption using a Thermo Electron Corporation spectrometer, S
series. Total organic carbon was measured by catalytic oxidation using a Shimadzu
analyzer, model TOC.L. TOC values represent the average of three measurements.
The contribution of heterogeneous photocatalysis in the dye photodegradation due to the
content of TiO2 in the catalysts was investigated.
4.1.2 Experimental design
The experimental design studies how to vary the usual process conditions to increase the
likelihood of detecting significant changes in the response; thus a better understanding of
the process behavior is obtained. For this case, the objective is to maximize the decolorizing
rate with the best arrangement of the studied variables.
Box Behnken experimental design was used to obtain response surfaces while minimizing
the number of experiments. Given a normal distribution in the response variable, its possible
to ensure that the standard deviation of the experiments at the centre point is representative
of the standard deviation of the entire model, even beyond the design limits. This
experimental design was selected because is an independent quadratic design in that it
does not contain an embedded factorial or fractional factorial design. The treatment
combinations are at the midpoints of edges of the process space and at the center. Box
Behnken have fewer design points, they can be less expensive to do than central composite
designs with the same number of factors. However, because they do not have an embedded
factorial design, they are not suited for sequential experiments. Therefore the higher the
number of repetitions of experiments in the centre point, greater reliability in the standard
deviation, as representative of the entire design [86].
52 Photocatalytic degradation of Orange II dye using zeolite X - Fe catalyst
synthesized from coal fly ash
A Box Behnken experimental design was used to model and optimize the process
conditions. The response surface design considered 3 centre points and the Minitab 17
software was used to describe the run order and the data analysis calculated from the
experimental responses. The model considered to describe the data was a second-order
polynomial, and the corresponding coefficients were calculated from the experimental
responses by means of least squares regression. Table 4.1 summarizes the conditions of
all experiments performed. Runs were conducted by varying the initial concentration of the
dye (0.03, 0.05 and 0.1 mM), the H2O2 dosage (5, 10 and 15 mM) and the iron oxide load in
catalysts (9, 12, 15 wt% of iron oxide). In such experiments the catalyst dose (load of Fe-
zeolite in the batch reactor) was always 100 mg L−1.
Table 4.1 Order and conditions employed in each run, pH:3 and catalyst load: 0.1g L-1.
RunOrder [OII] (mM)
Iron oxide
load (%)
[H2O2]
(mM)
1 0.03 15 10
2 0.03 12 15
3 0.1 12 15
4 0.05 15 15
5 0.05 9 5
6 0.05 15 5
7 0.05 12 10
8 0.05 12 10
9 0.05 9 15
10 0.03 9 10
11 0.05 12 10
12 0.1 15 10
13 0.1 12 5
14 0.03 12 5
15 0.1 9 10
53
4.2 Results and discussion
In order to check the efficiency of the photofenton process, initial or blank experiments were
developed to know the effect on color degradation caused by the presence of the zeolite,
hydrogen peroxide and iron ions in the orange II solution (0.05 mM), separately. Fenton
process with the catalyst 2 was investigated.
Blank experiments are shown in Figure 4.1. Results showed that neither decolorizing of
Orange II occurs in the presence of Fe ions alone from the synthetic catalyst (Figure 4.1 A).
The Fe ions alone do not constitute an oxidizing agent and without the presence of hydrogen
peroxide there no generation of hydroxyl radicals. Color removal was also negligible in the
presence of only H2O2 (<1.5% after 3 hours) as shown in the Figure (4.1 B). The amount of
hydroxyl radicals (oxidation potential 2.80 V) formed in this case is almost insignificant, but
the own oxidant action of H2O2 (oxidation potential 1.78 V) justifies the results obtained [85].
Data for A and B are overlayed in Figure 4.1, for this reason only one data serie is observed.
For the Fenton reaction, color degradation increased slightly respect the previous blanks,
but without a significant effect. When the UVA light is incorporated to the H2O2-dye system,
the color degradation increase considerably (>95% after 3 hours). The color removal is high
in this case due to the peroxide photolysis (equations. 3 and 4), reaching color removal of
99% in three hours.
Figure 4.1 Color degradation of Orange II at pH=3 and 0.1g/L of catalyst, A. Fe ions alone (catalyst 2); B. H2O2 alone (10mM); C. Fenton (Catalyst 2 + H2O2 (10mM)); D. H2O2
(10mM) + UVA (10 lamps).
0
0,2
0,4
0,6
0,8
1
0 0,5 1 1,5 2 2,5 3
C/C
0
Time (h)
A
B
C
D
54 Photocatalytic degradation of Orange II dye using zeolite X - Fe catalyst
synthesized from coal fly ash
The Orange II adsorption on synthetic zeolite was also studied. 30 mg of zeolite were added
in 100 ml of Orange II solution (0.1 mM) at pH 3, and the absorbance medition was made
during 24 hours. After three hours, the Orange II concentration had decreased 13.96% and
21 hours later 19%. The amount of Orange II adsorbed by zeolite was calculated by using
the following formula:
Qt =(C0 − Ct)V/1000
W
(13)
where 𝑄𝑡 is the amount of Orange II adsorbed on the zeolite at time t (mg/g), 𝐶0 and 𝐶𝑡 are
initial and concentration at time t of Orange II (mg/L), respectively, V is the volume of Orange
II solution (mL), and W is the weight of the zeolite (g). Quantities of Orange II absorbed at 3
and 24 hours were 0.83 mg/g and 2.17 mg/g, respectively. These amounts are low when
compared with results in other zeolites, wherein the amount of dye may be 8.13 mg/g in 1
hour [87]. But since the zeolitic material is a mixture of zeolites, despite the valuable sorption
characteristics provided by the combination of ion exchange and molecular-sieve properties
in zeolite X, the presence of a more closed structure, as zeolite A, make the adsorption
capacity decrease, as has been shown in another study [88]. It is not posible to ensure if
this adsorption is an advantage or not. While most authors consider positive the
preconcentration of the organic substrates to be oxidized in the vicinity of reactive centres,
others affirm to be a disadvantage to consider that the predominant degradation pathway is
the attack of HO. species on the organic contaminants fraction that is freely dissolved in the
aqueous pore volumen and the adsorbed fraction is nearly unreactive [8].
Fenton process showed poor performance with respect to the photocatalytic process. This
means that H2O2 photolysis plays an important role in the degradation of Orange II. However
the combination of the two processes allows degradation at the highest reaction rate, as will
be shown next.
4.2.1 Analysis of experimental design
As above-mentioned, the objective function to maximize is the reaction rate. A Box Behnken
design (response surface design) was carried out considering three variables: initial
concentration of H2O2, initial concentration of Orange II solution and Fe load in catalyst. The
55
ranges considered for the operating variables were chosen based on literature findings [11],
[12], [25], [89]. In the case of Orange II, concentrations found in industrial effluents are
between 0.02 and 0.15 mM [14].
The 15 experiments indicated in Table 4.1 include the experiments needed to evaluate the
cross-effects between variables and three centre points. The minitab software provided the
order of the experiments in order to minimize systematic errors. The reaction rates were
calculated according to the semi-empirical kinetic model, based on the Fermi’s equation.
The model development and the algorithm used for the experimental data fitting are
presented in section 4.2.7. But in the Table 4.2, data of reaction rate constants obtained for
the 15 runs (experimental design) are presented.
Table 4.2 Conditions employed in the runs performed, and kinetic parameters obtained
after regression using Equation. (20) (CCat= 100 mg L−1).
Run
order
Fe Load
(%)
[OII]
mM
[H2O2]
mM
k (h-1) kcv
(%)
t* (h) t*cv
(%)
r2
Run 1 12 0.03 15 4.716 10.05 0.49 4.78 0.979
Run 2 12 0.1 5 1.866 4.18 1.35 1.98 0.990
Run 3 12 0.1 15 3.252 4.24 0.83 1.61 0.995
Run 4 15 0.05 15 4.464 6.45 0.60 2.52 0.992
Run 5 9 0.1 10 1.410 4.68 1.66 2.11 0.980
Run 6 9 0.05 5 2.472 7.28 0.80 3.53 0.980
Run 7 15 0.03 10 4.026 8.35 0.54 4.01 0.980
Run 8 9 0.03 10 5.892 7.03 0.41 3.14 0.990
Run 9 12 0.05 10 5.568 7.44 0.45 3.30 0.990
Run 10 12 0.03 5 4.980 14.46 0.43 6.92 0.962
Run 11 12 0.05 10 7.416 5.42 0.37 2.27 0.995
Run 12 15 0.1 10 1.812 4.30 1.33 2.01 0.990
Run 13 12 0.05 10 7.554 7.70 0.36 3.27 0.994
Run 14 9 0.05 15 4.980 6.02 0.54 2.37 0.990
Run 15 15 0.05 5 2.844 8.86 0.66 4.57 0.971
56 Photocatalytic degradation of Orange II dye using zeolite X - Fe catalyst
synthesized from coal fly ash
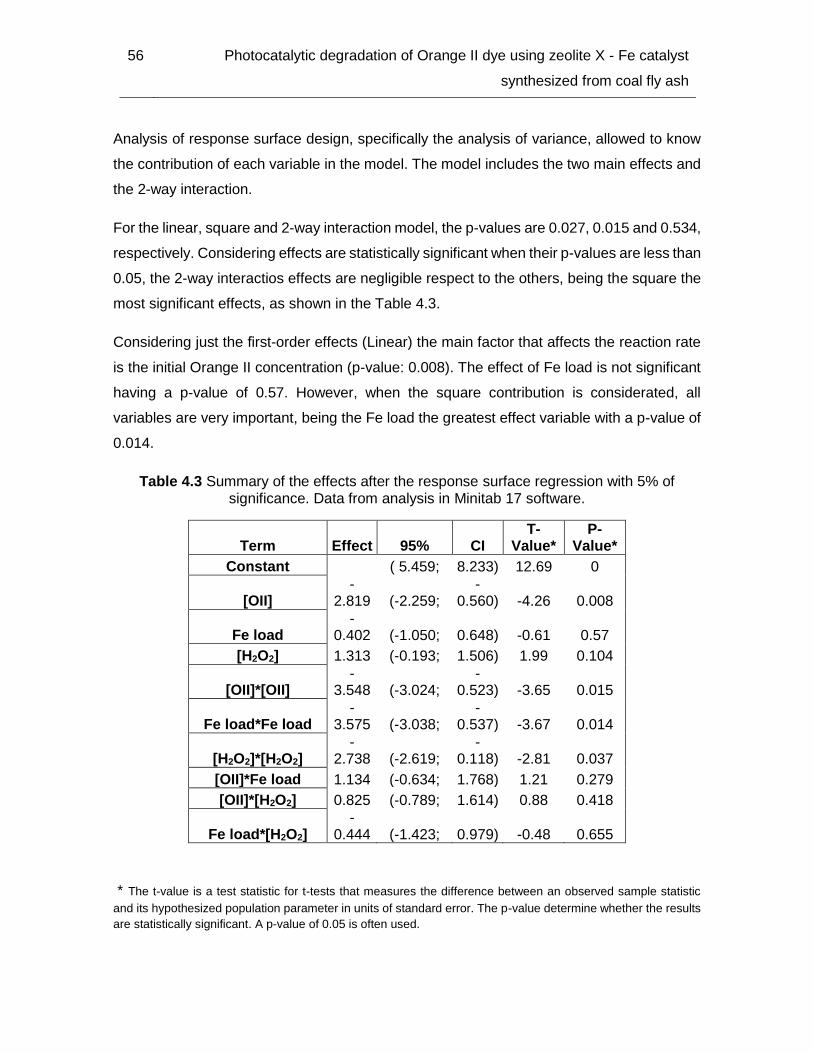
Analysis of response surface design, specifically the analysis of variance, allowed to know
the contribution of each variable in the model. The model includes the two main effects and
the 2-way interaction.
For the linear, square and 2-way interaction model, the p-values are 0.027, 0.015 and 0.534,
respectively. Considering effects are statistically significant when their p-values are less than
0.05, the 2-way interactios effects are negligible respect to the others, being the square the
most significant effects, as shown in the Table 4.3.
Considering just the first-order effects (Linear) the main factor that affects the reaction rate
is the initial Orange II concentration (p-value: 0.008). The effect of Fe load is not significant
having a p-value of 0.57. However, when the square contribution is considerated, all
variables are very important, being the Fe load the greatest effect variable with a p-value of
0.014.
Table 4.3 Summary of the effects after the response surface regression with 5% of significance. Data from analysis in Minitab 17 software.
Term Effect 95% CI T-
Value* P-
Value*
Constant ( 5.459; 8.233) 12.69 0
[OII] -
2.819 (-2.259; -
0.560) -4.26 0.008
Fe load -
0.402 (-1.050; 0.648) -0.61 0.57
[H2O2] 1.313 (-0.193; 1.506) 1.99 0.104
[OII]*[OII] -
3.548 (-3.024; -
0.523) -3.65 0.015
Fe load*Fe load -
3.575 (-3.038; -
0.537) -3.67 0.014
[H2O2]*[H2O2] -
2.738 (-2.619; -
0.118) -2.81 0.037
[OII]*Fe load 1.134 (-0.634; 1.768) 1.21 0.279
[OII]*[H2O2] 0.825 (-0.789; 1.614) 0.88 0.418
Fe load*[H2O2] -
0.444 (-1.423; 0.979) -0.48 0.655
* The t-value is a test statistic for t-tests that measures the difference between an observed sample statistic
and its hypothesized population parameter in units of standard error. The p-value determine whether the results
are statistically significant. A p-value of 0.05 is often used.
57
The coefficients of the quadratic model in the polynomial expression were then calculated
by multiple regression analysis, using Minitab software. Coefficients in the expression
represent the weight of each variable by itself, the weight of the quadratic effect and the
weight of the first-order interactions between the variables. The reaction rate is expressed
in (h-1), Orange II and hydrogen peroxide concentrations in (mM) and the Fe load as (%):
Where X1, X2 and X3 represent the initial concentration of Orange II in mM, iron oxide
content in wt% and initial concentration of H2O2 in mM.
Analysis of variance and the second order model showed a reasonably fit of the values
predicted by the model and experimental data (R2= 91.7%) for reaction rate of dye oxidation
with 95% confidence level, indicating a good correspondence between the model prediction
and the experiments. For reaction rate the relative errors are always below 8.3%.
Figure 4.2 presents the response surface modeling in a three dimensional representation to
put into evidence the effects of initial Orange II, initial H2O2 concentration and Fe load on
the reaction rate after 3 h of oxidation reaction. The reaction rate decreases as the initial
concentration of Orange II increases, even when the greater load of Fe is used in the
reaction medium (Figure 4.2. (a). Indeed, for low Orange II, initial H2O2 concentration and
Fe load parameters seem to affect positively the final performance. As a general trend,
optimum values exist for each parameter and the range studied for each variable were
appropriately selected. The fact that in some conditions very high H2O2 concentration values
lead to a decrease in the reaction rate is possibly due to the competition between these
species for hydroxyl radicals. Indeed, OH• radicals are quite non-selective, reacting with the
organic matter present but also with other species, as in shown in the next reaction [8]:
H2O2 + OH• → H2O + HO2• (15)
58 Photocatalytic degradation of Orange II dye using zeolite X - Fe catalyst
synthesized from coal fly ash
Moreover an increase in the Fe load, increases the amount of available Fe2+ and therefore
an increase of OH• radicals. Excess of catalyst may however lead to a loss of OH• species
by the following scavenging reaction [85]:
Fe2+ + OH• → Fe2+ + OH− (16)
From the analysis of the response surface the optimal conditions for the Orange II
degradation are closed to the studied centre point. The response optimization, with 95%
confidence level, showed the predicted values for the studied variables. The values for the
inital H2O2 concentration, Initial Orange II concentration and Fe load should be 10.96 mM,
0.051 mM and 11.6 wt% of Fe oxide (8.1 wt% of Fe), respectively.
Following the study of the variables effects during the Orange II photodegradation is
presented. In figures, the data fitting according to the Fermi´s equation is represented by a
solid line.
4.2.2 Effect of initial Orange II concentration
In the implementation of advanced oxidation processes it is important to know the
effectiveness of the process with respect to the initial concentration of the contaminant. This
prior knowledge will allow not only optimize the reactors design but also to know if the use
of a pretreatment is necessary.
Figure 4.3 shows the concentration histories normalized by the initial concentration, C0. The
initial OII concentration showed a negative effect on its reaction rate, i.e., the higher the
initial dye concentration, the lower the oxidation rate was. The reported negative effect at
higher OII concentrations results from the fact that for smaller dye concentrations, the molar
ratio oxidant/parent organic compound is higher (because the amount of hydrogen peroxide
molecules initially present in the reactor is the same). The same inhibiting effect of the
organic initial concentration on the oxidation rate was observed by several authors [21].
59
Figure 4.2 Response surface showing the reaction rate (1/h) of the Orange II solution as a function of: a. X1 and X2 (for X3: 10mM), b. X1 and X3 (for catalyst 2), c. X2 and X3 (for X1
0.05mM).
[H2O2] (mM) 10
Hold Values
2
4
0 0, 406,0
80,0
01
01,0
41
12
01
414
6
Reactio rn )h/1( eta
)%( daol norI
OII] (m[ M)
urface Plot of Reaction raS e (1t h) vs Iron load (%); [OII] (mM)/
a
Iron load (%) 12
Hold Values
2
4
6
40,00,06
0,08 50,10
10
15
6
8
Reacti n ro )h/1( eta
)Mm( ]2O2H[
OII] ([ mM)
urface Plot of Reaction rate ( ;/h) vs [H2O2] (mM)S [OII] (mM)1
b
[OII] (mM) 0,065
Hold Values
10
03,
54,
06,
510
14
21
01
51
06,
5,7
(1/h) etar noitcaeR
)%( daol norI
]2O2H (mM[ )
urface Plot of Reaction rate (1/hS vs Iron load (%); [H2O2] (mM))
c
60 Photocatalytic degradation of Orange II dye using zeolite X - Fe catalyst
synthesized from coal fly ash
Figure 4.3 Effect of the initial dye concentration on the degradation histories (T =20ºC, H2O2 10 mM, initial pH 3, catalyst 2 load 0.1 g/L, 10 UVA lights). The lines represent the
fitting by the model (Equation. (20) with data reported in Table 4.2).
4.2.3 Effect of initial H2O2 concentration
The initial H2O2 concentration has an important role in the organics degradation, because
its directly related to the number of hydroxyl radicals generated. The effect of this variable
was analysed by varying the initial H2O2 dosage (5, 10, 15 mM) keeping the others
parameters constant (Figure 4.4). The initial dye concentration was 0.05 mM and the catalyst
used was the catalyst 2 (8.1 wt% of Fe load). This studied range agrees to the stoichiometric
ratio for a complete mineralization of the dye according to the reaction reported, where 42
moles of H2O2 are needed to completely degrade 1 mol of dye [14]:
0
0,2
0,4
0,6
0,8
1
0 0,5 1 1,5 2 2,5 3
C/C
0
Time (h)
0.03 mM
0.05 mM
0.1 mM
Model
61
Figure 4.4 Effect of the initial H2O2 concentration on the degradation histories (T =20ºC, OII 0.05 mM, initial pH 3, catalyst 2 load 0.1 g/L, 10 UVA lights). The lines represent the
fitting by the model (Equation. (20) with data reported in Table 4.2).
The reaction rate is enhanced with increasing H2O2 concentration of 5 to 10 mm, due to the
formation of hydroxyl radicals. However, when the concentration of H2O2 in solution is 15
mM the reaction rate decreases due to the well-known hydroxyl radicals scavenging effect,
reported in equation (15).
Such reaction reduces the probability of attack of organic molecules by hydroxyl radicals,
and causes the oxidation rate to drop. Although other radicals (HO2•) are produced, their
oxidation potential is much smaller than that of the HO• species. Therefore, in the
subsequent runs, 10 mM of H2O2 will be used [8].
4.2.4 Effect of Fe load onto support
Effect on the reaction rate for different Fe loads was evaluated with a concentration of 0.1
g/L of catalyst and results are presented in Figure 4.5. From previous chapters is known that
zeolite synthesized by hydrothermal treatment from fly ash contains 6.3 wt% of Fe. Catalysts
prepared, catalysts 1 and 2, have additionally 3 wt% and 6 wt%, respectively.
0
0,2
0,4
0,6
0,8
1
0 0,5 1 1,5 2 2,5 3
C/C
0
Time (h)
5 mM
10 mM
15 mM
Model
62 Photocatalytic degradation of Orange II dye using zeolite X - Fe catalyst
synthesized from coal fly ash
Figure 4.5 Effect of the iron load on the degradation histories (T =20ºC, OII 0.05 mM, initial pH 3, catalyst load 0.1 g/L, 10 UVA lights). The lines represent the fitting by the
model (Equation. (20) with data reported in Table 4.2).
With the lowest value of iron, corresponding to the zeolite, there is a color removal, but the
reaction rate is slow. When the amount of Fe available increases, the reaction rate increases
significantly, being higher for the catalyst 1 and having no significant differences between
the two catalysts. This increment occurs because when the amount of Fe2+ increases, more
OH• species are produced and are thus available for the oxidation reaction.
In addition, the difference in the reaction rate for 8.4 to 6.3 wt% Fe loads, also can be
explained from the source of iron. In the case of the prepared catalyst, the iron should be
more accessible for H2O2 (during the forming of hydroxyl radicals) because the iron excess
is due to an impregnation process onto the zeolite structure.
Therefore, high Fe load corresponds to high oxidant loads and scavenging effect becomes
more significant, which leads to the non-productive decomposition of hydrogen peroxide and
limits the yield of hydroxylated (oxidized) organic compounds. Although other radicals (HO2•)
are produced, their oxidation potential is much smaller than that of the OH• species, as
discused above. This result is according with the experimental design. When is considered
only the quadratic effect of iron load, the equation takes the form y = -ax2, suggesting the
0
0,2
0,4
0,6
0,8
1
0 0,5 1 1,5 2 2,5 3
C/C
0
Time (h)
9% Iron oxide
12% Iron Oxide
15% Iron oxide
Model
63
existence of an optimal amount of iron in the reaction medium to maximize the reaction rate.
Besides, an increase of iron content causes a loss of the structure crystallinity and a
significant decrease in BET surface area, as discussed in chapter 3.
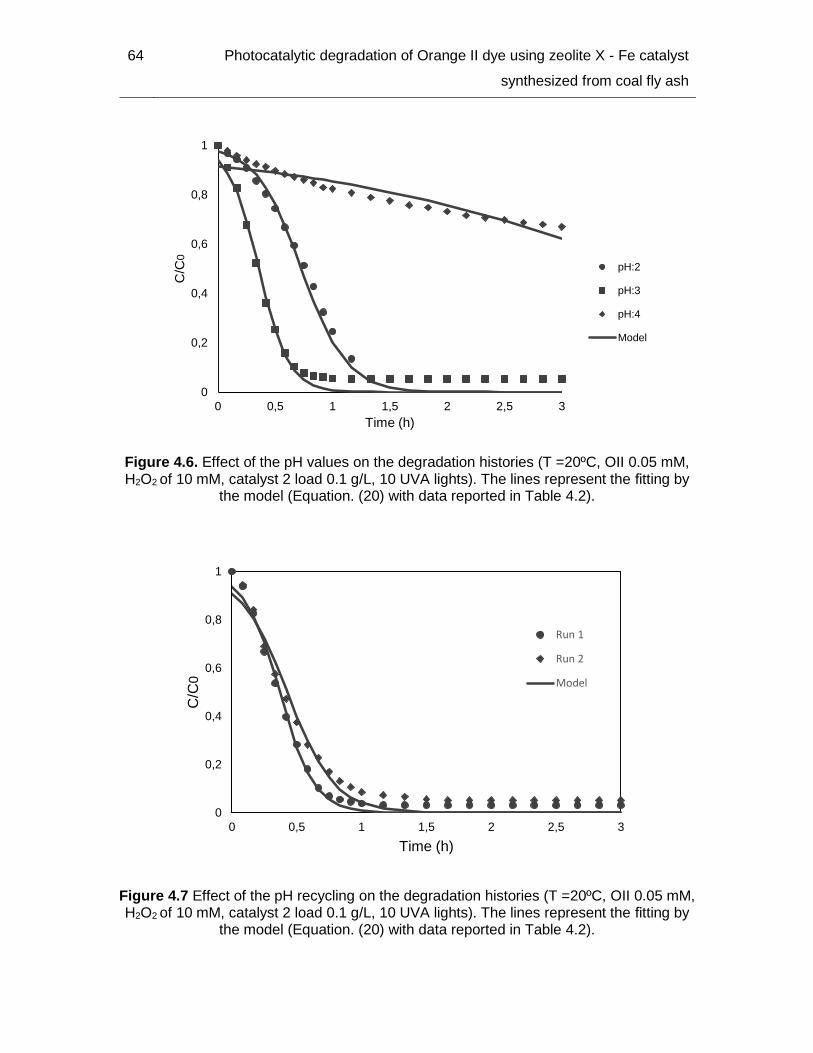
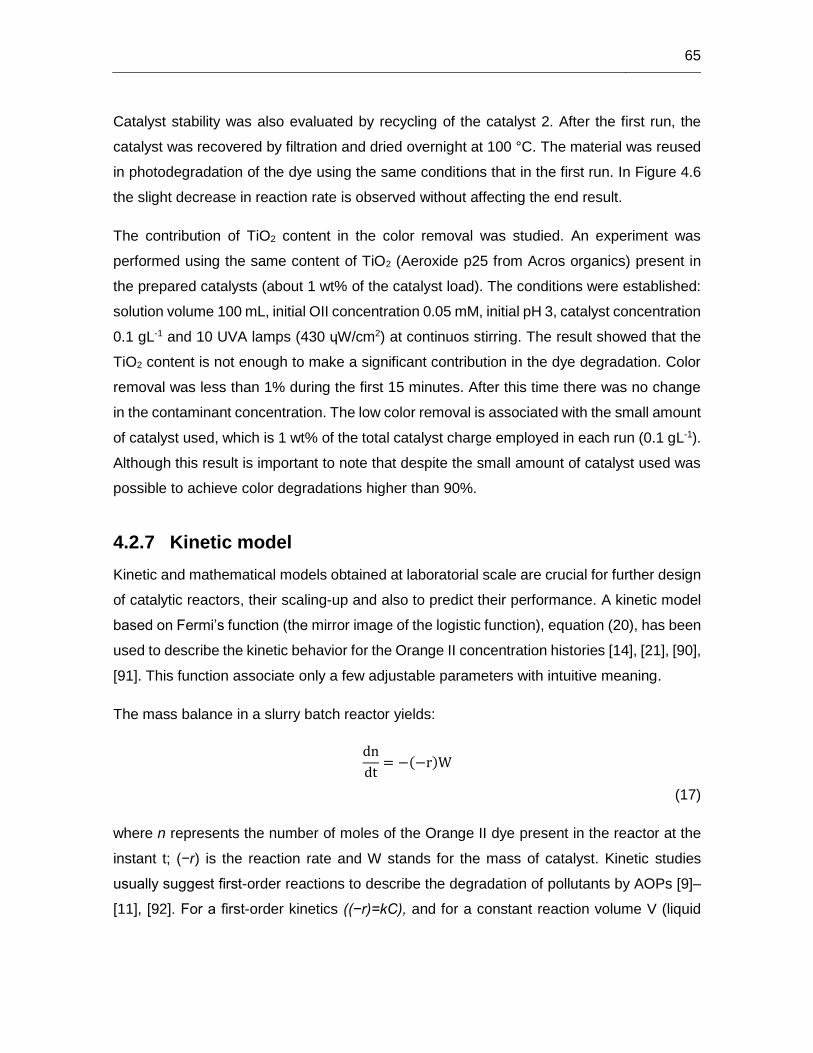
4.2.5 Effect of initial pH
The effect of initial solution pH (in the range of 2-4) on the discoloration of 0.05 mM Orange
II was studied in the presence of 10 mM H2O2, 0,1 g/L catalyst 1 and 10 UVA light. Results
are shown in Figure 4.6. The reaction rate increases with an increase in pH values from 2
to 3. In both cases, the reaction is substantially completed after 2 hours and the final
concentration of dye is the same. Moreover, when the pH increases to 4, the reaction rate
decreases considerably.
The first behavior can be explained from the decrease in the generation of hydroxyl radicals
at pH 2 decreases. In this case, the hydrogen peroxide forms the hydroperoxonium ion
(H3O2+) by proton solvation, and therefore does not react with Fe2+. The slow reaction rate
at pH 4 can be ascribed to the stability of H2O2, which starts to rapidly decompose into
molecular oxygen without formation of appreciable amounts of hydroxyl radicals, which is
not capable to efficiently oxidize the organic material. These observations agree well with
typical published results where the optimal pH value for Fenton, Fenton-like and
photoFenton is 3 [8], [10], [11], [14], [21].
4.2.6 Catalyst stability
In heterogeneous photocatalytic processes it is very important to evaluate the stability of the
catalyst and ensure that processes do not have any contribution of homogeneous reactions.
This also facilitates the implementation of large-scale heterogeneous treatments. For this
reason, the iron leaching was estudied for the three pH values. Atomic absorption
measurements at the end of each run, showed that to pH 3 and 4 the iron concentration in
solution was below the detection limit of the equipment (1 mg/L). In the case of pH 2, the
concentration of iron in solution was 3 mg/L that corresponds to 35 wt% of the Fe load in the
catalyst (refereed to the total Fe initially present in the catalyst). This result can be attributed
to the dissolution of iron oxide at very acidic conditions and is an important advantage
because it allows using less acid to acidify the medium. For photoFenton process the optimal
pH value is 3.
64 Photocatalytic degradation of Orange II dye using zeolite X - Fe catalyst
synthesized from coal fly ash
Figure 4.6. Effect of the pH values on the degradation histories (T =20ºC, OII 0.05 mM, H2O2 of 10 mM, catalyst 2 load 0.1 g/L, 10 UVA lights). The lines represent the fitting by
the model (Equation. (20) with data reported in Table 4.2).
Figure 4.7 Effect of the pH recycling on the degradation histories (T =20ºC, OII 0.05 mM, H2O2 of 10 mM, catalyst 2 load 0.1 g/L, 10 UVA lights). The lines represent the fitting by
the model (Equation. (20) with data reported in Table 4.2).
0
0,2
0,4
0,6
0,8
1
0 0,5 1 1,5 2 2,5 3
C/C
0
Time (h)
pH:2
pH:3
pH:4
Model
0
0,2
0,4
0,6
0,8
1
0 0,5 1 1,5 2 2,5 3
C/C
0
Time (h)
Run 1
Run 2
Model
65
Catalyst stability was also evaluated by recycling of the catalyst 2. After the first run, the
catalyst was recovered by filtration and dried overnight at 100 °C. The material was reused
in photodegradation of the dye using the same conditions that in the first run. In Figure 4.6
the slight decrease in reaction rate is observed without affecting the end result.
The contribution of TiO2 content in the color removal was studied. An experiment was
performed using the same content of TiO2 (Aeroxide p25 from Acros organics) present in
the prepared catalysts (about 1 wt% of the catalyst load). The conditions were established:
0.1 gL-1 and 10 UVA lamps (430 ɥW/cm2) at continuos stirring. The result showed that the
TiO2 content is not enough to make a significant contribution in the dye degradation. Color
removal was less than 1% during the first 15 minutes. After this time there was no change
in the contaminant concentration. The low color removal is associated with the small amount
of catalyst used, which is 1 wt% of the total catalyst charge employed in each run (0.1 gL-1).
Although this result is important to note that despite the small amount of catalyst used was
possible to achieve color degradations higher than 90%.
4.2.7 Kinetic model
Kinetic and mathematical models obtained at laboratorial scale are crucial for further design
of catalytic reactors, their scaling-up and also to predict their performance. A kinetic model
based on Fermi’s function (the mirror image of the logistic function), equation (20), has been
used to describe the kinetic behavior for the Orange II concentration histories [14], [21], [90],
[91]. This function associate only a few adjustable parameters with intuitive meaning.
The mass balance in a slurry batch reactor yields:
dn
dt= −(−r)W
(17)
where n represents the number of moles of the Orange II dye present in the reactor at the
instant t; (−r) is the reaction rate and W stands for the mass of catalyst. Kinetic studies
usually suggest first-order reactions to describe the degradation of pollutants by AOPs [9]–
[11], [92]. For a first-order kinetics ((−r)=kC), and for a constant reaction volume V (liquid
66 Photocatalytic degradation of Orange II dye using zeolite X - Fe catalyst
synthesized from coal fly ash
phase), integration of equation (17) provides an exponential decay of the concentration
along time:
C
C0= exp [−k´ (
W
V) t]
(18)
In this equation k´ represents the pseudo first-order rate constant and the term (W/V)
denotes the catalyst dosage employed, referred as catalyst concentration.
Usually a two-step pseudo-first-order model has been widely employed to describe the
Fenton process characterized by two stages. An induction period where an initial slow
degradation has been often observed and a rapid decay in the pollutant concentracion. This
behavior is represented by an inverse S-shape profile (as shown in Figures. 4.3-4.7), when
the normalized concentration vs. time is graphed.
In the present case such period can be attributed to the time needed for activation of the
surface iron species, because dissolution of the metal for the homogeneous Fenton reaction
is almost negligible. Considering that the concentration decay of the pollutant exhibits two
linear regions (in semi-logarithmic scale), the respective rate constants are determined by
two separate regression analysis. However, the two-step pseudo-first-order approach has
some limitations: the transient period between each linear region is not considered in the
model, the choice of each region is somehow subjective, and the behavior during the
induction period is not exactly linear. Due to these limitations it would be safer to describe
the dye concentration histories in the intermediate regime by a single semi-empirical function
that also accounts simultaneously the influence of all the reaction parameters.
The Fermi’s function has been selected for describe the effect of the main reaction
conditions on the treatment of Orange II by the heterogeneous photocatalytic wet hydrogen
peroxide oxidation process using a Fe-zeolite catalyst. This function is the mirror image of
the logistic function and has been commonly used to describe microbial decay in a closed
habitat as a result of exposure to lethal agents, such as high temperature, radiation or ozone
[21]:
R(t) =1
1 + exp[k´(t − tcl)]
67
(19)
where R(t) is the survival ratio, k´ and tcl a decline or lethality rate constant the time to reach
50% survival. k´ and tcl depend on different parameters, including the chemical and physical
conditions of the medium and environment (e.g., the type of nutrients present, temperature,
pH, and oxygen availability).
The selection of Fermi´s model at these conditions should be based on mathematical
simplicity and because the effect of such factor on the model’s parameters can be
determined experimentally and incorporated in the model. In the study case, the Fermi’s
function can be used in the following form:
C
C0=
1
1 + exp[k(t − t∗)]
(20)
where k stands for the equivalent apparent first-order rate constant but includes the catalyst
dosage (W/V), and t* is the transition time which determines the location of the concentration
curve’s inflection point.
In addition, it is important to remark that all decolorization curves shown previously, exhibit
a profile that is characteristic of the Fermi’s equation (i.e., nearly sigmoid shape, in terms of
dye conversion), which is typical for autocatalytic or radical reactions. In this context, a single
and practical expression, with few adjustable parameters is desired because determination
of large number of parameters by statistical methods does not necessarily yield a unique or
correct solution.
The Marquardt–Levenberg algorithm was employed to find the coefficients (parameters k
and t*) of the independent variables (k and t*) that give the best fit between the equation
and the data, after the Orange II concentration histories were normalized. This algorithm
seeks the values of the parameters that minimize the sum of the squared differences
between observed and predicted values of the dependent variable. The parameters were
obtained after a regression and are gathered in Table 4.2. This table contains the coefficients
of variation (CV) expressed as a percentage (kCV and t*cv, for k and t*, respectively). The
asymptotic standard errors of the parameter measure the uncertainties in the estimates of
68 Photocatalytic degradation of Orange II dye using zeolite X - Fe catalyst
synthesized from coal fly ash
the regression coefficient (analogous to the standard error of the mean). CV(%) is the
normalized version of this error (CV( %)= standard error ×100/parameter value) [91].
In general, the fitting of the model presented in Figures. 4.3-4.7, as well as the respective
kCV (4.2–14.5%), t*CV (1.6–6.9%) and r2 (0.8800–0.9900) shown in Table 4.2, demonstrate
the very good agreement of the model to all experimental data.
To observe the effect of each studied variable in the reaction rate during the oxidation of
Orange II, additional experiments were carried out keeping the conditions at the centre point
values and to pH 3. The effect of the Fe load onto the catalyst was analyzed from the fitted
parameters shown below (Table 4.4). Experiments in italics correspond to additional runs.
Table 4.4 Conditions and kinetic parameters obtained for different Fe loads after regression using Equation. (20) (CCat= 100 mg L−1).
Fe
Load
[OII]
mM
[H2O2]
mM
k (h-1) kcv (%) t* (h) t*cv (%) r2
6.3 0.05 10 2.406 6.230 0.892 2.800 0.983
8.4 0.05 10 7.416 5.420 0.367 2.270 0.996
10.5 0.05 10 6.468 5.380 0.433 2.150 0.996
It was noticed that the rate constant substantially increases when the Fe load is increased
to 8.4 wt%. The reaction rate increases from 2.4 ah 7.4 h-1 which is reflected by the shorter
times required for reaching a 50% conversion level. Data also show that the transition time
(t*) obtained after regression decreased from 0.89 h to 0.37 h with this Fe load increase. A
slight decrease in the rate constant is observed when the iron load is 10.5, confirming the
existence of an optimal Fe load near to the centre point. The model fit is shown in Figure
4.5, where r2 values increase with the Fe load.
Regarding the effect of the initial hydrogen peroxide concentration, additional run was
performed (italics) and the results are compile in Table 4.5. The Fe load and the intial dye
concentration were 10.5 wt% and 0.05 mM, respectively at pH 3.
69
Table 4.5 Conditions and kinetic parameters obtained for different H2O2 concentrations
after regression using Equation. (20) (CCat= 100 mg L−1).
Fe
Load
[OII]
mM
[H2O2]
mM
k (h-1) kcv (%) t* (h) t*cv (%) r2
10.5 0.05 5 2.844 8.860 0.655 4.570 0.971
10.5 0.05 10 6.468 5.380 0.433 2.150 0.996
10.5 0.05 15 4.464 6.450 0.594 2.520 0.992
The k values had the same behavior as in the case of Fe load. The reaction constant
increased for the central point (10 mM) and decreased in the case of the highest initial H2O2
concentration. However the variation between them was less significant than in the previous
study, which could mean less influence of this variable respect to the iron load. In general,
the central oxidant dose had the smaller t* value (Table 4.5), which is associated with the
increase of the Orange II degradation rate reported previously (Figure. 4.4).
From the kinetic analysis it was noticed that the initial dye concentration has a negative
effect on k and an increase in t*, as is shown in Table 4.6.
Table 4.6 Conditions and kinetic parameters obtained for different initial Orange II
concentrations after regression using Equation. (20) (CCat= 100 mg L−1).
Fe
Load
[OII]
mM
[H2O2]
mM
k (h-1) kcv (%) t* (h) t*cv (%) r2
10.5 0.03 10 4.026 8.350 0.540 4.010 0.983
10.5 0.05 10 3.318 5.790 0.744 2.240 0.991
10.5 0.1 10 1.812 4.300 1.330 2.010 0.987
Apparently, when increasing the Orange II concentration, the overall process slows down,
leading to a decrease in the reaction rate and inherently an increase in the transition time.
This is in agreement with Figure. 4.3, where the model is again compared with the
experimental data, revealing a very good adherence.
70 Photocatalytic degradation of Orange II dye using zeolite X - Fe catalyst
synthesized from coal fly ash
Finally, the effect of the initial pH was also evaluated. For this case, the optimal conditions
obtained previously were used to study the influence of this variable. The pH values studied
were 2, 3 and 4. Table 4.7 shows the kinetic parameters for the three cases.
Table 4.7 Conditions and kinetic parameters obtained for different pH after regression using Equation. (20) (CCat= 100 mg L−1).
pH Fe
Load
[OII]
mM
[H2O2]
mM
k (h-1) kcv (%) t* (h) t*cv (%) r2
2 8.4 0.05 10 5.064 6.640 0.727 1.920 0.992
3 8.4 0.05 10 7.554 7.700 0.357 3.270 0.994
4 8.4 0.05 10 0.630 8.570 3.800 4.820 0.880
The rate constant increased slightly when the pH increased from 2 to 3. However, when the
pH increased to 4, the reation rate drastically decreased. This result agrees with the findings
of other studies in which states that pH 3 is the optimal value in processes involving Fenton
reactions. At pH 4, the model fit to the experimental data was not the best, having the lowest
r2 (0.88). This is due to the low reaction rate which relieves the behavior of known profile
data, represented by an inverse S-shape profile (as shown in Figure 4.6).
Comparing the values of the rate constants for the Orange II degradation obtained in this
work (Fermi´s model) with those obtained in previous studies using the same model or the
commonly used pseudo first order model. The result is shown in Table 4.8, where the values
of various rate constants are compiled.
Table 4.8 Condition and kinetic parameters for Orange II degradation by Fenton and photoFenton processes using different Fe-catalysts.
Catalyst
(concentration)
Conditions Kinetic
Model
k (h-1) r2 References
Fe-Bentonite clay
(1 g/L)
[OII]: 0.2 mM
[H2O2]: 10 mM
pH: 3
UVC light
Pseudo
first-order
11.58 0.993 [10]
71
Fe-Zeolite Y (0.2
g/L)
[OII]: 0.1 mM
[H2O2]: 10 mM
pH: 3
without light
(T:30ºC)
Fermi´s
equation
7.43 0.993 [14]
Hydroxyl Fe-
pillared Bentonite
(1 g/L)
[OII]: 0.15 mM
[H2O2]: 10 mM
pH: 3
UV light
Pseudo
first-order
2.46 0.990 [11]
Fe-zeolite X (0.1
g/L)
[OII]: 0.05 mM
[H2O2]: 10 mM
pH: 3
UVA light
Fermi´s
equation
7.42 0.995 This work
The kinetic constants obtained in this work are in the same magnitude order compared with
constants reported in literature for the Orange degradation by Fenton or photoFenton
process. Its difficult to make a comparison between them (different processes and
conditions) but both reported model had a good fit of the eperimental data. In particular, the
kinetic constant value shown in Table 4.8 for this work could be considered appropriate for
the used conditions. This reaction rate is higher than the constant reported for the third case
(initial OII concentration is high. 0.15 mM) but is lower than the first constant, reported when
the UVC light is used (more radiant energy).
Conclusions
In this chapter zeolite X and Fe-Zeolite X catalysts were used in the Orange II degradation
by photoFenton process revealing ability to degrade the dye (>90%) in less than 3 hours.
Among all studied parameters during the dye degradation, the initial Orange II concentration
had a dominant effect. The conversion was in general proportional to the diminution of the
initial dye concentration, according to an inverse proportionality between pollutants
72 Photocatalytic degradation of Orange II dye using zeolite X - Fe catalyst
synthesized from coal fly ash
concentration and oxidation efficiency, typically reported for the catalytic degradation of
many organic compounds.
The response surface analysis revealed the existence of optimal condition for the studied
variables and the high influence of the quadratic effects in the reaction rates constants. The
dye concentration histories obtained from the experimental data were well described by a
semi-empirical equation, based on the Fermi’s distribution function.
The effect of the operating conditions on the transition time is the opposite. When the
apparent rate constant increases the time corresponding to the concentration curve’s
inflection point decreases, and vice-versa. Besides, in general the catalysts exhibit low
leaching levels at pH 3 but when the pH is 2, the iron leaching is important.
73
5. Degradation of wastewater from a clinical laboratory
Abstract
Violet wastewater from a clinical laboratory was treated by PhotoFenton process using the
best conditions resulting of the treatment of the main variables of influence were studied in
the previous chapter. Experiments were carried out to know if was possible to degrade and
mineralize the mixture of pollutants. The amount of catalyst in the reaction medium was
studied in order to determine the influence of this variable on the percentage of discoloration
of the wastewater.
Introduction
Hospitals, health centers and clinical laboratories are establishments of high risk of
contamination, not only within their physical infrastructure, but also outside it, because
through the disposal and management of waste produced in them, pollutants can be
transported to the environment.
In particular, the clinical laboratory is where determinations of human biological properties
that contribute to the study, prevention, diagnosis and treatment of health problems are
made. In addition, in this kind of place is obtained and studied clinical samples such as
blood, urine, stool, synovial fluid, cerebrospinal fluid, throat and vaginal exudates, among
others.
Processes in these laboratories mostly include the use of chemicals that allow the
pathogens identification, such as dyes in staining processes, as well as for fixation and
preservation of tissues such as formaldehyde.
In this chapter, the color degradation of a liquid residue from the clinical laboratory of Family
Compensation Fund, Compensar, in Bogota is studied. The wastewater is generated from
76 Photocatalytic degradation of Orange II dye using zeolite X - Fe catalyst
synthesized from coal fly ash
the Gram stain and Ziehl-Neelsen stain processes used to identify pathogens in the urine of
patients. The composition is a mixture of derivatives of triphenylmethane dye.
5.1 Experimental
Photocatalytic experiments for degradation of an violet aqueous solution of the wastewater
from clinical laboratory was conducted in the same reactor described previously. The violet
color comes from the main component, the crystal violet, additionally basic and acid fuchsins
can be found. In a typical run the reactor was loaded with 100 ml of the wastewater solution
diluited to 5% v/v from a stock solution, which have a Chemical Oxygen Demand (COD) of
27400 mg L-1. The pH of the diluted solution is 3.8, and this value was maintained at the
start of each experiment in order to avoid increasing costs and considering the use of
photoFenton process in the treating of this wastewater at pilot scale. The total organic
carbon content of the diluited solution correspond to 96.93 mg L-1. The initial load of H2O2
was fixed to 10 mM and the beginning of the reaction was considered when H2O2 and the
catalyst 1 (12 wt% iron oxide) were added together. Two differents catalyst load were
evaluated 0.1 and 0.7 g L-1. The clinical waste absorbance histories were follow by a UV–
vis Spectrophotometer for three hours at λ = 525 nm, according to the recommendations of
the Ministerio de Ambiente y Desarrollo Sostenible of Colombia in the 631 resolution of 2015
and to know the percentage of colour degradation considering the change in the measured
absorbance. The total organic carbon (TOC) was measured for the two resultant wastewater
after treatment and the iron leaching from the support was quantified in the both cases and
using the same equipment as in the previous chapter.
5.2 Results and discussion
It is quite possible to stain different tissue components in different colours with different acid
dyes. For the study case, three dyes are recognized in the wastewater. Crystal Violet is a
triarylmethane dye, used as a histological stain and in Gram’s method of classifying bacteria.
Crystal Violet has antibacterial, anti fungal, and anthelmintic properties and was formerly
important as a topical antiseptic [93]. The other dyes, acid and basic fuchsin possess other
chemical characteristics that are useful in revealing certain cell and tissue constituents [94].
Table 5.1 shows the evaluation results of certain parameters for the wastewater containing
the three dyes, as obtained in the clinical laboratory.
77
Table 5.1 Physical and chemical parameters measured for clinical laboratory wastewater.
Parameter Unit
BOD5 5200 mg/L
COD 27400 mg/L
Phenols 5.4 mg/L
pH 6.8 mg/L Methylene Blue Active
Substances <0.4 mg/L
SS <0.5 ml/L-h
TSS 242 mg/L
Sulfides <1.5 mg/L
Temperature 21 ºC
The pollutant degradation, according to the absorbance histories, for the two catalyst load
is shown in Figure 5.1. The oxidation reaction accelerates when increasing the catalyst load
due to the higher Fe load available in the reaction medium. When 0.7 g L-1 is used, 65% of
color degradation is obtained after 35 minutes and the reaction rate is high. After this time
there no changes in the absorbance values and therefore no changes in the pollutants
degradation. This observation is in agreement with other reports when relatively high
catalyst loads are used [7], [8]. This behaviour is related with the increase of the amount of
active sites for H2O2 decomposition.
Figure 5.1 Color removal for a clinical laboratory wastewater evaluating two catalyst load,
0.1 and 0.7 g/L. The Y axis corresponds to the absorbance (A) values normalized.
0
0,2
0,4
0,6
0,8
1
0 0,5 1 1,5 2 2,5 3
A/A
0
Time (h)
0.1 g/L
0.7 g/L
78 Photocatalytic degradation of Orange II dye using zeolite X - Fe catalyst
synthesized from coal fly ash
The color removal rate, when the catalyst load is 0.1 g L-1, is very slow. At the first 35 minutes
the color degradation is 11%. However after 180 minutes its possible to obtain a color
degradation closed to 80%, which is above of the value obtained with a catalyst load of 0.7
g L-1. The iron leaching measured by atomic absorption was negligible, being below the
detection limit of the equipment. Respect to the total organic carbon measurement, results
revealed no representative decline, although it was relatively greater in the case of larger
catalyst charge. The decrease in the organic loading was 3.7% and 5.8% for loads of 0.1 g
L-1 and 0.7 g L-1 catalyst respectively. The low removal of TOC is possibly due to the lower
oxidation rate of reaction products and the development of parallel reactions between
excess ferrous iron and hydroxyl radicals (see Equation. (21)), or to the scavenging of those
or other radicals by present iron species (equations 22-24):
Fe2+ + OH● → OH− + Fe3+ (21)
FeOH+ + OH● → Fe3+ + 2OH− (22)
Fe2+ + HO2● → Fe3+ + HO2
− (23)
Fe3+ + HO2● → Fe2+ + O2 + H+ (24)
Conclusions
In general dyes are known to resist conventional physicochemical and biological treatment
due to their high degree of polarity and complex molecular structure. This chapter studied
aimed at treating a mixture of dyes, derivatives of triphenylmethane with photoFenton
process, using two different loads of Fe-zeolite catalyst. Results have demonstrated that
during photoFenton treatment decolorization was above of 60% for both cases during 180
minutes but was not possible appreciable TOC removals.
79
Nevertheless, photoFenton process can be recommended for oxidative color and partial
organic carbon removal. The results could be improved if the pH is reduced to 3 and another
treatment process is used previously, thinking about the economic viability of the process.
80 Photocatalytic degradation of Orange II dye using zeolite X - Fe catalyst
synthesized from coal fly ash
81
6. Conclusions and Recommendations
The research allowed achieving the proposed objectives. The objectives in the initial
propose were: 1. to synthesize zeolite X from a solid waste (fly ash) by a reported method
2. To prepare heterogeneous catalysts supporting iron on the synthetic zeolite, 3. To
characterize the catalysts prepared and 4. to measure, by spectrophotometry, the
photocatalytic degradation of the Orange II dye using the synthetic catalysts in photoFenton
process. All of them were completed and additionally was possible to study two important
variables in the synthesis of the zeolite.
In chapter 2, the effectiveness of the hydrothermal treatment in the zeolitic material
synthesis from an industrial waste, as is the coal fly ash, was evident and a product of higher
added value was obtained. Alkaline fusion of an ash: NaOH mixture with 1: 1.2 ratio
previously to the hydrothermal treatment allowed the extraction of silicon and aluminum for
obtaining the zeolitic material. After 6 hours of hydrothermal treatment, it was possible to
obtain zeolitic material with an important specific area, but with 8 hours, this material was
obtained with a specific surface area much higher than the area of the starting fly ash. The
SEM micrographs reflect an increase in crystal size with increasing time of hydrothermal
treatment. Higher crystallinity and purity of the material was also observed. The aging time
effect was important. The zeolite crystallinity increased when the aging time increased from
0 to 24 hours. BET area also increased, but not enough to mitigate the economic cost arises
from the additional time required for the aged zeolite synthesis. In none of the studied cases
was possible to obtain a pure zeolitic material. Zeolite X was synthesized with zeolite A.
A wet impregnation method for the catalysts preparation was used in chapter 3. Iron was
deposited on the synthetic zeolite for a later use in the photoFenton process. With this
methodology two catalysts with different amounts of supported iron on the zeolite were
synthesized, 12 and 15 wt% of iron oxide. The XRD analysis showed the crystallinity loss of
the catalysts structure with increasing the iron load on the zeolite. The surface area also
decreased by 5 and 7.5 times with respect to the zeolite area for Catalyst 1 and Catalyst 2,
respectively. It was possible to find the maximun iron load, impregnated on the zeolite,
82 Photocatalytic degradation of Orange II dye using zeolite X - Fe catalyst
synthesized from coal fly ash
without the structure, morphology and textural properties of the catalyst were greatly
affected.
The fourth chapter includes the results of the Orange II photodegradation using synthetic
zeolite and catalysts prepared in Chapters 2 and 3, respectively. Effects of the initial
concentrations of contaminants and hydrogen peroxide, and the iron load were determined
by a Box Behnken design from 15 experiments. According to the analysis of variance, the
variable with more influence on the reaction rate constant was the initial concentration of
Orange II. However when the quadratic effects are considered, all variables had an
important role in the pollutant concentration histories, especially iron load. Cross-effects
were not significatives. Response surfaces confirmed the existence of optimum values that
promote the reaction rate. The response optimization showed the optimum conditions for
Orange II degradation by the photoFenton process and from the synthesized material: the
optimal values for the inital H2O2 concentration, initial Orange II concentration and Fe load
should be 10.96 mM, 0.051 mM and 11.6 wt% of Fe oxide (8.1 wt% of Fe), respectively.
A semi-empirical model based on the Fermi´s equation to describe the rate of degradation
of Orange II was used. The concentration histories of the pollutant were characterized by an
inverse S-shape profile . It was found that the initial OII concentration showed a negative
effect on its reaction rate. The reaction rate was enhanced with increasing H2O2
concentration of 5 to 10 mm, but when the concentration of H2O2 in solution was 15 mM the
reaction rate decreases. The effect of iron load in the catalyst had the same behavior,
confirming the existence of optimal conditions as shown in response surface analysis. The
used model had a good parameters fitting. The TOC removal at the optimal conditions was
closed to 50% after 180 minutes. Prepared catalysts showed a good stability at pH 3. Iron
leaching was observed in experiment at pH 2.
The optimal conditions in Chapter were employed in the degradation of a wastewater from
a clinical laboratory. Photodegradation was performed to pH 3.8 (sample pH) in order to
evaluate the process effectiveness with the smaller sample processing. Two different iron
loads were evaluated. Results have demonstrated that during photoFenton treatment
decolorization was above of 60% for both cases durin 180 minutes but was not possible
appreciable TOC removals.
83
Further research and characterization can be performed to enrich the analysis presented in
this thesis. It would be useful to optimize the conditions of zeolite synthesis to obtain a pure
zeolite X. The fly ash/NaOH ratio and the stirring time of the synthesis gel could be studied.
Respect to the preparation and characterization of the synthetic catalysts contained in the
chapter 3, would be important to quantify the amount of iron that was exchanged for sodium
ions during the impregnation process by another technique. Besides, the oxidation state of
iron species forming the prepared catalysts could be studied by X-ray photoelectron
spectroscopy (XPS) in order to obtain greater reliability of the reaction mechanism for the
photofenton process in the Orange II degradation.
In this work, low catalyst loading was used compared with other studies reporting catalyst
concentrations 10 times higher. This definitely is an advantage because color degradations
higher than 90% were obtained with a small catalyst amount. It would be important to study
this parameter in order to see whether it is possible to increase the TOC removal and
achieve complete mineralization of the pollutant. Similarly it could assess whether the TiO2
content in zeolite and catalysts has a significant contribution in the photodegradación of
studied dye.
Finally, It would be interesting to investigate the influence of pH to values higher than those
used in this work. Many studies have reported the efficiency of photocatalytic process even
at neutral pH.
84 Photocatalytic degradation of Orange II dye using zeolite X - Fe catalyst
synthesized from coal fly ash
7. Annex: Photocatalytic reactor
Figure 7.1 Pictures showing the parts of the reactor. All the experiments reported in this thesis used quartz reactor irradiated by 10 UVA lamps incorporated into a cabin [95].
86 Photocatalytic degradation of Orange II dye using zeolite X - Fe catalyst
synthesized from coal fly ash
References 87
References
[1] I. Arslan-Alaton, B. H. Gursoy, and J.-E. Schmidt, “Advanced oxidation of acid and
reactive dyes: Effect of Fenton treatment on aerobic, anoxic and anaerobic
processes,” Dye. Pigment., vol. 78, no. 2, pp. 117–130, Aug. 2008.
[2] E. J. R. Almeida and C. R. Corso, “Comparative study of toxicity of azo dye Procion
Red MX-5B following biosorption and biodegradation treatments with the fungi
Aspergillus niger and Aspergillus terreus.,” Chemosphere, vol. 112, pp. 317–22, Oct.
2014.
[3] A. Georgi and F.-D. Kopinke, “Interaction of adsorption and catalytic reactions in
water decontamination processes,” Appl. Catal. B Environ., vol. 58, no. 1–2, pp. 9–
18, Jun. 2005.
[4] B. Bakheet, S. Yuan, Z. Li, H. Wang, J. Zuo, S. Komarneni, and Y. Wang, “Electro-
peroxone treatment of Orange II dye wastewater.,” Water Res., vol. 47, no. 16, pp.
6234–43, Oct. 2013.
[5] X. Doménech, W. Jardim, and M. Litter, “Procesos Avanzados de Oxidación para la
eliminación de contaminantes,” in CYTED, 2001.
[6] P. S. M. Santos and A. C. Duarte, “Chemosphere Fenton-like oxidation of small
aromatic acids from biomass burning in water and in the absence of light : Implications
for atmospheric chemistry,” vol. 119, pp. 786–793, 2015.
[7] R. S. Karale, B. Manu, and S. Shrihari, “Fenton and Photo-fenton Oxidation
Processes for Degradation of 3-Aminopyridine from Water,” APCBEE Procedia, vol.
9, no. Icbee 2013, pp. 25–29, 2014.
[8] J. H. Ramirez, F. J. Maldonado-Hódar, a. F. Pérez-Cadenas, C. Moreno-Castilla, C.
a. Costa, and L. M. Madeira, “Azo-dye Orange II degradation by heterogeneous
88 Photocatalytic degradation of Orange II dye using zeolite X - Fe catalyst
synthesized from coal fly ash
Fenton-like reaction using carbon-Fe catalysts,” Appl. Catal. B Environ., vol. 75, no.
3–4, pp. 312–323, Sep. 2007.
[9] S. Kourdali, A. Badis, and A. Boucherit, “Degradation of direct yellow 9 by electro-
Fenton: Process study and optimization and, monitoring of treated water toxicity using
catalase.,” Ecotoxicol. Environ. Saf., vol. 110, pp. 110–20, Dec. 2014.
[10] J. Feng, X. Hu, and P. L. Yue, “Effect of initial solution pH on the degradation of
Orange II using clay-based Fe nanocomposites as heterogeneous photo-Fenton
catalyst.,” Water Res., vol. 40, no. 4, pp. 641–6, Feb. 2006.
[11] J. Chen and L. Zhu, “Catalytic degradation of Orange II by UV-Fenton with hydroxyl-
Fe-pillared bentonite in water.,” Chemosphere, vol. 65, no. 7, pp. 1249–55, Nov.
2006.
[12] T. L. P. Dantas, V. P. Mendonça, H. J. José, a. E. Rodrigues, and R. F. P. M. Moreira,
“Treatment of textile wastewater by heterogeneous Fenton process using a new
composite Fe2O3/carbon,” Chem. Eng. J., vol. 118, pp. 77–82, 2006.
[13] M. Neamţu, C. Zaharia, C. Catrinescu, A. Yediler, M. Macoveanu, and A. Kettrup,
“Fe-exchanged Y zeolite as catalyst for wet peroxide oxidation of reactive azo dye
Procion Marine H-EXL,” Appl. Catal. B Environ., vol. 48, pp. 287–294, 2004.
[14] M. L. Rache, A. R. García, H. R. Zea, A. M. T. Silva, L. M. Madeira, and J. H. Ramírez,
“Azo-dye orange II degradation by the heterogeneous Fenton-like process using a
zeolite Y-Fe catalyst-Kinetics with a model based on the Fermi’s equation,” Appl.
Catal. B Environ., vol. 146, pp. 192–200, Mar. 2014.
[15] A. H. Gemeay, I. a. Mansour, R. G. El-Sharkawy, and A. B. Zaki, “Kinetics and
mechanism of the heterogeneous catalyzed oxidative degradation of indigo carmine,”
J. Mol. Catal. A Chem., vol. 193, pp. 109–120, 2003.
References 89
[16] N. M. Musyoka, R. Missengue, M. Kusisakana, and L. F. Petrik, “Conversion of South
African clays into high quality zeolites,” Appl. Clay Sci., vol. 97–98, pp. 182–186, Aug.
2014.
[17] A. Ruiz-Román, J., Santos, C. A., Cambronero, L., Corpas, F., Alfonso, M., & Moraño,
“Aprovechamiento de las cenizas volantes, clase F, de centrales térmicas para la
fabricación de materiales cerámicos,” Boletín la Soc. Española Cerámica y Vidr., vol.
39, pp. 229–331, 2000.
[18] A. Babuponnusami and K. Muthukumar, “A review on Fenton and improvements to
the Fenton process for wastewater treatment,” J. Environ. Chem. Eng., vol. 2, no. 1,
pp. 557–572, 2014.
[19] F. Gozzi, A. Machulek, V. S. Ferreira, M. E. Osugi, A. P. F. Santos, J. A. Nogueira,
R. F. Dantas, S. Esplugas, and S. C. de Oliveira, “Investigation of chlorimuron-ethyl
degradation by Fenton, photo-Fenton and ozonation processes,” Chem. Eng. J., vol.
210, pp. 444–450, 2012.
[20] C. M. Teh and A. R. Mohamed, “Roles of titanium dioxide and ion-doped titanium
dioxide on photocatalytic degradation of organic pollutants (phenolic compounds and
dyes) in aqueous solutions: A review,” J. Alloys Compd., vol. 509, no. 5, pp. 1648–
1660, 2011.
[21] J. Herney-Ramirez, A. M. T. Silva, M. a. Vicente, C. a. Costa, and L. M. Madeira,
“Degradation of Acid Orange 7 using a saponite-based catalyst in wet hydrogen
peroxide oxidation: Kinetic study with the Fermi’s equation,” Appl. Catal. B Environ.,
vol. 101, pp. 197–205, 2011.
[22] S. Rahim Pouran, a. R. Abdul Aziz, and W. M. A. Wan Daud, “Review on the main
advances in photo-Fenton oxidation system for recalcitrant wastewaters,” J. Ind. Eng.
Chem., vol. 21, pp. 53–69, 2015.
90 Photocatalytic degradation of Orange II dye using zeolite X - Fe catalyst
synthesized from coal fly ash
[23] G. Feng, Z.-H. Lu, D. Yang, D. Kong, and J. Liu, “A first principle study on Fe
incorporated MTW-type zeolite,” Microporous Mesoporous Mater., vol. 199, pp. 83–
92, Nov. 2014.
[24] R. Gonzalez-Olmos, F. Holzer, F.-D. Kopinke, and a. Georgi, “Indications of the
reactive species in a heterogeneous Fenton-like reaction using Fe-containing
zeolites,” Appl. Catal. A Gen., vol. 398, no. 1–2, pp. 44–53, May 2011.
[25] S. H. Tian, Y. T. Tu, D. S. Chen, X. Chen, and Y. Xiong, “Degradation of Acid Orange
II at neutral pH using Fe2(MoO4)3 as a heterogeneous Fenton-like catalyst,” Chem.
Eng. J., vol. 169, no. 1–3, pp. 31–37, May 2011.
[26] Y. Yan, S. Jiang, H. Zhang, and X. Zhang, “Preparation of novel Fe-ZSM-5 zeolite
membrane catalysts for catalytic wet peroxide oxidation of phenol in a membrane
reactor,” Chem. Eng. J., vol. 259, pp. 243–251, Jan. 2015.
[27] V. K. Gupta and Suhas, “Application of low-cost adsorbents for dye removal--a
review.,” J. Environ. Manage., vol. 90, no. 8, pp. 2313–42, Jun. 2009.
[28] C. López, “Oxidación del tinte azo Orange II mediante MnP en\nreactores
enzimáticos operados en continuo,” 2005.
[29] P. Payra P, Dutta, “Zeolites: A Primer,” 2003.
[30] J. M. Martín, “Síntesis, caracterización y aplicaciones catalíticas de zeolitas básicas,”
2001.
[31] C. S. Cundy and P. a. Cox, “The hydrothermal synthesis of zeolites: Precursors,
intermediates and reaction mechanism,” Microporous Mesoporous Mater., vol. 82,
no. 1–2, pp. 1–78, Jul. 2005.
[32] X. Zhang, D. Tang, and G. Jiang, “Synthesis of zeolite NaA at room temperature: The
effect of synthesis parameters on crystal size and its size distribution,” Adv. Powder
Technol., vol. 24, no. 3, pp. 689–696, May 2013.
References 91
[33] M. S. Nabavi, T. Mohammadi, and M. Kazemimoghadam, “Hydrothermal synthesis of