In2Rail Project Title: INNOVATIVE INTELLIGENT RAIL Starting date: 01/05/2015 Duration in months: 36 Call (part) identifier: H2020-MG-2014 Grant agreement no: 635900 Deliverable D2.3 Embedded & Integrated Sensors: Systems Design Hierarchy Report Due date of deliverable Month 12 (GA) – Month 26 (EC review) Actual submission date 30-06-2017 Organization name of lead contractor for this deliverable TRV Dissemination level PU Revision FINAL – Updated after EC review
Transcript
In2Rail
Project Title: INNOVATIVE INTELLIGENT RAIL
Starting date: 01/05/2015
Duration in months: 36
Call (part) identifier: H2020-MG-2014
Grant agreement no: 635900
Deliverable D2.3 Embedded & Integrated Sensors: Systems Design Hierarchy
Report
Due date of deliverable Month 12 (GA) – Month 26 (EC review)
Actual submission date 30-06-2017
Organization name of lead contractor for this deliverable TRV
Basic information in chapter 4 and 8, specific information section 11.1.1, 11.1.5, 11.1.6, 11.2.5 and 11.2.6
Contributor(s) All participants Section 6.5 has been discussed in group.
Ansaldo STS (ASTS) Federico Papa Enzo Sorrentino
Description of safety critical information related to interlocking systems in Section 7.2.4 and 12.3 “Manufacturers of Interlocking Systems”. Link with the WP9 “asset status representation” activities.
Chalmers University of Technology (CHALMERS) Björn Pålsson
Section 4.4 motivations of S&C measurement data for R&D purposes and part of section 6.5 with a list of monitored parameters. Summary of the work in EU-project D-rail, section 11.1.3. Structuring the whole document
Deutsche Bahn AG (DB) Franz Löffler
Providing expert S&C knowledge, existing asset data and guidance on current standards and policies. Defining selection and evaluation criteria
Luleå Tekniska Universitet (LTU) Matti Rantatalo
Writing about process-industry
Network Rail (NR) Chris Rowley
Structuring the whole document Writing Executive Summary and chapter 8
SNCF Charles Voivret
Providing expert S&C knowledge, existing asset data and guidance on current standards and policies. Defining selection and evaluation criteria
Systra (SYSTRA) Nicolas Lestoille
Contribution to the identification of measurements technologies and strategies for S&C components and for the whole system condition (Section 6.2)
Trafikverket (TRV) Kalle Karttunen
Writing section 12.1– Automotive Industry Structuring the whole document
Knowledge about measurement with accelerometers, geophones and similar technology. Contribute to section 5.1.1 and 6.1.1. Also involved in structuring the document.
Vossloh Cogifer Patrick De Lavallee
Knowledge about S&C manufacturing and system for condition monitoring, section 7.2.2
Review Comments Following the In2Rail midterm review on Tuesday 28th February 2017, this deliverable was requested for revision by the European Commission in the assessment report #Ref. Ares(2017)1734456 - 31/03/2017, In2Rail can confirm that the review comments have been duly considered and this modified report contains revisions to address these specific points.
The below table provides an index to Sections of the revised document that contain the responses to the review comments.
Revision Requested from EC Revision in document
More evidence is necessary concerning how integrated sensors could be embedded into S&C
See Section 6.4
System principle/concept design needed, clearly indicating the path leading to the aspects to be monitored
See Section 5 for how the information is related to the stakeholders. See Section 6 to correlate technical solutions to the information that is to be captured.
System principle\concept design should include feasibility analysis
See Section 6. For each Section there has been included a sentence about feasibility. For the most promising technologies the feasibility analysis will be developed further in D2.4
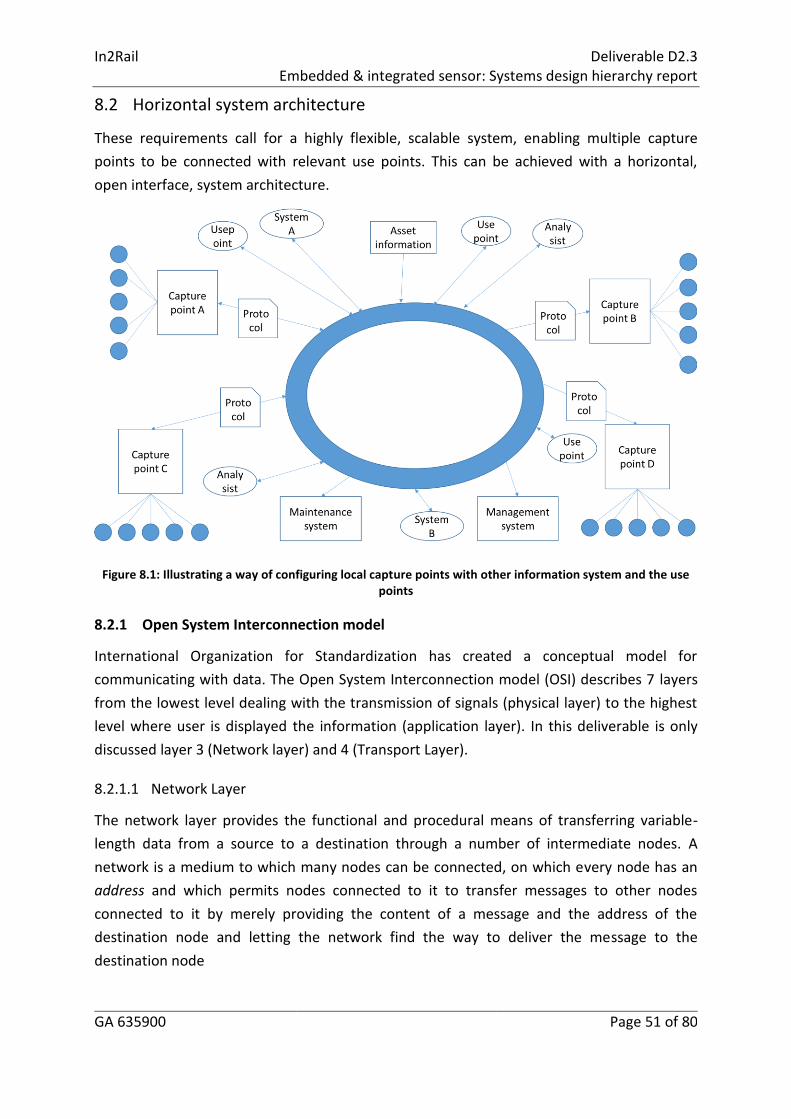
Data structure design needs to be included See Section 8.2.1 This has now included a discussion about an Open System Interconnection model that structures computing system design into layers. It is however acknowledged that the data structure design is still to be developed further and we have not been able to address this in this D2.3 revision to our satisfaction, and therefore propose to ensure that it is adequately covered in the ongoing activity forming the next deliverable D2.4.
Signalling process requirements shall be defined See Section 6.2
Shortlisting fewer monitoring items\aspects which are expected to offer the most feasible and reliable options, rather than listing all aspirational whole-system monitoring systems with lack of clarity over their applicability to S&C. Three issues would also be suggested to be further investigated in the course of the next stage: number of sensors/amount of data to be collected and interpreted, batteries life and maintenance implications for the batteries, and finally SIL (system integrity level) associated with detection and monitoring.
This has been addressed in that in each part of Section 6 the feasibility of measurement parameters has been described. As additional solutions may emerge that prove more reliable and at lower cost, the descriptions have remained the same in the introduction of Section 6. However, any technologies and information that have the highest priority have been identified.
A second measurement is to measure the deviation between the actual and the ideal form
of the switch blade in the final position. This is possible by measuring the absolute
coordinates of the switch blade. This is information for preventative or predicted
maintenance.
5.3.5 Monitoring of narrowest flange way and check rail distance
The distance between the switch blade tip and the stock rail on the open side must be at
least 55 mm according to TSI Infrastructure (maximum free wheel passage is 1380 mm) to
avoid the wheel flange to hit the tip of the blade. Also at the crossing the check rail need to
be correctly positioned to avoid the opposite wheel to hit the crossing nose. This is
information for preventative maintenance.
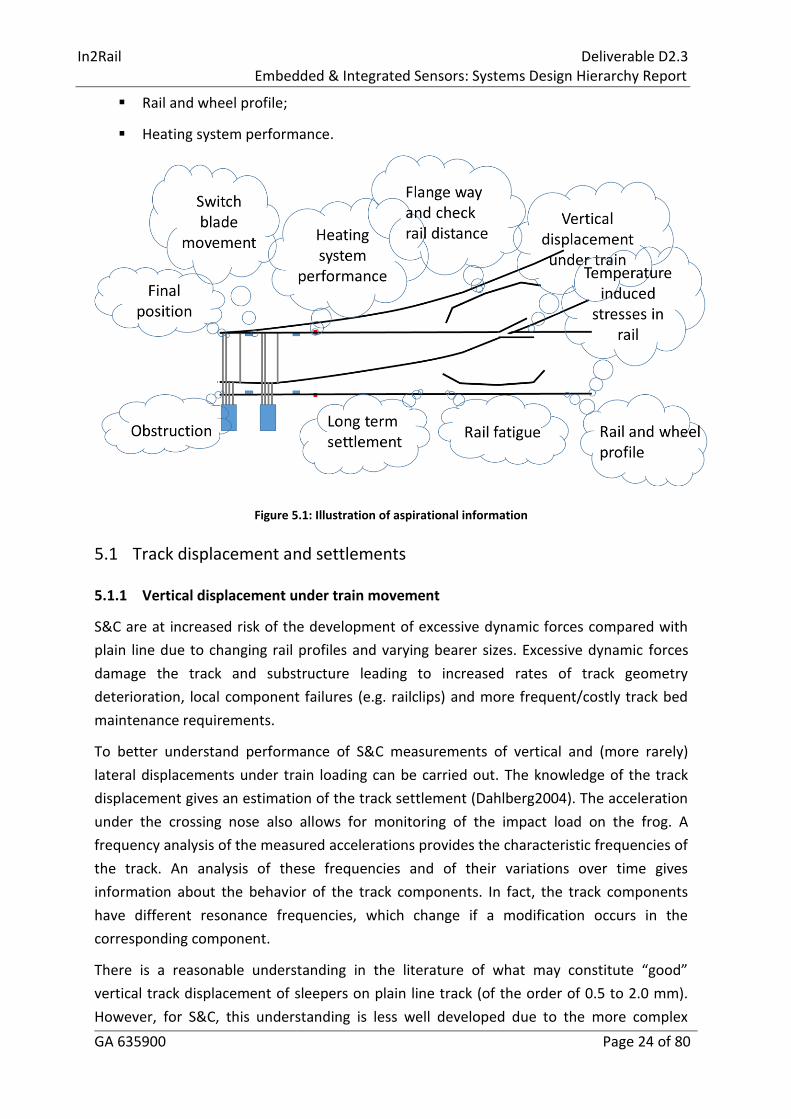
5.3.6 Rail and wheel profile
The rail profile in the transfer zones (i.e. switch panel and crossing panel) is important for
the wheel/rail interaction. The most important parameters are the slope angle at the
crossing nose, the thickness of the switch blade. Visible damages on the switch blade
should also be possible to detect.
This information is used for predictive maintenance and also to check that the
maintenance has been correctly done. The wheel profile is of interest for the train
operators.
This information could be combined with the actual wheel profiles such that simulations of
wheel /rail interactions can be used in simulations to predict the degradation of the rail
material.
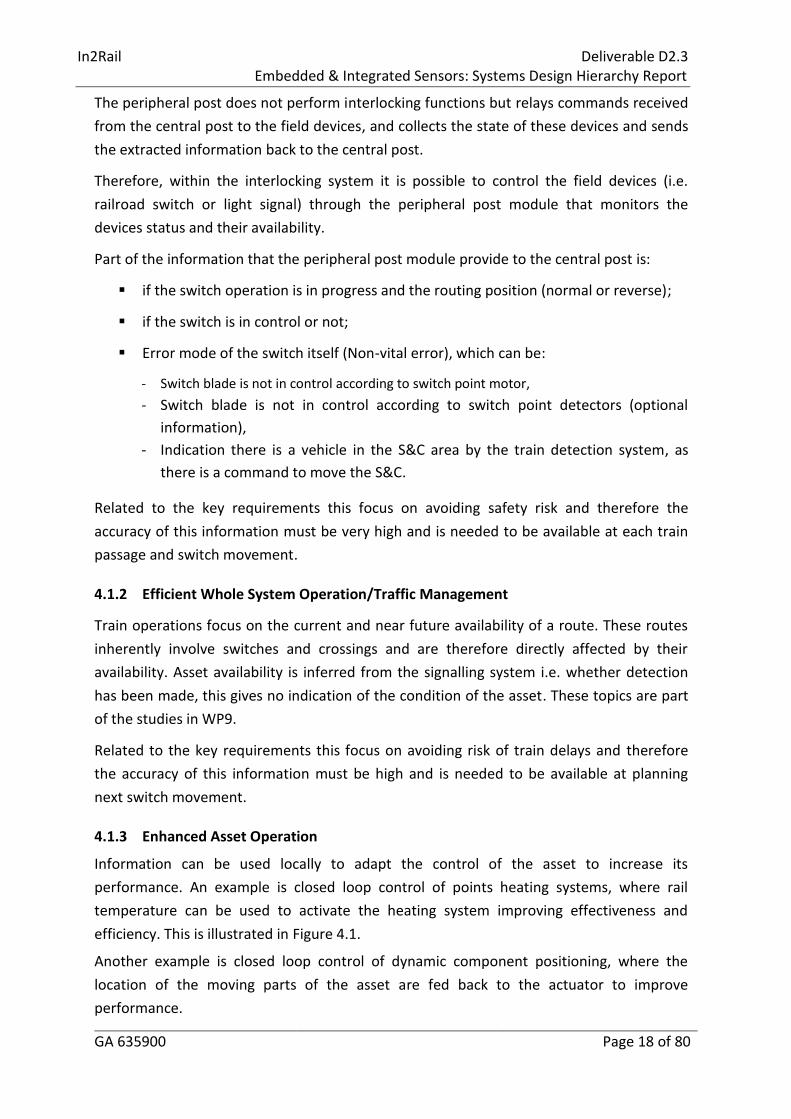
5.4 Heating system performance
Heating system is controlled by measuring outdoor and rail temperature. Rail temperature
is not the same in the whole S&C and could be measured on more than single points in the
S&C. Weather prognosis would be a more proactive way of controlling the heating system
and would save energy as the heating is not necessary if there is now new snow coming
into the S&C. All this information can be used to enhance operational performance.
In2Rail Deliverable D2.3
Embedded & Integrated Sensors: Systems Design Hierarchy Report
GA 635900 Page 28 of 80
6 Measurement Technologies and Strategies
Relevant sensor technologies for measuring the parameters mentioned in Section 5 are
presented in the following subsections. Each parameter category has its own subsection
which contains a table of relevant measurement technologies. Many technologies are
applicable to multiple categories but are not repeated in each table to avoid duplication.
The most promising areas for embedded sensor technology within S&Cs are measuring:
motor current and position of the switch blade during motions;
acceleration at the transition zones of the S&C as displacement, stiffness and cracks
can be identified with basically the same technology;
temperature in the rail to check the efficiency of the heating elements;
specific weather condition to improve switch heating.
Areas that still is feasible but need more for development before being implemented are
measuring:
bending and longitudinal stresses;
by acoustic emission or embedded ultrasonic sensors to see crack growth;
by cameras and use vision systems to identify for instance obstruction objects in the
switch area.
6.1 Basic Technology for Measurements
Measurements are based on physical or chemical phenomena. The international system of
units (SI) defines 7 basic physical quantities. They are:
Length (Metre);
Mass (Kilogram);
Time (Second);
Electric current (Ampere);
Temperature (Kelvin);
Luminous intensity (Candela);
Amount of substance (Mole).
There are an unlimited number of derived quantities and SI defines 22 quantities with own
units that are directly related to the base units.
In2Rail Deliverable D2.3
Embedded & Integrated Sensors: Systems Design Hierarchy Report
GA 635900 Page 29 of 80
Here are some examples that might be of interest:
Angle (radian);
Force, weight (Newton);
Pressure, stress (Pascal);
Voltage (electrical potential difference), electromotive force (Volt);
Electric resistance, impedance, reactance (ohm).
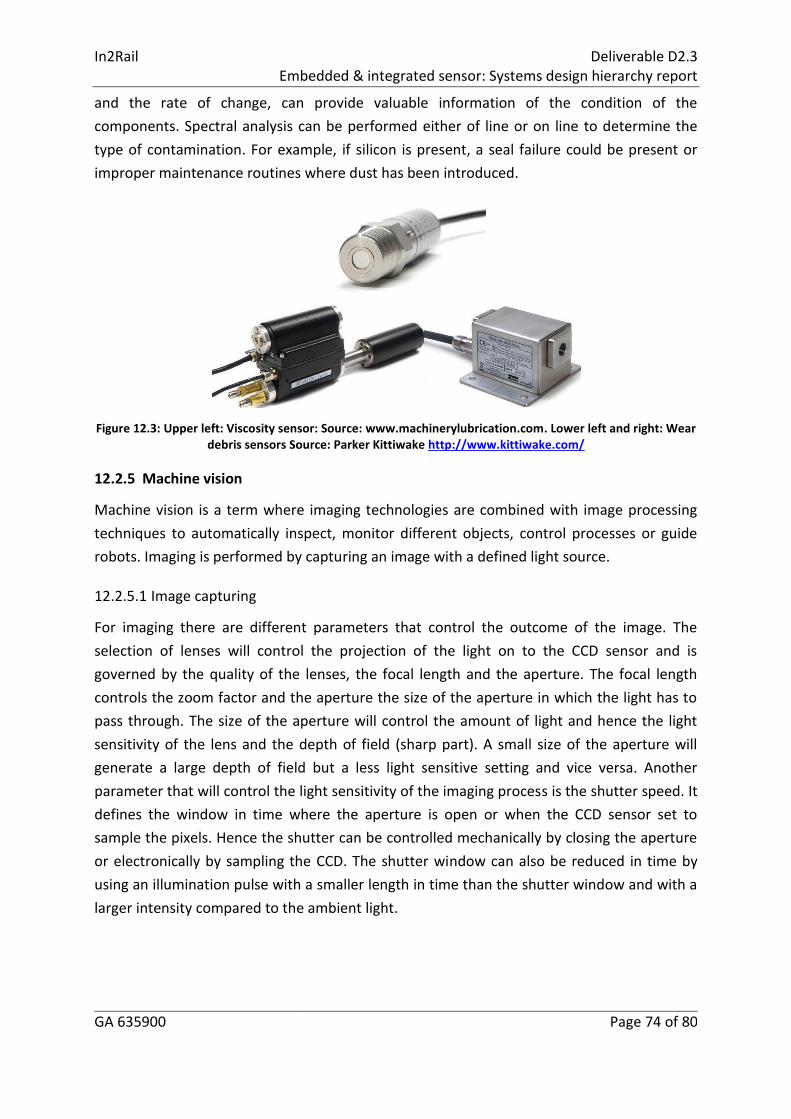
The variants of sensors are large and cannot easily be described. Data from sensors might
need to be recalculated into another entity before they are presented, an example of this is
that forces are presented in Newton even if the sensor measures strain. The conversion
might be simple if the physical principle is well defined, more complex relationships may
require simulation techniques for the conversion.
6.1.1 Measuring dynamic track displacement and settlements
Track settlements occur more often in and around the S&C than in plain line because of the
stiffness variations in the turnout and the dynamic forces that occur in the transfer zones.
Accelerometers embedded in the ballast layer enable computation of the track displacement
(Cui2014). It seems relevant to place accelerometers under the switch panel, under the
closure panel, and under the crossing nose.
Track mounted/embedded sensors are commonly used to obtain acceleration/velocity or
displacement measurements of sleepers or rails in response to trains passing. The data
obtained may be analysed to determine whether a sleeper or rail is performing acceptably.
More recently methods to evaluate track performance using frequency analysis of such
measurements have also been proposed.
To achieve this, currently available and relatively mature, sensor types such as geophones
and accelerometers can be mounted onto sleepers/bearers or rails. Most commonly the
native sensor measurements are then converted to displacements using established signal
processing and mathematical techniques. The calculated displacements are used to evaluate
how well the track is performing based on both the magnitude of individual location
displacements and the variation in displacement magnitudes along the track.
The principal sensors used and methods to determine displacement over time are:
Accelerometers;
Geophones;
video camera followed by digital analysis of the images captured (digital image correlation, DIC);
laser systems with Position Sensitive Devices (PSD) mounted on sleepers/rails to detect the position of the laser;
multi-depth-deflectometers (MDD).
In2Rail Deliverable D2.3
Embedded & Integrated Sensors: Systems Design Hierarchy Report
GA 635900 Page 30 of 80
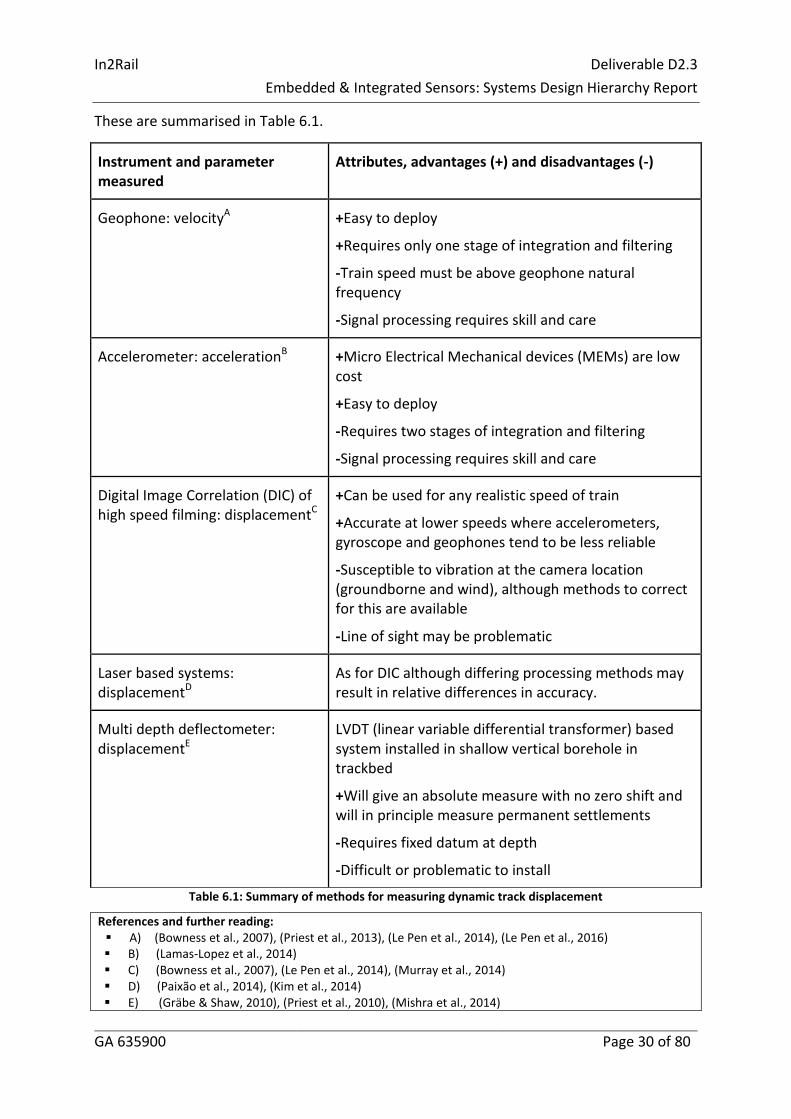
These are summarised in Table 6.1.
Instrument and parameter measured
Attributes, advantages (+) and disadvantages (-)
Geophone: velocityA +Easy to deploy
+Requires only one stage of integration and filtering
-Train speed must be above geophone natural frequency
-Signal processing requires skill and care
Accelerometer: accelerationB +Micro Electrical Mechanical devices (MEMs) are low cost
+Easy to deploy
-Requires two stages of integration and filtering
-Signal processing requires skill and care
Digital Image Correlation (DIC) of high speed filming: displacementC
+Can be used for any realistic speed of train
+Accurate at lower speeds where accelerometers, gyroscope and geophones tend to be less reliable
-Susceptible to vibration at the camera location (groundborne and wind), although methods to correct for this are available
-Line of sight may be problematic
Laser based systems: displacementD
As for DIC although differing processing methods may result in relative differences in accuracy.
Multi depth deflectometer: displacementE
LVDT (linear variable differential transformer) based system installed in shallow vertical borehole in trackbed
+Will give an absolute measure with no zero shift and will in principle measure permanent settlements
-Requires fixed datum at depth
-Difficult or problematic to install
Table 6.1: Summary of methods for measuring dynamic track displacement
References and further reading: A) (Bowness et al., 2007), (Priest et al., 2013), (Le Pen et al., 2014), (Le Pen et al., 2016) B) (Lamas-Lopez et al., 2014) C) (Bowness et al., 2007), (Le Pen et al., 2014), (Murray et al., 2014) D) (Paixão et al., 2014), (Kim et al., 2014) E) (Gräbe & Shaw, 2010), (Priest et al., 2010), (Mishra et al., 2014)
In2Rail Deliverable D2.3
Embedded & Integrated Sensors: Systems Design Hierarchy Report
GA 635900 Page 31 of 80
The described technologies can be used for measuring the parameters mentioned in Chapter
5.1.1 and 5.1.2.
The benefit of the information about dynamic displacements is an early warning that the
movement of critical sleepers is above a certain threshold. The maintenance decisions to be
made is when to tamp, when to adjust crossing profile.
The system can be built robust by using covers. Dynamic measurement is a realistic
candidate for an embedded system.
Measuring long term settlements will give a good understanding of the degradation of track
geometry over time. This information is not used for maintenance decisions, instead it is
needed to avoid problems when building on new sites with soil conditions that would create
problems.
There is no known available embedded system for S&C to measure settlements. 3D scanning
technology can be used, but this would be a standoff equipment or a vehicle performing the
scanning.
To measure static settlements is not a realistic candidate for an embedded system.
6.1.2 Measuring impact force, rail fatigue and temperature stresses
Excessive forces appear more frequent in S&C than in plain line. Forces and accelerations
can be measured to predict wear and fatigue. The measurements have to be performed on
switch rails, stock rails and the crossing nose.
The dynamic train-track interaction in the crossing panel is characterised by the high
frequency impact force that typically occurs when a wheel passes over the crossing. Contrary
to the crossing panel, the switch panel contains no sharp rail discontinuity, and therefore no
corresponding high-frequency impact force. High-frequency response is therefore of less
interest, instead there is a need to obtain information on the deformation of the full track
structure in the switch panel as the vertical loading and therefore settlement behaviour etc.
should be quite similar to regular track besides around the Point Operating Equipment
where classic track geometry maintenance techniques are impeded. The effect this
maintenance discontinuity may have on the S&C settlement behaviour could be explored.
Stock rail to switch rail discontinuity causes large lateral contact forces in the diverging route
which makes it also interesting to focus on obtaining information about lateral dynamics in
the switch panel.
Vertical loads can be measured using strain gauges glued on the rail web (Kourousis, 2015).
Similar gauges can be applied on the crossing nose to measure the vertical load on the
crossing nose. The vertical load can then be computed knowing the behavior law of the rail
material. To control the fatigue behavior of the rails, it is necessary to count the number of
solicitation cycles of the rail. This can be done using a wheel counter sensor, which detects
In2Rail Deliverable D2.3
Embedded & Integrated Sensors: Systems Design Hierarchy Report
GA 635900 Page 32 of 80
the wheel presence using inductive currents and which is fixed on the rail. This sensor can
also measure the vehicle speed. Lateral forces can be measured using strain gauges glued on
the rail (Lin2015). Tangential forces can be measured by using instrumented wheel set
(Pålsson, 2011) but so far it seems unlikely to measure it along the whole S&C with
embedded sensors. From the measurement of tangential forces T and the creepage γ at the
wheel rail contact, an estimation of the rail wear can be deduced, assuming that the wear is
proportional to the product Tγ.
New measurement methods could increase the precision of the estimation of the rolling
contact fatigue and of the rail wear. For instance, an ultrasonic array placed under the rail,
enables to measure the size of the contact zone and the pressure at the wheel-rail contact
(DwyerJoyce2009). Optical fibers attached to the rail can also be used to detect broken rails,
or be used as strain sensors to measure the forces at the wheel-rail contact (Kourousis,
2015). Finally, the measurement of the noise produced by the wheel-rail contact may inform
the infrastructure manager about the degradation of the rail surface: for future works, it
could be interesting to characterize the noise produced by the impact load on the crossing
nose and by the discontinuities in the wheel rail contact, and to study its variation over the
time.
Dynamic simulation is also an interesting source of information for the infrastructure
managers, once the simulation had been validated using measured parameters. In fact, the
simulation of the train dynamics on the turnout yields a precise estimation of rolling contact
parameters.
Acoustic Emission techniques have been developed by using sensitive piezoelectric sensors
to detect energy propagating through material under stress such as airplane components
(Blitz 1991). This can be used to detect crack propagation in crossings (see Section 11.2.1).
Other possible technologies are based on ultrasonic probes and visual inspection by camera.
Eddy current measurement is today done by vehicle is not probable to be embedded.
In2Rail Deliverable D2.3
Embedded & Integrated Sensors: Systems Design Hierarchy Report
GA 635900 Page 33 of 80
Instrument and parameter measured Attributes, advantages (+) and disadvantages (-)
Strain gauges (electrical)A
+ Not depended on train speed + Low cost - Relative measurement as strain gauges is not stable over time - Signal processing requires skill and care
Fiber optical strain gauges + Absolute measurement as they are stable over time - Strain is temperature dependent - High cost
Piezo-electrical force transducers
Inductive sensor
Microphone + Easy to deploy - Requires filtering and spectral analysis - Signal processing requires skill and care - Dependence on train speed
Ultrasonic
Acoustic EmissionB Table 6.2: Summary of methods for measuring rail impact and temperature stress
References and further reading: A) (Kouroussis, et al., 2015), (Lin, Kimoto, & Suda, 2015), (Pålsson & Nielsen, 2011), (Dwyer-Joyce, Yao,
The described technologies can be used for measuring the parameters mentioned in Section
5.2.1 and 5.2.2.
The benefit of the information is a late warning that there is a crack in a component or an
early warning that the stress free temperature is out of range.
The maintenance decisions to be made is when to surface weld, replace the component or
restore the stress free temperature.
There are several technical options to observe cracks. No known system exist today that is
embedded in S&C design. If it is possible to use either sound or vibration and identify
deviation from normal behaviour this would be interesting to develop further.
The today’s technology to find cracks is based on trains that measure by ultrasonic or eddy
current methods. As a complementary this can also be made by hand held equipment. This is
candidate for an embedded system that needs further development.
There are two mayor methods to measure the stress free temperature, either by lifting the
rail and measure lifting force vs displacement or by cutting the rail and measure the
difference in gap before and after the cut. In WP 6 a train based NDT-method is under
development. In Spain (Ineco) work has been done to build system with strain gauges to
measure probability of buckling. This is probably not a candidate for an embedded system as
the cost to keep the system calibrated is high relatively too other possible way measure.
In2Rail Deliverable D2.3
Embedded & Integrated Sensors: Systems Design Hierarchy Report
GA 635900 Page 34 of 80
6.1.3 Switch blade position in movement and final position
The effort delivered by the points motor may be determined by monitoring the electrical
current it draws. This may be used infer the quality of the motion of the switch blade during
operation. This technology is already established. By analysing the signal it is possible to
identify certain problems when moving the switch blade. A more complete picture can be
obtained by directly measuring the forces and the position of the switch blade during
movement. Forces can be measured with piezoelectric or resistive sensors. Position can be
measured by either mechanically attached sensors or optical sensors.
Vibration in control, motor and stretcher bars can be measured by accelerometers or strain
gauges. Integrity in sliding chairs could be measured by attaching wire of the same integrity
directly to the component and running a signal voltage through the wire. Both the wire and
the component will fail at the same time which will be indicated by a loss of voltage in the
wire.
The switch blade form during movement can be measured by a machine vision system, 3D-
scanner technology or by strain measurement along the switch blade. An example of
measuring strain on a long object is using fibre-optics. It possible to detect if rollers are
rotating during the switch blade movement by rotation sensors. If the rollers do not move
either the switch blade is not in contact or the roller units have failed.
The final position is detected by sensors included in the safety system. Combining
information when these sensors are activated in time and the actual position can be used to
make adjustments.
Objects that can obstruct the movement can be detected before the switch blade is moved
by a machine vision system.
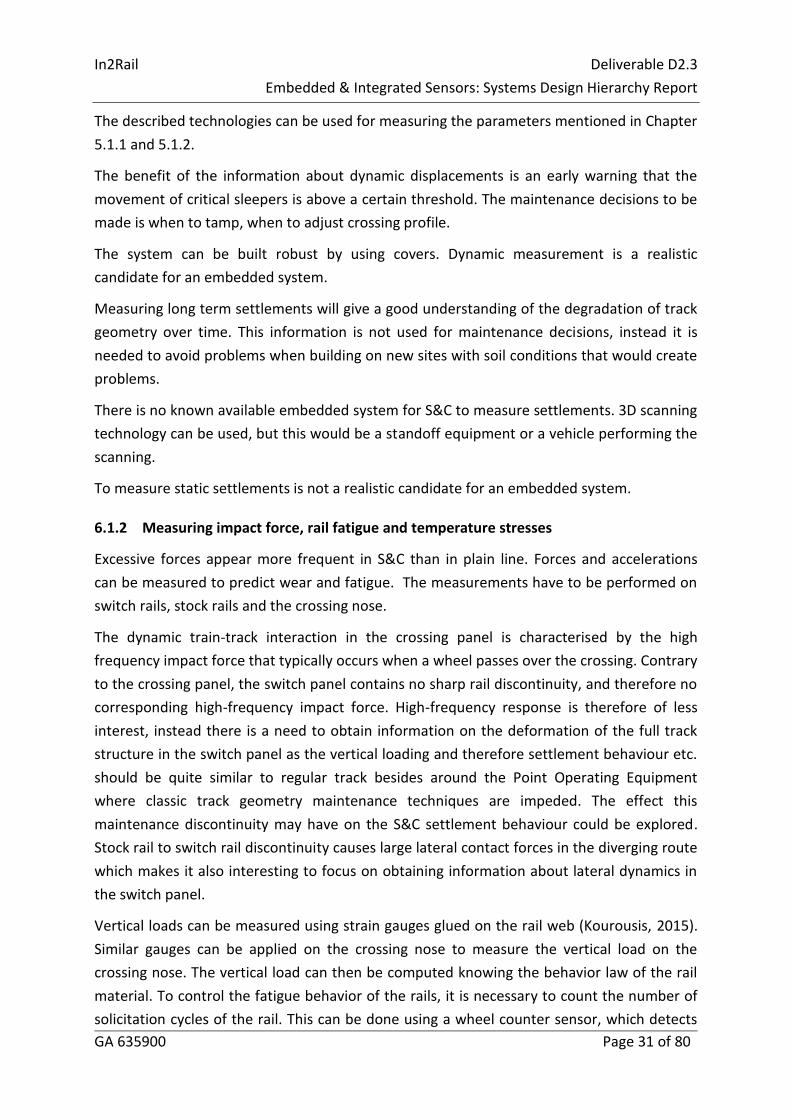
Instrument and parameter measured Attributes, advantages (+) and disadvantages (-)
Motor current and voltage + Easily deployed + High accuracy + Time of movement can be measured + Possible to integrate in interlocking system
Machine vision system + Can be used for multiple purposes + Can cover more than one S&C - High cost - Needs illumination
Rotation sensor
Integrity sensor Table 6.3: Summary of measuring switch blade position
The described technologies can be used for measuring the parameters mentioned in Section
5.3.1, 5.3.3 and 5.3.4.
This type of information can be used by WP9 to predict the probability of future failures or
alarm failed components (bars and gliding chairs).
In2Rail Deliverable D2.3
Embedded & Integrated Sensors: Systems Design Hierarchy Report
GA 635900 Page 35 of 80
The maintenance decisions to be made is to adjust, replace component or repair point
machine.
Current measurements is already a standard product by several manufacturers. Though this
is done in the interlocking system and is not embedded in the S&C.
To use accelerometers for this purpose might be easier than for sleeper accelerations
(section 6.1.1) as changes in frequency response is probably the method to be used. It might
be more difficult to place accelerometer for these components than for the sleeper.
The easiest way to detect obstruction is to analyse the signal when the switch blade is
moving together with a distance signal. An obstruction should early in the moving cycle give
higher electrical current. This method is feasible. Another method is to use cameras to
observe any objects.
There exist automatic system in Japan for rinsing the area from blocking objects. Without
automatic system personal needs to go there and until then the S&C is not possible to move.
Control circuit in the point machine, in the middle between two point machines as well as
after the last point machines should be measured individually. It should be a further
development of the system for measuring electrical current. Interlocking systems have high
demands on safety and therefore no condition monitoring system is allowed to be
connected directly. A method to read relays without being electrical connected has been
developed by Strukton.
Motor current measurement is an existing embedded system that needs development to
cope with more failure modes. To develop measurement on when control circuits are active
is one development. Acceleration measurement in the switch panel can also be added. All
these system are possible candidates for monitoring system.
6.1.4 Profile and gauge measurement
6.1.4.1 Profile measurement
Rail profile and gauge can be measured by laser cameras mounted on passing vehicles.
Embedded measurement systems could be used, but to form a valid business case the
failure development time must be shorter than the interval possible for vehicle mounted
inspections. The described technologies can be used for measuring the parameters
mentioned in Section 5.3.5 and 5.3.6.
6.1.4.2 Check rail gauge
Monitoring of the check rail gauge and blade gauge is motivated as an enlargement or a
narrowing of these gauges could make the train derail. Distance sensors could be installed
In2Rail Deliverable D2.3
Embedded & Integrated Sensors: Systems Design Hierarchy Report
GA 635900 Page 36 of 80
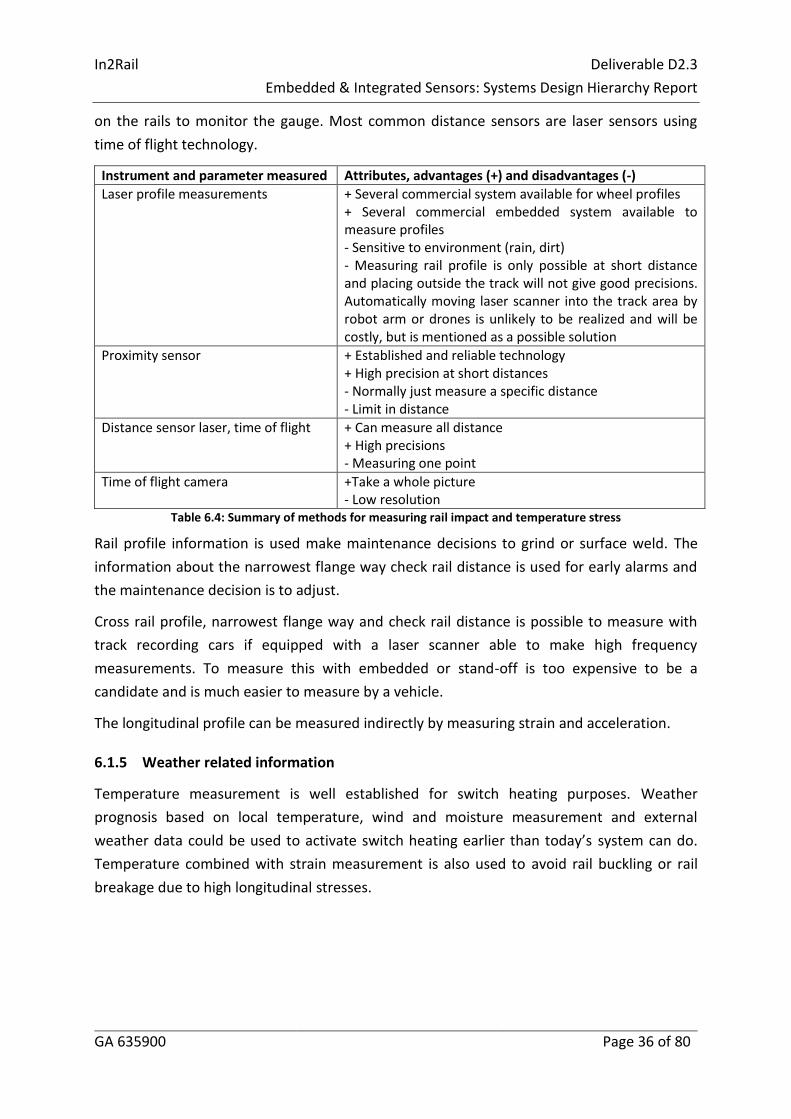
on the rails to monitor the gauge. Most common distance sensors are laser sensors using
time of flight technology.
Instrument and parameter measured Attributes, advantages (+) and disadvantages (-)
Laser profile measurements + Several commercial system available for wheel profiles + Several commercial embedded system available to measure profiles - Sensitive to environment (rain, dirt) - Measuring rail profile is only possible at short distance and placing outside the track will not give good precisions. Automatically moving laser scanner into the track area by robot arm or drones is unlikely to be realized and will be costly, but is mentioned as a possible solution
Proximity sensor + Established and reliable technology + High precision at short distances - Normally just measure a specific distance - Limit in distance
Distance sensor laser, time of flight + Can measure all distance + High precisions - Measuring one point
Time of flight camera +Take a whole picture - Low resolution
Table 6.4: Summary of methods for measuring rail impact and temperature stress
Rail profile information is used make maintenance decisions to grind or surface weld. The
information about the narrowest flange way check rail distance is used for early alarms and
the maintenance decision is to adjust.
Cross rail profile, narrowest flange way and check rail distance is possible to measure with
track recording cars if equipped with a laser scanner able to make high frequency
measurements. To measure this with embedded or stand-off is too expensive to be a
candidate and is much easier to measure by a vehicle.
The longitudinal profile can be measured indirectly by measuring strain and acceleration.
6.1.5 Weather related information
Temperature measurement is well established for switch heating purposes. Weather
prognosis based on local temperature, wind and moisture measurement and external
weather data could be used to activate switch heating earlier than today’s system can do.
Temperature combined with strain measurement is also used to avoid rail buckling or rail
breakage due to high longitudinal stresses.
In2Rail Deliverable D2.3
Embedded & Integrated Sensors: Systems Design Hierarchy Report
GA 635900 Page 37 of 80
Instrument and parameter measured Attributes, advantages (+) and disadvantages (-)
Temperature sensor attached to rail (Pt-element)
+ Reliable + Low cost - Point measurement
Infrared camera + Cover long a whole switch blade in one picture - High cost - Depends on the object
Fiber-optic temperature sensor + Cover whole length of a switch blade - High cost
Temperature outdoor (resistance sensor)
Hygrometer
Precipitation
Anemometer Table 6.5: Summary of methods for weather related information
The described technologies can be used for measuring the parameters mentioned in Section
5.4.
This information is used to replace or adjust heating elements as well as adjusting the
regulated temperature.
Wireless temperature loggers is already low cost system that probably can be used in railway
environment. Weather station that can predict coming snowfall should also be possible to
adopt to railway environment.
These are realistic candidates for embedded system.
6.2 Signal processing
To be able to use the information from dynamic measurements some kind of signal
processing is necessary. Signalling processing is not so vital for static measurement (such as
temperature), as the collected values can be directly compared to thresholds or used in
trend graphs without signal processing.
6.2.1 Signal processing requirements for geophones and accelerometers mounted on
sleepers
The use of geophones and accelerometers mounted on the sleeper/bearer tops to measure
track movements on plain line has become established practice [Bowness et al., 2007, Le Pen
et al., 2014, Lama-Lopez et al., 2014, Milne et al., 2016]. To interpret the data obtained,
signal processing in the form of filtering in the frequency domain is required to produce
acceptable acceleration/velocity and displacement data that may be evaluated to monitor
the condition/performance of the track. The filtering removes higher frequencies not
relevant to the major track movements and errors introduced from lower frequencies below
the threshold of linear sensitivity for the sensor used.
In2Rail Deliverable D2.3
Embedded & Integrated Sensors: Systems Design Hierarchy Report
GA 635900 Page 38 of 80
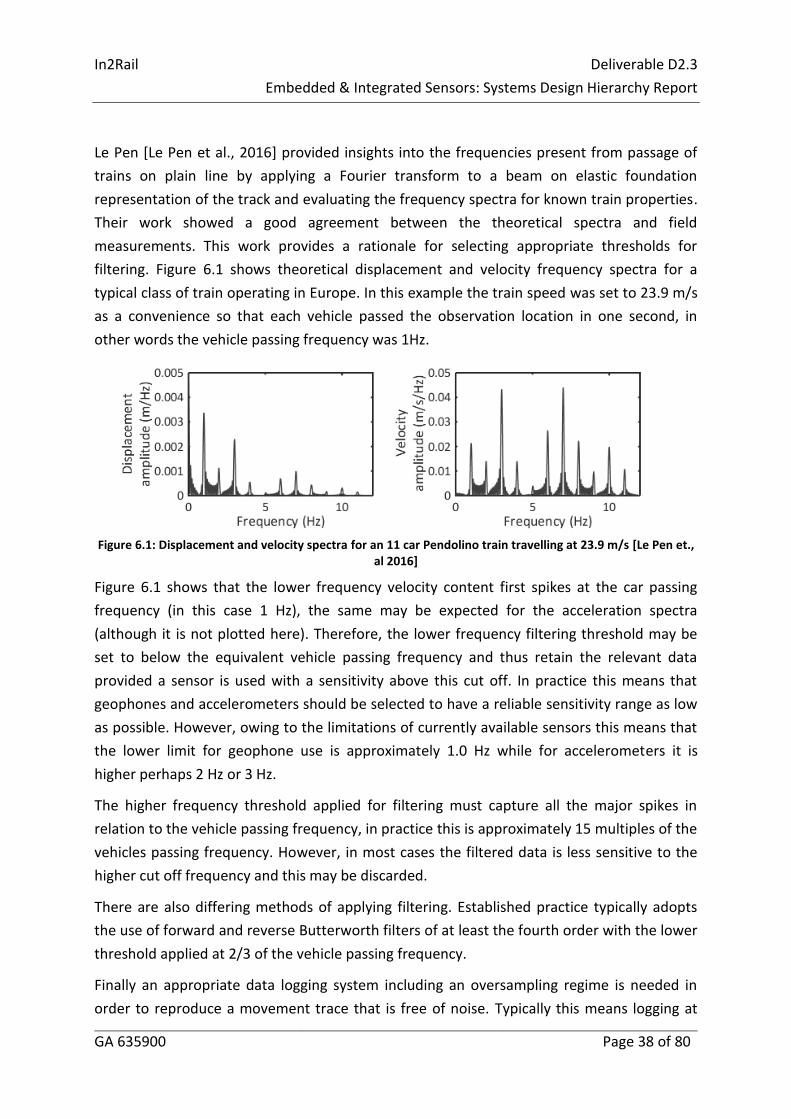
Le Pen [Le Pen et al., 2016] provided insights into the frequencies present from passage of
trains on plain line by applying a Fourier transform to a beam on elastic foundation
representation of the track and evaluating the frequency spectra for known train properties.
Their work showed a good agreement between the theoretical spectra and field
measurements. This work provides a rationale for selecting appropriate thresholds for
filtering. Figure 6.1 shows theoretical displacement and velocity frequency spectra for a
typical class of train operating in Europe. In this example the train speed was set to 23.9 m/s
as a convenience so that each vehicle passed the observation location in one second, in
other words the vehicle passing frequency was 1Hz.
Figure 6.1: Displacement and velocity spectra for an 11 car Pendolino train travelling at 23.9 m/s [Le Pen et.,
al 2016]
Figure 6.1 shows that the lower frequency velocity content first spikes at the car passing
frequency (in this case 1 Hz), the same may be expected for the acceleration spectra
(although it is not plotted here). Therefore, the lower frequency filtering threshold may be
set to below the equivalent vehicle passing frequency and thus retain the relevant data
provided a sensor is used with a sensitivity above this cut off. In practice this means that
geophones and accelerometers should be selected to have a reliable sensitivity range as low
as possible. However, owing to the limitations of currently available sensors this means that
the lower limit for geophone use is approximately 1.0 Hz while for accelerometers it is
higher perhaps 2 Hz or 3 Hz.
The higher frequency threshold applied for filtering must capture all the major spikes in
relation to the vehicle passing frequency, in practice this is approximately 15 multiples of the
vehicles passing frequency. However, in most cases the filtered data is less sensitive to the
higher cut off frequency and this may be discarded.
There are also differing methods of applying filtering. Established practice typically adopts
the use of forward and reverse Butterworth filters of at least the fourth order with the lower
threshold applied at 2/3 of the vehicle passing frequency.
Finally an appropriate data logging system including an oversampling regime is needed in
order to reproduce a movement trace that is free of noise. Typically this means logging at
In2Rail Deliverable D2.3
Embedded & Integrated Sensors: Systems Design Hierarchy Report
GA 635900 Page 39 of 80
400 Hz or above. Depending on the quality of the sensor used the use of a data recording
system capable of applying further noise mitigation measures could also be appropriate.
The above commentary applies to typical passenger vehicles on plain line. More complex
axle spacing’s on locomotive hauled passenger trains and freight vehicles would require
specific evaluation and in general for condition monitoring at a specific site it is preferable to
evaluate a reference train with a repeating succession of at least 4 passenger vehicles
travelling at not much less than 20 m/s for geophones or 50 m/s for accelerometers.
At S & C the more complex rail geometry influences the frequency spectra present and more
work is required to understand how to apply the above signal processing methods which are
optimised for plain line. Additionally it is observed that sensor technology is always
advancing and in the future the train speeds for which these sensors can reliably be used
could reduce.
6.2.2 Signal processing requirements measuring electrical motor current
The normal way to measure electrical motor current depends on the motor in use and the
bearings and gearbox. For DC-motors the voltage is stable and therefore only current is
necessary. For AC-motors both voltage and current needs to be measured while the phase-
angle is not constant.
The analysis is made both in the time domain and in the frequency domain (SKF). The time
domain is used to find if more current is used in some of stages when moving the switch
blade such as:
Start-up current;
Unlocking switch blade;
Moving switch blade;
Locking switch blade;
Shut down of current.
A master curve is created for each individual motor and then each new measurement is
compared to the master curve to see if the deviation is too large.
For the time domain 100 – 200 Hz is sufficient to capture the signal.
The frequency domain is used to find:
Uneven air gap between the rotor and stator;
Damaged Stator or Rotor Bars;
Damaged Windings;
Deteriorating Insulation.
In2Rail Deliverable D2.3
Embedded & Integrated Sensors: Systems Design Hierarchy Report
GA 635900 Page 40 of 80
For the frequency domain more than 200 Hz is necessary to analyse for instance the gearbox.
To combine electrical data with accelerometer signal in the point machine would make the
analysis more precise about which failure mode it might be.
6.3 Whole System Condition
The track is submitted to high forces and accelerations due to the particular running
conditions (discontinuities, impacts, gaps). Monitoring the stresses and the accelerations in
the track is thus of great importance for the infrastructure managers, in order to be able to
predict long term phenomena such that rolling contact fatigue, rail cracks, or track
settlements.
Section 6.5 indicates the most important parameters to be monitored, which lead to a
degradation of the running conditions (delay, vibrations, and noise) and which require a
maintenance action. In any case, a remote monitoring of those parameters reduces
inspections in line, and thus takes part in the reduction of Life Cycle Costs. By compiling
information from multiple sources, an overview is given about the state of the asset. Besides
the actual condition is also needed information about amount of traffic and maintenance
performed. This information can be used by the management to calculate the remaining
useful life.
6.4 Embedded systems and standoff-systems
There are three possibilities to gather data at site, either by having embedded systems, by
using standoff systems or by using vehicle based measurement systems. The In2Rail has
limited the work to the two first aspects.
Embedded system can be delivered by the manufacturer of the S&C and at the installation
be directly connected to information infrastructure.
Standoff systems are those such as cameras, scanning systems, system measuring in
cabinets or systems to measure local weather conditions.
6.4.1 Embedded systems
The three known embedded systems in use are measuring motor current during movement,
temperature for heating systems and acceleration of sleepers/crossing. These systems can
be integrated into the equipment in track. The data is taken to a node computer by cables
and then sent to a server. To avoid cabling, wireless solutions are under development, but so
far battery capacity is an issue to be discussed.
6.4.2 Stand-off systems
To measure current in the interlocking system is a good example of a stand-off system. The
collection of data is done by a local node computer that can be connected to a large number
In2Rail Deliverable D2.3
Embedded & Integrated Sensors: Systems Design Hierarchy Report
GA 635900 Page 41 of 80
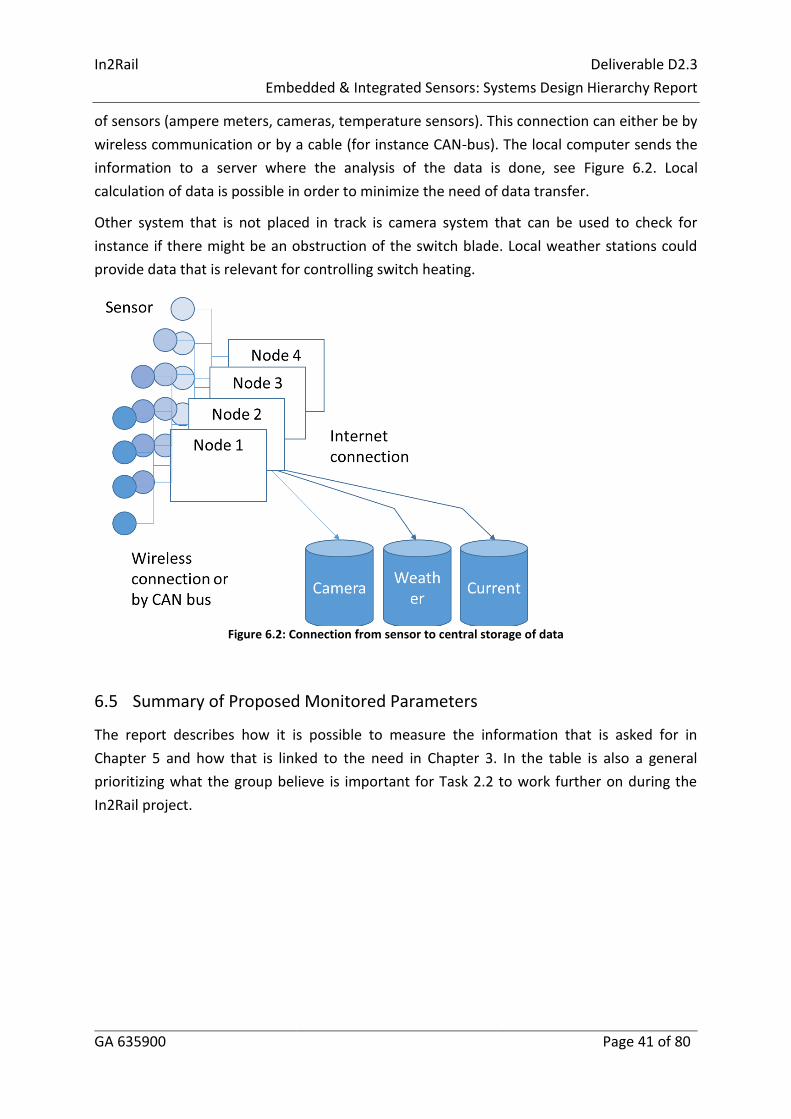
of sensors (ampere meters, cameras, temperature sensors). This connection can either be by
wireless communication or by a cable (for instance CAN-bus). The local computer sends the
information to a server where the analysis of the data is done, see Figure 6.2. Local
calculation of data is possible in order to minimize the need of data transfer.
Other system that is not placed in track is camera system that can be used to check for
instance if there might be an obstruction of the switch blade. Local weather stations could
provide data that is relevant for controlling switch heating.
Figure 6.2: Connection from sensor to central storage of data
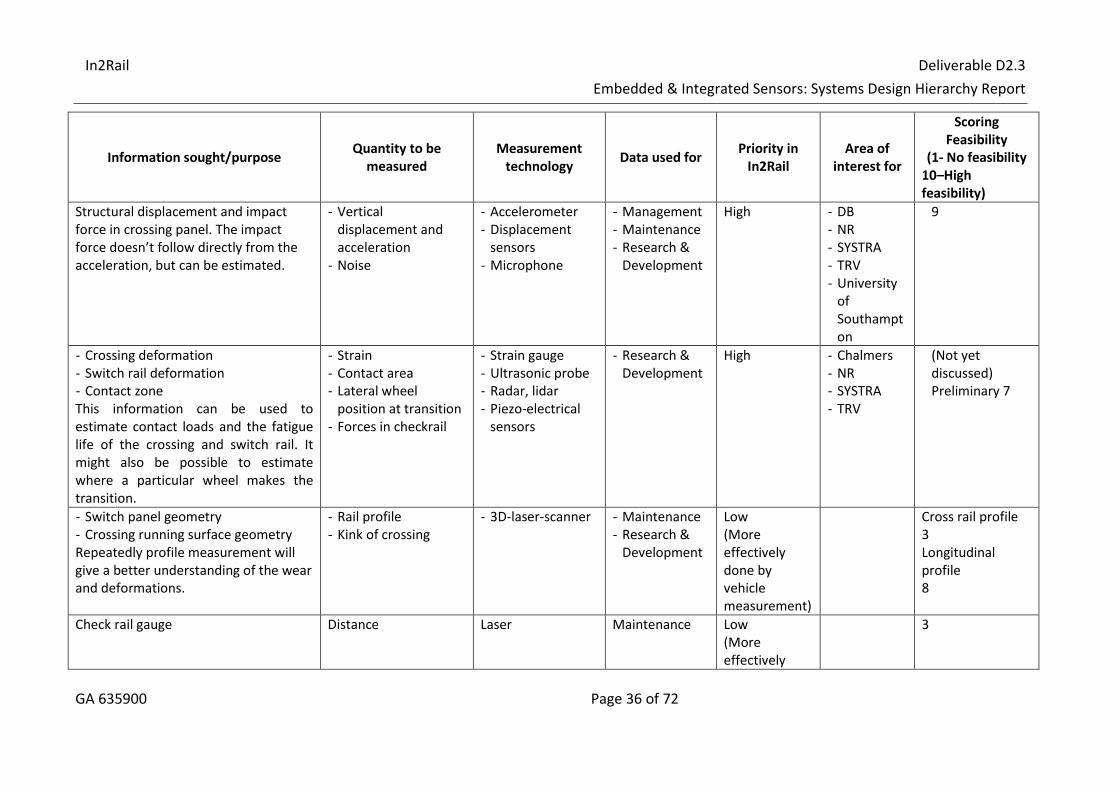
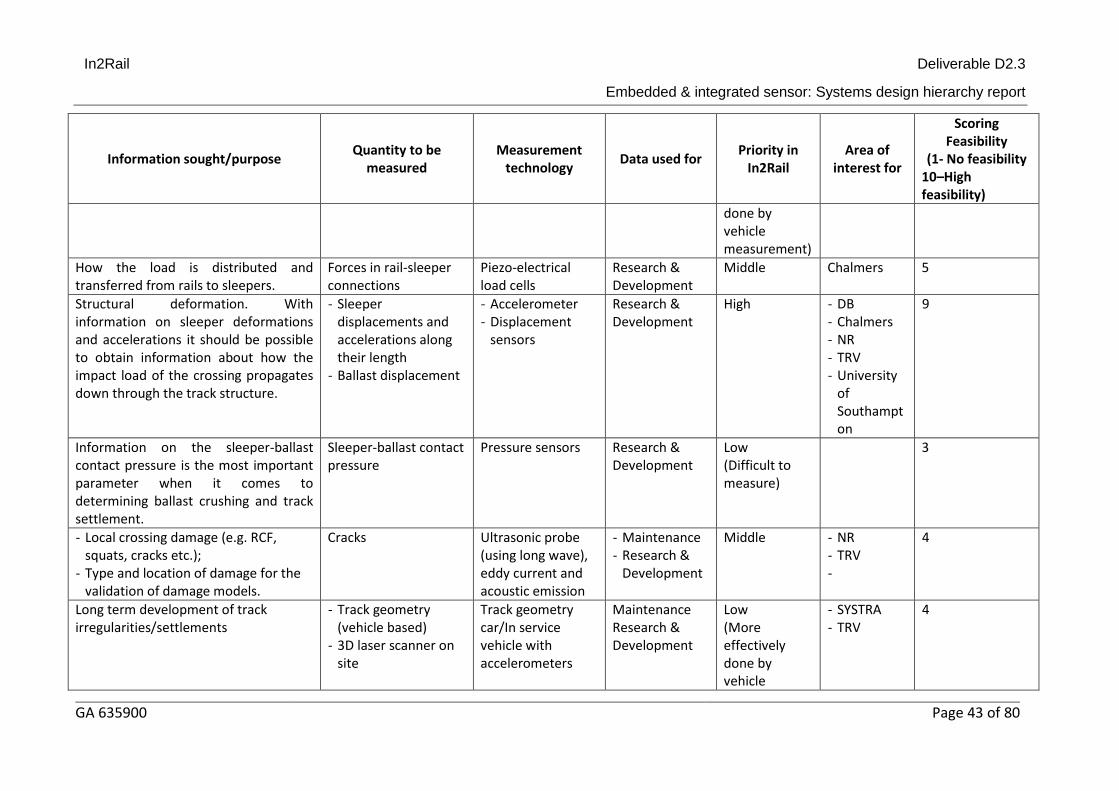
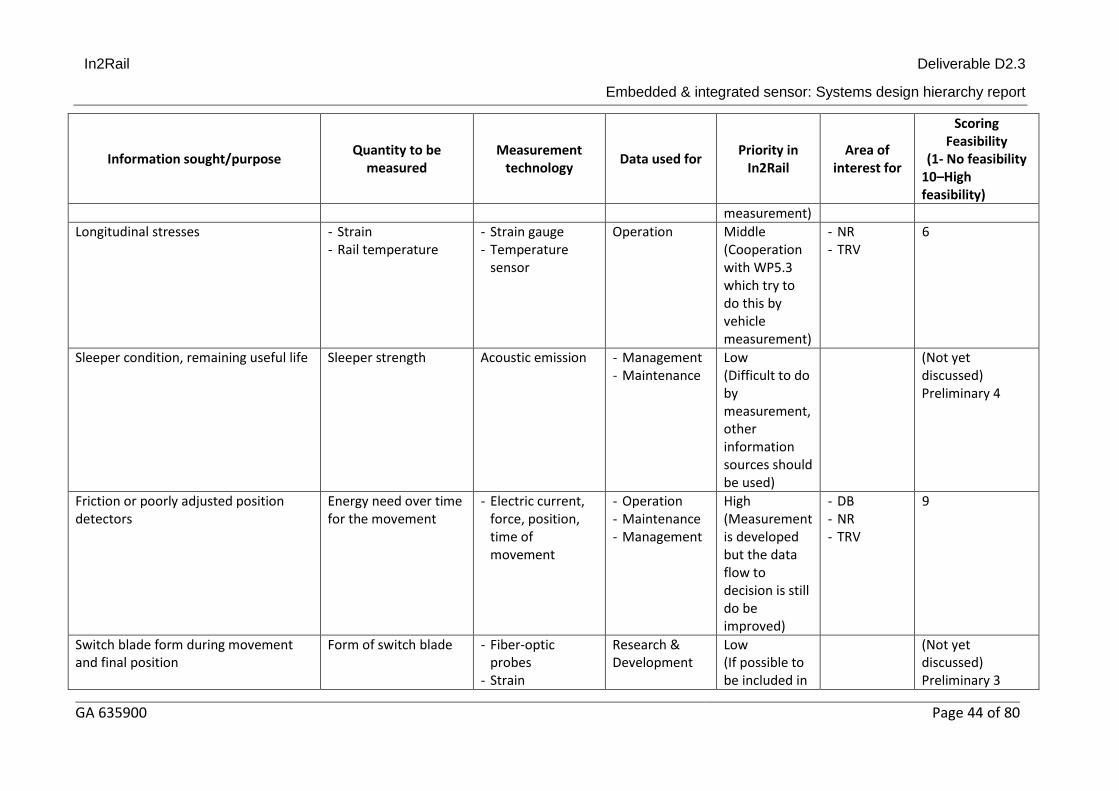
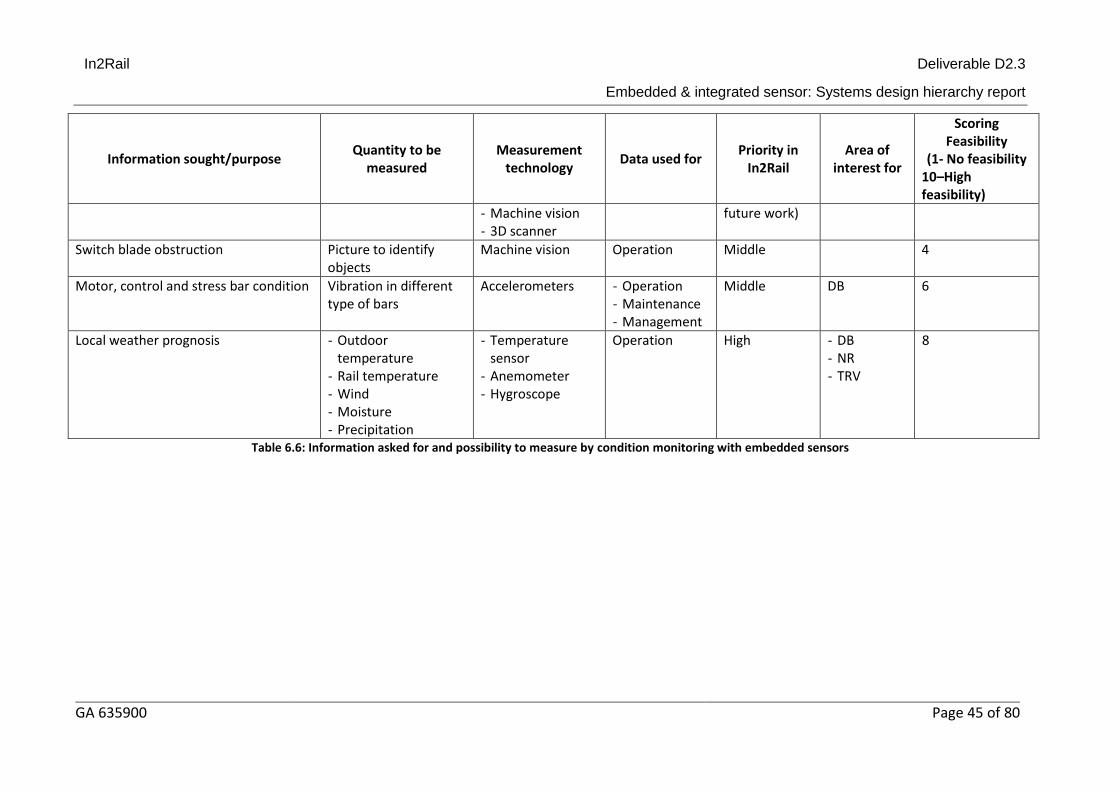
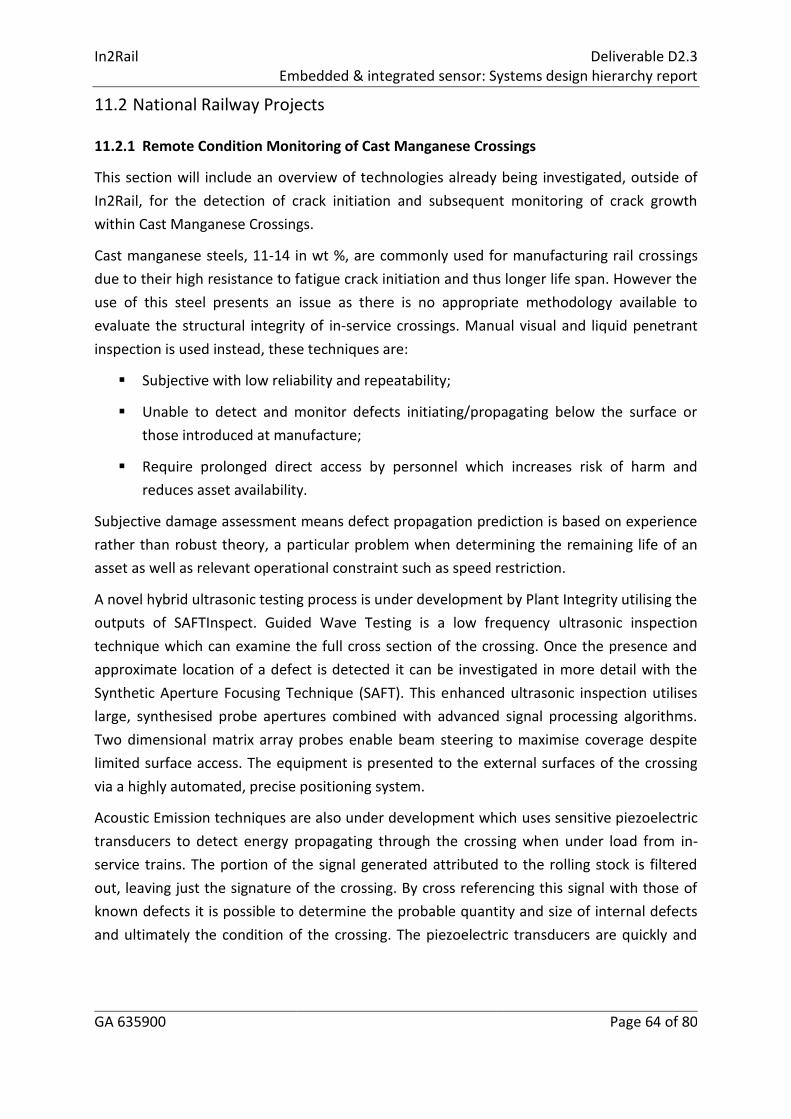
6.5 Summary of Proposed Monitored Parameters
The report describes how it is possible to measure the information that is asked for in
Chapter 5 and how that is linked to the need in Chapter 3. In the table is also a general
prioritizing what the group believe is important for Task 2.2 to work further on during the
In2Rail project.
In2Rail Deliverable D2.3
Embedded & Integrated Sensors: Systems Design Hierarchy Report
GA 635900 Page 36 of 72
Information sought/purpose Quantity to be
measured Measurement
technology Data used for
Priority in In2Rail
Area of interest for
Scoring Feasibility
(1- No feasibility 10–High feasibility)
Structural displacement and impact force in crossing panel. The impact force doesn’t follow directly from the acceleration, but can be estimated.
- Vertical displacement and acceleration
- Noise
- Accelerometer - Displacement
sensors - Microphone
- Management - Maintenance - Research &
Development
High - DB - NR - SYSTRA - TRV - University
of Southampton
9
- Crossing deformation - Switch rail deformation - Contact zone This information can be used to estimate contact loads and the fatigue life of the crossing and switch rail. It might also be possible to estimate where a particular wheel makes the transition.
- Switch panel geometry - Crossing running surface geometry Repeatedly profile measurement will give a better understanding of the wear and deformations.
- Rail profile - Kink of crossing
- 3D-laser-scanner - Maintenance - Research &
Development
Low (More effectively done by vehicle measurement)
Embedded & integrated sensor: Systems design hierarchy report
GA 635900 Page 43 of 80
Information sought/purpose Quantity to be
measured Measurement
technology Data used for
Priority in In2Rail
Area of interest for
Scoring Feasibility
(1- No feasibility 10–High feasibility)
done by vehicle measurement)
How the load is distributed and transferred from rails to sleepers.
Forces in rail-sleeper connections
Piezo-electrical load cells
Research & Development
Middle Chalmers 5
Structural deformation. With information on sleeper deformations and accelerations it should be possible to obtain information about how the impact load of the crossing propagates down through the track structure.
- Sleeper displacements and accelerations along their length
- Ballast displacement
- Accelerometer - Displacement
sensors
Research & Development
High - DB - Chalmers - NR - TRV - University
of Southampton
9
Information on the sleeper-ballast contact pressure is the most important parameter when it comes to determining ballast crushing and track settlement.
Sleeper-ballast contact pressure
Pressure sensors Research & Development
Low (Difficult to measure)
3
- Local crossing damage (e.g. RCF, squats, cracks etc.);
- Type and location of damage for the validation of damage models.
Cracks Ultrasonic probe (using long wave), eddy current and acoustic emission
- Maintenance - Research &
Development
Middle - NR - TRV -
4
Long term development of track irregularities/settlements
- Track geometry (vehicle based)
- 3D laser scanner on site
Track geometry car/In service vehicle with accelerometers
Maintenance Research & Development
Low (More effectively done by vehicle
- SYSTRA - TRV
4
In2Rail Deliverable D2.3
Embedded & integrated sensor: Systems design hierarchy report
GA 635900 Page 44 of 80
Information sought/purpose Quantity to be
measured Measurement
technology Data used for
Priority in In2Rail
Area of interest for
Scoring Feasibility
(1- No feasibility 10–High feasibility)
measurement)
Longitudinal stresses - Strain - Rail temperature
- Strain gauge - Temperature
sensor
Operation Middle (Cooperation with WP5.3 which try to do this by vehicle measurement)
[1] Bianconi, F., Ceccarelli, L., Fernández, A., & Saetta, A. (2014). A sequential machine vision procedure for assessing paper impurities. Computers in Industry, 65(2), 325-332.
[2] Blitz, J., & Simpson, G. (1991). Ultrasonic Methods of Non-Destructive Testing. New York: Springer - Verlag.
[3] Bogue, R. (2013). Sensors for condition monitoring: a review of technologies and applications. Sensor Review, 33(4), 295-299.
[4] Bowness, D., Lock, A., Powrie, W., Priest, J., & Richards, D. (2007). Monitoring the dynamic displacements of railway track. Proceedings of the Institution of Mechanical Engineers, Part F: Journal of Rail and Rapid Transit, 221, 13-22.
[5] Bragin, F., Ekberg, A., Pålsson, B., Sala, D., Nicklisch, D., Kabo, E., . . . Vernersson, T. (2013). D3.2 – Analysis and mitigation of derailment, assessment and commercial impact. D-RAIL Consortium.
[6] Casselgren, J., Rosendahl, S., Sjödahl, M., & Jonsson, P. (2016). Road condition analysis using NIR illumination and compensating for surrounding light. Optics and Lasers in Engineering, 77, 175-182.
[7] Cross industry track stiffness group. (2016). Cross industry track stiffness guide – A Guide to Track Stiffness.
[8] Cui, Y., Lamas-Lopez, F., Trinh, V., Calon, N., D'Aguiar, S., Dupla , J., & Robinet, A. (2014). Investigation of interlayer soil behaviour by field monitoring. Transportation Geotechnics, 1(3), 91-105.
[9] Dahlberg, T. (2004). Railway track settlements - a literature review. Report for the EU project Supertrack.
[10] Dwyer-Joyce, R., Yao, C., Zhang, J., Lewis, R., & Drinkwater , B. (2009). Feasibility Study for Real Time Measurement of Wheel-Rail Contact Using an Ultrasonic Array. Journal of Tribology, 131(4), 1-22.
[11] Ekberg, A., & Paulsson, B. (2010). INNOTRACK: Concluding technical report. Paris, France : International Union of Railways (UIC).
[12] Ekberg, A., Pålsson, B., Nicklisch, D., Kabo, E., Braghin, F., Allen, P., . . . Vernersson, T. (2013). D3.3 – Guidelines on derailment analysis and prevention. D-RAIL Consortium.
[13] Fleming , W. (2001). Overview of Automotive Sensors. IEEE Sensors Journal, 1(4), 296-308.
[14] Fleming, W. (2008). New Automotive Sensors – A Review. IEEE Sensors Journal, 8(11), 1900-1921.
[15] Gräbe, P., & Shaw, F. (2010). Design Life Prediction of a Heavy Haul Track Foundation. Proceedings of the Institution of Mechanical Engineers, Part F: Journal of Rail and Rapid Transit, 224, 337-344.
[16] Igathinathane, C., & Ulusoy, U. (2016). Machine vision methods based particle size distribution of ball- and gyro-milled lignite and hard coal. Powder Technology, 297, 71-80.
[17] Kim, H., Saade, L., Weston, P. & Roberts, C. (2014). Measuring the deflection of a sequence of sleepers at a transition zone. IET Conference Proceedings [Online].
[18] Kouroussis, G., Caucheteur, C., Kinet, D., Alexandrou, G., Verlinden, O., & Moeyaert, V. (2015). Review of trackside monitoring solutions: From strain gages to optical fibre sensors. Sensors, 15(8), 20115-20139.
[19] Lamas-Lopez, F., Alves-Fernandes, V., Cui, Y., Costa D’aguiar, S., Calon, N., Canou, J., . . . Robinet, A. (2014). Assessment of the double integration method using accelerometers data for conventional railway platforms. The Second International Conference on Railway Technology: Research, Development and Maintenance. 8–11 April 2014. Ajaccio, France.
[20] Le Pen, L., Milne, D., Thompson, D., & Powrie, W. (2016). Evaluating railway track support stiffness from trackside measurements in the absence of wheel load data. Canadian Geotechnical Journal. 53, 1156-1166.
[21] Le Pen, L., Watson, G., Powrie, W., Yeo, G., Weston, P., & Roberts, C. (2014). The behaviour of railway level crossings: Insights through field monitoring. Transportation Geotechnics, 1(4), 201-213.
[22] Lin, S., Kimoto, K., & Suda, Y. (2015). Study on Application of Big Data Analytics of Running Records in Railway Systems. Proceedings of the 24th International Symposium of Dynamics of Vehicles on Roads and Tracks. 17–21 August 2015, Graz, Austia.
[23] Luk, F., Huynh, V., & North, V. (1989). Measurement of surface roughness by a machine vision system. J. Phys. E: Sci. Instrum, 22, 977-980.
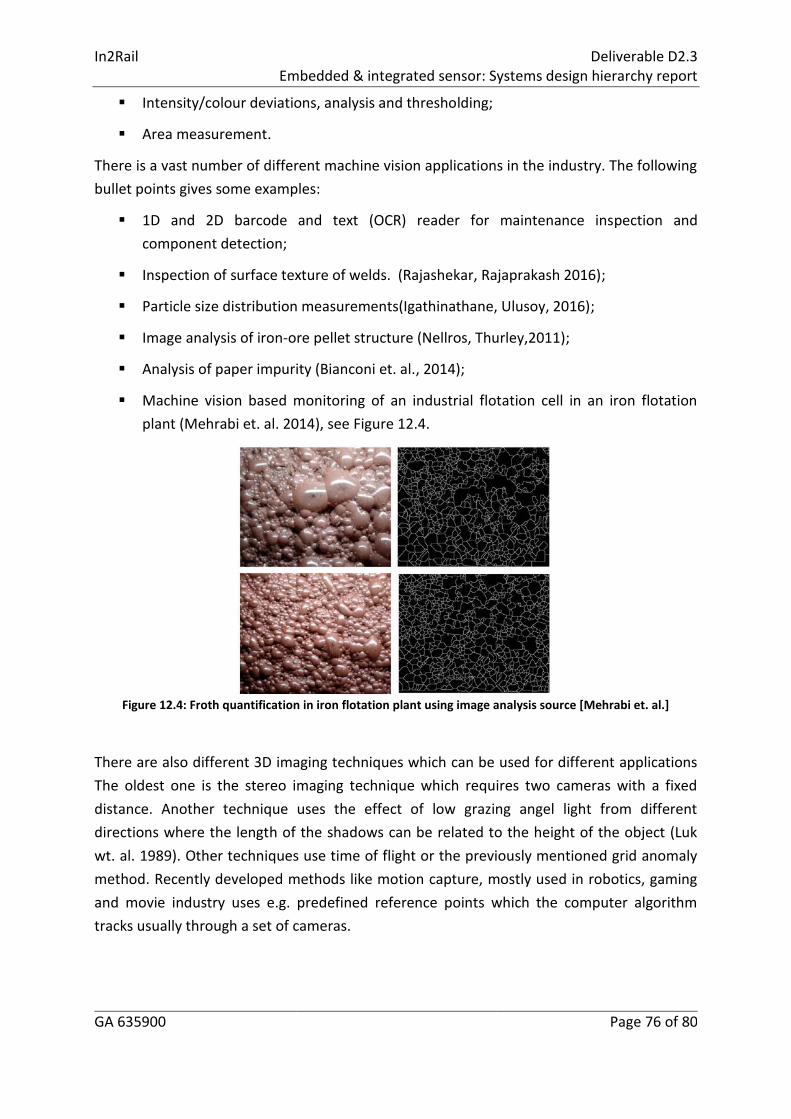
[24] Mehrabi, A., Mehrshad, N., & Massinaei, M. (2014). Machine vision based monitoring of an industrial flotation cell in an iron flotation plant. International Journal of Mineral Processing, 133, 60-66.
[25] Milne, D., Le Pen, L., Watson, G., Thompson, D., Powrie, W., Hayward, M. & Morley, S. 2016. Proving MEMS Technologies for Smarter Railway Infrastructure. Procedia Engineering, 143, 1077-1084.
[26] Mishra, D., Qian, Y., Huang, H., & Tutumluer, E. (2014). An integrated approach to dynamic analysis of railroad track transitions behavior. Transportation Geotechnics, 1, 188-200.
[27] Molin, N., Sjödahl, M., Gren, P., & Svanbro, A. (2004). Speckle photography combined with speckle interferometry. Optics and Lasers in Engineering, 41(4), 673-686.
[28] Murray, C., Take, W., & Hoult, N. (2014). Measurement of vertical and longitudinal rail displacements using digital image correlation. Canadian Geotechnical Journal, 52, 141-155.
[29] Nellros, F., & Thurley, M. (2011). Automated image analysis of iron-ore pellet structure using optical microscopy. Minerals Engineering, 24(14), 1525-1531.
[30] Paixão, A., Alves Ribeiro, C., Pinto, N., Fortunato, E. & Calçada, R. (2014). On the use of under sleeper pads in transition zones at railway underpasses: experimental field testing. Structure and Infrastructure Engineering, 11, 112-128.
[31] Priest, J. A., Powrie, W., Yang, L., Gräbe, P. J., & Clayton, C. R. (2010). Measurements of transient ground movements below a ballasted railway line. Géotechnique, 60, 667-677.
[32] Priest, J., Powrie, W., Le Pen, L., Mak, P., & Burstow, M. (2013). The effect of enhanced curving forces on the behaviour of canted ballasted track. Proceedings of the Institution of Mechanical Engineers, Part F: Journal of Rail and Rapid Transit, 227(3), 229-244.
[33] Prosser, S. (2007). Automotive sensors: past, present and future. Journal of Physics: Conference Series, 76(11), 6 p.
[34] Pålsson, B., & Nielsen, J. (2011). Track model validation for simulation of train–turnout dynamics. Proceedings International Heavy Haul Conference. 19–22 June 2011, Calgary, Canada.
[35] Rajashekar, R., & Rajaprakash, B. (2016). Development of a model for friction stir weld quality assessment using machine vision and acoustic emission techniques. Journal of Materials Processing Technology, 229, 265-274.
[36] Randall, R., & Antoni, J. (2011). Rolling element bearing diagnostics–A tutorial. Mechanical Systems and Signal Processing(25), 485-520.
[37] SKF, An Introduction to Motor Current Signature Analysis, https://www.scribd.com/document/176500398/Motor-Current-Signal-Analysis


![Amigo Deliverable D4 - CORDIS€¦ · the Amigo Intelligent User Services (Amigo Deliverables D2.1 [3] and D2.3 [4]. Amigo deliverable D2.3 is an introduction to this document. The](https://static.documents.pub/doc/80x56/5f023ae57e708231d40338de/amigo-deliverable-d4-cordis-the-amigo-intelligent-user-services-amigo-deliverables.jpg)


