BESTUFS II DELIVERABLE D2.3 PART I Best Practice Update 2007 Part I Updated Handbook from Year 2002 Road pricing and urban freight transport Urban freight platforms Public PROJECT CO-ORDINATOR: PTV Planung Transport Verkehr AG (DE) PROJECT PARTNERS : CDV – Centrum dopravniho vyskumu (CZ) LET Laboratoire d’ Economie des Transports (FR) NEA Transport Research and Training (NL) Newrail (UK) Rapp Trans AG (CH) TRANSMAN Consulting for Transport System Management Ltd (HU) University of Westminster, Transport Studies Group (UK) MAIN AUTHORS: Raphael Karrer, Martin Ruesch Rapp Trans AG PROJECT START DATE: September 2004 DURATION: 48 months DATE OF ISSUE OF THIS REPORT : 10/2007 SIXTH FRAMEWORK PROGRAMME FOR RESEARCH AND TECHNOLOGICAL DEVELOPMENT: Integrating and Strengthening the European Research Area (2002-2006), Sustainable Surface Transport CONTRACT N°: TREN/04/FP6TR/S07.31723/506384 ACRONYM: BESTUFS II TITLE: Best Urban Freight Solutions II
Transcript
BESTUFS II
DELIVERABLE D2.3 PART I
Best Practice Update 2007 Part I Updated Handbook from Year 2002
Road pricing and urban freight transport
Urban freight platforms
Public
PROJECT CO-ORDINATOR: PTV Planung Transport Verkehr AG (DE)
PROJECT PARTNERS : CDV – Centrum dopravniho vyskumu (CZ)
LET Laboratoire d’ Economie des Transports (FR)
NEA Transport Research and Training (NL)
Newrail (UK)
Rapp Trans AG (CH)
TRANSMAN Consulting for Transport System Management Ltd (HU)
University of Westminster, Transport Studies Group (UK) MAIN AUTHORS: Raphael Karrer, Martin Ruesch Rapp Trans AG
PROJECT START DATE: September 2004
DURATION: 48 months
DATE OF ISSUE OF THIS REPORT : 10/2007
SIXTH FRAMEWORK PROGRAMME FOR RESEARCH AND TECHNOLOGICAL DEVELOPMENT: Integrating and Strengthening the European Research Area (2002-2006), Sustainable Surface Transport
CONTRACT N°: TREN/04/FP6TR/S07.31723/506384 ACRONYM: BESTUFS II TITLE: Best Urban Freight Solutions II
BESTUFS II – D 2.3 Best Practice Update 2007 / Part I I Table of contents
TABLE OF CONTENTS
TABLES V
1 Introduction 6 1.1 The BESTUFS Thematic Network and need for action 6 1.2 Relation to previous and running activities concerning urban freight 11
1.2.1 Global level 11 1.2.2 European level 12 1.2.3 National level 14
1.3 Themes to be treated within BESTUFS and BESTUFS II 14 1.4 Aims, use and contents of Best Practice Updates 16
2 Best Practices 20
3 Road pricing and urban freight transport 23 3.1 Introduction 23
3.1.1 Definition of road pricing 24 3.1.2 The economic idea of efficient pricing 25 3.1.3 Different categories of road pricing 27
3.2 Related research activities 29 3.3 Situation at country level 33
3.3.1 Importance of road pricing 33 3.3.2 National road pricing situations 34 3.3.3 Legal framework conditions 39 3.3.4 Attitude of goods transport professionals 40
3.4 Regarded case studies (project-level) 42 Example 3.4.1: Oslo (Norway) (incl. Bergen, Trondheim) 46 Example 3.4.2: London city ‘congestion charging’ (UK) 51 Example 3.4.3: Rome (Italy) 56 Example 3.4.4: Heavy Vehicle Fee / LSVA (Switzerland) 62 Example 3.4.5: Kilometerheffing (The Netherlands) 69 Example 3.4.6: Péripherique Nord de Lyon (France) 72
3.5 From theory to practice 79 3.6 Specific considerations for urban freight transport 81 3.7 Conclusions and recommendations 90
4.1.1 Background and need for action 96 4.1.2 Definitions and classification 97 4.1.3 Aims and benefits 103 4.1.4 Problems and controversies 106
BESTUFS II – D 2.3 Best Practice Update 2007 / Part I II Table of contents
4.2 Related research activities 107 4.3 Situation at country level 110
4.3.1 Importance of urban freight platforms 111 4.3.2 National situation regarding urban freight platforms 113 4.3.3 Legal framework conditions 118
4.4 Regarded case studies (project-level) 119 Example 4.4.1: City Logistik Kassel (Germany) 122 Example 4.4.2: Tenjin Joint Distribution System, Fukuoka (Japan) 124 Example 4.4.3: Stadsdistributiecentrum Leiden BV (NL) 127 Example 4.4.4: Hammarby Sjöstad, Stockholm (Sweden) 134 Example 4.4.5: Cyclone Couriers, York (UK) 137 Example 4.4.6: Cargo Center Graz CCG (Austria) 139 Example 4.4.7: LGZ Hochrhein, Rekingen (Zurich, Switzerland) 144 Example 4.4.8: Heathrow Airport Consolidation Centre (London, UK) 148
4.5 Synthesis from the case studies 154 4.6 Conclusions and recommendations 161
4.6.1 Conclusions 161 4.6.2 Recommendations 163
REFERENCES AND CONTACT PERSONS 167
ROAD PRICING GLOSSARY 182
ABBREVIATIONS 184
ANNEX
BESTUFS II – D 2.3 Best Practice Update 2007 / Part I III Table of contents
FIGURES
Figure 1: City Logistics Problems 6
Figure 2: Co-ordination and organisation of the network 9
Figure 3: Sources of Best Practices and thematic structuring 21
Figure 4: The assessment triangle [PRIMA 2000] 27
Figure 5: Today’s and future importance of road pricing in general (number of countries) 34
Figure 6: Today’s and future importance of road pricing for urban freight transport (number of countries) 34
Figure 7: Urban road pricing development in Europe 36
Figure 8: Legal situation on urban road pricing in Europe 40
Figure 9: Collected projects according to their extension 42
Figure 10: Collected (urban) projects according to their status 43
Figure 11: Collected (urban) projects according to their objective(s) 43
Figure 12: 19 toll stations circle the Oslo city centre [Waersted 1998] 47
Figure 13: Oslo toll ring station (south-west-entrance) [Waersted 1998] 48
Figure 14: Automatic toll station Trondheim (http://www.progress-project.org/ 50
Figure 15: The central London Congestion Charging Scheme Area [TfL 2007] 53
Figure 16: Limited Traffic Zone with 24 entry gates [Tomassini 2001] 57
Figure 17: Smart cards and On-Board-Unit (OBU) [Tomassini 2001] 58
Figure 18: OCR equipment at the entrance gate [Tomassini 2001] 59
Figure 19: Example of dissemination material [Tomassini 2001] 60
Figure 20: “TRIPON” On-Board Unit [Oehry 2001] 64
Figure 21: Border crossings recorded with DSRC [Oehry 2001] 64
BESTUFS II – D 2.3 Best Practice Update 2007 / Part I V Table of contents
TABLES
Table 1: Best Practice Update themes 18
Table 2: Classification of freight platforms [based on REFORM 1999 and Visser et al. 1999] 101
Table 3: Average number of shipments per week of the CDC 130
BESTUFS II – D 2.3 Best Practice Update 2007 / Part I 6 Introduction
1 Introduction
1.1 The BESTUFS Thematic Network and need for action
Background More than 80% of today’s road freight trips in European conurbations are of distances below 80 km and can be defined as urban or urban-regional transport. The delivery and collection of goods within urban and metropolitan areas, especially in the core areas of cities with old and established centres has a major impact on the local community concerning the economic power, quality of life, accessibility and attractiveness of a city. Besides the benefits of goods transport in urban areas in terms of the supply of products to consumers and the economic importance of supporting other industries there are also negative impacts appear such as air pollution or congested roads. Taking the negative and positive impacts into consideration in developing an efficient and environmentally-friendly urban transport system is essential for the economic health and the quality of life of cities.
wastagewastageDamage andDamage andintrusion intointrusion into
the urban corethe urban coreof citiesof cities
Mono-modalMono-modaldominance bydominance byroad transportroad transport
using fossilusing fossilfuels as thefuels as the
primaryprimaryenergy sourceenergy source
Figure 1: City Logistics Problems
Need for Action For future economically and environmentally sustainable supply it is therefore important to assess the opportunities and chances of technical (vehicle technology, telematics applications, etc.), organisational (co-operation, etc.), operational (route planning, etc.) and political (time windows, weight limits, etc.) measures for improving the urban transport systems.
The thematic network BESTUFS contributes within the 6th Framework Programme to the Key Action „Sustainable Surface Transport“.
The sustainable surface transport work programme addresses the following objectives:
BESTUFS II – D 2.3 Best Practice Update 2007 / Part I 7 Introduction
New technologies and concepts for all surface transport modes (road, rail and waterborne).
Advanced design and production techniques.
Rebalancing and integrating different transport modes.
Increasing road, rail and waterborne safety and avoiding traffic congestion.
BESTUFS II is a project that is relevant to all of these objectives, even though it is submitted to the City Logistics call under the fourth objective, “Increasing road, rail and waterborne safety and avoiding traffic congestion”.
BESTUFS II-project introduction
BESTUFS II is a follow-up initiative of the thematic network BESTUFS and aims to maintain and expand an open European network between urban freight transport experts, user groups/associations, ongoing projects, the relevant European Commission Directorates and representatives of national, regional and local transport administrations and transport operators in order to identify, describe and disseminate best practices, success criteria and bottlenecks with respect to City Logistics. Overall, BESTUFS II will further identify the problems and the requirements of the cities as well as of all private actors involved in urban freight and will maintain the environment for establishing policy as well as research recommendations. The most relevant and helpful findings promoted in BESTUFS II in form of guides for actors in medium sized cities together with national seminars organised in 22 countries will undoubtedly be suitable for many actors and many cities within Europe.
Furthermore, BESTUFS II will describe the urban context and the role urban freight transport plays in a city. A group of experts will quantify freight transport related processes and measures compared to other transport modes as well as compared to different sustainability objectives. Finally, common data models and applied practical modelling tools are addressed in more detail by European experts that will consider this topic at roundtables and prepare suggestions for a European harmonisation and roadmap.
Building on the structure and experience gained from the BESTUFS project the follow-up initiative of BESTUFS II will be augmented in three major ways: (1) a broad geographic coverage including the provision and dissemination in various languages of guides about urban freight transport best practice; (2) a quantification of the contribution of urban freight solutions to EU policy objectives; and (3) an examination of urban freight transport models and data structures.
Coordination Action The general idea behind a “Coordination Action”, to encourage the co-operation between domain experts, research institutions and other interested groups at a European level is not new in the transport domain. The COST activities as well as the ‘concertation’ mechanism installed by the Transport Telematics Application Programme (T-TAP) in the 4th Framework
BESTUFS II – D 2.3 Best Practice Update 2007 / Part I 8 Introduction
Programme are previous examples. The latter focused on clustering themes and topics: Within the Program, funded projects were clustered and asked to participate in so-called ‘concertation’ meetings to discuss common ground and to derive further needed actions. The COST activities did not have a clustering component as such, but the participants did devise a sharp focus on single themes, which in many respects can be regarded as the predecessors to the thematic network activities of the 5th FP.
BESTUFS II Thematic Network
The EC established a thematic network (TN) on BEST Urban Freight Solutions (BESTUFS) in January 2000 with duration of 4 years. This thematic network (TN) corresponds directly to the task 2.3.2/4 of the Key Action: Sustainable Mobility and Intermodality. The open European network has been established between urban freight transport experts, user groups/associations, ongoing projects, interested cities, the relevant European Commission Directorates and representatives of national, regional and local transport administrations.
The partners of BESTUFS II aim to broaden the existing BESTUFS network to include medium sized urban areas in Europe including those in the New Member States.
The work of BESTUFS II-network takes place within the policy and regulatory framework of the Community, including the common transport policy, the development of the Trans European Transport Networks and the green paper on urban transport. It is the role of this thematic network to act as a facilitator in order to ensure that excellent strategies and best practices are not lost to the remainder of the European Community, the freight community and cities themselves. This approach allows structuring all relevant material available concerning the prioritised themes of the BESTUFS II-network and supports the analysis of the projects.
The concept of a thematic network is thereby focusing on the co-operation between experts and projects with already existing or just emerging experiences and expertises and on the collection and raw analysis of results of national and European projects - rather than starting new research activities. Within the network the following organisations and interest groups are involved: more than 20 European cities and regional administrations, interest groups like POLIS, ACEA, FTA or EVO, national networks (Association of Italian cities for sustainable mobility and transport issues, Forum for City Logistics Denmark) as well as European and International bodies (e.g. IMPACTS, Institute for City Logistics).
BESTUFS II – D 2.3 Best Practice Update 2007 / Part I 9 Introduction
The following overview shows the co-ordination and organisation of the network:
ContractorsContractors
MembersMembers
Interest GroupsInterest Groups
ExpertsExpertsB
est
Pra
ctic
e
WorkshopsMeetings
Administration and Workshop Organisation
Network Steering
Committee
Network Co-ordination
Dis
sem
inati
on
• Member States• Policy makers• Local authorities• Transport operators• System suppliers• Interest groups• Associations• Projects• Vehicle industry• Cities
Figure 2: Co-ordination and organisation of the network
Main objectives of BESTUFS
Main objectives of BESTUFS II are:
to strengthen and extend the existing BESTUFS European network for urban freight transport experts, user groups/associations, ongoing projects, interested cities, European Commission Directorates, system/technology providers and truck manufacturers; the network is focused on the movement of goods and commercial transport in urban areas,
to continue the long-term and dynamic ‘concertation’ activity during the period of the 6th FP,
to support the integration of so called “last mile” distribution processes in cities into a door-to-door supply chain approach,
to provide a platform for the exchange of ideas and information on urban freight transport modelling and to consider harmonisation and standardisation of corresponding associated data by experts,
to strengthen intermodal transport as interface to CLS and to provide support for promising intermodal approaches,
to support the increased introduction and use of alternative fuels and cleaner vehicles in the domain of CLS,
to identify needs for standardisation in CLS and to support the realisation of European wide standards (e.g. on vehicle weight and size restrictions or for regulations concerning night deliveries),
to identify and present project results and best practice of CLS through a similar thematic structure to that used in BESTUFS,
BESTUFS II – D 2.3 Best Practice Update 2007 / Part I 10 Introduction
to widen and strengthen the relationships with both European and international networks regarding urban commercial transport,
to strengthen both the European Community’s position in this area and the European industries providing CLS,
to widely disseminate CLS best practice in a series of guides that will be available in whole range of national languages,
to broaden the geographic coverage and increase the awareness of urban freight transport best practice across Europe, with special emphasis on medium sized urban areas,
to support the DG TREN policy objectives (emission reduction, energy aspects, mode shift, congestion reduction, safety, etc.) with respect to CLS and to increase the contribution of CLS to achieving transport policy objectives,
to quantify the contribution of the potential that CLS can make to DG TREN policy objectives and to quantify the role of urban commercial transport compared with other urban transport activities in terms of sustainability,
to support the clustering of projects at a European level and to integrate projects and clusters into the network,
to collect, compare and summarise available experiences and results of projects and initiatives in the CLS domain from Europe and to a lesser extent internationally,
to identify and describe best practices and success criteria within the CLS domain,
to disseminate experiences, projects, best practices and success criteria to a broad interested audience with the aim of initiating a transfer of urban freight transport solutions,
to establish links and cooperation with other transport and urban interest oriented networks or groups in order to share and integrate results and to avoid duplication of work,
to strengthen links and cooperation with national CLS CA or networks in order to share and integrate results,
to support the co-operation between actors, which are active or which are interested in the urban freight transport domain, by providing information and contacts.
BESTUFS II – D 2.3 Best Practice Update 2007 / Part I 11 Introduction
More information about the BESTUFS project
Web: www.bestufs.net Post address: BESTUFS Administration centre P.O. Box 1969 2280 DZ Rijswijk The Netherlands E-mail: [email protected] Telephone No.: +31 70 3988 393 Fax No.: +31 70 3988 426
1.2 Relation to previous and running activities concerning urban freight
1.2.1 Global level
OECD Working Group on Urban Freight Logistics
The OECD (Organisation for Economic Co-operation and Development) set up a working group dealing with urban freight logistics. This working group follows the aimed targets of OECD, based on the Article 1 of the Convention signed in Paris on 14th December 1960, which came in force 30th September 1961 and promotes policies designed to achieve the highest sustainable economic growth and employment and a rising standard of living in Member countries. The Working Group on Urban Freight Logistics was set up to learn from international experiences and solutions, which have been proposed and implemented in OECD member countries with both successes and failures. In their actually report “Delivery the Goods – 21st Century Challenges to Urban Goods Transport” the OECD Working Group focuses on the delivery of consumer goods and highlights best practices in Member countries [OECD 2003].
Institute for City Logistics
The Institute for City Logistics (ICL) was established at Kyoto, Japan in 1999. The most important objective of this Institute is to be the centre of excellence for the research and development on City Logistics and urban freight transport. ICL carries out the fundamental investigations and makes it applicable to the real society. ICL also provides the platform for the exchange of knowledge, experience and information about City Logistics and urban freight transport. ICL performs activities related to City Logistics and urban freight transport, including [Taniguchi et al 2003]:
Organise international conferences
Perform investigations
Develop software
BESTUFS II – D 2.3 Best Practice Update 2007 / Part I 12 Introduction
Provide short courses
Issue newsletters
Publish books and journals
1.2.2 European level
THERMIE Within the European Community programs THERMIE (1990-1994) and JOULE-THERMIE (1995-1998) the rational use of energy in transport has been looked at. Concerning urban goods transport various measures and technologies have been investigated and assessed. For more information see www.cordis.lu under THERMIE and transport.
COST Actions On European level the following COST Actions concerning freight transport and logistics are relevant:
COST 310/316: Freight Transport Logistics (1989-1992)
COST 321: Urban Goods Transport (1994 –1998)
COST 339: Small Containers (1998 – 2001)
COST 355: Changing behaviour towards a more sustainable transport system (2004 on)
COST 321 especially (http://www.cordis.lu/cost-transport/src/cost-321.htm) provided important base material, information and results as an input for the further activities in the BESTUFS TN [COST 321; 1998]. On one hand COST 321 reviewed current and potential measures promoted by public authorities and private parties, in the logistical, technical, behavioural, infrastructural and administrative field. An extensive survey was conducted, leading to a policy-relevant classification of observed and planned measures which were qualitatively assessed relating to their potential contribution to the improvement of the quality of urban goods transport. On the other hand COST 321 provided quantitative results on the impact of measures using simulation and modelling tools and also estimated effects in projects and case studies. Also some key figures relating to urban goods transport have been identified and provided for several cities.
The BESTUFS TN can be seen as a follow up and continuation of the COST 321 project.
Projects of the 4th framework programme
Within the 4th framework programme several projects are related to urban goods movements dealing with organisational, operational, technical and economical aspects.
Important projects are: DIRECT, ELCIDIS, EUROTOLL, EUROSCOPE,
BESTUFS II – D 2.3 Best Practice Update 2007 / Part I 13 Introduction
IDIOMA, IMAURO, LEAN, MOMENTUM, MOSAIC, MOST, PROPOLIS, PROSPECTS, REFORM and SURFF. These projects have been identified within the BESTUFS project during a clustering process considering urban goods transport themes as freight centres, traffic access restrictions etc. For more information see www.cordis.lu.
Projects of the 5th framework programme
Besides BESTUFS there are also other projects linked to urban goods transport within the 5th framework programme (1998-2002) such as EUTPII, PROGRESS, SULOGTRA, REVEAL, OSSA, MOST or CUPID (all within the sub-programme “competitive and sustainable growth”). For more information see www.cordis.lu.
CITY FREIGHT is a European research project (finished) on inter- and intra-urban freight distribution networks. It has carried out an analysis of selected freight transport systems already functioning in Europe and has evaluated their socio-economic and environmental impacts in an urban context, with a common assessment methodology. CITY FREIGHT has focussed on innovative and promising logistic schemes in the seven countries represented in the project consortium.
The objective was to provide guidance to interested stakeholders (government, regional or local authorities, network operators, shippers and consignees) on the advantages and drawbacks of some recent innovations in the field of inter- and intra-urban freight distribution systems.
Other demonstration projects concerning Clean Urban Transport started 2001 as a result of the CIVITAS Initiative (City-VITAlity-Sustainability; http://www.civitas-initiative.org ), which had been launched in autumn 2000 by the European Commission as a joint Initiative between Key action Economic and Efficient Energy of the “Energy” Programme and the Key Action Sustainable Mobility and Intermodality of the “Growth” Programme). 14 EU-cities (Aalborg, Barcelona, Berlin, Bremen, Bristol, Cork, Gothenburg, Graz, Lille, Nantes, Rome, Rotterdam, Stockholm and Winchester) and five associated cities from the accession countries (Bucharest, Gdynia, Kaunas, Pécs and Prague) are participating in pilot projects combating congestion and pollution through technologies and measures that range from the introduction of new information and transport management systems to the promotion of "clean" vehicle fleets for passengers and goods.
Projects of the 6th framework programme
BESTLOG:
The 6th framework programme does also address sustainable freight transport in their topics: A CA BESTLOG (Logistics Best Practices) has started with a focus on logistics in general, but which will also encompasses city freight solutions.
NICHES:
The mission of NICHES (New and Innovative Concepts for Helping European transport Sustainability) is to stimulate a wide debate on
BESTUFS II – D 2.3 Best Practice Update 2007 / Part I 14 Introduction
innovative urban transport and mobility between relevant stakeholders from different sectors and disciplines across Europe. NICHES will promote the most promising new concepts, initiatives and projects, moving them from their current ‘niche’ position to a ‘mainstream’ urban transport policy application. NICHES is a project supported by the European Commission, DG Research, under the 6th Framework Programme.
The NICHES projects deals also with questions of city logistics.
In WG 2 the following innovative concepts will be explored:
space management for urban delivery
inner-city night delivery
home delivery using locker boxes
1.2.3 National level
At a national level, the activities concerning urban goods transport vary largely between the European countries.
Since the beginning of 1990, especially France (COST 321, Programme national marchandise en ville) but also Spain (COST 321, initiatives of single cities), Switzerland (COST 321, DIANE 6, City of Zurich), Belgium (COST 321, urban freight transport plans), Italy (COST 321, urban freight transport plans), Denmark (COST 321, cities of Copenhagen, Aarborg, Arhus), Germany (COST 321) and the Netherlands (COST 321) have been active in urban goods transport issues. However, the concerns and also the activities differ very much between the cities within a country.
1.3 Themes to be treated within BESTUFS and BESTUFS II
Identified themes within the BESTUFS workshops
As a result of the first BESTUFS workshop on 16th/17th May 2000 in Brussels and from experiences and suggestions at further workshops the following catalogue of themes has been determined to be considered with priority within the BESTUFS project (the themes in italics have - at least partly - been treated so far):
Methodology Models and methods to deal with the complexity of urban freight transport chains and the shared responsibilities
Goods transport efficiency, assessment and costs
Statistical data, data acquisition and data analysis
Planning and policy Land use planning and business models for urban freight platforms
Traffic, land use, infrastructure and regulations planning and policy
Integration of distribution centres and traffic management
Transport concepts and management
Door to door freight transport aspects
Improved management of the urban road space and the kerbside
BESTUFS II – D 2.3 Best Practice Update 2007 / Part I 15 Introduction
access
Interfaces between public and goods transport
City access, parking regulations and access time regulations
Road pricing, tolls and heavy vehicle fees
E-commerce and distribution (home shopping)
Night delivery
Waste Transport and logistics in urban areas
Co-operation and organisation
Co-operation of transport operators
Public-private-partnerships (PPP) and stimulation e.g. via freight forums
Win-win situations
Transportation technology
Transport units and intermodal transfer facilities
Innovative urban freight transport ideas (e.g. via underground systems, pipelines, etc.) and unusual transport modes (bicycles, etc.)
Urban rail freight
Vehicle technology and functionalities (e.g. low-emission vehicles), weights and dimensions
Supporting technology and infrastructure
Intelligent transport systems (ITS), transport telematics applications and systems for urban goods transport
Enhanced signage and information systems (e.g. VMS)
Infrastructural solutions (e.g. to improve loading and unloading)
Enhanced usage and maintenance of infrastructure (e.g. via a road map for transport vehicles)
Enforcement support (e.g. by video control)
Legal issues Relationship and harmonisation between the urban, regional, national and European legislation
Identified themes within the BESTUFS II workshops
First three themes to be treated in the Best Practice Handbooks of BESTUFS II:
Waste transport logistics in urban areas (Theme 1, BPH 2005)
Experiments and incentives in favour of environmental friendly vehicles and equipment (Theme 2, BPH 2005)
Enforcement and control in urban freight transport (Theme 3, BPH 2006)
City Access – New schemes and approaches (Theme 4, BPH 2006)
Workshops from In the first 3 years of BESTUFS II from 2005 to 2007 the following themes
BESTUFS II – D 2.3 Best Practice Update 2007 / Part I 16 Introduction
2005 to 2007 have been addressed, each in a workshop:
Approaches to Urban Consolidation: concepts and experiences, 1st workshop [13th and 14th January 2005 in London, UK]
Last Mile Solutions, 2nd workshop [21st and 22nd April 2005 in Nuremberg, Germany]
Urban freight transport in small and medium sized cities, 3rd workshop [29th and 30th September in Kaposvar, Hungary]
Waste transport and logistics in urban areas, 4th workshop [9th and 10th March 2006 in Zurich, Switzerland]
Managing urban freight transport by companies and local authorities, 5th workshop [21st and 22nd September 2006 in Vienna, Austria]
Port cities and innovative urban freight solutions, 6th workshop [22nd and 23rd March 2007 in Göteborg, Sweden]
Accommodating the needs of passenger and freight transport in cities, 7th workshop [27th and 28th September 2007 in Vilnius, Lithuania]
Conferences from 2005 to 2007
Solutions for Air Quality and Noise Problems in Urban Freight Transport, 1st BESTUFS II conference [23rd and 24th June 2005 in Amsterdam, Netherlands]
Open topic 2nd BESTUFS II conference [18th and 19th May 2006 in St. Julians, Malta]
Vital cities optimise city logistics 3rd BESTUFS II conference [24th and 25th May 2007 in Warsaw, Poland]
Forthcoming BESTUFS II events in 2008
Another workshop and one conference will be held until the end of the BESTUFS II project in August 2008.
Workshop on environmental zones and what it means to urban freight in Bilbao, 13th / 14th March 2008
4th and last BESTUFS II Conference in Athens, 12th / 13th June 2008
1.4 Aims, use and contents of Best Practice Updates
Aims of Best Practice Handbooks
In the field of urban goods transport, the Best Practice Handbooks aims at
giving information and hints about innovative ongoing strategies, concepts and activities in European countries,
providing knowledge and experiences of completed and running projects and actions
BESTUFS II – D 2.3 Best Practice Update 2007 / Part I 17 Introduction
providing contacts for further information.
In BESTUFS I and BESTUFS II (since the year 2000) 6 Best Practice Handbooks were published addressing 10 themes (see below). The themes were analysed in depth. The Best Practice Handbooks provide definitions and further information on the topics updated in this deliverable.
Best Practice Handbooks 2005 and 2006
Within BESTUFS II best practice is derived for 4 major themes addressed for the first time within the BESTUFS network. In 2005 the first out of tow Best Practice Handbooks (Deliverable 2.1) was published comprising the following themes:
Waste transport and logistics in urban areas (Theme 1)
Experiments and incentives in favour of environment friendly vehicles and equipment (Theme 2)
The Best Practice Handbook 2006 (Deliverable 2.2) is related to the themes
Control and Enforcement (Theme 3)
City access restriction schemes (Theme 4)
each topic consisting of
an overview on national situations and relevant projects
Case studies (Best Practices) and experiences
Conclusions and recommendations
The material for this handbook has been collected and completed by the BESTUFS II contractors and subcontractors including important inputs from the involved experts and the workshops.
Aims of the Best Practice Updates
The Best Practice Updates are the updated version of previously published Best Practice Handbooks. The aim of the Updates are:
providing the latest developments in relevant fields of urban freight
including new approaches and findings from BESTUFS events in the Best Practice context
maintaining the knowledge gained in the first publication of the theme
Use of the Best Practice Update
The main focus of this Best Practice Handbooks update is to provide a European overview over solutions and existing activities related to the considered themes. The results are described as experiences rather than as a thorough scientific analysis. The state of the art knowledge and experiences in the addressed fields are presented and conclusions and recommendations drawn.
BESTUFS II – D 2.3 Best Practice Update 2007 / Part I 18 Introduction
Contents of the Best Practice Updates
The Best Practice Handbooks in BESTUFS I and BESTUFS II treated a wide range of themes. The following table provides an overview over the addressed topics including the update procedure.
Themes BPH
published in year
update of the theme
Statistical data, data acquisition and data analysis in urban freight transport 2000
No update within the Best Practice Updates, as this theme in depth analysed within BESTUFS II: Urban freight data harmonisation and Quantification of effects (deliverables D3.1, D3.2, D5.1, D5.2)
City access and enforcement 2000 and2006
recently addressed and updated in the BPH 2006 (D2.2)
E-commerce and urban freight distribution 2001 2008 (D2.4)
Road pricing and urban freight transport 2002 2007 (D2.3 part I)
Intelligent transport systems 2002 2007 (D2.3 part I)
Urban freight platforms 2002 2007 (D2.3 part II)
Public Private Partnerships in urban freight transport 2003 2008 (D2.4)
Waste transport and logistics in urban areas 2005 2008 (D2.4)
Experiments and incentives for environment-friendly vehicles 2005 2008 (D2.4)
Table 1: Best Practice Update themes
For each theme the information provided is structured as follows: an overview on national situations and relevant projects; case studies (Best Practices) and experiences as well as conclusions and recommendations.
The base information for the first publication of the Best Practice Handbooks was gathered by means of material collections procured by about two dozens of national partners and subcontractors.
The information for the updates has been collected and completed by the BESTUFS II contractors including important inputs from the involved experts and the workshops. The Best Practice Handbooks contain the following new and updated information in addition to the old information:
a an updated country overview (where significant changes occurred)
newly established or changed projects
BESTUFS II – D 2.3 Best Practice Update 2007 / Part I 19 Introduction
The Best Practice Updates replace the previously published Best Practice Handbooks delivered in BESTUFS I and in the first two years of BESTUFS II.
Newly collected projects will also be included in the “thematic overview”, the project and country description database published on www.bestufs.net.
Update sources Sources of the updates are:
The data gathered for the BESTUFS newsletters
Projects and information provided by experts in workshops and conferences
Information gathered by the BESTUFS contractors and experts network
Use of the handbook
The main focus of this handbook is to get a European (and selected other countries) overview of solutions and existing activities related to the considered themes. The results are described as experiences rather than as a thorough scientific analysis.
Comments from readers
Remarks and input regarding this Best Practice Handbook are welcome. Please send your ideas for updates and additions to the following address:
BESTUFS II – D 2.3 Best Practice Update 2007 / Part I 20 Best Practices
2 Best Practices
Identification of Best Practices
In order to develop a common framework for best urban freight solutions as many as possible relevant aspects which might have an impact on urban freight transport are considered. In general, different “types” of actions, research and activities can be identified to characterise best practice solutions for urban freight transport.
A best practice solution does not necessarily focus on particular measures such as the implementation of freight centres in urban distribution traffic. Also activities without direct impact on the actors of urban transport operations such as the improvement of the data and information basis or of planning tools in urban freight transport are considered. The following “types” of action can be part of best practice solutions:
Projects, actions and activities where goods transport changes are realised – “vertical” projects. Normally, these projects are directly related to a particular problem in urban freight transport.
Projects, actions and activities which will not directly lead to changed urban freight transport operations but which provide tools and/or knowledge to influence and prepare decisions in urban freight traffic – “horizontal” projects. These projects are focusing on the improvement of overall planning and basic knowledge, i.e. data collection, education, planning tools etc. Usually, they are not directly related to a particular problem.
Sources of Best Practices and thematic structuring
To analyse existing and ongoing projects in the field of urban freight transport a thematic structure is applied. This approach allows structuring all relevant material available concerning the prioritised themes of the BESTUFS network and supports the analysis of the projects.
To identify best practice in urban freight transport three “sources” will be used within the BESTUFS project:
First, a formal approach is followed by providing tools as a thematic structure, suitable attributes and parameters as well as assessment directions.
Second, a pragmatic approach is realised in order to assess ongoing projects as well as available project results on their contents.
Third, workshops, national seminars and conferences are organised in order to extract experiences and knowledge from experts.
The following graphic describes the action lines:
BESTUFS II – D 2.3 Best Practice Update 2007 / Part I 21 Best Practices
Tools(formal background)
Catalogue of themes
Catalogue of attributes and
parameters
Catalogue of assessmentdirections
Contents(pragmatic approach)
Determination ofthematic focus
Secreening existingproject/results
Selection process
Classification of projects/results
New project/results
Workshops
Conferences
Nationalseminars
BEST PRACTICES
Figure 3: Sources of Best Practices and thematic structuring
BESTUFS definition of Best Practice
Best Practices are planned or implemented private only, public only or Public Private Partnership (PPP) strategies, measures or activities which have an essential contribution to urban goods transport and ideally lead to benefits for all actors involved. This can be projects, concepts or strategies. Best Practices will be identified on the fulfilment degree regarding the following requirements:
Best Practices have to fit to a defined theme or address a relevant problem with respect to the movement of goods in urban areas (see structure of themes).
Best Practices should be based on real experiences (real world implementations, pilot projects, concepts, strategies) or analysis in studies.
Best Practices should have considerable and measurable positive effects (qualitative, quantitative) on relevant indicators of urban goods transport.
In some cases it can also be important to take project activities into account which have not been successful. We can also learn from bad experiences and improve solutions by describing and analysing failure factors.
Urban freight transport and environment
Urban freight transport is an extremely important activity in the context of urban life: it is fundamental to sustaining our lifestyle and serves industrial and trade activities, which are essential to wealth generation. Efficient freight transport can play a significant role in the competitiveness of an urban area and is, in itself, an important element of the urban economy, both in terms of
BESTUFS II – D 2.3 Best Practice Update 2007 / Part I 22 Best Practices
the income it generates and the employment levels it supports. However, freight transport is responsible for traffic and environmental impacts in urban areas (such as contributing to congestion, pollution, noise, fossil fuel use etc.). Freight transport is, therefore, an important factor in the consideration of urban sustainability: it sustains the economic life of the city, but is also responsible for a number of social and environmental impacts. Over the past 20 years there have been significant changes and developments in the ways in which freight operations are carried out and the concerns about the negative environmental and social impacts of freight vehicle activity. First, distribution and logistics systems have changed considerably, with a significant degree of centralisation in manufacturing sites, stockholding points and retailing. Supply chain structures have also changed substantially, especially for larger companies where many have taken increasing control over the supply chain and the distribution of goods to their premises. Second, the stockholding patterns, and hence the goods delivery patterns required by manufacturers, retailers and other urban premises, have changed substantially, with a tendency towards more frequent, smaller deliveries. This move towards more frequent deliveries has resulted in a growing use of smaller freight vehicles. Third, the level of current concerns about the environmental impacts of our urban activities, and especially our urban transport systems, were not present 30 years ago. It is now widely acknowledged that new urban sustainability policies are necessary if urban areas are continuing to be desirable places to live, work and spend our leisure time. City logistics is a keyword to manage urban goods flows.
The definition of the term City Logistics
In the context of this project the term City Logistic is considered in its broadest sense, such that it includes not only the movement of goods in urban areas, but also activities related to other commercial transport (e.g. service technician trips). CLS are attracting ever more attention due to three primary reasons: First, current urban goods transport activities are perceived as having a negative affect on the quality of life in urban areas; Second, structural changes are taking place in urban areas in terms of planning city infrastructure and transport policy (e.g. pedestrian and parking zones), and commercial developments (e.g. shopping malls and emerging e-commerce – home delivery); Third, technological innovations (e.g. low emission vehicles, small containers, less expensive transhipment, or EDI) are swiftly entering the market and becoming competitively priced compared to the established technologies.
Projects must not only focus on urban city logistic, also regional projects that directly influences urban freight transport, e.g. the planning of an urban freight platform in the periphery, that leads to bundled transport flows and reduces vehicle-kilometres can be taken into account.
BESTUFS II – D 2.3 Best Practice Update 2007 / Part I 23 Road Pricing and urban freight distribution
3 Road pricing and urban freight transport
3.1 Introduction
Why road pricing? Road pricing is increasingly discussed as one possible answer to the ever increasing transport volumes and the various problems they imply. It is not exactly a new topic, but being based on the “user pays principle” it fits well into the general recent trend towards market mechanisms (which could be observed particularly with ecological issues). Additionally, the fast evolution of telematic technologies is opening up new possibilities, triggering further road pricing activities.
BESTUFS Workshop in Genoa
Therefore, the sixth BESTUFS workshop, which took place in Genoa on the 8th and 9th of November 2001, was dedicated to the topic “City access fees and urban pricing: What are the consequences for urban freight transport?”
Road pricing in the EU
Charges for road use and underlying cost calculations were already debated in the European Community in the early 60ties, but it was only in 1995 when the European Commission launched its Green Paper under the title “Towards Fair and Efficient Pricing in Transport: policy options for internalising the external costs of transport in the European Union”. [Rothengatter 1999] Therein the Commission advocates that: [FISCUS 2001]
• Pricing should be seen as a complement of regulatory and other market policies;
• The main aim of a fairer and more efficient pricing policy is to use price signals to curb congestion, accidents and pollution;
• Prices should reflect underlying scarcities to ensure sustainable transport;
• Appropriate infrastructure charging is needed to mobilise private capital and relieve the pressure on public budgets;
• The transport price structure should be: clear to transport users; differentiated across time, space and modes; non-discriminatory between modes and Member States.
The Green Paper was followed up by the White Paper on “Fair Payment for Infrastructure use: a phased approach to a common transport infrastructure charging framework in the EU”. Although not directly applicable to urban transport this paper reinforces that charging systems in the future should be based on the “user pays principle”. [FISCUS 2001]
BESTUFS II – D 2.3 Best Practice Update 2007 / Part I 24 Road Pricing and urban freight distribution
The recent Transport Policy White Paper: Time to decide
In its recent White Paper on “European transport policy for 2010: time to decide” the Commission follows this path announcing a proposal for a framework directive 2002 which will “include a common methodology for setting price levels which incorporate external costs, and will specify the conditions for fair competition between modes”. [European Commission 2001] The white paper re-emphasises the role of charges in reducing congestion and pollution and in financing new infrastructure. [Howes 2001] Among other measures the Commission proposes to replace existing (flat) transport taxes with more efficient instruments for integrating infrastructure costs and external costs. [Major 2001]
3.1.1 Definition of road pricing
Güller et al. [2000] define road pricing as a generic term for different methods for charging fees for the use of roads. Methods depend on basic political decisions, e.g. the charge of fees on single vehicle types, congestion fees, entry fees, road- and bridge-tolls, etc.
Definition of road pricing for this Best Practice Handbook
Following this definition, we define road pricing and urban freight transport as all measures imposing direct fees for the use of (urban) roads that might be able to influence the urban freight transport system. This includes all road pricing measures on urban roads, whether they concern freight transport or passenger transport.1 On the other hand the definition excludes all (so called “inter-urban”) road pricing on non-urban roads (e.g. motorway tolls, etc.) as well as other pricing measures such as fuel taxes, vehicle taxes or parking fees.
Restricted approach
An in depth analysis of pricing policies has to integrally consider the whole system of pricing measures applied to transport users of all modes in a certain area including fuel and vehicle taxes, (public) transport subsidies, transport related income tax deductions, road pricing, parking fees, etc. However, this would lead to an analysis of the whole fiscal system which cannot be done in the context of this Best Practice Handbook. Therefore, this Handbook only deals with road pricing schemes, being fully aware that they represent only one element of an entire pricing system.2
1 The pricing of passenger transport can influence the situation of urban freight distribution indirectly by reducing
congestion (and thus improving the conditions for freight delivery in the area) 2 For a comparative assessment of transport related taxation in various European countries, including vehicle
taxation, fiscal treatment of commuting and business travel, corporate taxation, tax treatment of public transport, etc. see Oscar Faber 2000.
BESTUFS II – D 2.3 Best Practice Update 2007 / Part I 25 Road Pricing and urban freight distribution
3.1.2 The economic idea of efficient pricing
The economic idea of efficient pricing
Efficient pricing refers to a price that fully reflects all individual and (long-term marginal) social costs, i.e. all external costs being internalised.3
Economic theory states that under certain conditions the price mechanism will then match supply and demand (so called allocation process) at a level maximising social welfare. [Güller et al. 2000] On the other hand, prices too low (too high) lead to a socially sub-optimal excess-demand (demand deficit) and thus to an inefficient level of consumption.
One main advantage of pricing measures compared to regulatory and prohibitive measures is, that they adapt continually to the individual preferences of each user instead of only being binary (allowed / prohibited). [Maibach et al. 1993] Being more flexible, i.e. by allowing the use of a certain infrastructure to those whose individual benefit from the use is higher than the charged price and discourage the others whose individual benefit is rather low,4 they increase the overall benefits of society. Another advantage of pricing measures is that they represent a continuos incentive whereas prohibitive measures only work up to the prohibitive limits. For example, with the prohibition of cars polluting more than a certain limit there is no incentive for improving car emissions below that limit whereas a road charge proportional to the car’s emissions provides this incentive also below any threshold value.
Distorted transport prices
Transport prices (for all modes) are generally heavily distorted by taxes or direct and indirect subsidies. In many countries road transport is currently being subsidised in the sense that road users are provided with roads, space and complementary traffic services (e.g. parking space) whose costs they do not fully bear; in the early 1990s, in the US road users only paid for 20-50% of the costs of providing the roads and services they used; in Germany this figure was around 70%, whereas in the Netherlands and France road users paid around 10% above their proportional share. [De Moor et al. 1997] The gap between costs of road transport and the price for its use widens even more when external costs such as congestion, accidents, noise, air pollution and other emissions are taken into account. Furthermore, in most countries various cross subsidies exist: from passenger to freight transport, from rural to urban transport and from gasoline to diesel users. [De Moor et al. 1997] Urban transport by means of road-based modes is considered dramatically under-charged. [Nash et al.
3 Social marginal costs can be divided into the following components [Güller et al. 2000]:
- Private marginal costs: variable costs such as fuel, time, wear and tear of tires, etc. - Variable infrastructure costs: wear and tear of road surface, road maintenance, etc. - User costs: external congestion costs - Costs outside of the transport system: external costs of noise, air pollution, accidents, climate change, etc.
4 The individual willingness to pay is seen as an indicator for the individual preferences and benefits
BESTUFS II – D 2.3 Best Practice Update 2007 / Part I 26 Road Pricing and urban freight distribution
2001]
Objectives: financing, demand management and efficient allocation
Road pricing is based on market mechanisms and the polluter pays principle: the road user should pay for the costs he creates. Road pricing can be used as a measure for financing infrastructure (or other public expenditures). On the other hand, it is also seen as a measure to correct existing price distortions in the transport market (by “putting prices right”). The actual objective strongly influences the design of the pricing scheme as well as the use of its revenues. As the price level influences demand, road pricing measures aiming at allocative efficiency5 are also referred to as demand management measures (as in the following too). Still, this use as synonyms (which is mainly due to the practically difficult notion of efficient allocation) should not conceal that the political objective of demand management is not necessarily identical with the economic objective of efficient allocation and its measures not necessarily in line with those of the latter.6
Difficulties and hindrances
The described theoretical principle of efficient pricing, also called marginal social cost pricing, is attractive and prominent. Still, it is not an undisputed panacea. Marginal social cost pricing is one pricing principle among others and (naturally) has its advantages and disadvantages,7 theoretical as well as practical ones. For some interesting arguments against Marginal Social Cost Pricing see Prud’homme [2001].
Scientific disagreement
The implementation of the welfare-optimising theoretical rule “price equals social (marginal) costs” comes along with various problems. First, the valuation of social costs (particularly external costs) is difficult. Estimates differ considerably, reflecting a wide margin of uncertainty.
Practicability Second, the exact charging of social marginal costs requires a highly sophisticated form of road pricing, e.g. differentiating by time, vehicle type, road sectors, etc. Such a system can cause high implementation and operation costs.
Political acceptance Furthermore, it is not very transparent to road users and would cause acceptance problems. Today, no city dares to raise trip costs to a level that could substantially help to internalise external costs of road use. [PRIMA 2000] Data privacy is often considered a key problem; for instance, ensuring data privacy was one of the must-requirements for the planned Dutch road
5 There are different meanings of the term „efficiency“: whereas allocative efficiency refers to the most productive
use of production factors according to the citizens’ demand (or preferences), operational efficiency refers to producing a given output at minimal costs [Frey/Kirchgässner 1994]
6 Demand management will require high prices aimed at the users with a high elasticity, whereas efficient prices are determined by social marginal costs. Demand management may lead to efficient pricing, but it may as well increase prices beyond.
7 For example, the revenues might not fully cover all infrastructure costs, as marginal cost pricing only considers variable costs, neglecting fixed costs (such as capital costs of infrastructure) [Maibach et al. 1999]
BESTUFS II – D 2.3 Best Practice Update 2007 / Part I 27 Road Pricing and urban freight distribution
pricing scheme.
Theory and the real world
Real-world solutions therefore require simplifications while still trying to keep up the basic concept of a polluter pays pricing system as far as possible. [Güller et al. 2000] The assessment triangle for road pricing schemes in Figure 4 displays this field of tension.
Figure 4: The assessment triangle [PRIMA 2000]
3.1.3 Different categories of road pricing
Road pricing typology
There is no such thing as one optimal road pricing scheme. The choice of the most suited road pricing scheme depends on the objectives of road pricing, the existing traffic problems, the geography of the urban area as well as the history of transport policies. [PRIMA 2000] Accordingly, there is a large variety of different road pricing schemes which can be categorised according to a large number of different criteria. In the PRIMA project the following 5 forms of (urban) road pricing schemes have been identified: [PRIMA 2000]
Single road pricing
Charges on single roads or single lanes are generally collected at passage (entry or exit). Single road pricing is common for financing new roads. The assessment of this form of road pricing depends on the availability of alternative routes. If the priced roads are arterial roads, single road pricing might be efficient and effective, as several examples in Europe show. But there is a danger of car users diverting to other routes causing additional congestion and pollution there. A special kind of single road pricing are the so called pay-lanes (charged lanes parallel to lanes free of charge).
Network pricing
Charging the motorway network in, around or to a city (or between cities) is a common form of road pricing. In the urban context it is often limited to the network outside the city or to major roads leading to the city. Practicability and acceptance may be on a high level, but in that scheme also, efficiency
Efficiency/Effectiveness
Acceptance Practicability
BESTUFS II – D 2.3 Best Practice Update 2007 / Part I 28 Road Pricing and urban freight distribution
and effectiveness are limited by undesired diverting of traffic to other routes.
Area pricing Area pricing does not have the drawback of cars switching to alternative routes, as every transport in the priced area(s) is charged. From the point of view of effectiveness and efficiency a multi-zone pricing is even better. However, the practicability of a multi-zone pricing based on electronic fee collection is not yet given.
Cordon pricing In this case charges are collected on entry and / or exits around a whole area (e.g. inner city). Contrary to area licensing trips starting and ending within the area are not priced. There must be some kind of “natural” position for the cordon in order to prevent major price distortions between locations inside and outside the cordon.
Complex area pricing
Complex area pricing denotes a distance based area pricing scheme with charges ideally set equal to social marginal costs. Charges should vary according to distance, daytime (peak, off-peak), congestion, vehicle categories, etc. Such a high degree of differentiation can only be realised with electronic fee collection techniques. Today, complex area pricing is not a scheme to start with, as major pre-conditions (acceptance, inter-city or international standardisation of electronic collecting techniques, etc.) are not fulfilled. Within a step-by-step approach however the long-term goal may still be to introduce a complex area pricing.
Other differentiating criteria
Other criteria to differentiate between various forms of road pricing schemes include:
• use of revenue: municipality budget, reducing taxes and other charges, earmarking for environment friendly projects, public transport, road or rail infrastructure, etc.
• pricing structure: time, vehicle type (according to emissions, noise, etc.), traffic conditions (congestion level, etc.), etc.
• main objectives of the pricing scheme / targeted transport patterns: choice of route, time of trip, length of trip, trip frequency, modal split, choice of vehicle, choice of location, etc.
• affecting passenger transport or freight transport or both?
BESTUFS II – D 2.3 Best Practice Update 2007 / Part I 29 Road Pricing and urban freight distribution
3.2 Related research activities
Extensive research activity on road pricing has been done or is still ongoing. However, none of the known projects is focussing on the aspects of urban freight in relation to road pricing in particular. The following European8 and national research projects related to road pricing and urban freight transport have been identified: [CAPRI 2001, CUPID 2000, CORDIS 2002, BESTUFS 2001a]
European research projects:
4th Framework Program (1994 - 1998)9
AFFORD (Acceptability of Fiscal and Financial Measures and Organizational Requirements for Demand Management) aims to identify practical measures to implement marginal cost pricing in urban areas both in the short and long term. The project examines the institutional, economic (including equity) and public and political acceptability issues affecting the implementation of these measures and ways to overcome any identified constraint or problem. It involves six case studies - Athens, Dresden, Edinburgh, Helsinki, Oslo and Madrid. Project website: www.vatt.fi/afford
CAPRI (Concerted Action on Transport Pricing Research Integration) was commissioned to facilitate the exchange of information and results from research projects dealing with the pricing of transport. Key objectives were: to aid dissemination of research results, to present a synthesis of research findings, to facilitate discussion, to attempt to build up a consensus on the policy implications of this research. Project website: www.its.leeds.ac.uk/projects/capri/index.html
CONCERT-P (Co-operation for novel City Electronic Regulating Tools) aimed at producing guidelines for the development and implementation of European and local policies on pricing and access restriction, based on the assessment of the efficiency and acceptability of related transport demand management measures (integrated pricing and restraint measures, time-dependant and vehicle-based tolling, pollution-based pricing etc.). Their impact on urban traveller behaviour and travel demand patterns was modelled and evaluated through partial demonstrations in Bologna, Hanover, Marseilles, Dublin, Thessaloniki, Barcelona, Trondheim and Bristol.
EUROTOLL (European Project for Toll Effects and Pricing strategies) sought to validate the effectiveness of pricing measures in 13 cases in France, Italy, Austria, Germany, Great Britain, Greece and Portugal. The project centres on using road pricing as a congestion management tool. Final summary available at www.cordis.lu/transport/src/eurotollrep.htm
FISCUS (Cost Evaluation and financing Schemes for Urban Transport 8 Additional information on the EU transport research programme is available at the programme’s knowledge
centre: http://europa.eu.int/comm/transport/extra/home.html 9 The 4th Framework Programme officially ended in 1998, but some of the projects lasted longer.
BESTUFS II – D 2.3 Best Practice Update 2007 / Part I 30 Road Pricing and urban freight distribution
systems) sought to evaluate total transport costs (internal and external) in view of comparing costs between public transport and private car use. The research also looked at cost allocation practices in urban areas with a view to identifying feasible and effective means to finance urban transport systems. Final report available at: ftp://ftp.cordis.lu/pub/transport/docs/summaries/fiscusrep.pdf
PATS (Pricing Acceptability in Transport systems) defines a priori measures to increase the acceptability of marginal cost based pricing in transport based on an analysis of the reactions and comments to the Green and White Papers on pricing. These measures are tested and enhanced empirically using citizen surveys in six countries and focus group discussions in four countries. The implications of the suggested measures are assessed using modelling techniques. Project website: www.tis.pt/proj/pats/ukpatstitle.htm
PETS (Pricing European Transport systems) gives practical advice on what the consequences of implementing efficient prices will be in terms of volume of traffic, choice of mode and environmental consequences. The pricing scenarios tested included: (i) marginal cost pricing; (ii) marginal cost pricing subject to a budget constraint; and, (iii) full internal and external cost recovery. The project also examines the relationship between deregulation and pricing. It involves five case studies - Channel crossing, crossing of the Alps, Oslo-Gothenburg, Finland, and the Tagus River crossing in Lisbon.
PRIMA (Pricing Measures Acceptance) studies the acceptance issue for road pricing schemes that have been implemented or where non-acceptance has resulted in rejecting the scheme. The project also looks at technological specifications and design issues. Project website: www.certu.fr/internat/peuro/prima/prima.htm
TRANSPRICE (Transmodal Integrated Urban Transport Pricing for OptimumModal Split) addresses a wide range of transport demand management measures (ringtolling, area pricing, parking pricing combined with access restrictions etc.) with an additional emphasis on how pricing may be integrated across a number of transport modes and related facilities. The indicators of success are primarily the efficiency (in terms of how it affects mobility demand and traffic congestion) and public acceptance. Participating cities were: Athens (Greece), Como (Italy), Gothenborg (Sweden), Graz (Austria), Helsinki (Finland), Leeds (United Kingdom), Madrid (Spain) and York (United Kingdom). Project website: http://gridlock.york.ac.uk/transprice/
TRENEN II STRAN (Models for Transport, Environment and Energy, version 2; Strategic Transport Policy analysis) analysed different combinations of pricing and regulatory instruments in order to identify optimal combinations to solve environmental, energy and pure transportation problems. It involved six urban case studies - Amsterdam, Athens, Brussels, Dublin, London and Mestre - and three regional case studies - Belgium, Ireland and Italy. The TRENEN model maximises a weighted sum of the consumer and producer
BESTUFS II – D 2.3 Best Practice Update 2007 / Part I 31 Road Pricing and urban freight distribution
surpluses, tax revenues and external effects by selecting a set of policies under constraints.
European research projects:
5th Framework Program (1998 - 2002)10
CUPID (Co-ordinating Urban Pricing Integrated Demonstrations) is a Thematic Network funded by DG TREN of the European Commission which aims to promote state of the art knowledge on urban transport pricing schemes. Its other important role is to provide guidance and assistance to the eight European cities developing and demonstrating congestion charging as part of the PROGRESS project (see below). Project website: www.transport-pricing.net
DESIRE (Designs for Interurban Road Pricing Schemes in Europe) is developing a set of basic designs for interurban road pricing systems for heavy goods vehicles, is carrying out an in depth analysis of the impacts of such systems and is developing a set of guidelines for the design, financing and implementation of such systems. The situations in 13 European countries and Brazil are studied. Project website: www.tis.pt/proj/desire.htm
IMPRINT (Implementing Pricing Reform in Transport - Effective Use of Research of Pricing in Europe) is a thematic network project. It aims at bringing together all different stakeholders in order to promote the implementation of fair and efficient transport prices. It will organise 5 international seminars on the topic, summarise research and give recommendations. Project website: www.imprint-eu.org
MC-ICAM (Marginal Cost Pricing in Transport - Integrated and Conceptual Applied Model Analysis) examines policy reforms in the pricing of transport, in particular optimal transition paths from a situation with low pricing of transportation towards marginal social cost pricing. Work includes theoretical analysis as well as the examination of selected geographical areas. With regards to urban issues studies in the Randstad (NL), in Paris, Oslo, Brussels and Helsinki are planned. Project website: www.mcicam.net
PROGRESS (Pricing Road Use for greater Responsibility, Efficiency and Sustainability in Cities) includes research and demonstration project in 8 European cities, namely Bristol, Copenhagen, Edinburgh, Genoa, Rome, Helsinki, Trondheim and Gothenburg. Project website: www. progress-project.org
UNITE (Unification of accounts and marginal costs for Transport Efficiency) is designed to develop methodologies and empirical evidence to support decision-makers involved in developing pricing and taxation policies for all significant passenger and freight modes - road, rail, air, inland waterway and maritime - in Europe. UNITE will produce social transport accounts for 18 European countries. Project website: http://www.its.leeds.ac.uk/projects/unite
Other European projects
EUROPRICE (European Urban Road Pricing Network) is a network of
10 The 5th Framework Programme is officially ending in 2002, but some of the projects are still ongoing (e.g.
BESTUFS)
BESTUFS II – D 2.3 Best Practice Update 2007 / Part I 32 Road Pricing and urban freight distribution
European cities for mutual political support, exchanging experiences and providing a focus for city/regional issues in the road pricing debate. The network was set up 1999 by the Bristol City Council and is supported by the European Commission (DG TREN). Participating cities are/were: Bristol, Belfast, Copenhagen, Edinburgh, Genoa, Leicester, Rome, Trondheim. Project website: www.europrice-network.org
National general road pricing research projects
NFP 41 (Switzerland, 1995 - 2001) is a comprehensive National Research Programme on Transport and Environment aiming at an efficient, environment-friendly, socially acceptable transport policy. It consists of over 50 research projects, among which the reports D3, D11, E2 and M20 deal with road pricing issues. D3 (Fair and efficient prices for transport) treats different approaches for a national transport policy according to the polluter pay principle. D11 (Road pricing in Switzerland) investigates the acceptance and feasibility of possible road pricing approaches in the light of public opinion polls and international experiences. E2 assesses the interoperability of electronic fee collection systems, particularly opportunities and limits of additional applications of the implemented Heavy Goods Vehicles fee collection system (LSVA11).12 M20 analyses technical and operational possibilities for fee collection on roads.13 Project website: www.nfp41.ch
Currently, a ministerial commission is investigating the possibilities of road pricing in Denmark.
CERTU (France), le Centre d’Etudes sur les Reseaux, les Transports, l’Urbanisme et les Constructions Publiques, is doing a lot of research on road pricing issues. There latest publication (in French) is titled “Urban Road Pricing: The issue of Acceptability”. CERTU website on pricing: http://www.certu.fr/transport/tarification.htm (in French)
Kilometerheffing (Netherlands) is a major project of the Dutch Ministry of Transport, in which currently the kilometre based road pricing system for all domestic motor vehicles and all heavy goods vehicles (>12 tons GVW) is being developed. The results of the research and development activities regarding kilometerheffing are made available at the project website www.roadpricing.nl (in English) and www.projectkilometerheffing.nl (in Dutch)
11 see Annex II, project CH - 01 12 a summary of the report is given in Annex II, project CH - 02 13 a summary of the report is given in Annex II, project CH - 03
BESTUFS II – D 2.3 Best Practice Update 2007 / Part I 33 Road Pricing and urban freight distribution
3.3 Situation at country level
Fast changing information
Material regarding the situation of road pricing in general and of projects related to road pricing and urban freight in different European countries was collected by the various BESTUFS contractors and members. Further input came from the involved experts and the workshop. The following chapters summarise the main findings of the material collection on country and project level. The given information and its assessment represent the situation at the time of collecting the material, between 2002 and 2007.
3.3.1 Importance of road pricing
In order to give a brief impression of the relevance of the topic the BESTUFS partners participating in the material collection were asked to estimate the importance of road pricing in their country. Although the term “importance” is defined rather vaguely and its estimation is always subject to the personal view of the assessor, a rough overview on their different estimations sketches a first picture of the European road pricing situation of today and possibly tomorrow.14
Still rather little importance of road pricing today ...
In a majority of Europe’s countries the general concept of road pricing (in all its different forms, urban or inter-urban) is estimated to be of rather little importance (see Figure 5). In those few countries where road pricing is considered more important, it is mostly used for (financing) inter-urban motorways (Eurovignette, motorway tolls). Exceptions are the Swiss Heavy Vehicle Fee and the several urban pricing schemes in Norway.
When it comes to urban freight transport in particular the importance of road pricing today is estimated even lower (see Figure 6). The explanation for this is twofold. First, with the exception of Norway and a few single road pricing schemes there are hardly any urban road pricing schemes implemented so far. Second, the existing urban road pricing schemes mostly focus on passenger transport and on financing rather than demand management. They are therefore perceived as less important for freight transport - although they do have an impact on freight transport too.
... but expected to increase heavily in the future
However, this rather modest picture only applies for today. When it comes to the future, there is a widespread consensus that road pricing will substantially gain importance, both in general and for urban freight transport in particular (see Figure 5 and Figure 6). Although other parts of the
14 Please note that the considerations expressed in this chapter represent the personal opinions of the BESTUFS
partners participating in the material collection and should not be mistaken as a statistical opinion poll.
BESTUFS II – D 2.3 Best Practice Update 2007 / Part I 34 Road Pricing and urban freight distribution
transport system will probably be even more affected by future road pricing projects than urban freight transport, road pricing is well relevant for BESTUFS too, as it is a progressive, future-oriented topic that should be observed prospectively.
Figure 5: Today’s and future importance of road pricing in general 15 (number of countries)
Figure 6: Today’s and future importance of road pricing for urban freight transport 16 (number of countries)
3.3.2 National road pricing situations
Common inter-urban motor-way tolling
A summarising overview on existing and planned road pricing schemes within Europe (see Annex II) confirms the picture drawn in the preceding chapter. Quite a number of single roads (mostly non-urban) are charged,
15 according to the personal estimations of the BESTUFS members participating in the material collection 16 according to the personal estimations of the BESTUFS members participating in the material collection
0
1
2
3
4
5
6
very low low medium high very high
TodayFuture
0
1
2
3
4
5
6
7
8
9
very low low medium high very high
TodayFuture
BESTUFS II – D 2.3 Best Practice Update 2007 / Part I 35 Road Pricing and urban freight distribution
usually using toll booths. Charging motorway users is common in various southern countries as well as in France. [Maibach et al. 1999] For many motorway networks there are time based schemes, e.g. the “Eurovignette” for Heavy Goods Vehicles or the Swiss Motorway-Vignette. Germany and Austria raise km-based charges for Heavy Goods Vehicles on motorways (so called “LKW-Maut”).
Urban road pricing still in its infancy ...
But when it comes to urban road pricing or to road pricing for demand management, road pricing is still in its infancy (see Figure 7). Norway is probably the leading European country in urban road pricing with several cordon pricing schemes (Oslo, Trondheim, Bergen, etc). The Central London “Congestion” Pricing scheme a time based road pricing for demand management was implemented in 2003 to tackle the traffic jams. This is also the case in the 2007 implemented Stockholm congestion charge. Furthermore there is a number of charged urban single roads, e.g. in France (Marseille, Lyon, etc.). Most schemes have been set up to raise money for infrastructure development or to influence traffic demand. In Switzerland, the distant related Heavy (Goods) Vehicle Fee (LSVA) is aiming at demand management. Since 2001 it is charged on all public roads including urban areas.
... but many initiatives in the pipeline
Although the implemented urban road pricing schemes are very few, there are a large number of ongoing initiatives and planned projects proving the increasing importance of the issue. In Norway there are proposals to allow additional charging for demand management. In Belgium there are plans for a cordon pricing scheme for the Brussels region. The Netherlands have abandoned the formerly planned cordon-pricing scheme for the Randstad region in exchange for the now planned nation-wide distance-related road pricing for all vehicles (Kilometerheffing) to be introduced from 2004 till 2006. However, also for this system there was lack of acceptance and the plans were postponed. A distance based fee for lorries on all UK roads is planned to be introduced in 2008. Other ongoing initiatives include various demonstrators and field trials within national and European research projects, e.g. PROGRESS.
... although not everywhere
Not all countries do jump the European road pricing train. Urban road pricing, in particular for demand management, is a rather low profile issue in Finland, Austria, Germany, France and Greece. In Spain, the subject has been completely abandoned. It is considered completely at odds with the Spanish mentality. [Montero 2001]
In the following we give a very brief summary on the national situation in the various countries (summarised in Figure 7).17
17 A more detailed report on each country’s situation concerning road pricing and urban freight transport is given
in Annex I.
BESTUFS II – D 2.3 Best Practice Update 2007 / Part I 36 Road Pricing and urban freight distribution
Figure 7: Urban road pricing development in Europe18
Norway: the most experienced
In Norway, several road pricing schemes are operational, from single road pricing approaches to network pricing as well as cordon pricing such as the toll rings around Oslo, Trondheim and Bergen. These toll rings solely aim at financing transport infrastructure, but there are plans to extend the concepts in order to manage demand.
Sweden: highly debated
In 2006 there was a first practical attempt to implement a cordon-pricing scheme in the city center of the Swedish capital Stockholm after a suggestion on the introduction of fees had failed in 1997. After the six month test run the following results showed up: 23% less traffic in the city center, 13% less fine dust burden as well as 14% of fewer hydrocarbons in the air. The congestion tax was implemented on a permanent basis on August 1, 2007.
Finland: no big issue
Road pricing is presently not a big issue in Finland. Although Helsinki was currently taking part in the PROGRESS project. Helsinki didn’t carry out a physical demonstration, but did carry through an extensive modelling exercise to prove the potential as a demand management tool.
18 The intensity of grey gives a very rough and generalised estimate of the level of evolution [white=not assessed;
level 1=no experience; level 2=some field trials; level 3=not specifically urban, but complex pricing; level 4=about to be implemented; level 5=urban road pricing implemented]
BESTUFS II – D 2.3 Best Practice Update 2007 / Part I 37 Road Pricing and urban freight distribution
Denmark: ministerial commission investigating
Fees are collected for the two large bridges Great Belt and Oresund, and Copenhagen was doing a field trial within PROGRESS. A ministerial commission was investigating the possibilities for road pricing in Denmark but actual there is not road pricing.
United Kingdom: London and many ambitious projects
Since February 2003 the London Congestion charge was introduced for the city centre. On 19 February 2007 the western extension of the fee ring was ratified. Thus the duty-requiring city doubles itself. 12 EUR are required once daily. In the Londoner city centre about 20% fewer traffic volumes were reached. But also other cities are investigating the possibilities of road pricing. In order to share ideas and develop pioneering schemes the Government set up a Charging Development Partnership including Leeds, Derbyshire, Bristol, Edinburgh, Greater Manchester and Hampshire. Furthermore, the government plans to introduce a lorry road-user charge on all UK roads which will replace existing vehicle excise duties and enables charging according to distance and route travelled.
France: a moving topic
While motorway tolling is quite common in France, urban road pricing has been a very controversial issue between the mid nineties and 1999 when a few experiments where proposed or implemented. A “national network of local associations anti urban road pricing” was created. The metropolitan areas of Lyon, Grenoble and Saint Etienne have been imagining a common strategy for urban pricing. In 2006, the state agency DREIF (transport and infrastructure direction for the Paris region) has proposed to develop a pricing scheme for the urban part of the Paris regional highway network.
Belgium: Brussels’ plans for the future
In Belgium, the only experiences with road pricing are the Eurovignette for HGV and a tolled motorway tunnel. But modifying the motorists’ global taxation is a prominent topic in Belgium. In the media, two broadcasts at peak listening times were devoted to road pricing and there are plans for a cordon pricing scheme for the Brussels region.
The Netherlands: ambitious national plans
To increase accessibility by road in general and of the Randstad (western conurbation) in particular, the government will institute the system of kilometre levies, possibly in phases, differentiated by time, place and vehicles’ environmental parameters, on condition that existing taxes (car and motorcycle tax (BPM), motor vehicle tax (MRB) and eurovignette) be eliminated proportionally and that system and collection costs amount to no more than 5% of revenue.
Switzerland: demand management by LSVA
Switzerland has introduced the distance, weight and emission related Heavy Vehicles Fee (LSVA) on all public (including urban) roads in 2001, mainly for demand management. But on city level there are no road pricing measures discussed, apart from vague plans for single roads. Urban road pricing appears in the media on occasion but it has only been on left and green parties’ political agenda.
BESTUFS II – D 2.3 Best Practice Update 2007 / Part I 38 Road Pricing and urban freight distribution
Germany: distance related Heavy Vehicle Fee
The present situation on road pricing in Germany is mainly related to the financing and to the cost coverage of infrastructure in inter-urban transport. Germany has introduced a distance-based toll for all trucks of twelve tonnes gross vehicle weight and above on German motorway network.In some large German cities the introduction of a “City Maut” is under discussion. One of the main reasons is that the air pure retaining regulations of the European Union in the reference to fine dust and nitrogen dioxide in numerous German cities are not kept. Apart from driving bans road using fees are therefore discussed as effective instrument for the reduction of motorized traffic.
Austria: focussing on inter-urban pricing
Due to the above average traffic development in Austria road pricing became a very sensitive political topic within the last decade. Awareness is very high, as people are convinced that traffic policy will have an essential impact on the economic and social development of the country. However, the Austrian discussion always focussed on motorways. There has never been a public discussion on road pricing for urban transport. The first act of parliament was to implement the vignette in 1997. The implementation of the “Autobahnvignette” for cars below 3,5t was considered to be the first stage towards infrastructure charging. At this time HGV were still charged with a kind of flat tax, rate per vehicle. Then a new act was decided on, to implement a nation-wide toll-station-system on the motorways to charge HGV over 3,5t. The ASFINAG was authorized to put out to tender a modern, electronic-based toll system. A toll-system based on microwave technology was then implemented and put into operation in January 2004.
Italy: ongoing investigations and pilots
In Italy, pricing of motorways is quite common. On an urban level, specific road pricing schemes are being investigated and tested in the cities of Rome and Genoa (within the PROGRESS project) in order to reduce traffic and to protect the environment of the historical areas. In Rome the system has been implemented.
Greece: high awareness, low acceptance
On an inter-urban level road pricing is a rather widespread practice in Greece in order to finance roads and their maintenance and operation. Transport professionals (and to a lesser extent administrations and politicians too) are highly aware of road pricing techniques. Nevertheless, the implementation of urban road pricing (particularly for demand management) is still considered highly improbable due to the expected low acceptance by the public (new fee, data privacy, etc).
Czech Republic: Goods vehicles charge
The Czech Republic has implemented an electronic pricing system for heavy goods vehicles on Januray 1st 2007. The charge is applicable on motorways and based on the travelled dinstnace.
Hungary: Planning a scheme
Hungary is planning to introduce a distance based fee for heavy goods vehicles too. The project is in the tender phase and close to realisation.
BESTUFS II – D 2.3 Best Practice Update 2007 / Part I 39 Road Pricing and urban freight distribution
Spain: no gracias! Although motorway tolling exists in Spain, the subject of other road pricing has been completely abandoned. No city is thinking about the implementation of a road pricing system, as these kinds of measures are completely at odds with the Spanish mentality. People do not even pay the parking meter, the municipal authorities not being able to enforce it.
3.3.3 Legal framework conditions
European background
Road pricing for Heavy Goods Vehicles (HGV) over 3.5 tons is legally possible, but not compulsory in the EU Member-states on all roads since the revised so called “Eurovignette directive” (1999/62/EC and revision 2006/38/EC). Before 2006 road pricing was only legally possible for motorways, bridges, tunnels and mountain passes. The adjusted directive also allows tolls for the specific goal of fighting congestion and environmental issues in urban areas.
All charges have to fulfil the principle of being non-discriminating. The charge is to be graduated according to emission class (EURO 1-5), which has to be implemented by the member states until 2010. The calculation of the tax must be based on infrastructure based full costs and exclude external cost. Cross-financing is only possible in sensitive areas such as the alpine region.
National legislation: only three countries allow urban road pricing
Whereas quite a number of countries allow inter-urban road pricing for motorways or for Heavy Goods Vehicles,19 currently four out of the 14 examined countries do have national, regional and communal legislation that allows the introduction of urban road pricing schemes: Norway, Sweden, the UK and Italy (Figure 8).
Norway According to the law (Vegloven) road pricing can be introduced in Norwegian cities if the local authority wishes to. The final decision has to be taken by Parliament.20
United Kingdom The Labour government has facilitated the introduction of road user charging through the Greater London Act and The Transport Act 2000 by giving powers to the London Mayor and to local authorities outside London to introduce charging schemes. The Bill also provides for the revenues raised to be ring-fenced and to be used specifically for local transport improvements.
19 Although e.g. France restricts the levied fees to the level of infrastructure costs, making it impossible to
consider external costs 20 The existing toll rings around many cities are not considered as road pricing and subject to a different law
BESTUFS II – D 2.3 Best Practice Update 2007 / Part I 40 Road Pricing and urban freight distribution
Italy National legislation already exists in Italy to support road pricing initiatives, namely
• Road code which authorises road pricing when used to protect historical centres
• “Decreto Bassanini” that authorises the remote issuance of tickets for non-compliance with restricted areas (i.e. the possibility to use ITS technologies for enforcing these areas).
The others In many countries the legal prerequisites for urban road pricing are not given (yet): Finland, Denmark, The Netherlands, Austria, Switzerland, Germany, Greece. In France and Belgium the legal situation is unclear.
Figure 8: Legal situation on urban road pricing in Europe
3.3.4 Attitude of goods transport professionals
Professional transport providers all over Europe are obviously not enthusiastic about road pricing initiatives, mainly because they fear that it
legal
unclear
not legal
unknown
BESTUFS II – D 2.3 Best Practice Update 2007 / Part I 41 Road Pricing and urban freight distribution
will impose new costs on their business. Naturally, the private interests of road transport operators are not necessarily congruent with public welfare. However, the national barometers of opinion are far from uniform.21
From complete rejection...
In general, freight transport business in Spain, Belgium, Switzerland and Sweden is against road pricing. Reluctance might decrease according to the use of revenues and the balancing of road charges by a reduction in existing taxes.
... and acceptance under certain conditions ...
In other countries, professional transport operators are not a priori against road pricing - if certain conditions are met. Norwegian transport operators are generally against, but many are in favour too, provided that there are significant improvements for road users (e.g. through financing of road infrastructure). Also Austrian road hauliers are not generally opposed as long as the solution is not discriminating single actors and harmonised with other EU-countries.
... to the expectation of benefits
In some countries, the transport operators do even recognise a certain benefit from road pricing. In Denmark, it is perceived as more fair in regard of time and place of the road usage than flat taxes, but only acceptable if tax pressure neutral and not discriminating certain modes of transport. In Germany, the planned distant related Heavy Vehicle Fee is accepted as it makes foreign transport operators participate on German infrastructure costs and thus harmonises competition. In the UK, the Freight Transport Association FTA is very pro road user charging to promote foreign operators paying on an even playing field. When it comes to urban road pricing, French transport operators are not too opposed (as long as not charged too heavily), because road pricing might lead to less private cars, reduce city congestion and thus improve their efficiency (higher average speed).22 Due to their higher time value (compared to e.g. a private leisure trip) transport business could therefore gain a net benefit from road pricing. In the Netherlands, all stakeholders (!) including the transport operators do generally agree with road pricing and the polluter pays principle - for the same reason. Still, the question remains, whether road pricing will really reduce congestion - and at what price?
No general pattern identified
As the experiences with road pricing (particularly for demand management) are very few, no conclusions can be drawn on this level about the experiences made with road pricing and its acceptance by transport operators. Furthermore, acceptance is a very complex and manifold issue.23 For further considerations and a discussion of the most popular arguments with regard to urban road pricing and its consequences for freight transport please refer to chapter 3.6.
21 The following description of national political opinions are based on the personal estimation of various transport
experts and not on statistical surveys or opinion polls. 22 Note that this kind of argumentation might be inconsistent because a noticeable reduction of congestion is
probably only achievable by a sufficiently high level of charges (due to the low price elasticity of private transport demand)
23 see PRIMA 2000, which however does not distinguish freight transport operators
BESTUFS II – D 2.3 Best Practice Update 2007 / Part I 42 Road Pricing and urban freight distribution
3.4 Regarded case studies (project-level)
29 projects collected
29 projects from participating countries have been collected. Annex III gives an overview on all collected projects, the project’s phase, its extension, the applied pricing scheme, the pursued objectives, the type of transport charged and the chosen technical approach.
Focus on urban road pricing
A large majority of the collected projects are directly or indirectly related to urban road pricing (see Figure 9).
Figure 9: Collected projects according to their extension
Although also inter-urban road pricing schemes might have an effect on urban freight transport in terms of technical development, overall awareness about road pricing, route planning, etc., urban road pricing schemes (including those affecting urban as well as non-urban roads) are more likely to be relevant for urban freight. Therefore the following assessment of case studies is focussing on exclusively or inclusively urban road pricing schemes.
One third operational, mainly for revenue generation
About one third of the collected (urban) road pricing projects are currently implemented and operational. One sixth have been abandoned. The rest has not yet overcome the consultation and design status (see Figure 10).
A majority of the projects have (mainly or exclusively) been set up for demand management (see Figure 11). However, with the exception of Rome’s automatic access control system and the Swiss Heavy Vehicle Fee, all implemented schemes are (mainly or exclusively) for revenue generation.
urban
inter-urban
both
general study
BESTUFS II – D 2.3 Best Practice Update 2007 / Part I 43 Road Pricing and urban freight distribution
Thereby most revenues are earmarked for road infrastructure. This strong correlation between road pricing objectives and project status is a clear picture of the fact that road pricing for demand management is mostly not accepted yet.
Figure 10: Collected (urban) projects according to their status
Figure 11: Collected (urban) projects according to their objective(s)
8 projects from other EU research projects
9 out of the total of 29 projects (i.e. circa 30%24) are part of other research projects funded by the European Union. The Athens field trial (GR - 01) and the study on Graz (AT - 05) have been done within the TRANSPRICE project (see Chapter 3.2). The projects in Copenhagen (DK - 02), Helsinki, Trondheim, Gothenburg, Rome and Genoa are part of the PROGRESS project (5th framework program, finalised in 2003). The second Danish project (DK - 01), also in Copenhagen, was part of the EU-funded EUROPRICE network project.
The relatively high number of EU research projects highlights the importance of European research for road pricing and the high relevance the European Commission attributes to the subject.
24 If we consider only the projects pricing urban roads it is even 40%.
0 1 2 3 4 5 6 7 8 9
Consultation and building political consensus
Project design, development & demonstrations
Pilots and implementation
Project implemented and operational
Abandoned / not followed
0 2 4 6 8 10 12
generating revenues
mainly generatingrevenues
mainly demandmanagement
demand management
BESTUFS II – D 2.3 Best Practice Update 2007 / Part I 44 Road Pricing and urban freight distribution
The web-sites of EUROPRICE,25 TRANSPRICE26 and PROGRESS27 and the respective deliverables provide extensive information and analysis on the mentioned projects. Therefore, the corresponding projects have not been considered in the first place in the following detailed project descriptions.
Additional world-wide projects
The BESTUFS I and II material collections on road pricing and urban freight transport tries to cover the most important projects on the theme within Europe. However, as the material collection is limited to European countries we would like to give a short link to the following additional projects, initiatives and studies on urban road pricing that have been identified: [CERTU 2001]
• Auckland (Canada): Study on the impact of a cordon pricing scheme [www.ucalgary.ca/~jabraham/Papers/ModellingPricingInAuckland/odyframe.htm]
• Hong-Kong (China): First series of tests in 1983-1985. Other tests based on GPS in 1998-1999. So far, no political decision has been taken yet. A feasibility study did assess DSRC and VPS technology [www.info.gov.hk/td/eng/publication/images/erp.pdf]
• Singapore (Singapore): Has established a cordon pricing scheme around the trade centre already in 1975. Since 1998 there is a fully electronic congestion charging scheme operating [www.gov.sg/lta/MenuFrame2.htm]
• Tokyo (Japan): In 2000 (?), the Governor of Tokyo proposed a cordon pricing scheme for the Tokyo city centre for traffic regulation
• Kamakura (Japan): A cordon pricing scheme has been proposed by the people in 1995 in order to protect the historic city centre
• Melbourne (Australia): Since 1999 road pricing scheme on roads into the city centre and ring roads. Fully electronic system similar to the London congestion charging. Significant reduction of congestion and air pollution, road safety improved.
Assessment of the projects
The following project descriptions show examples of planned or implemented road pricing projects and assess the experiences made. As many innovative projects are planned or set-up a selection had to be made.
Thereby, the following aspects were considered:
• Relevance for BESTUFS, innovative character and contribution to solve
BESTUFS II – D 2.3 Best Practice Update 2007 / Part I 45 Road Pricing and urban freight distribution
problems
• Success / failure analysis and real world experiences
• Balance among countries and approaches
• Coverage by other EU-research projects
• Availability of further information
BESTUFS II – D 2.3 Best Practice Update 2007 / Part I 46 Road pricing and urban freight transport
Example 3.4.1: Oslo
Example 3.4.1: Oslo (Norway) (incl. Bergen, Trondheim) [Firth 2001; Güller et al. 2000; Waersted 1998]
Key words Toll ring, cordon pricing, financing infrastructure, Dedicated Short Range Communication
Background Norway has a 60-year-old tradition of using road toll payment as a financial instrument for building bridges, tunnel and roads. Today it has about 40 different road toll projects, most of them to finance fjord crossings.
Among the major cities, Oslo, Trondheim and Bergen have (similar) urban toll systems from which Oslo is described here as an example, highlighting also some particularities from the other two.
The Oslo toll ring that charges car users for entering central Oslo, began operation in 1986, shortly after the Bergen ring. For a long time Norwegian politics have kept its investment in road infrastructure in the Oslo region rather low. In the mid eighties the city and the national government were lacking funds for the planned new infrastructure buildings.
Objectives The Oslo toll ring was set up in order to alleviate the choking road traffic conditions on the main road network in the city areas in question and to realise publicly financed infrastructure projects within 15 years instead of the usual 30 years. It is intended to raise money for improvements to the road network, originally to finance a fixed number of around 50 road construction projects, among which the E18, a six-lane tunnel under the Oslo City Hall for east-west-through traffic. However, as an environmentally friendly compromise 20% of revenues are earmarked for public transport infrastructure projects (bus and metro terminals, new metro lines, etc.).
Basic approach The Oslo toll ring is a classic cordon pricing scheme with 19 toll stations circling the centre of Oslo (see Figure 12). People driving into the city centre pay a fee when passing the toll cordon line. Every car accessing the city centre necessarily has to pass a toll station. Leaving the city centre is free. The current configuration of the toll ring allows to optimise revenues (highest possible traffic volume paying) with a minimum of toll station to make the ring complete. Furthermore, availability of space for the toll stations and fairness towards citizens living outside the cordon were other issues. With the adopted solution, 50% of the population of the city are living outside the ring.
The current fee is ca. 2 EUR per passage for vehicles up to 3.5 tons and 4 EUR respectively for vehicles above 3.5 tons. There are discounts for
BESTUFS II – D 2.3 Best Practice Update 2007 / Part I 47 Road pricing and urban freight transport
monthly, quarterly or annual subscriptions. An annual pass costs 520 EUR or 1040 EUR respectively. This flat fee is charged every day, day and night.28 In case of an illegal passing a belated fee can be paid at most Esso petrol stations in the Oslo area to avoid being fined.
Figure 12: 19 toll stations circle the Oslo city centre [Waersted 1998]
Technical solution 7 out of the 19 toll stations are operating with more than 5 lanes. The toll stations offer electronic non-stop payment lanes, automatic payment (coin machine) lanes or manual payment (attendant in a toll booth) lanes (see Figure 13). Electronic payment allows passage without speed reduction. Currently the system is being developed to an entirely electronic system.
Institutional solution The Oslo toll ring is run by Fjellinjen AS, a company charged with the part financing of road and public transport developments in the Greater Oslo Area which it does through raising tolls on the Oslo toll ring. The company is 60% owned by Oslo City Council and 40% owned by the neighbouring Akershus County Council.
Supporting measures
The Oslo charging scheme is supported by the major political parties. It was positively marketed in the beginning as an efficient operation without queuing from day one and by opening the E18 tunnel 14 days before the start of the payment system. Furthermore, there were other arguments and compromises during the process of bundling “the Oslo package”:
• The toll ring is part of a road infrastructure financing programme including a number of defined road construction projects during a limited
28 In contrast, in Bergen and Trondheim, the passage is free at night and during weekends.
BESTUFS II – D 2.3 Best Practice Update 2007 / Part I 48 Road pricing and urban freight transport
period
• The Norwegian Government contributes extra funding to these construction programmes equal to the amount collected from motorists
• Those in favour of driving appreciate the better road network as a result of paying tolls; those against private cars appreciate the principle of extra payment for those driving (Win-Win-Situation)
• As an environmentally friendly compromise 20% of the revenues are earmarked for public transport infrastructure projects. However, this was only accepted after the national Government intervened, threatening to stop national road- and rail infrastructure projects around Oslo.
• The charged fee is rather low and does not really hurt car users.
Figure 13: Oslo toll ring station (south-west-entrance) [Waersted 1998]
Future possibilities According to the original agreement, the charges have to be abolished in 2007, when all planned road construction projects will be paid for. However, it is currently discussed, to continue the pricing scheme in an even extended version, using it also for demand management in order to fight congestion and to guarantee easy access to the city centre.
The simplest way to do so would be to introduce much higher fees during peak periods. However, this is expected to meet high resistance based on the possible negative effects for retail businesses within the toll ring. Furthermore it is claimed that this pricing structure would merely hit employees having to reach their job at a certain time.
BESTUFS II – D 2.3 Best Practice Update 2007 / Part I 49 Road pricing and urban freight transport
Results and experiences
The system has been implemented without major problems and is running successfully just as scheduled. There has been little impact on overall traffic levels, but many new roads and public transport developments have been funded. It is estimated that charges would have to be 3 to 5 times higher, i.e. 6-10 EUR, in order to show any considerable effect on the use of private cars.
The initially low acceptance has been increasing slowly. According to opinion polls, one year before the introduction 70% of the city population was against the system. After one year of operation 64% were against, whereas today it is around 50%.
The Oslo toll ring experience shows
• that urban transport problems have to be urgent and funds for infrastructure projects have to be scarce for road pricing to be accepted
• that for a cordon pricing scheme the position of the cordon is crucial
• that national intervention can be necessary in order to overcome local decision problems
• Fees have to be rather high to have a considerable demand effect
• that road pricing schemes are difficult to alter once established
• that acceptance can be increased with a set of “carrot” measures, i.e. supporting measures such as public transport improvements, park&ride facilities, etc.
Additional recommendations from the Bergen toll ring
The company operating the Bergen toll ring gives the following additional recommendations: [www.brotunnel.no/index.htm]
1. Political and administrative consensus is vital
2. Involve opposing interest groups and build coalitions between them. Get agreements about how to use the money, give something to both sides
3. Present the project as a compromise, a balanced solution
4. Define and treat the scheme as a technical, environmental, financial problem, not as an extra tax
5. Illustrate the benefits: the project must be accompanied by advantages clearly visible to the users, both motorists and environmentalists
6. Something is better than nothing: Incremental approach, demonstration projects, pricing for improved capacity is more acceptable than pricing for demand management
7. Find your own way: There is much to be learned from existing projects, but general recommendations must be adjusted to suit local conditions (traffic conditions, political system, public opinion, etc.)
BESTUFS II – D 2.3 Best Practice Update 2007 / Part I 50 Road pricing and urban freight transport
More information Fjellinijen AS Pb 459 Sentrum 0105 Oslo [email protected]
www.fjellinjen.no
Member of BESTUFS who did the material collection: Daniel Firth, TFK
See also References and contact persons!
Figure 14: Automatic toll station Trondheim (http://www.progress-project.org/
BESTUFS II – D 2.3 Best Practice Update 2007 / Part I 51 Road pricing and urban freight transport
Example 3.4.2: London
Example 3.4.2: London city ‘congestion charging’29 (UK) [Rowe 2001; Turner 2001; Guttridge 2001; Zunder 2002, Petz 2007]
Key words Time-based, area pricing, demand management, Licence Plate Recognition
Background Congestion charging was introduced into central London in February 2003. It contributes directly to the achievement of four of the Mayor’s transport priorities:
• to reduce congestion;
• to make radical improvements to bus services;
• to improve journey time reliability for car users;
• to make the distribution of goods and services more efficient.
Central London suffered the worst congestion in the country. Traffic delays were increasing, costing people and businesses both time and money. Some of the city’s major roads carryed more traffic than some of the UK’s busiest motorways, creating traffic jams and causing stress an frustration to motorists, bus passengers, bikers, cyclists and pedestrians alike.
• Just over one Million people enter central London every morning (more than three quarters of these by public transport)
• Some 30'000 vehicles a day now use each major road in Greater London
• Nearly 2.8 Million vehicles were licensed to addresses in Greater London in 1999
• Car ownership in London is projected to rise by around 10% by 2001.
• Average time taken to travel to work by car is now 53 Minutes
• Average traffic speed in central London fell to below 10 mph for the first time since records began
These figures highlight the need to find a solution to the growing congestion problem in central London. Following lengthy consultation the Mayor of London, Ken Livingston, therefore proposed in 2001 his Transport Strategy for the capital which included - together with other measures - the so called “central London congestion charging scheme”. Currently, public consultation was ongoing. In 2002, the next stage was planned to be started, putting in place the technical, traffic and environmental management measures and
29 The pricing scheme was given this name officially by its developers as it is tackling congestion. However, ‘the
London congestion pricing scheme’ is not a congestion pricing scheme as it is referred to in the Glossary of this report, because it uses a flat rate instead of a rate varying with congestion.
BESTUFS II – D 2.3 Best Practice Update 2007 / Part I 52 Road pricing and urban freight transport
administrative elements. The earliest the scheme could start was 2003.
Objectives The priority of the proposed charging scheme was to reduce traffic congestion. In addition, all the revenues generated would be invested in transport in London for at least ten years.
Basic approach Since 2003 all drivers entering the London charging zone were initially charged £5 (approx. 7.50 Euro) a day to drive within the zone between 07.00 and 18.00, on Mondays to Fridays. This was increased to £8 (approx. 12 Euro) in 2005. There is no charge at weekends or on public holidays. Several exemptions and special tariffs are available for special transport vehicles.
The London congestion charging zone initially included the whole of the City of London (London’s financial district, and the West End (the city's main commercial and entertainment centre), with an area covered by the scheme of approximately 22 square kilometres. In February 2007 the original central London congestion charging zone was extended westwards, creating a single enlarged congestion charging zone. This extension approximately doubled the area of the London congestion charging zone (see Figure 15). Limiting charging to this core area makes sure that there are sufficient public transport alternatives available. Originally, it was proposed that goods vehicles should pay £15, but due to heavy opposition from the freight industry the charged was reduced to £5 (equally for all vehicles).
There are no tollbooths or barriers around the London congestion charging zone and no paper tickets or licences. Instead, drivers or vehicle operators pay to register their vehicle registration number on a database for journeys within the charging zone during charging hours for single or multiple charging days.
The vehicles are not required to display a licence in the London scheme. The registration numbers of these vehicles are entered into a database. The number plates of vehicles entering or moving within the central zone are observed by a network of 700 fixed and mobile cameras. Failure to pay the congestion charge or pay or register correctly for a discount results in a PCN of £100 (approximately 160 euros) being issued to the registered keeper of the vehicle as supplied by the DVLA.
BESTUFS II – D 2.3 Best Practice Update 2007 / Part I 53 Road pricing and urban freight transport
Figure 15: The central London Congestion Charging Scheme Area [TfL 2007]
A number of vehicles will be effectively exempted from the charge. These include emergency service vehicles (police, ambulance and fire brigade), London buses, licensed taxis, certain health service vehicles, boroughs operational vehicles, scheduled express and commuter coaches, alternative fuel cars and electrically propelled vehicles, disabled people, motorcycles and certain categories of military vehicles. Residents within the charging area will get a 90% discount which leaves them paying £130 (ca. 210 EUR) per year.
The UK government facilitated the introduction of urban road user charging through the Greater London Act and The Transport Act 2000 by giving powers to the London mayor and to local authorities outside London to introduce charging schemes.
The pricing scheme and the proposed fee level aim at modal shift. It is expected that 20'000 people will transfer from their cars to public transport, 5'000 to the tube and 15'000 to buses.
The set-up costs of the scheme are estimated circa 320 million Euro, 160 million for the infrastructure, and another 160 million for secondary measures around the central zone, redefining junctions, traffic lights, roundabouts, etc. 45 million EUR of that set-up money is being held back to fine-tune the system afterwards. Annual revenues are expected to be around 320 million Euro. With estimated operation costs of circa 80 million EUR this leaves net revenues of circa 240 million per year. By law, this has to be spent on improving London’s transport system for ten year from the start of the scheme. These projects target expanded rail capacity, new Thames Gateway river crossings, improved access to London’s town
BESTUFS II – D 2.3 Best Practice Update 2007 / Part I 54 Road pricing and urban freight transport
centres and improvements to London’s road system. Thus, the money from congestion charging will enable the necessary improvements in public transport in order to cope with the additional passengers.
Technical solution For enforcement purposes, Licence Plate Recognition (LPR) technology is used for checking all vehicles in the area using a network of cameras. One of the major reasons for choosing the LPR approach was that due to terrorist concerns the centre of London has been dotted with LPR systems carrying out security surveillance since the 90s. There will be 180 boundary points where roads cross into or out of the charging zone, some one way, some dual-lane. There will be cameras monitoring every boundary point and also spread throughout the zone (fixed and mobile) recognising every licence plate in the area. The licence plate number will be sent to a central computer where it is checked against the licence database. Those numbers that are not registered on the list will be kept until midnight. If the responsible party has still not paid by then, an £80 (130 EUR) penalty notice (reduced to £40 for early payment) is sent to the official registered keeper of the vehicle.
LPR was chosen for the scheme because it does not require any in-vehicle installations (e.g. OBU) such as smart card or GPS technology.
Supporting measures
The pricing scheme is to be accompanied by a wide range of measures designed to make public transport and other alternatives to car travel easier, cheaper, faster and more reliable. The Mayor is committed to making a real difference to public transport before starting congestion charging in 2003. Further measures include diversion routes, managing “knock-on effects” (e.g. traffic calming, parking measures), signing, improved enforcement of parking and loading restrictions and improved co-ordination of streetworks.
Future possibilities Ten authorities (in Greater Manchester; west Midlands, incorporating Birmingham, Wolverhampton and Coventry; east Midlands, in a joint bid by Leicester, Derby and Nottingham; Tyne and Wear; Durham; Bristol; Reading; Cambridgeshire; Shrewsbury and Norwich) expressed interest in road pricing and were provided with funding by central government in 2005 and 2006 from the newly established Transport Innovation Fund to consider road pricing schemes in greater detail. In 2007, the central government published a draft Bill updating the rules for local authorities who want to set up road pricing trials.
Results and experiences
A revised analysis of the operating costs and traffic benefits of the scheme has confirmed that the £5 charge resulted in net annual benefits of roundly £90 million.
• In financial year 2005/06 the scheme generated net revenues of £122M (provisional figures) including additional net income in the period from July 2005, when the basic daily charge was raised from £5 to £8.
BESTUFS II – D 2.3 Best Practice Update 2007 / Part I 55 Road pricing and urban freight transport
• These revenues have again been largely spent on improved bus services within London.
Traffic entering the central London charging zone during charging hours in 2006 was 21% lower than before charging in 2002 (vehicles with four or more wheels). Bus patronage has increased sharply since the scheme was introduced (passengers entering the central charging zone by bus increased by 37% during charging hours in the first year of the scheme).
Transport for London (TfL) has calculated that, comparing average congestion levels for 2006 against a pre-charging baseline in 2002, congestion was 8 percent lower in 2006. This compares with an average reduction of 30 percent in 2003, the first year of the scheme. It is thought that congestion levels were being negatively influenced by an increase in streetworks in the latter half of 2006.
It has also been estimated that the London congestion charging scheme directly leads to between 40 and 70 fewer personal injury road traffic accidents in the charging zone per year.
In the first three months of the western extension (February to April 2007), traffic entering the extension zone was down by between 10-15% against comparable pre-extension data. There is some evidence from recent counts that traffic entering the original central zone has increased by up to 4% since the introduction of the western extension. This may in part reflect an increase in discounted trips to and from the original central zone by western extension residents. The first comprehensive survey of congestion in the western extension zone gives a representative reduction of 20-25% over equivalent conditions before implementation, based on a night-time (uncongested) travel rate of 1.8 minutes per kilometre. Results from TfL research and an independent external audit of the TfL monitoring programme suggests that congestion charging has had a broadly neutral impact on overall business performance in the charging zone. However, some retailers and retail groups believe they have been adversely affected.
More information David Rowe; Service Development Manager, Transport for London
Julian Allen; University of Westminster, London
See also References and contact persons!
BESTUFS II – D 2.3 Best Practice Update 2007 / Part I 56 Road pricing and urban freight transport
Example 3.4.3: Rome
Example 3.4.3: Rome (Italy) [Tomassini 2001; Forestieri et al. 2000; PROGRESS 2002]
Key words Access control, cordon pricing, duration of stay charging, Optical Character Recognition, Licence Plate Recognition, On-Board Unit
Background In the last 35 years in the metropolitan area of Rome, there was a three fold leap in terms of kilometres travelled. This growth has not been matched by a parallel development of the public transport system. Consequently the public transport modal share has sharply decreased and today accounts only for one third of motorised trips. This mode split is further characterised by a large number of private vehicles (about 1'800'000) despite the general lack of parking spaces in the capital. To reverse this trend the municipality approved the Piano Generala del Traffico Urbano (General Urban Traffic Plan) which key elements are the updating of the road classification according to the relative function and the definition of transport demand wielding policies such as controlled access zones and parking pricing.
The history of access control in Rome began in 1989 when restrictions were placed on vehicle entrances to the historical centre. This so called Limited Traffic Zone (LTZ) covers about 5km2 and contains major historical monuments, a concentration of government, media and high profile offices, artisan working areas, highly priced residential areas and even a hospital (see Figure 16). Currently the area faces approx. 250'000 trips per day. The access restrictions were not enforced in a systematic way until 1994, when municipal police were used to block the entrances into the area. This manual enforcement of restrictions proved to be a difficult and inefficient process. Therefore the Rome administration has implemented the infrastructure for an automatic access control system that is currently being extended towards an electronic road pricing scheme.
Objectives The objectives of the access control system currently in transition towards road pricing are reduction of congestion and modal shift from private towards public transport.
BESTUFS II – D 2.3 Best Practice Update 2007 / Part I 57 Road pricing and urban freight transport
Figure 16: Limited Traffic Zone with 24 entry gates [Tomassini 2001]
Basic approach Access to the LTZ is restricted on weekdays from 06:30-18:00 and on Saturdays from 14:00-18:00. Permission to enter is given free of charge to residents (around 30'000 vehicles) within the ZTL. Other users may obtain permission to circulate and park in the area (approx. 90'000 vehicles) if they fall into certain categories such as freight lorries, doctors with offices in the centre, artisans, etc. Since 1998 these authorised non-residents are required to pay the equivalent of a 12 month public transport pass (340 Euro) in order to obtain an annual access permit. The over 400'000 (!) two wheelers can access the zone for free.
The access control system comprises 24 electronic entry gates able to effectuate without user intervention the identification and/or the applicable tariff for vehicle entrance into the restricted area (see Figure 16). The infrastructure installation will be completed by a series of approx. 29 exit gates (for time-duration charging in a later phase, see below).
Technical solution Technically the system includes different means for vehicle identification and authorisation depending on the user category and its differing needs. Residents and authorised individuals will primarily be identified trough the On-Board-Units (OBU) installed in their cars. The OBU guarantees a secure high-speed transaction with the roadside installations via microwave transponder and allows debiting fares automatically from an electronic purse inside the inserted smart card.30 In addition the OBU incorporates other user
30 This function will only be used in the second phase of the project (see below)
BESTUFS II – D 2.3 Best Practice Update 2007 / Part I 58 Road pricing and urban freight transport
needs. For instance, the unit can be activated for the existing electronic toll collection system on the national motorways (TELEPASS), for parking payment within Rome and ensure interoperability with other towns using the TELEPASS technology for access control. . 35'000 on-board units and smart cards have been distributed to residents and handicapped in 2001.
Figure 17: Smart cards and On-Board-Unit (OBU) [Tomassini 2001]
Those cars without OBU will be identified and controlled by the Optical Character Recognition (OCR) and Video Enforcement System SIRIO. The OCR image of the licence plate of these vehicles is analysed (Licence Plate recognition) and then compared with the local gate “white list” of authorised (i.e. paid for) plate numbers. Service and emergency vehicles will have their licence plate numbers directly incorporated into the white list, whereas the remaining categories such as tourists have to use a temporary permit procedure for authorisation which then updates with the white list of plate numbers. Privacy concerns are met by destroying any images of legally passing vehicles immediately after the white list check. Only the images of vehicles in violation are stored and used for fining the offender. For the Licence Plate Recognition system the entry gates are equipped with TV cameras and Infrared illuminators (see Figure 18)
BESTUFS II – D 2.3 Best Practice Update 2007 / Part I 59 Road pricing and urban freight transport
Figure 18: OCR equipment at the entrance gate [Tomassini 2001]
Institutional solution The new service management of the automatic access control came along with an organisational redefinition of roles and responsibilities. From the surveillance by urban policemen at the entrance gates enforcement transitioned to a new structure which relies on the identification of violations, remote confirmation of the validity of the violation and issuance of violations.
Supporting measures
The introduction of the new automatic access control system was accompanied by extensive awareness raising campaigns (see Figure 19).
For freight delivery in the ZTL there is a freight delivery reorganisation project including monitoring of the distribution process, loading/unloading reorganisation, incentive programme for promoting better loading factors and low emission vehicles, etc.
Future possibilities Within the PROGRESS project several road pricing scenarios were simulated and demonstrated. In a second stage (2002-2003) the incoming non-residents vehicles were charged per trip instead of the annual fee. In a third phase (2004-2005) charges were vary according to the duration of stay in the area (by use of exit gates).
BESTUFS II – D 2.3 Best Practice Update 2007 / Part I 60 Road pricing and urban freight transport
Figure 19: Example of dissemination material [Tomassini 2001]
Results and experiences
After the start of the automatic access control and enforcement system in August 2001 first experiences indicate that the system is performing with high reliability. The total flow of incoming traffic already decreased by 15% compared to the preceding year. However, there are still over 70'000 vehicles entering per day, 20% out of these illegally - on purpose or due to lack of knowledge.
The handling of special cases such as foreigners to the city, handicapped, etc. turned out to be a key issue for the success of such as system. Specifically the disabled management has proved to be one of the most difficult issues, as national laws require their free transit in any area, both when disabled individuals are in the vehicle and when somebody is dropping or picking them up.
The LZT being a historical town centre, the location and design of the entry and exit gates was a controversial topic. Several planned gate sites, which, based on traffic figures alone, would have otherwise been ideal for gate locations, were not implemented given the computer simulations of the
BESTUFS II – D 2.3 Best Practice Update 2007 / Part I 61 Road pricing and urban freight transport
potential visual impact.
Another key issue for designing the system was to get a clear picture of functional and technical requirements of the service operator. Nevertheless, the transition from the pilot project to the full scale project involved many refinements to the original technical system. The automatic identification of number plates process was improved, the possibility of falsifications of licence plate images were reduced and the general safety of the smart card system was enhanced.
At a local level, institutional aspects have been crucial. Despite the fact that access control had existed in Rome since 1989, converting these manual regulations into a full-scale automatic operation has proved to be a long and complicate process. This is in some ways surprising, given the fact that in Rome consensus exists on the need of access control, funds have been collected for the access permits before already and the basic rules existed previously. Those types of issues that many cities consider to be major obstacles have been handled before. But even under these relatively favourable conditions, the installation of such systems is not to be underestimated.
More information STA S.p.A. Rome Mobility Agency NAI - New Applications and Innovations Department Via Ostiense, 131/L I - 00154 Roma Tel: +39 06 57118216 Fax: +39 06 57118547 [email protected]
www.sta.roma.it
Elettronica Santerno S.p.A. (manufacturer of SIRIO system)
www.elettroniucasanterno.it
PROGRESS project
www.progress-project.org
See also References and contact persons!
BESTUFS II – D 2.3 Best Practice Update 2007 / Part I 62 Road pricing and urban freight transport
Example 3.4.4: Switzerland
Example 3.4.4: Heavy Vehicle Fee / LSVA (Switzerland) [Oehry 2001; Egger 2001; BTS 2000]
Key words Distant-related, electronically, area pricing, Heavy Goods Vehicles, On-Board Unit
Background On an average working day about 4’500 lorries drive through the Gotthard road tunnel crossing the Alps. In the valleys on the approaches north and south of the Gotthard noise and air pollution frequently exceeds the legal limits. On peak travelling days, traffic jams regularly form in front of the tunnel entrances. Following the general trend in the EU, also in Switzerland the transport performance of heavy goods traffic increased enormously in the last decades. For various reasons the railways became increasingly less able to compete with road transport. Still, in Switzerland the railways carry a far higher share of goods across the Alps than in Austria and France. Among other reasons this used to be partly due to the fact that in Switzerland vehicle weights were limited to 28 tons. However, after the agreement of the bilateral treaties with the European Union this weight limit is being extended to 34 tons and to 40 tons later on. Studies forecasted that this increase in weight limit would lead to a doubling of heavy goods traffic on the Swiss road network by 2015 if no measure were to be taken up.
Facing these problems, Swiss parliament drew a federal law that wanted to replace the since 1985 existing flat fee for Heavy Goods Vehicles (HGV) by a nation-wide distant-related fee, the LSVA (Leistungsabhängige Schwerver-kehrsabgabe). A referendum against the law was called. In the subsequent plebiscite on September 27, 1998, the Swiss people adopted the law with a large majority. Subsequently, the LSVA started on January 1st 2001.
Objectives The main reasons and basic principles for the introduction of the LSVA were:
• Internalisation of external cost of heavy vehicle traffic (principle of true costs)
• Shifting heavy vehicle traffic from road to rail and increasing the rail’s competitiveness
• Preventing the forecasted increase in heavy vehicles traffic
• Compensating for the increase in productivity due to the admission of 40-tons goods vehicles that became legal after the bilateral treaties with the European Union.
• Generating revenue for financing large-scale public transport projects, e.g. the New Alpine Rail Transversal (NEAT)
• Bringing the Swiss transit fee for crossing the Alps in line with the
BESTUFS II – D 2.3 Best Practice Update 2007 / Part I 63 Road pricing and urban freight transport
corresponding fees in France and Austria, thus avoiding distortion of competition and ecologically undesirable detours.
Basic approach The basic principles of the LSVA are that it is distant-related (driving more means paying more) and that empty vehicles cost as much as fully loaded ones. It is levied for HGV on all public roads, including both urban and non-urban roads.
The LSVA applies to all domestic and foreign heavy vehicles and trailers for goods or passenger transport with a max. laden weight in excess of 3.5 tons.
The LSVA is levied according to:
• number of kilometres driven on all public roads in Switzerland (km) • the maximum permissible laden weight (tons) • emission category of the heavy goods vehicle
This pricing structure aims at reducing overall transport distances and increasing vehicle capacity usage. As the levied fee depends on the emission category of the vehicle too, the LSVA will also influence the choice of vehicles towards environmentally friendlier solutions.
Passenger transport vehicles such as coaches, motor homes etc. are charged a time-related flat fee (no distance relation). There are special regulations for the transport of log, unpacked milk and livestock. Agricultural and public transport vehicles, ambulances and vehicles of the armed forces, police, etc. are completely exempted from the LSVA. In order to improve the competitiveness of intermodal transport pre- and end-haulage for intermodal transport are granted a flat rate refund compensating for the Heavy Vehicle Fee.
Around 54'000 domestic trucks and 30'000 trailers are affected by the fee. In addition, around 20’000 foreign trucks cross the Swiss border daily.
For 2008 the Federal Council will set new rates, taking into account technical developments.The following values are applicable (per ton-kilometre):
• Emission class Euro 0, 1 and 2: 3.07 Rp. (approx. 1.9 c.) • Emission class Euro 3: 2.66 Rp. (approx. 1.6 c.) • Emission class Euro 4, 5 and 6: 2.26 Rp. (approx. 1.4 c.)
Furthermore federal law states that the fee must not exceed infrastructure costs and external costs related to road transport. With the LSVA the transalpine route from Basel to Chiasso became approx. 6 times more expensive: from 17 EUR (before 2000) to 34 EUR (year 2000), 100 EUR (after 2001) and approx. 200 EUR (from 2008). The fee level is a result of both political negotiations and the calculations of external costs.
The revenues of the LSVA in 2006 were about 800 EUR per year. Two third of the net-revenue are earmarked for federal expenditures for large scale
BESTUFS II – D 2.3 Best Practice Update 2007 / Part I 64 Road pricing and urban freight transport
public transport projects (New Alpine Rail Transversal NEAT, Rail2000, TGV-connections, Noise reduction) and for uncovered costs related to road transport. This includes non budgeted road infrastructure costs as well as external costs. One third of the net-revenue is passed on to the cantons (regions), earmarked for (internal and external) costs related to road transport.
Figure 20: “TRIPON” On-Board Unit [Oehry 2001]
Technical solution The fee collection is based on the principle of self-declaration. The liable person (vehicle owner or driver) is obliged to actively participate. For domestic vehicles a On-Board-Unit (OBU) is mandatory (see Figure 20). Foreign vehicles basically are using a ticket fetched at self-service machines. The OBU records the required trip data automatically. The distance is recorded by the tachograph. A GPS sensor and a movement sensor provide a second, redundant measurement in order to make sure that the tachograph signal is not intentionally interrupted or falsified. A Dedicated Short Range Communication (DSRC) air-link is used to switch the recording of the kilometres on and off when crossing the border. Radio beacons are installed over the carriageways at the 82 border crossings concerned (see Figure 21).
Figure 21: Border crossings recorded with DSRC [Oehry 2001]
ZOLLDOUANEDOGANA
05 7 2 8 34
ChipcardReader
DSRC and GPSantenna
Keyboard
Tachograph
Display
Chipcard ReaderKeyboard
DSRC and GPS antenna
Display
Tachograph
BESTUFS II – D 2.3 Best Practice Update 2007 / Part I 65 Road pricing and urban freight transport
For foreign vehicles an ID-Card issued at the first entry provides for self-service on entry and simplifies the processes on exit. When entering the driver declares the relevant data (mileage reading, trailer status, payment mode) at the self-serving machines and receives a ticket. The whole declaration process takes less than 2 minutes.
Figure 22: Self serving machine and ID-Chip Card [Oehry 2001]
Domestic vehicles can drive for a long time within Switzerland without ever crossing the border where the correctness of their recorded data is checked. Therefore checks in the interior are indispensable in order to enforce a correct declaration. The checks do not influence the moving traffic as they are done via the DSCR air-link and by making use of the externally visible lamps of the OBU (see Figure 23). Vehicles with a wrong declaration, e.g. a missing trailer declaration, can be sued.
BESTUFS II – D 2.3 Best Practice Update 2007 / Part I 66 Road pricing and urban freight transport
Figure 23: LSVA On-Board-Unit from inside and outside the vehicle [Oehry 2001]
Institutional solution Domestic vehicle owners monthly declare the fee parameters (distances and weights) to the Swiss Customs Authority SCA. The SCA processes the data, determines the amount due, invoices the vehicle owner and collects the fee. Foreign vehicles declare their trip data when leaving Switzerland. The fee may be settled via a petrol card or via an account held with the SCA. Immediate cash payment is also possible.
Costs and revenues
The rather costly OBU (about 800 EUR each) are distributed free of charge to domestic and foreign vehicle owners until 2004. The installation costs of up to about 300 EUR have to be carried by the vehicle owner. Implementation costs were within the credit limit of 100 Million EUR, plus another 50 Million EUR for the free distribution of the OBU. Operations costs are only 4-6 % of revenues which is very low compared to the usual figures of around 20%. Revenues are estimated to reach around 900 Million EUR in 2008. So far, over 45'000 OBUs have been installed, mainly in domestic vehicles.
Supporting measures
The LSVA replaced the existing annual flat fee. It is one component in a whole package of measures that aim at strengthening the position of the railways. Other measures include the new transalpine rail tunnels through the Gotthard and Lötschberg and a rail reform that aims at improving the railway’s productivity and competitiveness. Additionally the parliament approved the so called “Transfer law” that grants additional funds to promote rail transport. Furthermore, unaccompanied combined road/rail transport is encouraged by a flat-rate refund per journey that offsets more or less the average LSVA-costs.
BESTUFS II – D 2.3 Best Practice Update 2007 / Part I 67 Road pricing and urban freight transport
Results and experiences
The LSVA works. Economically it is very efficient as operation costs account only for 4-6% of the revenues. The effects of the LSVA are currently being evaluated. First results indicate that the LSVA shows the desired effects, but on a rather low level: 6.5% less lorries have been counted on Swiss roads (2005 compared to 2000). This reduction is attributed to an increase in transport efficiency that is either triggered by the LSVA (restructuring of logistics operations and route planning, higher capacity utilisation) or the increase of the max. weight limit from 28 tons to 34 tons. Various transport operators have optimised their operations or switched to less polluting vehicles. Investments in heavy lorries have increased by 45%. The fear that the LSVA would make transport operators switch to small delivery vans that are exempted from the fee did not come true. Swiss Railways could increase their national freight transport performance by almost 15%. Transit traffic did increase but to a lesser extent than feared.
In the propaganda phase preceding the public vote there was a strong majority of transport operators opposing the project, well organised by the Swiss association of road transport operators ASTAG. A silent minority recognised the chances. After the public vote the LSVA is very well accepted. After the introduction, the Swiss Association of road transport operators ASTAG seized the occasion to adapt their price recommendations. Thus the fee is generally being passed on to the customers. Sometimes it is abused in the sense that the LSVA serves as an excuse to increase prices over-proportionally (known case of a paint pot that would have travelled twice around the world if the stated price increase would really be due to the LSVA). For the transport operators part of the cost increase was offset by the increase in productivity as a consequence of the max. weight limit increase. The LSVA triggered a number of innovations in the transport and logistics sector, from the renewal of whole vehicle fleets to the increased use of intermodal transport.
The following key factors have been decisive for the LSVA’s success:
• The project could build up on an existing organisation, the Swiss Customs Authority
• A lot could be learned and improved in tests and field trials
• For public acceptance it was important that the project had been legitimated by the public vote (i.e. heavily attacked before, but democratically accepted afterwards)
From the LSVA experiences the following general conclusions for electronic road pricing schemes can be drawn:
• Demand management trough pricing measures works (although high charges are needed to produce considerable effects)
• The impacts are not fully predictable (the market will adapt to pressure, but possible reactions are manifold)
BESTUFS II – D 2.3 Best Practice Update 2007 / Part I 68 Road pricing and urban freight transport
• Processes come before technology: technical solutions have to follow the problem not vice-versa
• Its the procedures for the non-equipped, badly informed user that decide whether a system works or not.
More information Bernhard Oehry Head of Traffic Telematics RAPP AG Hochstrasse 100 CH - 4018 Basel Tel: +41 61 335 77 77 Fax: +41 61 335 77 00 [email protected]
Bundesamt für Raumentwicklung Verkehrskoordination Kochergasse 10 CH - 3003 Bern
www.are.admin.ch
Member of BESTUFS who did the material collection: Dieter Egger, RAPP AG
See also References and contact persons!
BESTUFS II – D 2.3 Best Practice Update 2007 / Part I 69 Road pricing and urban freight transport
Example 3.4.5: The Netherlands
Example 3.4.5: Kilometerheffing (The Netherlands) [Quispel 2001; Kleijn 2001]
Key words (Complex) area pricing, nation-wide, GPS, GIS, On-Board Unit, data privacy
Framework conditions
Since 1990 the Dutch Ministry of Transport is trying to introduce road pricing in the Netherlands. The permit based project Spitsvignet was followed by the Rekeningrijden project (later called Spitstarief), a cordon pricing scheme for the major Dutch cities (see Annex, project NL-01). In 1999 there were even technical tests carried out, but the support for the system deteriorated quickly. The system was being seen as unfair and resulting in too much problems with detouring traffic avoiding the fee collection points. The technology and methodology was seen as superseded after an independent ICT expert showed in a study that it is feasible to introduce a kilometre based road pricing system within a time span of 5 years (2001-2006) with the current ICT systems in place (e.g. GSM / GPS) and that the privacy problems could be overcome. This was the start for the Kilometerheffing project that is planned to be starting in 2004 and to be fully implemented in 2006.
Objectives The Kilomterheffing pricing schemes aims at establishing a more fair tax system (user pays principle), improving environment and road safety and reducing congestion by means of demand management.
Basic approach The Kilometerheffing (KMH) is a distance related road pricing scheme based on all roads in the whole of The Netherlands. In the first stage a flat-rate km based tariff will be introduced. After 2006 differentiation to time and place is foreseen. Therefore the design of the flat-rate system already has to be capable to handle differentiated tariffs by time and place of usage.
The revenues of the KMH will be fed into the public funds. Fixed taxes (registration tax, Eurovignette, fuel tax and taxes on new vehicles) will be decreased or abolished and will be processed into a variable km-based tariff. Because the revenues of all fixed taxes all are added to the public funds, it is not foreseen that this situation will change. Furthermore, the Ministry assumes budget neutrality for at least the group of private car users. Therefore it is expected that no major additional revenues will result from the KMH. The fee is aiming at tax pressure neutrality for the average car user. When driving below 18,000 km per year one will have less tax to pay, if one drives more than 18,000 km per year the tax pressure increases compared to the current situation.
BESTUFS II – D 2.3 Best Practice Update 2007 / Part I 70 Road pricing and urban freight transport
Technical solution It is foreseen to mandatory equip all motor-vehicles in the country with On-Board Units. The OBU does have communication functions (DSRC/GSM/GPRS), locating functions (GPS), a SIM card, a digital map (GIS), memory and a calculation function. The OBU (called Mobimeter) can calculate the road usage costs itself by having a real-time classification of road types to tariff classes (see Figure 24). This information (numbers of kilometres driven per road type or tariff class respectively) is sent periodically (each 1000 km) to a service provider who passes the information to the Ministry of Finance where the bills will be composed. In this way the position and time of road usage doesn’t have to be known and so the privacy of the driver is ensured. Furthermore the OBU should be able to communicate with road side equipment (DSRC) for subjection to automatic enforcement systems working with IR/OCR. It is possible to link additional services to the OBU like route navigation, traffic information, road conditions, parking information, entertainment, etc. The standard costs of an OBU will be about 125 EUR (not included installation costs and VAT). The government will be paying for the OBUs and installation costs. In 2003 the mass production of the On-Board Units is planned.
Figure 24: Vehicle position (GPS) is linked to road type and tariff (GIS) [Kleijn 2001]
BESTUFS II – D 2.3 Best Practice Update 2007 / Part I 71 Road pricing and urban freight transport
Institutional solution The system affects both freight transport and passenger transport. However, currently the legal basis for charging HGV (vehicles over 12 tons GVW) on all roads is not in place. A revision of the European law is required first but this is already announced by European Commission DG TREN. The institutional model is most likely to be a public-private one. Commercial service providers will be used to take care of communication and to disseminate information about actual tariffs; they can collect information that is sent out from the OBUs periodically and they will offer additional services to the users.
Future plans It was planned to extend the system towards a complex pricing scheme differentiating tariffs according to place and time (after 2006). However, for this system there was lack of acceptance and the plans were postponed. By the end of 2005 the government has decided to postpone the introduction of the system because of the high costs. The text below covers the original plans.
Results and experiences
The distance related road pricing scheme is seen as being fair because it is based on “the user/polluter pays principle”. There is no negative effect of income distribution. Therefore the acceptance of the system is in principle high. Initially the privacy of the driver was seen as a potential bottleneck but this will be solved by having a OBU than can make all the calculations itself and thus doesn’t have to communicate privacy sensitive information to others. However, the effectiveness of the flat-rate system is not clear to all stakeholders and therefore there are still some discussion about the ex ante success estimations. Furthermore due to the flat-rate some regions with low infrastructure agitate because they fear paying more than their share for the infrastructure in The Netherlands as a whole. This might be a discussion point in upcoming discussion in the Cabinet and the Parliament.
The transport operators agree with the introduction of the km-based road pricing system; however they will offer resistance if their tax pressure is increased and if there is some kind of unequal treatment of other (foreign) road users or transport modes. The impact on urban freight transport can not be estimated yet. With differentiation to time and place (planned after 2006), there could be a very substantial improvement of urban freight transport operations.
More information www.roadpricing.nl (in English) www.projectkilometerheffing.nl (in Dutch) Member of BESTUFS who did the material collection: NEA
See also References and contact persons!
BESTUFS II – D 2.3 Best Practice Update 2007 / Part I 72 Road pricing and urban freight transport
Example 3.4.6: France
Example 3.4.6: Péripherique Nord de Lyon (France) [Dablanc 2001]
Key words single road pricing, financing infrastructure, public protests, communication
Framework conditions and objectives
The Péripherique Nord de Lyon has been the first example of road pricing in the Lyon area, where over 2.3 million car trips are made every day. It consists of several tunnels and a bridge (viaduct) which are part of the northern ring of the city of Lyon (see Figure 25). The main reason for building the Péripherique in 1996 was the increasing congestion in the city and the related difficulties for east-west transit in Lyon. The Péripherique saves the road users a remarkable amount of time and relieves the city centre from transit traffic. Today, around 150'000 vehicles use the Péripherique every day, around 45 millions per year.
Figure 25: Péripherique Nord de Lyon [www.peripheriquenord.com]
Basic approach In order to finance the construction and operation of this large infrastructure, a toll is levied around the clock from every motorcar or lorry passing. Around one year after its inauguration the tunnel was closed in 1997-1998 due to legal problems and one summer of heavy public protest. These protests led to a reduction of the fees, two stretches turned back to free of charge use
Péripherique Nord
BESTUFS II – D 2.3 Best Practice Update 2007 / Part I 73 Road pricing and urban freight transport
and alternative local roads were re-enlarged again, after their capacity had been reduced in order to make people use the toll-road. Today the operating company is promoting their scheme by highlighting the time savings, the reliable journey time and the convenience of the passage.
Technical solution The Péripherique has got 7 access points where payment is made either manually or automatically using the SmartCard based, contactless télépéage system (see Figure 26).
After the reduction of the fees as a consequence of public protests, a single passage currently costs 1.5 EUR for cars, 2.7 EUR for vans, light trucks and buses, 4.6 EUR for trucks with 6 wheels, 6 EUR for trucks with 8 wheels and 7.6 EUR for larger trucks. A “tunnel pass” provides slightly lower fees.
The revenue goes directly to the operating company for operating costs and to the Urban Community.
Figure 26: Promoting the télépéage system [www.peripheriquenord.com]
Institutional solution The Urban Community of Lyon had launched a bid for the construction and operation of the périphérique Nord. A private investor (Société Conces-sionnaire du Boulevard Périphérique Nord de Lyon) had won the bid and ran the tunnels and the bridge during the first year of implementation based on a PPP contract (concession). Since the temporary closing of the tunnel after the protests in 1997 it is now being operated by a public owned company after the community of Lyon bought back the tunnel. The operating company is responsible for security, traffic management, fee collection, marketing and
BESTUFS II – D 2.3 Best Practice Update 2007 / Part I 74 Road pricing and urban freight transport
maintenance, whereas the owning community of Lyon administers the revenues, fixes the marketing and pricing strategy and supervises all operations.
Results and experiences
The Péripherique Nord de Lyon proved effective and practicable. After initial protests and a subsequent reduction of the levied fees the pricing scheme has finally been accepted. Initial communication was poor and is supposed to account for part of the acceptance problems.
There has been no study on the impact on urban freight transport. The tunnel has probably eased traffic conditions for trucks on local surface roads, but this remains to be looked at precisely.
More information Director Péripherique Nord de Lyon Chemin de la Belle Cordière BP 177 69643 Caluire cedex Tel. +33 4 72 27 44 44
www.peripheriquenord.com (in French)
Member of BESTUFS who did the material collection: Laetitia Dablanc, INRETS
See also References and contact persons!
BESTUFS II – D 2.3 Best Practice Update 2007 / Part I 75 Road pricing and urban freight transport
Example 3.4.6: France
Example 3.4.7: Stockholm Congestion Charge, Sweden
[Karrer 2007]
Key words congestion charge, city access charge,
Framework conditions and objectives
The Stockholm congestion charge is a traffic congestion and environmental tax that has been imposed on the majority of vehicles in Stockholm; it is the second of its kind to be introduced in Europe following the London Congestion Charge. The aims of the charge are: To reduce traffic at rush hours by 10- 15% to and from the inner city zone; a better level of service in Stockholm traffic; to reduce emissions of carbon dioxide, nitric oxide and particulate matter; improved quality of living for city inhabitants; more resources for public transport.
The Stockholm congestion charge was first introduced as a trial between 3 January 2006 and 31 July 2006. A referendum on the future of the congestion charge was held in September 2006; the residents of Stockholm municipality voted yes, and 14 other municipalities voted no to implement it permanently.
On August 1st 2007 the Stockholm congestion charge was introduced permanently. The incomes from the reintroduced congestion charges in Stockholm are to be used in partly financing a new bypass road, 'Förbifart Stockholm'.
Figure 27: Stockholm congestion charge area
BESTUFS II – D 2.3 Best Practice Update 2007 / Part I 76 Road pricing and urban freight transport
Basic approach The congestion charge area includes the whole of the Stockholm city centre areas such as Södermalm, Norrmalm, Östermalm, Vasastaden, Kungsholmen, Stora Essingen, Lilla Essingen and Djurgården. There are 18 unmanned electronic payment stations at all entrances to this area (this is helped by the fact that Stockholm was built on a series of islands). The congestion tax is applied to vehicles on both entry and exit of the affected area. The payment gates are equipped with number plate recognition cameras to record the identity of vehicles passing through. Over 400,000 drivers in Stockholm have already equipped their cars with a transponder for easy payment and can pay automatically by Autogiro directly from their bank account.
Exemptions to the charge include emergency vehicles, buses, diplomatic vehicles, disabled persons vehicles, military vehicles, hybrid or electric cars, motorcycles and mopeds, and foreign-registered vehicles. The Essingeleden motorway (E4) that passes through the effected area is also exempt, due to it being the main road when travelling past central Stockholm. All exits and entrances of Essingeleden that are within the congestion tax area have payment stations placed at them.
Figure 28: One of 18 electronic payment gates
Technical solution IBM built the on-demand solution using wireless RFID technology supplied by Norwegian company Q-Free, one of the leading suppliers of technology for road charging systems. The system works by using a Q-Free on-board unit and road side technology in combination with an operational system provided and run by IBM.
BESTUFS II – D 2.3 Best Practice Update 2007 / Part I 77 Road pricing and urban freight transport
Payment is via a number of channels including by direct debit triggered by the recognition of the on-board electronic tag that is loaned to drivers. Q-Free cameras can also detect and record car number plate images using Automated Number Plate Recognition (ANPR) software to identify those vehicles without tags, and are also used to verify tag readings and provide evidence to support the enforcement of non-payers.
The use of the transponders fitted in vehicles means the system has a more reliable capture rate and a more cost-effective back-room operation than congestion charging systems that do not use such devices. It also makes it far easier to operate variable charging with automated direct debit after the passage.
Institutional solution The Vägverket (Swedish Road Administration) is the body responsible for the administration of the charge and its systems, while IBM was involved as prime contractor responsible for solution design, development and operation.
Figure 29: On board unit including RFID transponder
Results and experiences
The 2006 trial showed the following effects on traffic:
• 20-25 percent less cars on congestion cordon • 14 percent less mileage in charged area • 1 percent less mileage outside charged area • 30 –50 percent travel time decrease • Travel time variation decrease
Effects on further issues: • Estimated reductionof personal injuryaccidentsof 5 -10 % within the
congestion charging zone • CO2 -14%; NOx -7%; PM10 -9% • Neglectible effect on noise • Minor effects on retail turnover: Department stores, malls and
shopping centres trade increased by 7 % in city (+ 7 % national); Small-scaleshops sales -6% (trend)
BESTUFS II – D 2.3 Best Practice Update 2007 / Part I 78 Road pricing and urban freight transport
Financial information:
Netgain EUR 77 millions/year
Expansion of bus traffic: Benefits EUR 18 millions/year and operating costs of EUR 52 millions/year
The evaluation of the first permanent operation month – August 2007 – showed similar effects as the trial. In 2006.
More information www.stockholmsforsoket.se
www.vv.se
See also References and contact persons!
BESTUFS II – D 2.3 Best Practice Update 2007 / Part I 79 Road pricing and urban freight transport
3.5 From theory to practice
A promising theory The reviewed examples show that demand management and financing infrastructure through pricing measures can work. Obviously, transport demand and transport decisions are somehow linked to prices, and pricing approaches therefore offer a high potential for improving the transport situation in Europe as it is suggested by the European Commission [2001]. As long as transport prices and taxes are structured in a way that the individual traveller faces mostly fixed costs when travelling by private car whereas he faces mostly variable costs when travelling by public transport, the incentives for shifting modes will never be given. But however compelling the theoretical concept may be, its implementation into the real world comes along with various problems. Without entering into a basic discussion on road pricing we want to highlight some of these problems with respect to the given examples.
Implementation barriers
The concept of social marginal cost pricing we referred to is a theoretical concept for the efficient allocation of resources. The real world is far more complex than the theoretical model and nobody seriously aims at implementing it at a 1:1 scale [Howes 2001]. Still, this does not prove it wrong, nor does it mean that it is useless in improving the current situation. Social marginal cost pricing is a theoretical ideal - but that applies for nearly all economic theories.
Level of charges: the normative power of political reality
The level of applied charges illustrates this normative power of political reality very well. The currently levied charges reflect political negotiations or public acceptance polls rather than economic cost calculations.
Practical schemes have been driven by political reality [Major 2001]. Consequently passenger transport is at the forefront as the majority of voters are private car users (see below).
Price is only one decision factor
On the other hand, the examples show that fees have to be rather high to have a considerable demand effect. We have to be aware that the price is only one - although an important one - among a bundle of decision factors for modal and route choice. Other important factors include comfort, reliability, punctuality, flexibility, security, duration of the trip etc. Estimations for the examples of Oslo and London suggest that urban road charges would have to be in the order of about 12 EUR to show any considerable effect on the use of private cars.
Tricky external cost calculation
Another reason for the rather political determination are the practical problems economists face when calculating external costs of urban transport. Some approaches are heavily debated as there are many uncertainties. Consequently estimates for shadow prices for externalities can differ more than 100%. On the other hand, determining the fee level
BESTUFS II – D 2.3 Best Practice Update 2007 / Part I 80 Road pricing and urban freight transport
politically implies the possibility of pricing being abused in an economically arbitrary way. This is the case if the (total) charges levied are not related to costs anymore. Prices should reflect true costs (internal plus external ones) and be a function of supply and demand rather than of political tug-of-wars. Otherwise they will still distort market mechanism (as almost all taxes do).
Various trade-offs in the real world
As “there is no free lunch” in the real world the implementation of road pricing comes along with various trade-offs illustrated by the assessment triangle (see Figure 4). Certain forms of road pricing are easier to implement than others that are more sophisticated or more effective. The complexity of the system and the technology chosen are important factors, but even more important is public acceptance and - related to it - whether the legal powers are in place [ITS 2002]. And the most cost-effective solution could also be a very simple one.
Acceptance: the main barrier
The main barrier to road pricing is acceptance, including the general willingness to pay for something that used to be free of (direct) charges, but also data privacy and other concerns.31 The Oslo experience showed that urban transport problems have to be urgent for road pricing to be accepted. Although it is the main barrier to road pricing, acceptance is often neglected in favour of enforcement. Enforcement is obviously necessary, but a high level of acceptance and societal consensus makes enforcement much easier (comparable to the majority of public transport users that considers fare dodgers unfair). Obviously, the use of the revenues is crucial for the acceptance of a road pricing scheme.
Practicability: the least resistance
The technical feasibility is largely given, although there remain problems to be solved, e.g. concerning interoperability, performance capacity, etc. There are many different technologies available whose suitability depends largely on the specific case conditions. Because technology is abundant and because the technical problems offer the least resistance, road pricing schemes are likely to be over-sophisticated - neglecting the human factor. Sophisticated systems are complicated to understand and the decisive test for every system is the occasional user who is not informed. The Swiss experience with the Heavy Vehicles Fee (LSVA) showed a main factor of success: technical solutions have to follow the problem - not vice-versa.
Effectiveness and efficiency: not everything feasible is optimal
When implementing road pricing schemes one of the main trade-offs is between economic efficient allocation, i.e. effectiveness, and operational efficiency. The closer we want to get to the theoretical ideal of social marginal cost pricing (i.e. pricing highly differentiated according to time, place, level of congestion, etc) the more complicated, more high-tech, more expensive, more complex and less transparent the system will get (what affects acceptance again). This raises the justified question whether simple solutions such as fuel taxes, emission related vehicle taxes, paper licences, etc. are not neglected in favour of fancy high-tech solutions? Not everything technically feasible is suitable. A fuel tax is surely not as effective,
31 The PRIMA project provides extensive studies on road pricing acceptance issues. See chapter 3.2.
BESTUFS II – D 2.3 Best Practice Update 2007 / Part I 81 Road pricing and urban freight transport
differentiated and fine tuned as for instance a complex area pricing scheme, but it is far easier instead and might therefore be a more cost-effective second best solution.32
Limited transferability
The experiences that have been described above will hopefully be of help for many other projects. Nevertheless, they should be transferred with caution. Every market is behaving differently due to changing local framework conditions. The Swiss experience has shown that the market does adapt to price pressure but that possible reactions are manifold and hard to predict. Local circumstances are particularly important when it comes to acceptance issues. Apart from the local and national general fiscal situation even the local history of politics and taxation can be of influence. The success of any particular road pricing measure is determined by a huge variety of factors, ranging from the availability of public transport alternatives to the spending of the revenues. In fact, the targeted transport patterns of road pricing schemes can even be contradictory: for demand management purposes the pricing measures will aim at high elasticity transports in order to achieve a maximum shift, whereas for financing they will target low elasticity transports in order to maximise revenues. Therefore, one must be very careful when transferring results and comparing situations.
3.6 Specific considerations for urban freight transport
Freight sadly neglected in urban road pricing research
In the context of this Best Practice Handbook we cannot enter any further into the surely interesting discussions about urban road pricing as a general concept. Rather we would like to consider some specific aspects of urban road pricing with particular regards to urban freight transport. This seems even more appropriate as most urban road pricing projects consider mainly passenger transport.33 Freight transport is a rather marginal object of urban road pricing research.34 For a general discussion of (urban) road pricing issues, the reports of the various research projects mentioned in Chapter 3.2 provide extensive information.
32 A theoretical study for the City of Zurich (Switzerland) has evaluated 10 different transport measures, among
other a sharply higher fuel tax, area licensing, parking restrictions, etc and found the fuel tax to be by far the most cost-effective [Maibach et al. 1993]
33 Freight transport is only considered collaterally. There are at least two reasons for this: First, private car traffic usually accounts for the largest share of urban transport with respect to the number of vehicles or kilometres driven. Second, political acceptance is one of the main issues of current road pricing research and private car users form the largest stakeholder group (majority of voters).
34 This finding from the present material collection is supported by a number of other studies, e.g. a study from the Berkeley University of California that has “identified two areas where previous research especially lacked: the impact of road pricing on commercial vehicle operations, and on transit operations.” [Hong et al. 1996]
BESTUFS II – D 2.3 Best Practice Update 2007 / Part I 82 Road pricing and urban freight transport
Highlighting some freight specific aspects
As the BESTUFS workshop on the topic showed, one of the most controversial questions is the potential impact of road pricing on urban freight transport. Therefore, the considerations below focus on the direct impact (charged fee, induced behavioural change) as well as the indirect impact (fiercer competition, better road access) of road pricing.
Pricing mechanism and rational decisions
Road pricing could be particularly effective for freight transport because commercial transport operators, rather than private car users, tend to make their transport decisions based on rational economic considerations (no cost illusion). By charging different fees according to time, distance, vehicle weight, size or even vehicle capacity utilisation, road pricing can influence the logistics and transport strategies of shippers and logistics service providers as well as the transport operators’ choice regarding fleet capacity, fleet mix and fleet activity, in other words, the whole freight transport system. However, reality could be different: small one man companies or family businesses might be far from the rationale of economic decision making. Furthermore we have to be aware that also for commercial transport operators price is just one argument among a number of decision factors such as regular availability, reliability, punctuality, flexibility, security, duration of the trip etc. [Ruesch et al. 2000]. However, by reducing overall traffic road pricing can potentially influence these factors indirectly too.
When analysing freight transport decision processes, two decision levels have to be distinguished: the rather long-term strategic level and the rather short-term operational level. The strategic level includes basic decisions on supply-, production- and distribution concepts, location policies, storage concepts etc. and is mainly influenced by shippers and logistics service providers. Mere transport companies have less influence on these decisions. However, as the distinction is not always obvious, shippers and logistics service providers are always included when talking about transport operators in the following.
Direct impact: elasticity of demand and availability of alternatives
For a pricing measure to have large effects it should be applied to goods that have a high price elasticity of demand.35 The price elasticity of demand depends among other things on the availability of equally good alternatives.36 While for passenger transport a public transport alternative usually exists in major cities, a shift towards this transport system can be promoted by road pricing for cars.37 Additionally, the trip planning of private
35 Note that the opposite is true for pricing measures aiming at the generation of revenues (financing). Here, high
elasticity of demand would lead to less demand for the charged good and thus decreasing revenues. 36 Considering this, it is not astonishing, that a reasonable public transport system is often found decisive for the
acceptance of road pricing by the public. 37 Not only does the use of roads become more expensive when introducing road pricing. When road pricing is
introduced in exchange for existing flat taxes, fixed costs for car owners become variable costs (e.g. kilometre based) which stimulates again the use of public transport (less opportunity costs of the car parked in the garage). [Kleijn 2001]
BESTUFS II – D 2.3 Best Practice Update 2007 / Part I 83 Road pricing and urban freight transport
car users in terms of time and route chosen can be influenced in order to equalise peak hours. [Huschebeck 2001] For urban freight transport the situation is different: there is no public transport or other efficient modes of transport.38 Furthermore, freight transport is probably less flexible in planning its trips than private car users are, at least in the short run. Urban freight transport business faces “obligatory delivery in the morning hours” [PATS, D3, 75] and “access time restrictions for the inner cities or due to logistical considerations” [Huschebeck 2001]. However, other transport experts believe just the opposite. According to Bjornstad [2001] “people going to and from work have fewer possibilities to change their way and time for travelling than freight transport”.
Short run effects However, even in the short run there are probably alternatives in the form of flexibility. Pricing measures could induce a more efficient use of delivery infrastructures and a reconsidering of trip planning and transport patterns, enhancing bundling of consignments and improving the efficiency of the transport business. Charges according to vehicle weight, size and emission could influence the vehicle fleet mix. If this effect will take place and to which extent is heavily disputed and depends on the existing efficiency, the cost structure and decision variables of each transport operator. Those innovative transport companies that have already attained their maximum efficiency level due to the already high competition cannot improve any further. For many others, pricing might be an incentive for optimising their business. For example, this was experienced after the introduction of the Swiss Heavy Vehicle Fee (LSVA) which was not the sole reason for changing business operations, but which was a trigger for innovations up to the complete renewal of whole vehicle fleets.
Price level and the business’ cost structure
It is also argued that road pricing will have no direct substantial effect on urban freight transport because in several cases the charged fees are too marginal to really influence the decision making of the transport company. [Quispel 2001] According to Mr. Guttridge from the British Freight Transport Association, labour costs are that much higher than (other) transport costs that even when you double it, nothing would change in the behaviour. [Guttridge 2001]
Long run effects Apart from the controversial instant effects, transport operators (including shippers and logistics service providers) have more flexibility of choice in the long run. Transport prices increased by road pricing can influence logistics strategies of shippers and logistics service providers (supply, production, distribution, location, storage). Again it must be considered however, that looking at the costs of logistics structures of large business sectors with e.g. a central depot for whole Europe, the pure transport costs are just about 2% of the total product costs. Under these conditions a small fee has no
38 An exception could be courier transport for letters and small parcels by bike, as it is already common - and
more efficient - in Copenhagen [Holm 2001] or the Cargo Tram in Dresden.
BESTUFS II – D 2.3 Best Practice Update 2007 / Part I 84 Road pricing and urban freight transport
structural effects. [Wild 2001] Additionally, urban road pricing can only influence one part of the whole transport chain, namely pick-up and distribution concepts (although distribution costs account for a large part of transport costs).
Furthermore, in the long run road pricing might have even more important effects. If the transport business passes on the charges to its customers, the higher transport prices will eventually induce less demand for freight transport (depending on the retailer’s price elasticity of demand). Shop owners might change their logistics and order less frequently39 or manufacturers could return to larger stocks. The process of the freight operators passing on the charges to their clients is controversial. Experiences with the Swiss Heavy Vehicle Fee (LSVA) indicate however that new charges are passed on sooner or later, sometimes even exceedingly.40
If the higher transport prices are passed on to the final consumer, the issue gets even more complex. On the one hand transport intensive, frequently delivered goods (e.g. fish) might get relatively more expensive compared to stocked goods (e.g. cans). On the other hand a price gap could open between urban areas with road pricing schemes and those without which could affect the economic competitiveness of the priced area. The introduction of a road pricing scheme may encourage final consumers who currently drive into the urban area to purchase their goods to shop or spend their leisure time elsewhere, e.g. at out-of-town-shops. It could also have a similar effect on where companies choose to locate their business. In this way, road pricing could result in changes in land use patterns (as businesses choose locations outside the charging zone) and this would lead to changes in goods flows in urban areas. It could therefore alter the locations that goods need to be delivered to. Nevertheless, results from Transport for London research and an independent external audit of the TfL monitoring programme suggests that the London congestion charging has had a broadly neutral impact on overall business performance in the charging zone.
In general, road pricing might have a positive effect on logistic strategies by cutting or at least cushioning the current trend towards ever decreasing consignment sizes and more frequent deliveries. On the other hand it could even trigger the exodus of shops and businesses out of the priced city centre. The extent to which land use and goods flow patterns change as a result of road pricing are likely to be closely linked to the amount charged in the road pricing scheme and the improvements to the urban area and public
39 Just as it is observed with home delivered products shopped on-line: If delivery costs are 1 Euro per delivery
customers will order once a day, whereas they order once a week if delivery costs 10 Euro; see Best practice Handbook Year 2 (2001)
40 After the introduction of the Heavy Vehicle Fee many transport operators, retailers and manufacturers increased their prices with reference to the additional costs. In single cases, the price increase was even abusive.
BESTUFS II – D 2.3 Best Practice Update 2007 / Part I 85 Road pricing and urban freight transport
transport system that are introduced with the road pricing system. Considering the currently applied and in comparison to overall product costs rather low road pricing fees these effects might well be marginal.
A net benefit for freight transport business?
Not everyone is expected to directly benefit from the introduction of urban road pricing - although (at least in theory) “the revenue generated from urban road charging would, depending on how it is used, enable everybody to benefit” [ITS Leeds 2001]. It is often argued that urban freight transport would be one of the beneficiaries of urban road pricing. According to the PATS project “it can be concluded with confidence that road user charges would undoubtedly be beneficial for urban freight transport and taxi and probably also for most business travellers” [PATS, D5, final report, 42]. The Institutes for Transport Studies, University of Leeds, sees large scale freight and commercial traffic as one of the “Winners” of urban road pricing. [ITS 2001] The basic rationale behind this statement are manifold:
• Competition effect: fairer competition thanks to differentiated charging according to time and length of the trip; Road pricing harmonises competition as it makes all transport operators participate on the costs of the road usage including foreign vehicles or vehicles from other regions.
• Financing effect: If the revenues generated are spent on road infrastructure, efficiency of road transport business increases.
• Demand effect: The time value of business trips is generally higher than that of private trips. Therefore the elasticity of demand is higher for private car trips. Thus, road pricing will reduce or shift road usage by private cars, reducing congestion and increasing the efficiency of the remaining high value (commercial) trips. Freight transport today is concentrated in a few peak hours during the day which overlap to a large extent with the peak hours of private car traffic. Road pricing could be a good way for using the roads more efficiently through a different spread of transport activities. [Ruberti 2001] This efficiency gain is supposed to be higher than the fee paid resulting in a net benefit. The higher average speed will increase the average load factor (carried tons per vehicle per day) and thus reduce the number of vehicles needed to do the same amount of pick-up and deliveries.41 [Quispel 2001]
So why are transport operators not enthusiastic about urban road pricing? Apparently, these advantages are not perceived in the same way by all actors, particularly not among the professionals.
Fairness and discrimination in competition
While some argue that road pricing will improve fairness in competition others advocate that it might on the contrary discriminate single actors or regions, e.g. due to the location of their depots. However, this risk should be possible to overcome through intelligent design of the pricing measures.
41 From an ecological point of view this would have the desired effect of reduced emissions. On the other hand,
increased efficiency would also reduce freight transport prices per ton-kilometre again which might trigger even more freight transport.
BESTUFS II – D 2.3 Best Practice Update 2007 / Part I 86 Road pricing and urban freight transport
Infrastructure is already paid
It is advocated against the argument of financing effects benefiting the users of road infrastructure, that freight transport is already paying for the use, maintenance and improvement of road infrastructure (what in some countries, e.g. Switzerland, it does indeed). While this might well be true in some cases, this point has to be analysed carefully on a case to case basis considering the whole tax system applied in the city, region and country. However, the argument gets meaningless when it comes to road pricing for demand management. As a matter of fact most pricing schemes implemented were finally accepted because they are using their revenues for road infrastructure. Pricing schemes for demand management are more likely to be rejected, although there are successful recent examples (London, Stockholm) wehre fighting congestion was the primary concern.
Revenue spending Obviously the use of the revenues is crucial for the acceptance of a road pricing scheme. However, the question of revenue spending cannot be answered generally and has to be looked at on a case to case basis.
The different perceptions of benefits ...
A closer analysis of the highly disputed demand effect and its potential benefits for freight transport operators and shippers reveals that it is not only the effects themselves that are disputed (unknown elasticities of demand of private car users as well as transport business). Also the benefits resulting from these effects are valued differently which explains part of the disagreement. While for the promoters benefit is simply time-savings multiplied by time value, it is more complex for the opponents. Says Mr. Guttridge from the Freight Transport Association: five minutes saved only mean a longer coffee-break for the driver.42 [Guttridge 2001] Apparently, time savings do not linearly translate into economic benefit. A three minutes time-saving is not enough for an additional trip or even delivery stop. The relation between time-savings and benefits depends on various criteria that are specific for each transport company (cost structure, vehicle use profiles etc.), but it could probably look rather like a stair than like a straight line (see Figure 30). Time savings only get relevant if the number of stops per vehicle can be increased. This is often forgotten when talking about time-savings benefits.
Time losses surely are a problem for transport operators, but an equally or even more important issue is reliable and precise delivery, i.e. predictable road conditions. It seems at least plausible that road pricing could lead to an improvement in this respect. [ITS 2001]
42 Although of course this break might create intangible or long-run value in terms of more alert drivers, i.e. less
accidents and damages, higher service level and better motivated employees.
BESTUFS II – D 2.3 Best Practice Update 2007 / Part I 87 Road pricing and urban freight transport
Figure 30: Time savings and benefits
... and costs Naturally the potential gross benefit of road pricing for freight transport operators comes at a cost.
Eventually, the freight transport operator is imposed additional administrative costs, depending on the design of the pricing scheme.
Another cost is the actual fee for road usage charged on the freight transport operators too. From a competitive market’s point of view this is not a problem, as all competitors in the market face the same, although new conditions. In the contrary, competitors from abroad have no longer a competitive advantage (see above). It is often argued that road pricing would distort inter-modal competition in favour of other modes than road. While this might be true for inter-urban road pricing schemes, it is not that much a problem for urban road pricing, as there are virtually no efficient modal alternatives to road in the urban freight transport market.43 The Swiss Heavy Vehicle Fee (LSVA) follows a particular approach in this context: pre- and end-haulage for intermodal freight transport are provided a flat fee refund in order to promote intermodal transport.
The real cost for freight transport is that competition will get harder and that margins will become smaller in the short run. In the long-run, the new charge will probably be passed on to the customers and freight transport prices will rise. This in turn might reduce demand for transport which would make the market contract [Baker 2001]. Thus, urban road pricing might lead to a concentration process in the freight transport market. Considering this, the reluctance of some freight transport operators against road pricing becomes understandable from their point of view, which of course is not necessarily in line with the overall welfare of society.44
43 Of course it is absolutely desirable from an efficient pricing point of view that all modes of transport equally pay
their costs, on urban roads as well as on inter-urban roads. 44 With respect to social welfare it is also argued, that increasing competition could lead to socially undesirable
cost cutting measures such as neglecting safety standards and cutting jobs. [Louillet 2001] This argument is popular in relation with almost any political topic. It is a political question if a society values a certain number of jobs in transport business higher than the benefits from less transport. Obviously, less lorries driving around means less drivers driving them.
time savings
benefit
threshold values
BESTUFS II – D 2.3 Best Practice Update 2007 / Part I 88 Road pricing and urban freight transport
The fear of increasing transport prices proves at least two things:
• that also the transport operators opposing urban road pricing believe, that there is a correlation between price and demand (the basic idea of road pricing), thereby proving the rationale of the concept
• that the objectives of society (less negative impacts due to transport) as a whole are not necessarily in line with the objectives of the transport industry (maximising profits).
Freight transport operator’s Cost-Benefit-Analysis
In order to create a net benefit for freight transport operators, the charged fee would have to be high enough to make private car users shift (reducing congestion) and low enough for transport operators not to offset the benefits it creates for them. The analysis is complex, as these benefits depend again on the (unknown) elasticity of demand of private car users, as well as a number of other factors such as the overall demand level, congestion level, etc. There are many unknown parameters in this Cost-Benefit-Analysis. However, it is quite possible, that most fees currently charged for road usage are too low to create a net benefit for freight transport. If the fees were higher they would not be accepted by the private car users - which form the majority of the voters. Following this argumentation line, the transport industry, which is mostly opposing urban road pricing, should - paradoxically - advocate for higher fees.
Summarising this brief and rough assessment it can be supposed that road pricing could well create a beneficial net effect for urban goods transport operators - although not for all of them. Increased transport costs will make the goods pick-up and delivery market harder, competition will increase, margins will get lower in the short-run and overall demand for goods transport might not grow that fast as expected without pricing. For those staying in the market the potential efficiency gain form pricing might offset or even outweigh the nominally increased transport cost, reducing real operating costs per unit. But even with increasing real transport costs (equally for all competitors!) active and innovative transport operators have a comparative advantage, as higher transport prices will put storage, innovative logistics and intelligent vehicle capacity utilisation back into the spot-light of economic considerations.
Experiences with the Swiss heavy Vehicles Fee (LSVA) indicate that road pricing increases competition on the transport market, triggering innovations and benefiting innovative operators.
Efficient pricing ? Cost-Benefit-Analysis from the transport operator’s view tries to explain the rationale of transport operators being in favour or against road pricing measures. Although these considerations are illuminating with respect to certain stakeholders’ acceptance and the related marketing issue, they tend to distract from the initial idea of efficient pricing. It is not the objective of
BESTUFS II – D 2.3 Best Practice Update 2007 / Part I 89 Road pricing and urban freight transport
efficient pricing to benefit a certain category of stakeholders, but to allocate resources (road infrastructure in this case) efficiently in order to increase overall economic welfare of society. Transport operators often argue, that they do not want to pay “for nothing”. But even if their individual cost-benefit analysis turns out to be negative, they do not necessarily pay for nothing, they could well pay for their external costs. This brings us back to the calculation of external costs - which is controversial too, but another story.
BESTUFS II – D 2.3 Best Practice Update 2007 / Part I 90 Road pricing and urban freight transport
3.7 Conclusions and recommendations
3.7.1 Conclusions
Still in its infancy Road pricing is well known for financing infrastructure in southern European countries on motorways and in a number of cities in Norway. But when it comes to urban road pricing for demand management and the underlying economic idea of true costs, internalising external costs or social marginal cost pricing, road pricing is still in its infancy, with first operation examples. Although from an economic point of view the theoretical concept is very compelling, its implementation into the real world faces various hindrances:
• apparently urban transport problems are in many urban areas not perceived as pressing enough for road pricing to be accepted yet (lacking willingness to pay, data privacy, social equity concerns etc.). With the forecasted growing transport volumes in mind and the well working and Europeanwide prominent examples (London, Stockholm), road pricing acceptance is expected to increase in the future.
• trade-off between the economic ideal of a fine tuned pricing differentiated according to a large number of factors and operational efficiency: not everything technically feasible is suitable. Economically second best solutions can be simpler (low-tech) and thus more cost-effective.
• practical calculation of external costs are not undisputed either. Fees have top be rather high to have a considerable demand effect.
• results and experiences are difficult to transfer due to the huge variety of different concepts and the high dependency on local framework conditions
...but many initiatives (Norway, UK, Italy, Sweden and more)
Although the operating urban road pricing schemes are rather few, there are a large number of initiatives going on and projects planned, particularly in Norway, the United Kingdom, Sweden, Italy, Belgium and the Netherlands. From the reviewed projects the following conclusions can be drawn:
• Almost all urban road pricing schemes equally apply to both passenger transport and freight transport
• Yet the projects usually focus mainly on passenger transport. Freight transport should therefore be better integrated in the future
• Practical schemes have been driven by political reality (negotiations) rather than economic theory (cost calculations)
• Most implemented schemes are designed for financing infrastructure, demand management is more difficult to raealise, but public view can
BESTUFS II – D 2.3 Best Practice Update 2007 / Part I 91 Road pricing and urban freight transport
change upon demonstration
• Most road pricing schemes follow an incremental approach: from simple to complex. Differentiated charging according to distance or even duration of the trip is scarce; most schemes charge a flat rate during a certain time window.
• Because technology is abundant and because technical problems offer the least resistance, road pricing schemes run the risk of being over-sophisticated, thereby neglecting the human factor
Influencing urban freight decision variables...
Although most urban road pricing projects focus mainly on passenger transport, freight transport is equally affected in a collateral way. From the top decision variables of freight transport operators and shippers [Ruesch et al. 2000], road pricing does not only influence prices. By potentially reducing passenger and overall traffic it might also increase the transport business’ efficiency by improving
• reliability
• punctuality
• duration of the trip
• security.
The London and Stockholm cases show that these effects actually occur.
... thereby solving urban freight problems
Main problems of urban freight transport include suitable loading/unloading infrastructure, city access, noise, pollution etc. [BESTUFS 2001b, COST 321 1998]. The main problem in the future with urban freight transport will be congestion - and to a lesser extent danger to other road users and visual intrusion. [Quispel 2002]. In brief, urban freight transport is facing an efficiency problem which is getting increasingly prominent due to decreasing consignment sizes and more frequent deliveries.
• Road pricing can contribute to improve the efficiency of urban freight transport.
• Road pricing can contribute to the solution of a number of urgent urban freight problems such as noise, pollution and congestion.
• In the medium and long run, road pricing could eventually contribute to more sustainable logistics- and distribution strategies and to a more sustainable urban freight transport.
Particularities of freight transport
Freight transport is likely to react differently to road pricing than passenger transport due to a number of reasons:
• commercial transport has a higher trip value, thus a lower elasticity of
BESTUFS II – D 2.3 Best Practice Update 2007 / Part I 92 Road pricing and urban freight transport
demand
• commercial transport operators tend to take their decisions based on rational economic considerations (no cost illusion)
• for freight transports there is no efficient alternative transport available. Yet, pricing sets an incentive for optimising the freight business processes.
Does freight transport gain?
Urban freight transport is often quoted as one of the beneficiaries of urban road pricing, mainly for two reasons:
• Because time value of business trips is generally higher than that of private trips, road pricing is expected to reduce road usage by private cars, reducing congestion and increasing the efficiency of the remaining high value commercial trips.
• Road pricing harmonises competition as all transport operators participate on the cost of road usage including foreign vehicles or vehicles from other regions.
A variety of opinions
Nevertheless, freight transport professionals are rather sceptical against road pricing. Still, their attitude is far from homogenous, ranging from complete rejection to the expectation of benefits.
Cost-Benefit-Analysis
In order to create a net benefit for freight transport operators, the charged fee needs to be high enough to make private car usage decrease and low enough for transport operators not to offset the benefits it creates for them. For these benefits come at a cost which is less the fee itself and the administration costs it creates (they might be passed on to the customer), but rather a shrinking transport market with increased competition and lower margins. But even with increasing real transport costs (equally for all competitors!) active and innovative transport operators have a comparative advantage, as higher transport prices will put storage, innovative logistics and intelligent vehicle capacity utilisation back into the spot-light of economic considerations.
Experiences in Switzerland indicate that road pricing increases competition on the transport market, triggering innovations and benefiting innovative operators. Still, many impacts of urban road pricing remain unclear, particularly with respect to urban freight (see below: knowledge gaps).
Confirming the rationale of the concept
If freight transport operators oppose road pricing, because they fear a contraction of their market due to increased transport prices, they implicitly confirm the basic idea of road pricing: that there is a correlation between price and demand.
BESTUFS II – D 2.3 Best Practice Update 2007 / Part I 93 Road pricing and urban freight transport
3.7.2 Recommendations
Recommendations on project / city level
Urban road pricing has proved a promising concept with a number of advantages. But the implementation of road pricing schemes has also showed to be a long and complicated process which must not be underestimated - even under favourable conditions.
Although the transferability of experiences was found to be limited due to the big variety of different framework conditions, objectives and concepts (see point 11 below), the following recommendations can be given from the assessed projects:
Designing the scheme
1. The concept design should follow the problems
2. The technical solution should follow the concept design - not the other way round
3. It is not the majority of ordinary users, but the handling of the few non-equipped, uninformed or handicapped that is crucial for success
4. The design of the road side equipment can be delicate as it is often installed in sensitive historic areas (town centre)
5. Include all actors of the transport system, including freight transport, into the designing process
Communicating it 6. Political and administrative consensus is vital
7. Involve opposing interest groups and build coalitions between them. Get agreements about how to use the money, give something to both sides
8. Present the project as a compromise, a balanced solution
9. Define and treat the scheme as a technical, environmental, financial problem, not as an extra tax
10. Illustrate the benefits: the project must be accompanied by advantages clearly visible to the users, both motorists and environmentalists
11. Something is better than nothing: Incremental approach, demonstration projects, pricing for improved capacity is more acceptable than pricing for demand management; first simple, then complex
Adjusting to local conditions
12. Find your own way: There is much to be learned from existing projects, but general recommendations must be adjusted to suit local conditions (traffic conditions, political system, public opinion, etc.)
BESTUFS II – D 2.3 Best Practice Update 2007 / Part I 94 Road pricing and urban freight transport
Freight neglected The existing practical schemes have been driven by political reality. Consequently, research focussed on passenger transport as the majority of voters are private car users. Freight transport has been sadly neglected by urban road pricing research. Many advocates of urban road pricing stress that urban freight business will benefit from road pricing measures (better road access, increased reliability, etc.), there has been first evidence on this point with the cordon pricing schemes in London and Stockholm. But the supposed beneficiaries themselves do not belief in their chances. As Mr. Guttridge from the Freight Transport Association says: “Does urban road pricing lead to less congestion? ... Maybe it has no impact at all, we do not know” [Guttridge 2001]
We therefore strongly advise that freight transport should be considered integrally in future road pricing projects.
Knowledge gaps From the above said it has become clear that road pricing is neither an easy task nor a clear cut case. Not only are its objectives heavily disputed, but also the concept itself, its potential impacts and its effectiveness are doubted. Whereas the first point is subject to societal discussions and the democratic process of building up a political will, it is the task of scientific research to answer the remaining questions of the second point, thereby providing best available knowledge as a basis for sound and legitimate political discussions.
With regard to urban freight, the following questions have been identified:
Direct impact on urban freight?
• Will road pricing trigger a change in the behaviour of freight transport operators and shippers?
• Which level of fee is necessary to do so (cost structure of transport operators)?
• What are the decision variables for the behaviour of shippers and transport operators for urban distribution (fleet mix, route planning, etc.) in the short and long term?
• What options to react has the freight transport industry? Are there any options for efficiency improvement or is transport business already operating at its maximum efficiency level?
• Will freight transport prices increase and will the demand for freight transports adapt - and to what extent?
• Which medium and long term effects on logistics structures and transport strategies are to be expected?
Indirect impact on urban freight?
• Does urban road pricing lead to less congestion - under which conditions and to what extent?
• How does this eventual decongestion translate into benefits for urban
BESTUFS II – D 2.3 Best Practice Update 2007 / Part I 95 Road pricing and urban freight transport
freight?
• How to combine and integrate road pricing for passenger and freight transport?
• What could the consequences for the urban freight transport market be?
Research recommendations
Considering this lack of knowledge in the light of a number of road pricing initiatives currently being pursued, it is strongly recommended that further European and national research programmes investigate the issue of road pricing and urban freight. Research activities should analyse both direct impacts (charged fee and induced behavioural change) and indirect impacts (fiercer competition, better road access, changes in logistics patterns) of different road pricing schemes on urban goods. Short-run and long-term impacts are to be considered, especially with regards to behavioural change and economic decisions. Depending on the direct impacts on all transport actors, both private and professionals, several indirect impacts on the urban freight transport system (efficiency, competition, market share etc.) and on the demand for urban goods will have to be distinguished. The analysis might include a cost-benefit-analysis of urban road pricing from the goods transport operator’s and from the city and region authorities’ point of view.
Improving the road pricing discussion
The research should reveal the impact of different road pricing schemes on urban freight transport operations. By clearly linking different road pricing measures to their various effects this research will help to improve and legitimate the frequent discussions about urban road pricing. By establishing a cost-benefit-analysis of urban road pricing measures from the freight transport operator’s view the research will contribute to further clarify the most relevant of all road pricing obstacle: stakeholder acceptance.
BESTUFS II – D 2.3 Best Practice Update 2007 / Part I 96 Urban freight platforms
4 Urban freight platforms (UFP)
4.1 Introduction
4.1.1 Background and need for action
Why freight platforms ?
As urban activities require the supply of goods and the disposal of waste for consumption and production, there is little scope for reducing goods flows to and from cities. Previous research shows however, that the distribution of urban goods is not organised efficiently and that there is considerable scope for reducing urban goods traffic (vehicle-km) through co-ordination and consolidation of transports. [COWI/NTU 1996]
To reduce urban freight traffic and to shift long distance freight traffic from road to rail, the concept of freight platforms was developed. [REFORM 1999] The first freight centres in Europe were established in Paris during the mid 1960s in response to urban congestion. Urban Distribution Centres (a type of consolidation centre) were developed in the UK and later in the Netherlands and Monaco. Several countries included the development of freight centres in their national policies. Italy was the first in 1990, followed by Germany in 1992 and France in 1993. [Visser et al. 1999] In particular consolidation centres for collection and delivery activities were a prominent topic in the 1990s in connection with city logistics activities.
A phase-out model ?
Today, this trend has slowed down again after some projects could not fulfil their optimistic expectations. In spite of this process of disillusioning we believe that urban distribution and freight centres might well experience a revival in the future and should be assessed in the Best Practice Handbook, because:
• the need for urban distribution and freight centres has been growing due to decreasing consignment sizes, higher delivery frequencies and smaller stocks
• shippers tend to increasingly outsource their logistics activities • freight providers will increasingly find themselves barred from cities or
city centres • urban distribution and freight centres can help in assuring the goods
supply of a city and in handling the collection and delivery traffic efficiently
• they offer potential for city logistics • their integration into the urban area is difficult • securing urban areas for such activities requires active urban land use
planning
BESTUFS II – D 2.3 Best Practice Update 2007 / Part I 97 Urban freight platforms
Finally, COST 321 [1998] promotes “Goods distribution centres” and “regional rail network in combination with urban Distribution Centres” as well as “Optimisation of distribution systems including transport systems” among the 10 most promising measures for improving urban freight transport according to an expert working group.
BESTUFS workshop in La Rochelle
Consequently “Land use planning and business models for urban distribution centres” had been chosen as topic for the 7th BESTUFS-workshop that took place in April 2002 in La Rochelle (France). Due to the positive response of the workshop and the lasting actuality of the topic it was decided to incorporate the topic “Urban freight platforms” into the third Best Practise Handbook (2002) within the BESTUFS project.
4.1.2 Definitions and classification
The concepts of freight centres or platforms are very different among countries and authors. Similar things are named differently and different things are named similarly. It is necessary to clarify at least four terms: Freight platform, Urban Distribution Centre (UDC), Freight village and City logistics.
Freight platforms According to REFORM [1999] freight platforms can be defined as areas in which different transport related companies such as forwarders, logistic service providers etc. are established. It is a transhipment area where, ideally, at least two transport modes are connected. Usually these transport modes consist of road and rail, but waterborne and air transport can also be integrated. The concentration of transport related companies inside a freight platform promotes synergies and primary effects, if the process of integration is planned and enforced in co-operation with all the companies and with involved local authorities.
In short, a freight platform integrates on concentrated area modes, carriers and services related to logistics and freight transport. Important functions of freight platforms include (see Figure 31): [based on REFORM 1999]
• Integration of different modes and carriers
• Hub/Gateway
• Starting point for pick-up and delivery transport (including bundling)
• Storage of goods (hazardous goods, cooling, etc.)
• Handling of goods (packaging, commissioning, etc.)
BESTUFS II – D 2.3 Best Practice Update 2007 / Part I 98 Urban freight platforms
• Provision, repair and maintenance of vehicles, containers, transshipment equipment
• Provision of infrastructure such as rail tracks, parking, etc.
• Provision of areas for internal services such as customs, security services, information systems, training and consulting
Figure 31: Activities on a freight platform [REFORM 1999, p. 8]
Classification criteria
The wide spread of different freight platforms and the variety of names and terms call for further structuring and classification.
Classification criteria for freight platforms include:
• Company structure: single or multi-company freight centres. In this handbook the differentiation between single and multi-company platforms does not necessarily refer to the owner or operator of the platform but rather refers to the question if the platform does process freight from only one or from several transport operators. A classic single company platform is a freight platform where a large retailer bundles and consolidates his goods for more efficient transportation and distribution. A multi-company platform might be shared between several transport operators but might as well be operated by only one transport operator receiving freight from any other transport operator willing to pay for the service (see Figure 32).
BESTUFS II – D 2.3 Best Practice Update 2007 / Part I 99 Urban freight platforms
Figure 32: Single-company and multi-company platform
• Spatial orientation: urban, regional, national, international
• Transport modes and intermodal access: Road, rail, barge, sea, air, pipeline
• Institutional solution: private or Public Private Partnership
• Main aims: optimisation of logistic operations, urban traffic reduction, modal shift, regional economic growth.
These characteristics are not independent and form more or less typical combinations. Figure 33 combines company structure, institutional solution and main aims.
Single-companyplatform
Company A
Company A
Company A
Company A
Multi-companyplatform
Company A
Company B
Company C
Company A or X
BESTUFS II – D 2.3 Best Practice Update 2007 / Part I 100 Urban freight platforms
private PPP
single company platform
mainly private aims: optimisation of logistics and transport operations through
internal re-bundling and economies of scale
(centralisation)
multi-company platform
mainly private aims: optimisation of logistics and transport operations through
bundling between companies and economies
of scale (co-operation)
private and public aims: optimisation of logistics and transport operations, traffic reduction during delivery,
modal shift, regional economic growth
Figure 33: Company structure versus institutional solution of freight platforms
Table 2 gives a classification of freight platforms based on the results of the REFORM projects and on Visser et al [1999]. In the real world, the borders between the different types of platforms are usually blurred.
Urban Distribution Centres (UDC)
According to COST 321 [1998] an Urban Distribution Centre (UDC) is a place of transshipment from long distance traffic to short distance (urban) traffic where the consignments can be sorted and bundled. Its main purpose is to achieve a high degree of collection in the goods flows in order to supply efficient transport from the UDC to the city centre and vice versa. [van Duin 1995] It is this focus on distribution efficiency and its city orientation that separates the UDC from other freight platforms. Therefore UDCs are sometimes also referred to as city terminals or urban consolidation centres. They can be stand alone platforms of a single forwarder or an element in the logistic chain of huge companies. More common however is the integration into logistic urban networks. Connected to freight villages in the outskirts, they are used as central urban, multi-company consolidation centres. [REFORM 1999]
BESTUFS II – D 2.3 Best Practice Update 2007 / Part I 101 Urban freight platforms
Table 2: Classification of freight platforms [based on REFORM 1999 and Visser et al. 1999] Terminal development Area development
Intra-company synergies
Inter-company synergies Transport oriented Transport + other Industrial + some
large areas in the outskirts or at old industrial areas
large areas in the outskirts
near airports and harbours
Spatial orientation urban urban urban regional regional and international urban and regional international
grey shading: scope of this Best Practice Handbook
BESTUFS II – D 2.3 Best Practice Update 2007 / Part I 102 Urban freight platforms
City Logistics Rather close to this definition is what Eisele et al. [2000] describe as City Logistics: “...all co-ordinated measures comprising logistic collection and delivery activities of logistic service providers in urban areas that aim at the reduction or prevention of commercial traffic and its negative external effects.” However, the notion of City Logistics differs a lot between countries. This quite narrow notion of City Logistics is rather common in Germany, whereas particularly in the English language areas city logistics is a rather generic term that includes much more than bundling of deliveries or a UDC.
Although the presence of a freight platform is not a pre-condition for City Logistics, both concepts benefit from this combination. [Visser et al. 1999]
Freight villages Freight villages, generally, focus on bi- or multimodal transport. The distinguishing element of these platforms is the transhipment terminal. Service providers are established on site, as well as a large number of forwarders and transport companies. [REFORM 1999] Actually freight villages are areas with several terminals [Visser et al. 1999] which can even include an Urban Distribution Centre when located close to city borders, interfacing with long distance transport and city distribution services. On the other hand some freight villages are used as transhipment points on a European scale. In Germany and Italy, freight villages are known as Güterverkehrszentren (GVZ) and Interporti respectively. [REFORM 1999]
Characteristics of a freight village are: [Huschebeck 2002]
Transport related activities (transport, forwarding, warehousing, additional logistic services, telecommunication etc.)
Link to minimum two transport modes but not necessarily located within the area of the freight village
Settlement of different economically independent companies and
Exploiting the synergies e.g. through development companies (advising planning and development processes).
It is expected that freight villages are contributing to a shift of freight transport to other modes, to the avoidance of transports and to a reduction of transport processes within urban areas (city logistics).
Industrial and logistics parks not only fulfil transport functions but are also industrial areas. [Visser et al. 1999]
Business Grouping Developments are primarily set up to group businesses. When in such areas also grouping of transshipment, storage and transport activities take place, they operate like a freight platform. [Visser et al. 1999]
Special logistic areas such as cargo centres and seaports provide an interface for additional transport modes. [Visser et al. 1999]
BESTUFS II – D 2.3 Best Practice Update 2007 / Part I 103 Urban freight platforms
Scope of this Handbook
The scope of this Handbook is given by the following aspects:
• serving city and conurbation (city orientation)
• distribution (bundling and commissioning)
• storage
• option for intermodality With regard to the classification of Table 2 this means, that the focus is on on urban distribution centres (UDC) and urban oriented freight villages (shaded in grey). The criteria of urban orientation thereby set the limits of this quite wide focus. A freight platform is defined as urban oriented, when
• a strong physical link exists between the platform and the city
• a significant share of activities on site are dedicated towards city distribution
• specific regulatory aspects have been negotiated to address city distribution practices.
Usually, only UDCs and certain freight platforms show the described characteristics. [REFORM 1999]
4.1.3 Aims and benefits
Two main goals As the different categories of freight centres have shown, their aims can differ according to category, local circumstances, spatial orientation, etc. Nevertheless, there are two main reasons behind the development of freight centres:
• the consolidation of goods flows (collection and distribution centre)
• the facilitation of logistic activities with location, space (e.g. storage) and other facilities (particularly transhipment)
The consolidation of goods flows aims at increasing the efficiency of the collection or distribution process, thereby reducing the environmental impact of urban delivery activities. By bundling various trips of one or several carriers to single trips with better capacity usage or smaller and cleaner vehicles, congestion and noise in the city can be reduced, time gained and delivery made more reliable.45 In such a co-operation between forwarders the number of trips can be reduced by a corresponding increase in the load factors. Figure 34 shows typical urban transport patterns that call for
45 For the economic costs (basically the necessary additional transhipment) and other hindrances refer to Chapter
4.1.4.
BESTUFS II – D 2.3 Best Practice Update 2007 / Part I 104 Urban freight platforms
realising such synergies: each vehicle serves major parts of the city (some even several cities) within the same route, delivering or collecting only small consignments at each stop.
Figure 34: Urban transport patterns calling for synergies [COWI/NTU 1996]
Realising synergies The facilitation of logistic activities aims at realising synergies by concentrating business activities, whether from one single company or between several companies. Such synergies and business activities can include:
• synergies in logistic processes such as long distance haul, storage (incl. hazardous goods, cooling), packaging, commissioning
• synergies in infrastructure such as connection to transport network, transhipment equipment, environmental investments, railway sidings (economies of scale). Like this, additional services necessary to increase the quality of the intermodal transport and attract new customers can be offered at relatively low cost. By facilitating the implementation of efficient transhipment equipment the freight platforms can support the shift of long distance transport from road to rail
• provision of internal services such as customs, public transport, security services, waste disposal services, information services, training and consulting
• external economies of scale (spillovers) by assembling transport know-how at one single spot
• external supply of logistic activities of shippers, e.g. substitution of
BESTUFS II – D 2.3 Best Practice Update 2007 / Part I 105 Urban freight platforms
(expensive) inner city storage facilities
Public and private can benefit both
The REFORM-project distinguishes between public and private aims, showing that freight centres can benefit both: [REFORM 1999, p. 9]
Public benefits:
• Less emissions through more efficient urban deliveries, i.e. a reduction in the number of trips
• Shift of long distance transport from road to rail
• Further traffic reduction in the urban region as trips to service stations can be avoided when these services are provided directly on site
• Stimulation of economic growth in the region (creation of jobs, establishment of new enterprises, improved supply to the industry) by improving the logistic infrastructure
Private benefits (operators and transport companies) are mainly focused on increasing efficiency:
• finding suitable spaces
• bundling consignments
• using intermodal transport
• economic gains from additional services
• participating in co-operations
• attracting new customers
BESTUFS II – D 2.3 Best Practice Update 2007 / Part I 106 Urban freight platforms
4.1.4 Problems and controversies
Various hindrances in the real world
Although the idea of distribution and freight centres as outlined above sounds very compelling, particularly the target of increasing the efficiency of urban delivery by consolidating multi-company delivery has proved difficult to meet in the past. Several authors mention different reasons for these failures of urban distribution centres such as: [Wichser/Schäffeler 2001; COST 321 1999; ELTIS]
• Lack of economic interest (interruption of the transport chain at the distribution centre causes additional costs that are not offset by a corresponding gain in efficiency)
• Lack of willingness to co-operate because of fierce competition (fear of disclosing competitive information about order quantities, products, customers, know-how, etc., fear of loosing customers to their competitors)
• Reluctance to relinquish control over merchandise and transport chain, particularly the responsibility for the goods transported
• Loss of direct contact between the receiver and the delivering company (the act of delivering offers an opportunity for the transport company to promote itself and to establish a customer relationship - it is the company’s “business card”)
• Many companies give much higher priority to customer service and competitive advantage than to reduced transport costs
• Reduced need for multi-company consolidation because of the general concentration process in the transport business (for large retail companies with their own distribution network the benefit of multi-company consolidation is rather small).
Another controversy occurs in relation with city logistics projects if urban distribution centres are combined with a heavy lorry ban for the inner city. Although this measure reduces the number of heavy trucks, it will correspondingly multiply the number of small vans which is not really what is best for the environment46 and the city’s inhabitants. [Savy/Dablanc 1995]
46 According to UVEK [1998] delivery vans emit 4 times more particles per ton-kilometre than lorries and are
almost 5 times as noisy per ton-kilometre.
BESTUFS II – D 2.3 Best Practice Update 2007 / Part I 107 Urban freight platforms
4.2 Related research activities
The following European47 and national research projects related to urban freight platforms have been identified, mainly within the European Union’s 4th Framework Programme: [CORDIS 2002, BESTUFS 2002]
European research projects
REFORM (Research of freight platforms and freight organisation) aimed at analysing and evaluating the effects of freight platforms regarding the urban traffic and at providing guidelines and criteria for designing, locating and organising freight platforms in urban areas with the view of optimising the benefits of these platforms and to reduce their negative effects. Therefore a database of 96 European freight platforms was created, identifying key characteristics such as transhipment volumes, infrastructure, on-site company interactions and financial arrangements. Test sites included Berlin, Brussels, Madrid and Rome. The focus of the practical application was set on: co-ordination of big interports (long distance traffic) with city terminals (urban and regional traffic); organisational and operational requirements for the development of successful freight platforms; multimodality of freight platforms (road, rail, waterborne traffic). Project website: http://www.cordis.lu/transport/src/reform.htm
SURFF (Sustainable urban and regional freight flows) focused on telematics applications in seven EU cities to improve all-round accessibility of information systems within regional freight centres and to support smooth inner urban freight flows. The applications proposed covered operational support both for individual centres and whole networks. City distribution relied on co-ordinated resource management at centres, while inner city freight transport enhanced by interfaces with traffic information services, such as roadside multimedia kiosks for lorry drivers to obtain route guidance or freight documents without needing to access the project sites. Project website: http://cordis.europa.eu/telematics/tap_transport/research/projects/surff.html
LEAN (Integration of Lean Logistics in urban multimodal transport management to reduce space demand and optimise use of transport mode) aims at developing and demonstrating new concepts to distribute and collect goods in urban areas. The scope include five different levels: 1. Logistics concepts to improve the productivity in transport organisation; 2. City-Terminal operation to improve forwarding processes in view of the whole logistics chain, even with additional goods transfer points and handling costs; 3. Telematics applications, to improve control of goods distribution process; 4. Tools for administrations to influence transport without radical
47 Additional information on the EU transport research programme is available at the programme’s knowledge
BESTUFS II – D 2.3 Best Practice Update 2007 / Part I 108 Urban freight platforms
disruption of economic activities; 5. Alternative transport modes recommendations to support significant modal shift to rail. Demonstration sites include Vienna, Linz, Wiener Neustadt; Regensburg, region of Halle/Leipzig/Dessau; Sevilla, Cordoba; Bristol, Norwich. Project website: http://www.cordis.lu/transport/src/lean.htm
FREIA (Towards the Networking of European Freight Villages) sought to improve the accessibility of European freight villages and their related networks for transport SMEs. Specific objectives were to identify needs for facilities and information system flows through market surveys, and to provide a web-based guide to European freight villages. Project website: http://www.cordis.lu/transport/src/freia.htm
IQ (Intermodal Quality) is aimed at analysing the quality aspects influencing intermodal transport. It will work on the improvement of the interoperability among terminals, interconnectivity and accessibility. The project deals with both the quality of terminals and the quality of network. Demonstration sites: Duisburg (DE), Verona (IT), Madrid (ES) and Barcelona (ES). Project website: http://www.cordis.lu/transport/src/iq.htm
PLATFORM’s (Computer controlled freight platforms for a time-tabled rail transport system) main objective is to implement a more cost-effective way to manage freight-traffic flows through the enhancement of terminal management and the integration of existing telematic systems. Such an approach is expected to make rail transport competitive for long- and even medium-distance freight transport and thus lead to a substantial reduction of road-based transport. The system for the management of integrated rail-road transport will be developed and tested in some demo terminals available to Consortium industrial members: Rho, Melzo, Rogoredo, Verona, Noisy-le-Sec, Lyon, Valencia, Silla. Project website: http://www.cordis.lu/transport/src/platform.htm
IDIOMA (Innovative Distribution with Intermodal Freight Operation in Metropolitan Areas) showed how distribution of goods in metropolitan areas could be improved through several demonstrators including co-ordinated and composite distribution concepts in the Oresund region, co-operative inbound city logistics in Nürnberg, intermodal terminals in Paris, a new concept for linking multiple freight distribution centres and terminals by rail in the Randstad region and various transhipment systems in Zurich. Project website: http://www.cordis.lu/transport/src/48343.htm Project website: www.idioma.gr
FREIGHT VILLAGE 2000 (Quality of Freight Villages Structure and Operations) mainly analyses and evaluates freight village structures and lay-outs in order to determine whether the proximity of different transport and logistics activities is a key factor for the use of intermodal transport and at establishing the merits and limits of the development of freight villages for the enhancement of intermodal transport competitiveness, based on benchmarking and analysis of the best practices and case studies. By
BESTUFS II – D 2.3 Best Practice Update 2007 / Part I 109 Urban freight platforms
examining freight village operations and internal organisation the impact of such structures on the environment has been measured and guidelines and management tools have been developed to improve working conditions and security for freight village operators whilst increasing their awareness with regard to risk factors, safety and the environment. Case studies have been made in seven countries in the European Union: Denmark, Finland, France, Germany, Italy, Spain and Sweden. Project website: http://www.cordis.lu/transport/src/fv-2000.htm
CITY LOGISTICS (Improvement of urban environmental quality by a City-logistics system with integrated decentralised goods distribution centres as interface between European transport flows) intended to develop a city-logistics concept into which participants in supply and waste disposal took part. The concept could be based on the condition that all participants voluntarily used software, which had still to be developed during this pilot project: the so-called City-logistics manager. Demonstration site: City of Duisburg (Germany)
ELCIDIS (electric vehicle city distribution systems) wants to find a solution for urban logistics by organising urban distribution using quiet and clean (hybrid) electric vehicles, and by a more efficient organisation of urban logistics by a more efficient routing of the vehicles and the use of central distribution centres. Demonstration sites in Rotterdam, Stockholm, La Rochelle, Erlangen, Lombardia and Stavanger. Project website: www.elcidis.org.
CITY FREIGHT (5th Framework programme) will analyse the socio-economic and environmental impacts of various changes and measures in urban freight transport and door-to-door delivery, among which Urban Distribution Centres. Project website: www.cityfreight.org.
National general research projects on urban freight platforms
NFP 41 (Switzerland, 1995 - 2001) is a comprehensive National Research Programme on Transport and Environment aiming at an efficient, environment-friendly, socially acceptable transport policy. It consists of over 50 research projects, among which the report B9 “Plates-formes logistiques mutlimodales et multiservices” deals with urban freight platforms. The study gives an overview and a typology for such platforms, their strategies and their choice of location. It was found that in Switzerland logistics companies are very strongly concentrated at a few locations favourable with regard to transport. Improved co-operation of terminal operators, forwarders, loaders, the Federal Government, Cantons and communities, could provide better solutions with regard to economy, ecology and regional planning. Project website: www.nfp41.ch
In France the website http://www.tmv.transports.equipement.gouv.fr/ gives a comprehensive overview on French and European experiences with urban freight platforms.
In Greece the Ministry of Transport has assigned the “Feasibility Study for
BESTUFS II – D 2.3 Best Practice Update 2007 / Part I 110 Urban freight platforms
the Development of Intermodal Freight Centres along the Hellenic Trans-European Network”. Although its primary aim was rationalisation of the international and inter-regional freight flows (improving the operators’ competitiveness and modal shift from road to intermodal combinations) also this centre’s role in urban freight transport was assessed. http://www.tredit.gr/EN/neaDetails.asp?nid=19
4.3 Situation at country level
Fast changing information
Material regarding the situation of urban freight platforms in general and of projects related to UFP in different European countries was collected by the various BESTUFS contractors and members. Further input came from the involved experts and the workshop. The following chapters summarise the main findings of the material collection on country and project level. The given information and its assessment represent the situation at the time of collecting the material, i.e. summer 2002.
A detailed report on regarded country’s situation concerning urban freight platforms is given in Annex V.
BESTUFS II – D 2.3 Best Practice Update 2007 / Part I 111 Urban freight platforms
Figure 35: Countries covered by the material collection48
4.3.1 Importance of urban freight platforms
In order to give a brief impression of the relevance of the topic the BESTUFS members participating in the material collection were asked to estimate the importance (or relevance) of urban freight platforms in their country - in the past, nowadays and in the future. Although the term “importance” is defined rather vaguely and its estimation is always subject to the personal view of the assessor, a rough overview on their different estimations sketches a first picture of the situation concerning urban freight platforms in Europe.49
Relevance increa-sing again
After a period of disillusionment in the late 1990ties when many UFP projects fell short of the high expectations, the importance of Urban Freight Platforms today is considered medium by the average BESTUFS member, although the spread of opinions is quite wide. In any case there is a clear
48 on either country or project level 49 Please note that the considerations expressed in this chapter represent the personal opinions of the BESTUFS
partners participating in the material collection and should not be mistaken as a statistical opinion poll.
+ Australia + Japan
BESTUFS II – D 2.3 Best Practice Update 2007 / Part I 112 Urban freight platforms
tendency for the general relevance of UFPs to increase in the future, even though not in large hikes (see Figure 36). While a few have closed the chapter UFP or at least stay sceptical after the dampers of the past, others are awaiting a second wave of successful UFPs that have learned from former experiences. By far the most frequent point made for the still increasing relevance of UFPs however are the increasingly severe environmental and transport problems. As a consequence the need for actions in urban freight transport is considered to be growing which will also give a new impetus to urban freight platforms as a possible solution to these problems.
0
1
2
3
4
5
very low low medium high very high
In the past
Today
Future
Past
(a
vera
ge)
Toda
y(a
vera
ge)
Futu
re
(ave
rage
)
Figure 36: Past, today’s and future importance of UFPs (number of countries)50
50 According to the personal estimations of the BESTUFS members participating in the material collection
BESTUFS II – D 2.3 Best Practice Update 2007 / Part I 113 Urban freight platforms
4.3.2 National situation regarding urban freight platforms
The concept of freight centres is very different among countries.
Single-company platforms
Freight platforms of single transport companies exist in all countries, some more for urban distribution, others rather for regional or national distribution. But while they might be efficient for the companies, they are mostly not from a more global point of view. They usually have to be considered little innovative from a community transport planner’s point of view. Therefore - if not mentioned otherwise - we refer exclusively to multi-company platforms in the following when talking about Urban Distribution Centres.
Freight villages Freight villages are particularly widespread in Germany (“Güterverkehrs-zentren”), Italy (“Interporti”), France (“plate-formes logistiques”) and - to a lesser extent - Belgium. The majority of existing facilities in France, Italy and Germany was established during the 1980s and was developed from existing locations, like industrial sites or rail terminals. Several countries included the development of freight centres in their national policies. Italy was the first in 1990, followed by Germany in 1992 and France in 1993. [Visser et al. 1999] While some of them are very successful they are mostly inter-urban (long-haul) oriented. However, as freight villages are often located in the outskirts of large cities they can also be good candidates for becoming Urban Distribution Centres.
European freight villages are organised in the Europlatforms association, an economic interest group of freight village operators founded in 1991. Today Europlatforms gathers over 40 freight villages, most of which are fully operational. The association has established a common understanding which enabled them to act within a common framework in order to determine and promote the creation of a European network in accordance with EU sponsoring actions aimed at supporting integrated transport and communication networks. After relentless and patient efforts Europlatform today is established as a significant partner for the development of major EU-sponsored projects in the field of information technology applications, quality label on freight centres and intermodal centre network. [www.freight-village.com/europlat/].
Urban Distribution Centres
The 90s could be called the boom years of multi-company Urban Distribution Centres. Several European cities set up pilot and demonstration projects for urban distribution platforms in order to co-ordinate the delivery process thereby increasing overall efficiency. These UDCs were in general started or supported by public intervention in one form or another. However, all these projects encountered significant problems (see chapter 4.1.4) which in many cases led to the end of the project. According to the three leading countries
BESTUFS II – D 2.3 Best Practice Update 2007 / Part I 114 Urban freight platforms
during this UDC boom of the 90s three “models” can be defined [Ministère de l'Equipement 2002]:
The Monaco model In Monaco, the UDC is owned and operated by the government. In 1989, the government contracted out the operation of freight distribution to a single carrier (a regional transport company). This sub-contractor was given a monopoly over the municipal depot. Added to this was a partial monopoly on the delivery of goods. All trucks over a GVWR of 8 tons (this limit should be lowered to 3.5) are banned from the city of Monte Carlo. If they are to deliver goods to clients there, they have to go to the local freight platform and unload first. The municipal service then takes the final distribution in charge, with specific vehicles. The costs of the service are shared between the municipality, which gives financial aid and free warehouse space to the carrier; the carrier which provides driving and handling staff as well as the vehicles; and finally the retailers who supposedly pay for the amount of goods they receive through the service. [Ministère de l'Equipement 2002]
The Dutch model Following a national program of energy reduction in cities, many Dutch cities have set up systems of urban freight distribution licenses. Strict operating regulations are imposed on the licensees in exchange for an extended usage of street space and longer delivery hours. Applicant carriers must respect a list of criteria such as good level of truck loading, minimum number of shipments and the use of electric vehicles. This kind of municipal organisation can lead to a quasi monopoly of distribution where a very limited number of registered carriers dominate the market of urban distribution. [Ministère de l'Equipement 2002]
The German model In the German case, at carriers' own initiative, a private service of goods distribution is set up with the help of the city. Different carriers join together to consolidate freight and distribute it co-operatively. The system might provide additional kinds of services, such as home deliveries, collect and recycle service or short time storage. Government support can take the form of the distribution of an official "City Logistik label" on trucks and warehouses. Governments can also participate in the financing of the system. [Ministère de l'Equipement 2002]
In the following we give a very brief summary on the national situation in the various countries.51
Australia: There has been little interest in multi- or inter-company urban freight platforms in Australia until recently. However, current initiatives by government to promote rail and reduce the impacts of trucks in inner urban areas have led to some new developments.
Austria: First attempts with urban freight platforms appeared in the mid 90ies but a real success is still missing. A general concept is not recognisable. Most projects follow the trial and error method. The predominant type of urban
51 A more detailed report on each country’s situation concerning Urban Freight Platforms is given in Annex I.
BESTUFS II – D 2.3 Best Practice Update 2007 / Part I 115 Urban freight platforms
distribution centre is the private freight platform (single company freight platform for transhipment and consolidation). There is only one freight village in Graz, which is still under construction. Pilot projects like this might indicate a turning point in the issue.
Belgium: There are no multi-company City Distribution Centres such as that of Monaco or La Rochelle in Belgium, although the development of an urban distribution centre for Brussels is under discussion. Until the 1970s, freight distribution was organised on a provincial basis. Each province had a “general freight market” with all types of goods. Due to the evolution in the scale of markets wholesale activities in provincial capitals disappeared. Distribution systems are involving an increasing number of urban areas, and activities formerly located within cities have most often relocated to the outskirts of cities nearby important highway intersections where large freight villages are established.
Denmark: After a concentration process in the 90s Denmark today has 5-6 national and international transport companies, which operate with distribution of parcels and part-loads through single-company freight centres (typically between 5 and 10, some of them with a large number of sub-terminals). Besides the general controversies in relation to multi-company freight centres, the historical background and the concentration on few distribution systems means that there is a very low commercial interest in establishing multi-company freight centres in Danish cities. Nor have any Danish municipalities been interested in participating financially in establishing partly or fully public freight centres.
France: In the outskirts of French cities there are frequent transhipment terminals of single parcel (and other) companies, generally focused on urban clients but devoted to one operator only. Freight villages (called logistic platforms in France) are extremely successful, but mostly used for non urban transport and logistic activities. Multi-company Urban Distribution Centres are considerably less developed. So far, only La Rochelle has opened one in 2001. Other cities are thinking about it. UDC do not appear as the most relevant solution everywhere. There is a strong commitment of SNCF, the national railway company, to try opening a few UDCs using existing central freight train stations in big cities (Toulouse, Paris, Strasbourg, Lille). No project so far has materialised, due to heavy costs. UDCs receive strong opposition from one of the main transport operator professional organisations.
Germany: In the early 80s restructuring in land use planning and a certain enthusiasm establishing innovative logistical structures led to a number of urban freight platform projects (mainly freight villages called “Güterverkehrszentren”) in almost all federal states. However, the planning and implementation process proved long and problematic. Closely related to freight village activities is the initiation of city logistics co-operations which started by the end of the 80s. In 1997 between 70 and 100 cities or regions had implemented or had plans for city logistics. Different approaches occurred, some of them using urban
BESTUFS II – D 2.3 Best Practice Update 2007 / Part I 116 Urban freight platforms
distribution centres to consolidate and co-ordinate transport flows of different transport and forwarding companies (see “The German model” above). Although at the start these projects looked promising, a significant number are now brought to an end while some are still operating.
Greece: In Greece “freight centres” have been discussed since the early 90s but always focussed on the rationalisation of international and inter-regional freight flows. Urban oriented platforms only exist in the form of single company distribution facilities which mainly rely on facility and equipment modernisation rather than on synergies or breakthrough achieved within the companies’ urban distribution process.
Italy: Urban freight platforms from single private companies represent a relatively old concept. Freight villages (called “Interporto”) are mainly interested by medium-long range freight flows and have an important role in the regional economic development. In many cases (ex. Bologna Freight Village) these freight platforms have been realised not far from the urban areas; therefore they seem to be good candidates for becoming also multi-company urban distribution centres. Such a type of freight platform is not widely used in Italy at the moment, but a number of local authorities are developing specific studies and demonstration projects. Due to particularly favourable conditions (fragmented retail market, leadership in CNG technology) UDCs together with low environmental impact vehicles are expected to be a promising solution in the next few years.
Netherlands: In the early 1990s the concept of centralised city distribution centres became an issue of growing interest for Dutch municipalities. The approach was completely unsuccessful because hardly any market parties were involved in the planning, which resulted in a very low acceptance. in 1997 a public private partnership between authorities and transport actors in the Netherlands called Platform Stedelijke Distributie (Platform Urban Distribution) was established to co-ordinate projects and disseminate information on urban distribution issues. Successful implementation was achieved in a few cases where commercially operated distribution centres were given an urban distribution “licence” (see “The Dutch model” above). Because freight volumes to most cities are not large enough for urban distribution centres to be financially feasible, regional logistic parks are favoured by governmental and market parties alike.
Spain: There is no operational multi-company Urban Freight Platform in Spain. However, a consolidated plan for one exists in the city of Malaga (see project E-01).
Sweden: In Sweden, single company distribution platforms are common since the 50s and today most of them are also connected to the rail network. While urban oriented freight villages are not common at all, there have been several trials with multi-company distribution centres, but most of them failed. Still, experiences are shared within networks and institutions.
Switzerland: Without one or two exceptions the concept of freight villages is not known in
BESTUFS II – D 2.3 Best Practice Update 2007 / Part I 117 Urban freight platforms
Switzerland. Single company platforms however are abundant, but mostly distributing on a national or regional rather than on an urban level. Apart from the freight villages in the narrow sense several ‘logistic zones’ exist, i.e. industrial zones where a number of logistic and/or transport service providers have been grouping together. In the mid 90ties Switzerland followed the German boom in City logistics projects launching 5 pilot projects for multi-company UDCs. None of these projects is operational anymore today, after the demand staid way below what would have been necessary for the project to be profitable. Another multi-company UDC co-funded by the public has been planned in Zurich but still not realised. Despite these deceiving experiences another city logistics project was started in 2000 being the only operational (and promising) example of a multi-company UDC in Switzerland today.
United Kingdom: For 25 years the subject of multi-company urban distribution centres has been promoted, studied, case studies carried out. However, no public projects had actually been launched. The UK at a governmental, industry and academic level has been somewhat sceptical of the publicly owned and operated multi-company UDC concept. It was felt that continental experience was not transferable to the UK, as industry structure and other relevant conditions differ. However, in the last two years this view has changed somewhat.A consolidation centre was opened by BAA (British Airport Authority) at Heathrow airport in 2001 as part of their environmental strategy to improve air quality and packaging waste management (see project UK - 02). During 2002, a consolidation centre was opened at Meadowhall shopping centre in Sheffield. This is one of the largest shopping centres in the UK. In this scheme participating retailers have their deliveries made to the 50,000 square feet consolidation centre which is located several hundred metres from the shopping centre rather than direct to their shops. The goods can be stored at this facility, pre-retail services performed on them and can then be transported to the shops at the retailers' convenience using a shared delivery system. These schemes represent a new development in logistics and distribution management in the UK. It is not yet clear whether similar schemes will be widely implemented in the UK.
BESTUFS II – D 2.3 Best Practice Update 2007 / Part I 118 Urban freight platforms
4.3.3 Legal framework conditions
Direct influence In most countries there are a number of legal framework conditions that directly influence the establishment of urban freight platforms.
Restrictions for particular goods
Legal constraints like HACCP and other national laws set particular requirements to the handling facilities and the distribution conditions for unpacked and temperature sensitive goods.
Transhipment of high value products is often prohibited by insurance companies.
Urban planning regulations
In some countries (such as Greece, Denmark) it is the general urban planning regulations for industries that regulate the establishment of UFPs too. However, in Sweden there are more restricted land use planning regulations when it comes to traffic disturbance. In Switzerland law states certain technical and spatial requirements for the establishment of transhipment platforms;52 the locations of existing and possible future industrial areas suitable for logistic platforms are secured by land use plans on a regional level; furthermore a specific study on the environmental impacts is required for new transhipment and distribution centres with more than 20 ha of storage area.53 In the UK national planning policy guidelines do promote the placement of DCs at the periphery of towns and cities.54
Co-funding, Subsidies
In Germany the government assists with the funding of freight villages given that an intermodal interface is built (in parallel to the freight village development). In Switzerland, transhipment terminals for intermodal transport are co-funded by the government (see project CH-01).
Indirect influence Other legal framework conditions do not apply directly to freight platforms but nevertheless can have a strong influence on their establishment, location, economic viability, etc.
City access restrictions
In all countries many cities apply access restrictions like delivery time windows, vehicle weight limits, lorry bans, etc for the inner city or certain areas (see BESTUFS Best Practice Handbook 1). Obviously, these restrictions can favour Urban Distribution Centres if either they can cope better with these restrictions (e.g. by using appropriate vehicles) or if they are given a special status, i.e. if they are (partly) exempted from the restrictions (the Dutch model). However, granting a special status to one or several market players is delicate as it might quickly interfere with free market competition (monopoly, oligopoly). As an example, in France general
52 Verordnung über die Umladestatione des kombinierten Verkehrs; Accord général sur le transport combiné 53 Verordnung über die Umweltverträglichkeitsprüfung (UVPV) 54 National Planning Policy Guidelines 3, 6 and 9.
BESTUFS II – D 2.3 Best Practice Update 2007 / Part I 119 Urban freight platforms
public law requires a good environmental or “public order” reason or a deficiency in the private sector in order to favour one operator over the others.
Pricing incentives In Switzerland the pre- and end-haulage of intermodal transport is de facto exempted from the Heavy Vehicles Fee (LSVA) within a radius of 40km around the transhipment terminal which can have a strong influence on the location of new freight villages (see project CH-01). Urban road pricing (e.g. a cordon pricing) could also influence the establishment of UDCs if it charges different prices structure for different vehicles types. However, for such an effect prices would need to be higher than those charged today.
4.4 Regarded case studies (project-level)
31 projects collected
32 projects from all participating countries except Denmark and Greece have been collected. Annex VI gives a short project overview fo the collected projects including project’s phase, type of platform, main aims, operator, transport modes integrated, spatial orientation and size of the platform.
Focus on multi-company UDCs
A large majority of the collected projects are multi-company UDCs, i.e. distribution platforms that aim at bundling and consolidating the consignments of different transport operators in order to make use of inter-company synergies (see Figure 37).
6%
65%
16%
13%
Single-company UDC
Multi-Company UDC
Freight Village
Mixture
Figure 37: Collected projects according to type of platform
BESTUFS II – D 2.3 Best Practice Update 2007 / Part I 120 Urban freight platforms
Main objective: consolidation
A look at the main objectives of the platforms confirms this picture. Most projects aim at consolidation, while the enhancement of modal shift is only a target for a minority of the projects. Thus, the collected projects are rather about improving the efficiency of urban distribution (for economical and/or ecological reasons) than about shifting transport towards more environmentally friendly modes (see Figure 38).
0 5 10 15 20 25
Consolidation
Modal shift
General synergies
Figure 38: Collected projects according to their main objective(s)
Still a lot of activity About half of the collected projects are operational already, most of the rest are in a planning stage or about to be realised (see Figure 39). This confirms the estimations regarding the relevance of UFPs in the past, today and in the future: On the one hand the substantial number of operational projects shows that Urban Freight Platforms are not a new concept. On the other hand the amount of projects to be realised in the future clearly indicates that - in spite of many backlashes in the 90ties - UFPs are still seen by many people as a possible suitable instrument to tackle the increasing urban freight transport problems.
BESTUFS II – D 2.3 Best Practice Update 2007 / Part I 121 Urban freight platforms
0 5 10 15
planning/design
realisation
operational
stopped
Figure 39: Collected projects according to their status
Assessment of the projects
The following project descriptions show examples of planned or implemented urban freight platforms and assess the experiences made. As many innovative projects are planned or set-up, a selection had to be made.
Thereby, the following aspects were considered:
• Relevance for BESTUFS, innovative character and contribution to solve problems
• Success / failure analysis and real world experiences
• Balance among countries and approaches
• Availability of further information
• Coverage by other EU-research projects
BESTUFS II – D 2.3 Best Practice Update 2007 / Part I 122 Urban freight platforms
Example 4.4.1: Kassel
Example 4.4.1: City Logistik Kassel (Germany) [Huschebeck 2002]
Key words UDC, co-operation for delivery, neutral transport operator, bundling
Background and objectives
The still ongoing project started in 1994. 7 forwarding companies are involved in a co-operation for delivering the inner city of Kassel. One neutral transport operator is employed to carry out the transport operations.
Kassel has about 200’000 inhabitants. It is located in Northern Hessen on the crossing of to the A 7 (North-South Motorway) and A 44 (connection to the Ruhr area). Main industrial activities are: automotive and transport industry, telematics and software development, environmental and energy technology and culture and tourism.
The implementation of an urban distribution centre was an integral part of the city logistics approach in Kassel initiated by the forwarding association and the chamber for industry and commerce Kassel. In the beginning of the project a series of studies were carried out surveying the requirements, volumes and acceptance of a city logistics approach.
Basic approach A neutral city logistics operator delivers the inner city on behalf of the forwarding companies involved. At 6.00 a.m. he starts the collection tour. About 5 vehicles are employed to collect the consignments delivered at the forwarders’ depots during the night. At the urban distribution centre the consignments are bundled according to the address of the consignees as well as to specific street corridors. At about 10.00 a.m. the urban delivery starts with two to three 7.5 tons vehicles. Usually two tours are carried out per day (depending on the transport volumes). In average about 5 to 6 tons are to be transported via the urban distribution centre.
Information & communication
The city logistics operator receives the transport volumes in the morning via e-mail. The delivery takes place the same day. In case that a delivery cannot take place the city logistics operator informs the respective forwarder (from whom he got the transport order) via telephone. The processes of collection, commissioning, and delivery are not technically supported and are taking place on the basis of receipts.
Financial solution The services from the neutral operator (transport and transhipment) are be paid on the basis of a specific city logistics tariff. The operator is invoicing his services with each forwarder separately. According to statements and surveys carried out the approach shows no significant change on the cost side for the forwarding companies involved (neither benefit nor extra costs compared to the usual delivery services). No specific institutional measures have been foreseen to support the approach.
BESTUFS II – D 2.3 Best Practice Update 2007 / Part I 123 Urban freight platforms
Results and experiences
According to studies carried out the urban distribution centre is seen as unavoidable if the goods bound for the city are to be bundled more efficiently which is the main aim of the Kassel city logistics scheme. The consignees in the inner city do not state any differences in service quality compared to the former delivery scheme.
The main success of the scheme is that the transports can be bundled without any extra costs or inconveniences for the involved companies nor the consignees. On the other hand the public benefits from fewer trips, thus fewer vehicles and fewer emissions. The benefits of the involved transport operators and forwarders are intangibles: the image of being an innovative and responsible company.
A success factor in the beginning of the scheme was the motivation of the partners involved. Especially, the drivers of the neutral operator have to fulfil additional service requirements of the consignees.
Plans to extend the approach (e.g. to create a link with the urban freight village) were not further followed.
More information Member of BESTUFS who did the material collection: Marcel Huschebeck, PTV
See also References and contact persons!
BESTUFS II – D 2.3 Best Practice Update 2007 / Part I 124 Urban freight platforms
Example 4.4.2: Fukuoka
Example 4.4.2: Tenjin Joint Distribution System, Fukuoka (Japan) [Taniguchi 2002]
Key words UDC, centralisation of delivery and collection, significant benefits
Background and objectives
A joint distribution system that centralises delivery and collection services started in 1978 in order to alleviate the traffic congestion and improve the environment in Tenjin district of Fukuoka City, Japan. Tenjin district of 370,000 m2 is the central business area with about 2,200 offices that produce 2 trillion Japanese Yen (approx. 16 billion EUR) of wholesale and retail sale. The limitation of loading/unloading spaces on and off street generated illegal parking, which led to higher levels of congestion.
Basic approach In 1978 twenty-nine freight carriers joined joint delivery systems under the supervision of the Regional Transport Office of Ministry of Transport. In 1994 thirty-six companies have established the Tenjin District Joint Distribution Company Ltd. for promoting the systems. The Tenjin-District Joint Distribution Programme is now being commissioned for delivery and collection services to/from the Tenjin 1st Street ~ 5th Street area.
Figure 40: Map of Tenjin district and joint distribution centre [Taniguchi 2002]
Hakozaki Joint Distrbution Centre
Tenjin District
BESTUFS II – D 2.3 Best Practice Update 2007 / Part I 125 Urban freight platforms
Freight carriers bring their goods to Hakozaki distribution centre of the Joint Distribution Company that is located in the suburb of Fukuoka City, close to the interchange of urban expressways (see Figure 40). Then the Joint Distribution Company will deliver goods from member carriers to each receiver at Tenjin district after sorting goods to each building. The Joint Distribution Company also collects goods from customers in Tenjin district and unloads them at the distribution centre of the Joint Distribution Company where the freight carriers take them over individually. The Joint Distribution Company delivers about 90,000 parcels and collects about 10,000 parcels per month at Tenjin district.
Financial solution Each freight carrier pays 160 Japanese Yen per parcel below 50 kg. No subsidies are provided by the public agencies.
Institutional solution The Regional Transport Office of Ministry of Transport supports the joint distribution systems in Tenjin district in institutional ways. The Regional Transport Office provides a platform for discussing related things and co-ordinating many stakeholders including shippers, freight carriers, residents and administration who are involved in the systems.
Supporting measures
‘Truck only’ parking lots are very helpful for truck drivers to easily find loading/unloading space, although they are not dedicated to the Joint Delivery Company.
Future possibilities The Regional Transport Office is planning to extend this system to other areas, for example in Kumamoto City.
Figure 41: Hakozaki Joint Distribution Centre
Results and experiences
Freight carriers, shippers, road users and residents alike benefit from the joint distribution systems. Ieda et al. (1992) estimated - based on modelling - the benefits of Tenjin-District Joint Distribution Programme as follows:
• decrease of number of trucks in the served area by 65%,
• decrease of total distance travelled (km/day) by 28%,
BESTUFS II – D 2.3 Best Practice Update 2007 / Part I 126 Urban freight platforms
• decrease of total distance travelled within Tenjin district (km/day) by 87%,
• decrease of total frequency of parking (times/day) by 72%
• decrease of total parking time (h/day) by 17%.
These effects (see Figure 42) will alleviate traffic congestion and improve the environment in Tenjin district.
0100200300400500600700800900
Number oftrucks
Totaldistancetravelled
Distancetravelled
within TenjinDistrict
Totalfrequency of
parking
Total parkingtime
without co-operationwith co-operation
Figure 42: Estimated effects of the Tenjin District JDP [Ieda et al. 1992 quoted after Taniguchi 2002]
More information Member of BESTUFS who did the material collection: Eiichi Taniguchi, Kyoto University
See References and contact persons!
BESTUFS II – D 2.3 Best Practice Update 2007 / Part I 127 Urban freight platforms
Example 4.4.3: Leiden (NL)
Example 4.4.3: Stadsdistributiecentrum Leiden BV (NL) [Schoemaker 2002]
Key words UDC, Urban Distributor status, PPP, failure factors
Background Leiden is a historical city with 117'000 inhabitants, a city with a road infrastructure dating back to the Middle Ages. Leiden's road structure is not geared to today's traffic volume. Congestion, street hazards, air and noise pollution are the negative effects of this traffic volume which pose a threat to the living environment of the city centre. With a special focus on protecting the quality of the living environment, the Municipality of Leiden has taken several measures to force back the number of cars in the city centre, among others the restriction of the shop supply hours from 6.00 to 11.00 a.m.. Based on the wish to facilitate a constant supply to the city centre, the thought arose that a city distribution centre (that is allowed to deliver outside the time-frame) would be an attractive alternative for transport companies that were unable to deliver within the restricted supply hours or that did not want to drive into the crowded city centre anymore. Shopkeepers and other entrepreneurs in the city centre would also be able to profit from a city distribution centre by moving their storage elsewhere and having their goods delivered on call. The advantages of a city distribution centre (CDC) are:
• less commercial traffic in the city
• the goods are transported to and from the city in environmentally friendly (electric) vehicles, geared to the size of the city centre streets
• transport companies can deliver their goods at the edge of town, which makes them gain time.
In February 1994 the Municipality of Leiden decided that there should be a city distribution centre and that further measures should be taken to reduce the traffic volume in the city centre. The city distribution centre opened its doors in 1997.
Objectives The city distribution centre was expected to provide:
• a daily reduction of the number of commercial vehicles from 24,000 to 5,000 (-80% !)
• a sharp reduction in pollution (smell, air, noise) in the city centre
• improved accessibility of the city centre
• improved road safety
BESTUFS II – D 2.3 Best Practice Update 2007 / Part I 128 Urban freight platforms
• an example for other, similar cities in the Netherlands and Europe.
Basic approach The CDC Leiden had 5 electric Spijkstaal 2050 vans. The propulsion (electrical) and the size are in line with the regulations laid down by the Municipality for city distribution. The range of the vehicle is about 80 kilometres. The maximum speed is 25 km/h. The vans have been built specifically for supply services in city centres. They are relatively small and virtually noiseless. They are clean, as there are no exhaust fumes or smuts.
The major working area of the CDC was to be the city centre of Leiden. Since this area did not provide enough customers, the working area was soon expanded to the whole of Leiden and the city's surroundings.
Opposition of citizens' organisations (from the residential area bordering the location) and changes in the zoning plan were the reasons why the original location at the Willem van der Madeweg in the Roomburg area (next to the A4 motorway) became impossible. The new location was an extension of existing facilities of Van de Bogerd, the company that also operated the CDC.
Figure 43: The fleet of electric vehicles of the Leiden CDC
Institutional approach
The project started with a public private partnership of the Municipality of Leiden and Hom Consultancy. Later Rien van den Bogerd Beheer BV, the owner of Mosterd Transport Leiden BV and De Zijlbedrijven Holding BV, a municipal organisation providing employment within a re-employment scheme for the disabled and the long-term unemployed, joined the
BESTUFS II – D 2.3 Best Practice Update 2007 / Part I 129 Urban freight platforms
partnership. All three parties had an equal share in the partnership. They also issued an interest-free loan to the partnership. The Municipality of Leiden provided loans to facilitate the actual start and the operation of the CDC.
The number of shareholders of the city distribution centre remained below expectation. "Stadsdistributiecentrum Leiden BV" had always welcomed other transport companies to become shareholders. During the preliminary research stage there were contacts with Van Gend en Loos, PTT, Van Duuren Nederlandse Pakket Dienst and others. However, none of these organisations were sufficiently interested in becoming a shareholder of the CDC. Their reasons were:
• the necessity did/does not exist yet, as the traffic regulations in Leiden's city centre are still offering sufficient space for supply services;
• the unwillingness to collaborate with the "competitor" for fear of losing their own customers.
Supporting measures
After the CDC had started a traffic measure was announced, which implied that supply hours in the closed area would only be until 10.00 a.m. instead of 11.00 a.m. This measure was widely protested against, not only by the interest groups, but also by shopkeepers and other receivers of goods. The interest groups accused the Municipality of making regulations with the mere objective of keeping the city distribution centre alive. The discussions resulted in the city centre being off-limits for vehicles over 7.5 tons.
Recognition of the CDC
The original recognition procedure for city distribution centres (which grants them the special right to deliver outside the given time-windows) was made for one city distribution centre that was open to more shareholders. Both the stipulations concerning location of the city distribution centre and the criteria determining the necessary number of shipments excluded, in fact, any other distribution platform than the one support by the Municipality from being recognised as official CDC.
The recognition procedure, as it was laid down eventually in the spring of 1998, was quite different, because of the following reasons:
• the city distribution centre was in fact located in Leiderdorp, so not on the territory of Leiden, nor was it any longer right next to the A4 motorway.
• the city distribution centre largely failed to reach by far the ambitious number of shipments that had been targeted in the business plan.
• the interest groups said they would not accept a monopoly position of the Municipality-supported City distribution centre and insisted that other companies in the market should be able to be recognised.
BESTUFS II – D 2.3 Best Practice Update 2007 / Part I 130 Urban freight platforms
So far 3 other transport companies, next to the city distribution centre that was supported by the Municipality, have successfully applied for recognition.
Results and experiences
The project could not fulfil its expectations and has been stopped in 2000.
The table below shows what has been the average number of shipments per week in 1997 until week 6 of 2000.
Year Leiden City Centre
Rest of Leiden
Outside Leiden
Total
1997 44 142 73 259
1998 81 142 171 394
1999 103 134 154 391
2000 (until week 6) 130 167 126 423
Table 3: Average number of shipments per week of the CDC
Insufficient performance
The regulations for city distribution centres stipulate that a recognised city distribution centre must, at the end of the first year of recognition, deliver or collect 100 shipments average per working day (i.e. 500 per week !) in the city centre. The figures show that the CDC does by far not meet this requirement. At best 26 addresses in the city centre were visited.
From a business point of view, the performance of the CDC was insufficient. The break-even point was to be reached at a number of 600 shipments per day. As shown in the table above, even the weekly averages do not get close to this figure. Here it must be added that the break-even point of the CDC is relatively low, as it is using subsidised labour, provided by De Zijlbedrijven. If salaries had been paid in accordance with Collective Labour Agreement, the break-even point would have been at 2,000 shipments per day.
Negligible effect on traffic volumes
The project had a negligible effect on traffic volumes. When we compare the volumes of incoming truck traffic in the city centre of Leiden of September 1996 and October 1999, there is hardly any difference. A slight rise in truck traffic has been detected (5,590 incoming vehicles in 1996 against 5,757 in 1999). After the service area was expanded to different parts of the city, the vehicles had to mix with faster traffic on high speed roads, which led to hindrance and delays for other traffic.
The electric vehicles
The project had a negligible impact on environmental issues. The vehicles though, are considered to be a good alternative in the city centre because of the low fuel consumption, emissions and noise level. Outside the inner city, the low maximum speed (25 km/h) and limited range (80 km) make it an
BESTUFS II – D 2.3 Best Practice Update 2007 / Part I 131 Urban freight platforms
unsuitable alternative. As for maintenance and fuel costs, the vans are excellent. There is no exhaust and they are almost noiseless. There is even a bell on them to warn other road users. If final transport in the city centre were the only task, the vans would be very well suitable.
Failure factors The deceiving result of the CDC Leiden is explained as follows:
• The location of the CDC in Leiderdorp was too far away from the motorway from Amsterdam to The Hague (A4).
• The reluctance in the transport industry to tranship goods bound for the city centre:
→ The transport industry in the Netherlands is an extremely competitive one. The margins are extraordinarily thin. The transport companies believe that transhipment involves extra costs, risks and delays in delivery. The time gained by not having to drive into the city centre is outweighed by the extra costs.
→ If the CDC were only intended for goods bound for the city centre that would be insufficient for transport companies willing to tranship their goods. They would also like to get rid of the goods with regional destinations. (As a matter of fact, the CDC solved this problem quite soon by also serving the region around Leiden).
→ For some logistic service providers the personal contact with the customer is an important argument for not transhipping the goods.
→ For particular goods (mainly refrigerated and frozen goods) transhipment is not allowed or only on very strict conditions because of legal restrictions.
→ When valuable goods are involved, insurance companies do not allow transhipment or changes in transport modalities.
→ In those cases where goods have already been pooled for the city centre (e.g. with the companies that received recognition in the past year) there was no need to bring the goods to the municipality-supported city distribution centre.
• The opposition against the supporting traffic measures to be introduced by the Municipality
The transport companies and other interest groups accused the Municipality of introducing traffic measures in order to keep the Municipality-supported City distribution centre alive and not in order to keep the city attractive and economically healthy.
• The image of the CDC
The image of the CDC has not been a positive one. City centre residents applauded the concept, but entrepreneurs and potential users found their reluctance confirmed when it appeared that the electric vans of the
BESTUFS II – D 2.3 Best Practice Update 2007 / Part I 132 Urban freight platforms
CDC slowed traffic on the main roads down and when it became clear that the Municipality had to provide (a lot of) extra money for the city distribution centre.
• The arrival of new competing city distribution centres
Because the recognition procedure for city distribution centres had been opened up, existing transport companies could also apply for recognition as city distribution centre.
Figure 44: Electric van distributing in Leiden, Netherlands
Conclusions City distribution services are of vital importance to shops, companies, institutions and building sites in the city centre. If the old city centres wish to remain economically vital, city distribution is a necessity. This requires creative solutions in which the governing principle would have to be that non-essential traffic is kept out and essential traffic is facilitated.
The electric vans used by the city distribution centre are only suitable for transport in the restricted traffic city centre zone. They were too slow for transport from the city distribution centre to the city centre or vice versa.
A distribution centre that focuses on distributing goods exclusively to the city centre is financially not feasible. The working area should be larger.
Society must be willing to support the (traffic) measures taken by the Municipality and these measures should, of course, be enforceable. In particular the rule that vehicles over 7.5 tonnes are banned appears more difficult to enforce than expected. For the local police this rule does not have priority at present.
BESTUFS II – D 2.3 Best Practice Update 2007 / Part I 133 Urban freight platforms
Although the project, which was supported by the Municipality, has now been terminated, the issue of city distribution is still a prominent item on the agenda. The lesson that Leiden has learned is that one side cannot impose the solution to the supply issue. Together with the parties involved, improvements must be sought. This road has now been taken.
More information Member of BESTUFS who did the material collection: Jarl Schoemaker, NEA
See also References and contact persons!
BESTUFS II – D 2.3 Best Practice Update 2007 / Part I 134 Urban freight platforms
Example 4.4.4: Stockholm
Example 4.4.4: Hammarby Sjöstad, Stockholm (Sweden) [Brisvall 2002]
Key words Centralised construction site delivery, damage & theft safe storage, smart traffic control, PPP
Background and objectives
Hammarby Sjöstad is Sweden’s largest housing project in the heart of Stockholm. An old dockland and industrial area is being transformed into a modern city area that will form a logical extension of Södermalm, with 8'000 apartments housing a population of 20,000. After completion of all parts of the project in 2010 there will be 30,000 people living and working in the area. On the construction site of 200 ha 800 apartments are built per year with 150 additional persons moving in each month. 700 tons of materials are delivered to the construction site each day (average of 1.5 tons per delivery). In peak hours there is one delivery every 30 seconds.
Figure 45: The Hammarby Sjöstad logistic centre (HSLC) [Brisvall 2002]
BESTUFS II – D 2.3 Best Practice Update 2007 / Part I 135 Urban freight platforms
Basic approach To solve this logistic challenge a logistic centre has been established where all inbound goods are consolidated and stored. Services are the bundled transportation of material, temporary storage of material and smart traffic control for vehicles entering the construction yard (including SMS-based variable smart traffic signs). The advantages are that the goods are not being damaged (e.g. by weather conditions) or being stolen. Furthermore, the deliveries are being done efficient and effective by means of a central planning tool, where constructors can indicate if a road is blocked. This results in a better living and working environment and saves money.
Institutional and financial solution
The project is supported by all 10 contractors of the housing project (no free riding), the investors and the City of Stockholm which currently pays about 50% of the costs (yet it is planned that the future operators will pay more after they have seen and experienced the benefits). However, the question whether the project is profitable seen from a total costs perspective remains open.
Figure 46: Truck guidance by smart traffic signs [Brisvall 2002]
Future possibilities Due to its connection with the construction site the logistics centre is a temporary project.
BESTUFS II – D 2.3 Best Practice Update 2007 / Part I 136 Urban freight platforms
Results and experiences
A future evaluation of the project will have to show if the benefits such as efficient distribution, better environment and less damages will outweigh the costs of the project in an overall perspective.
Figure 47: Inside the Hammarby Sjöstad logistic centre [Brisvall 2002]
More information Johan Brisvall Projekt Hammarby Sjöstad Box 8311 104 20 Stockholm
BESTUFS II – D 2.3 Best Practice Update 2007 / Part I 137 Urban freight platforms
Example 4.4.5: York (UK)
Example 4.4.5: Cyclone Couriers, York (UK) [Zunder 2002]
Key words UDC, centralised parcel distribution by bike, zero emission, private initiative
Background Cyclone couriers is a private company with contracts with circa 40 parcel carriers. Cyclone couriers fills a commercial gap as York is a congested medieval city with a vehicle ban from 11 a.m. to 4 a.m. Cyclone couriers operate a next day delivery service on behalf of their contracted parcel carrier customers.
Basic approach They tranship from carrier’s vehicles or collect. They consolidate and deliver the next day. This is only possible for a cycle due to the vehicle bans and even before the ban the cycles are faster, use bike lanes and are cheaper. The cycles are similar to cycle rickshaws but built for freight. The tricycles feature 42 speed transmission, hydraulic disc brakes and aircraft grade steel and accommodate loads up to 250kg. Cargo boxes and passenger seats can be swapped in minutes.
Figure 48: A Rickshaw of the 21st century [www.cyclesmaximus.com/]
BESTUFS II – D 2.3 Best Practice Update 2007 / Part I 138 Urban freight platforms
Cyclone couriers also run collect and deliver courier services both within York and from carriers to York. With this they use normal bikes, thus avoiding loading/unloading restrictions as well as using bike lanes, being faster in congested traffic and cheaper.
Financial solution Cyclone couriers is financed by the clients (parcel carriers and others) paying for the service.
Results and experiences
Since a bike and rider costs £60 a day as opposed to £250 a day for a van and driver, it is cheaper to use bikes to achieve multiple delivery slots than the equivalent number of vans
More information Cyclone Couriers www.cyclonecouriers.co.uk
Member of BESTUFS who did the material collection: Tom Zunder, ARRC
See also References and contact persons!
BESTUFS II – D 2.3 Best Practice Update 2007 / Part I 139 Urban freight platforms
Example 4.4.6: Graz
Example 4.4.6: Cargo Center Graz CCG (Austria) [Dorner 2002a; Dorner 2002b; CCG 2002]
Key words Freight village, transhipment terminal, integrated UDC, PPP
Background and objectives
The Cargo Center Graz (CCG) is a freight village with additional urban distribution functions. The Styrian government together with the chamber of commerce initiated the project in 1997. The platform should start operations in 2003.
Graz is a turntable for international transport connecting Northern and Central Europe with Italy and Eastern Europe. Graz (400.000 inhabitants) is probably the most important and fastest growing economic area in Austria, especially enforced by automotive and high-tech industry. Like any other city in Austria Graz has traffic problems in the centre and at the main connections. Although different individual freight centres are already operating (including the RCA, Rail Cargo Austria, with intermodal deliveries within Austria), space for multi-company urban distribution centres and efficient facilities for intermodal transport, especially a transhipment termina, are lacking. It is the aim of the CCG to shift transports from road to rail, especially the transports of the automotive industry.
Figure 49: Location within the national and regional network [Dorner 2002a]
BESTUFS II – D 2.3 Best Practice Update 2007 / Part I 140 Urban freight platforms
Basic approach The freight village is located 12 km outside the city centre of Graz to the south where many of the automotive companies are situated (see Figure 49). The facility is being newly built in the open countryside. The urban distribution centre (see project AT-02: Styrialog), which will be integrated into the freight village, will mainly serve the city of Graz and the surrounding areas. From the CCG there is direct connection to the motorway and railway system (see Figure 50). The Airport Graz-Thalerhof is 4 km away, the Airport Business Center is located within 2 km.
Figure 50: CCG with direct connection to motorway and railway [CCG 2002]
The Cargo Center Graz will offer the following services:
• Unaccompanied Rail Transport with containers, craneable semitrailers and swap bodies
• Rolling Highway (ROLA)
• Carload Transport: - Carloads in block trains - Groups of freight cars or individual freight cars - Shuttle trains - Special trains for the automotive industry - Traction co-operations with other rail customers
• Rental of equipment and space: - Rental of transhipment areas and halls - Rental of uncovered areas for the loading of automobiles - Storage of containers and swap bodies - Rental of craneable containers, swap bodies and craneable semitrailers
BESTUFS II – D 2.3 Best Practice Update 2007 / Part I 141 Urban freight platforms
• Services: - Development of logistic solutions for individual clients and branches - City-logistics (Styrialog) and regional logistics - Setup of a communication and information platform (e-logistics) - Training and instruction-center for special subjects
• Service facilities: - Customs office - Container depot - Support base and service facilities for locomotives and freight cars - Maintenance of transport vehicles and containers - Filling station and washing bays - Restaurant and catering
Technical solution The CCG has a transhipment terminal for intermodal transport. The whole facility will cover an area of 500.000m², whereof 75.000 m² covered transhipment area and 100.000 m² open transhipment area. The rest are storage (warehouses) and office buildings (see Figure 51). Any type of freight which is usually transported on road and rail (containers, parcels, ...) will be processed. Companies on site include carrier and forwarding agencies, ÖBB (the Austrian federal railway system), logistic service providers (especially the operator of the urban distribution centre), service providers (IT-support, repair and cleaning facilities, ...) and customs clearance.
Figure 51: Map of the CCG area [Dorner 2002b]
BESTUFS II – D 2.3 Best Practice Update 2007 / Part I 142 Urban freight platforms
Two cranes are installed for transhipment (see Figure 52). At the beginning the facility will handle around 36.000 lifts a year, whereas the maximum capacity is at 100’000 lifts. For 2030 around 95.000 lifts are forecasted to be carried out at the transhipment terminal.
Figure 52: Two cranes for transhipment [Dorner 2002a]
Institutional and financial solution
The project is realised as a Private Public Partnership (PPP), involving private carrier and forwarding agencies, the three largest banks of Styria and the Styrian Energy Supplier. The province of Styria and the Federal Government are not directly in the partnership, but helped to finance the project. The operating company is the Cargo Center Graz - CCG KG, which is owned by private carrier and forwarding agencies (51%), the energy service provider ESTAG (25,1%), and the three largest banks of Styria (23,9%). The terminal is financed by the Schieneninfrastrukturgesellschaft SCHIG and built by the Hochleistungs-Strecken AG, both state-owned companies. The SCHIG will lease the facility to the CCG KG for duration of 30 years, who will then become the owner.
Investment costs are about 130 Mill EUR. 80 Mill EUR are covered by federal financing (SCHIG), 50 Mill EUR by private investors. The users will be charged for logistic services.
Supporting measures
The local authorities including the provincial administration supported the project with respect to zoning and legal procedures. The province of Styria supported the foundation of a co-operation called Styrialog which will establish an urban distribution centre (UDC) within the Cargo Center (see project AT-02).
BESTUFS II – D 2.3 Best Practice Update 2007 / Part I 143 Urban freight platforms
Figure 53: Entrance gate and warehouses of the CCG [Dorner 2002b]
Results and experiences
As far as the project has proceeded it seems that the PPP-model works pretty well. The project is on time.
More information Erich Fuchs Cargo Center Graz BetriebsgesellschaftmbH & CoKG Kasernenstrasse 58 8401 Kalsdorf Austria
Key words Freight village, transformation of former cement plant, transhipment terminal, legal incentives for sustainable solutions
Background and objectives
The logistics platform and freight village LGZ Hochrhein (Logistik und Güterverkehrszentrum Hochrhein) is currently taking up operation. The container terminal (consisting of transhipment infrastructure and short-term storage place) being one of its key elements is planned to be implemented in November 2003.
The logistic centre is realised on the premises of a former cement plant that has been shut down about 3 years ago which was a backlash for the economy of the region (jobs, supply of small enterprises). It is expected that the implementation of the logistic centre in Rekingen will improve the economic situation in the region. Due to the special framework conditions (see below: use of existing facilities, location, LSVA) the project is regarded as a viable business opportunity.
Basic approach The logistic centre is situated in Rekingen which lies within a range of around 40 km to the cities of Zurich, Winterthur and Baden, a triangle forming the strongest economic region of Switzerland. It is well located with respect to the local traffic situation as it enables to reach Zurich from the North where traffic jams are less frequent than from the main access in the West.
Enhancing modal shift being one of its main objectives, the logistic centre will be supplied as well by rail as by road. Shuttle trains bring containers from Basel (waterway transport on the Rhine), western Switzerland or Germany to the container terminal. The regional distribution particularly to the conurbation of Zurich will be carried out by trucks. A possible consolidation of various containers for improving delivery efficiency might be done in the logistic centre. As the cement plant was rather transport intensive already, the necessary road and rail infrastructure is given.
The size of the whole Logistic Centre in Rekingen is around 30ha. Essential parts of the existing infrastructure from the former cement production plant can be used for the Logistic Centre, for instance the existing sewage system and many buildings (see Figure 54).
Transhipment in the container terminal is done by a crane. The demand for intermodal transport is estimated between 45’000 and 65’000 TEU/year.
BESTUFS II – D 2.3 Best Practice Update 2007 / Part I 145 Urban freight platforms
Figure 54: Planned segmentation of the platform [Züst 2002]
Institutional and financial solution
The LGZ Hochrhein is a private initiative of a group of local entrepreneurs who want to realise a logistic centre on the premises of a former cement production plant. The feasibility study for the whole project and the planning of the transhipment terminal was done by a private consulting company (RAPP AG).
The whole freight village will be managed by the LGZ AG who rents the area to private companies. The container terminal which is open to every paying customer will be operated by a consortium of several private and semi-private companies. The Federal Railway Company will be a partner.
The logistic centre is a private initiative. However, the transhipment terminal is strongly supported by the government whose stated policy is to support modal shift from road to rail. Around 70% of the investment costs for the container terminal will be paid by the Swiss government. More than half of those 70% is à fond perdu, the rest has to be paid back (at a preferential interest rate). This direct and indirect subsidisation is directly linked to the amount of lorry equivalents transferred from road to rail by the operation of the container terminal (The more lorries shifted from road to rail, the higher the subsidies)!
Special framework conditions
The new logistic centre of Rekingen is taking advantage of the distance-related heavy vehicle fee (LSVA) implemented in Switzerland in the beginning of 2001 which makes intermodal transport more attractive. Heavy goods vehicles are charged LSVA on all roads in Switzerland. Vehicles in unaccompanied combined transport though get 20 or 25 CHF per container or semitrailer reimbursed, an amount that equals a pre- or end-haulage distance of around 40 km. Therefore the location of Rekingen in a range of less than 40 km to the centres of Zurich, Winterthur and Baden is very attractive, as the road leg from/to Zurich is de facto exempted from the LSVA
BESTUFS II – D 2.3 Best Practice Update 2007 / Part I 146 Urban freight platforms
which makes combined transport a viable alternative to road only transport. Figure 55 shows the impact of the LSVA on the mode of transport.
without LSVA
without LSVA
Basel
BadenZurich
Winterthur
Schaffhausen
AntwerpenRotterdam
Road
Rail
Ship
with LSVA
Basel
BadenZurich
Winterthur
Schaffhausen
AntwerpenRotterdam
Rekingen64 km
with LSVA
45 km
36 km
30 km9 km
Figure 55: Impact of the LSVA on the mode of transport [Züst 2002]
Results and experiences
As the project is just about to be realised it is too early for an evaluation of experiences. The project however shows how legal framework conditions (the LSVA in this case) can influence the decisions of private economic actors towards environmentally friendly and socially desirable solutions.
131 km (via CH) / 85km (via D)
107 km
85 km
64 km
BESTUFS II – D 2.3 Best Practice Update 2007 / Part I 147 Urban freight platforms
More information Beni Strub RAPP AG Hochstrasse 100 4018 Basel Switzerland
Member of BESTUFS who did the material collection: Yvonne Züst, RAPP AG
See also References and contact persons!
BESTUFS II – D 2.3 Best Practice Update 2007 / Part I 148 Urban freight platforms
Example 4.4.8: Heathrow (London)
Example 4.4.8: Heathrow Airport Consolidation Centre (London, UK) [Allen 2002, Energy Efficiency Programme 2002, BAA 2002]
Key words Retail consolidation centre, air quality, reduction in vehicle movements
Background and objectives
Retail development within Heathrow airport has increased dramatically over the past ten years, but the infrastructure has seen little change to accommodate this growth. The delivery operation across Terminals 1-4 had evolved over several years and was no longer adequate to support the growing retail business at Heathrow. Particular problems included:
• An overloaded central terminal area and single tunnel access;
• Poor infrastructure;
• A lengthy and unpredictable delivery service.
Congestion, both on airport roads and at loading bays, was a significant problem with 439 supplier movements to 240 retail outlets being made each day.
Figure 56: Congestion at Heathrow terminal 3 delivery point [BAA 2002]
These issues, together with growing environmental pressures and the potential requirements of Terminal 5, demanded a radical re-think of the previous operation. The planned new Terminal 5 is expected to add another 450,000 sq ft of retailing space within the airport, which is approximately equivalent to 250 new retail units. If Terminal 5 were to operate on a similar basis to that used previously at Terminals 1-4, it would require 64 new delivery bays plus a substantial parking area. A lack of space in the proposed site for Terminal 5 prevents this from being a viable option.
BESTUFS II – D 2.3 Best Practice Update 2007 / Part I 149 Urban freight platforms
A study of truck movements at Heathrow was carried out. Various proposals were produced as to how the number of vehicle movements supplying retail units at Terminals 1-4 could be reduced. The study evaluated various retail delivery options and reviewed both the planned infrastructure and new methods of approaching the delivery problem. It was decided that the best combination of traffic volume, physical infrastructure requirements and delivery/handling costs would be met by the creation of a consolidation centre.
Basic approach The study recommended that this consolidation centre be located away from the airport and that all retail merchandise and catering foodstuffs be delivered to it. The only exceptions to this would be newspaper deliveries and high value, high insurance cost deliveries such as cash / bullion. These items should be transferred into the airport directly by their suppliers. This option would also provide balanced benefits to all parties that use, or are affected by, the airport, i.e. retailers, airlines, flight service companies, passengers and the local community.
Institutional solution BAA then sought to develop an alliance with a key logistics operator in order to manage the supply of goods to the retail outlets in the airport. This partnership had four main aims:
• To improve methods of delivery to retail units;
• To reduce vehicle movements through consolidation of products;
• To improve handling at delivery point both on and off the airport;
• To improve management of packaging waste.
The consolidation centre is managed by the logistics provider Exel on behalf of the British Airport Authority BAA. BAA plc is the largest commercial operator of airports in the world. It owns and operates seven UK airports, which together handle over 100 million passengers each year. In addition to airport management, the company’s core skills include retailing, project management and property management and development.
Exel performed a trial of this off-airport consolidation method between March and June 2000, with eight retailers that operated a total of 40 retail outlets across the four terminals. The trial produced a 66% reduction in deliveries to the airport and good feedback from the retailers. Exel was awarded a five-year contract worth 3 million EUR per year to operate the consolidation centre. Operations started in May 2001.
Technical and operational solution
Exel currently operate a 25,000 square ft warehouse at Hatton Cross with five vehicles (4 x 17 tonne rigid box-vans with tail-lifts and 1 x 3.5 tonne with tail-lift) and some 20 operational and clerical staff. Freight arrives at the centre in a variety of packaging from the suppliers. It is subject to security
BESTUFS II – D 2.3 Best Practice Update 2007 / Part I 150 Urban freight platforms
checks, caged and sealed ready for despatch. The seal is part of a DfT approved security arrangement that includes a Rapiscan X-ray machine, operated by trained Exel staff. The vehicles used to deliver goods from the consolidation centre to the airport initially on hire to Exel were replaced by a new company owned fleet in summer 2002. This consists of three tractor units and three urban rear-steer 11 metre box van trailers, with tail-lifts. Two trailers are dual compartment, with a moving bulkhead, and fitted with electric fridge motors to cater for chilled / frozen food deliveries from the cold store.
When the Exel vehicle unloads at the delivery bay within the airport, an Exel employee brings the goods to the store (or stockroom) in a roll-cage together with delivery notes from both the supplier and Exel. Any stock that needs to be transferred between branches within the airport can be labelled with the new delivery address and will be delivered on the next visit to the named branch. A driver and usually two terminal staff man operate each delivery vehicle, which remains at a terminal until deliveries to all the retail outlets are completed. Security checking procedures have been embedded into the system at the consolidation centre, reducing the number of checks that need to be made for vehicles destined airside. All the delivery and terminal staff are screened for security.
Deliveries can be scheduled to suit the retailers’ preference. The conso-lidation centre is now open 24 hours a day, 7 days a week for deliveries and also provides onward transportation and delivery to the airport at any time specified by the retailer. Exel also collect and remove recyclable packaging waste, such as cardboard and plastic. The delivery staff are trained to ensure that they are aware of the environmental role that they can play.
Future development and possibilities
Exel are currently introducing a computerised hand-held tracking system, based on Palm Pilot technology, which uses software specifically written by Exel for the BAA operation. Every carton will be given a bar-coded label, as will every cage so that goods will be scanned in and out of the consolidation centre. Load planning will be performed electronically, producing a full
BESTUFS II – D 2.3 Best Practice Update 2007 / Part I 151 Urban freight platforms
manifest by cage. Each cage will be sealed and tracked as it moves around the airport and will also be scanned at retail outlets. This development will increase the efficiency of this delivery operation still further.
It is planned that the staff responsible for delivering goods into the retail units will be based full-time within the terminals and will not travel with the delivery vehicle. Deliveries will then be made to a dedicated area within each terminal, where the full cages are off-loaded and then the empty cages and cages containing waste packaging are loaded onto the vehicle. A turnaround time of 20 minutes per vehicle at each terminal is expected. These vehicles would contain 15 cages, with each retail outlet receiving 2/3 cages per delivery. This operation will significantly reduce the time taken to deliver to each retail outlet.
All new concessionaire agreements and renegotiated existing agreements at Heathrow will require retailers to use the Exel facility, so that by the end of 2004 all retailers will be incorporated within the system as existing franchises are renewed.
There will also be a study of the possible efficiencies of supply chains both within and between other BAA owned airports. The consolidation centre currently services Gatwick Airport three times a week, and London City and Stansted Airports. BAA is keen to examine how other airport operations in UK could benefit from the use of a consolidation centre in their distribution operations.
Results and experiences
The approach is proving to be extremely effective and won the prestigious Institute of Logistics and Transport Environmental Award 2001. It has gained increasing acceptance as the retailers serviced by the consolidation centre see the benefits for their organisations. There are some 240 retail units currently trading across Terminals 1-4 and Exel’s consolidation centre operation currently services 100 of these. The target was for Exel to service 10% of the total expected volume within the scheme by the end of Year 1, but this target was achieved within six months.
In summary, Heathrow’s new consolidation centre has achieved:
• A reduction in the number of vehicles travelling to the terminals, thereby reducing congestion both within the airport and on the approach roads. These improved traffic flows within the airport benefit all airport users both in terms of reduced congestion and improved air quality.
• A reduction in the number of vehicles passing through control points and driving airside, thus reducing the number of less experienced drivers on these airport roads. Flight operations (e.g. aircraft refuelling, baggage handling, flight catering) have been greatly enhanced by this reduction in congestion.
• Faster deliveries being made to the consolidation centre by suppliers since there is less congestion on approach roads and fewer delays in
BESTUFS II – D 2.3 Best Practice Update 2007 / Part I 152 Urban freight platforms
off-loading goods and loading returns.
• More frequent and scheduled deliveries to the terminal buildings, enabling retailers to know more accurately when goods will arrive, within agreed delivery periods. This helps a retailer to receive merchandise in a shorter time, something that is greatly appreciated.
• Potential savings in both supply chain and staffing costs for retailers using the consolidation centre.
Figure 58: Exel vehicle airside at Heathrow [BAA 2002]
Economic benefits In the last week of January 2002 there were 115 inbound deliveries to the consolidation centre, each with an average turn around time of 12 minutes. The total time that suppliers’ vehicles spent at the consolidation centre that week was 115 deliveries x 12 minutes = 23 hours. Previously suppliers’ vehicles would have made up to four deliveries to the airport (i.e. one to each terminal). Each of these would take approximately 45 minutes to complete. Assuming that a single vehicle would have made an average of three deliveries to the airport, the total time taken by suppliers vehicles to deliver to the airport before the establishment of the consolidation centre would have been 115 deliveries x 3 drops x 45 minutes = 258.75 hours. This also assumes that there would have been the same number of weekly deliveries by suppliers as in 2002.
This corresponds to a saving of 235.75 hours per week, which translates to a cost saving of around 7'000 EUR, assuming a 30 EUR per hour rate to cover the fixed costs of the vehicles involved. Annually this equates to a saving in excess of 370'000 EUR, based on current levels of activity.
Environmental benefits
Annually, 22.15 tonnes of Carbon Dioxide are currently being saved which is equal to the Carbon Dioxide generated by a family car over 123,067 km or
BESTUFS II – D 2.3 Best Practice Update 2007 / Part I 153 Urban freight platforms
7,692 x 10 mile journeys. This reduction in journeys also saves 1.35 kg of Carbon Monoxide, 1.06 kg of NMVOC (Non Methane Volatile Organic Compounds), 3.79 kg of Nitrogen Oxide and 0.28 kg of Particulates a week. Since these savings were calculated at current business levels with the consolidation centre serving only 40% of potential outlets, they are likely to be increased further in the future. Emissions are also expected to reduce when the new alternative-fuelled fleet is introduced. The intention is to use compressed natural gas fuelled vehicles, as they provide the best current improvement to local air quality.
Summary The project has been very successful so far, and it is planned to include all retailers operating within Heathrow by 2004. The partnership between BAA and Exel contributes to the environmental strategy for Heathrow by identifying base data, measuring, monitoring and setting targets to demonstrate the improvement in air quality and packaging waste management – as well as service levels and ease of access. Heathrow airport has seen a significant reduction in the number of vehicle movements as a result of this scheme. On time delivery performance to the retail outlets is currently 95%. BAA have been able to set targets at full implementation of a 75% reduction in the number of vehicles delivering to the airport and a 90% use of vehicle load capacity.
Retailers operating within the airport receive more effective, on-time deliveries on high security shared-user vehicles. The project has been so successful that any new retailer uses the consolidation centre as a condition of contract. With such positive commercial and environmental benefits, this type of solution may be adopted not only by other airports but also by retailing operations with similar congestion problems such as those based in city centre locations.
More information Member of BESTUFS who did the material collection: Julien Allen, University of Westminster
See References and contact persons!
This information has been taken from Heathrow Airport Retail Consolidation Centre, Good Practice Case Study No.402 published by the Energy Efficiency Best Practice Programme in May 2002. The full case study is available on the Energy Efficiency Best Practice Programme website at:http://www.energy-efficiency.gov.uk/document/gpcs/GPCS402.pdf
BESTUFS II – D 2.3 Best Practice Update 2007 / Part I 154 Urban freight platforms
4.5 Synthesis from the case studies
Among the projects collected and studied two main categories of freight platforms can be distinguished: (Multi-company) UDCs and Freight Villages. Although they pursue rather different objectives and dispose of rather different characteristics some common aspects can be stated.
Location For both Distribution Platforms as for freight villages the location of the platform is one of the key factors for success. Being a turntable for goods transports an excellent connection to a (multi-modal) transport network is indispensable.
The location also has a substantial influence on the traffic generated by the platform (as illustrated in Figure 59), and thus on its environmental performance. Choosing a smart location consequently involves a certain know-how about the main goods flows delivered and collected to and from the platform.
Land prices and concentrated local emissions through traffic attracted by the platform make it even more difficult to find a suitable location. In order to reduce the roadside distribution transport mileage the platform would preferably be located close to the city and its commercial centres (short distribution legs, longer rail leg in intermodal transport). On the other hand a central location usually involves high land prices and conflicts with the neighbouring residential areas that are sensitive to the traffic attracted by the platform. Due to the high land costs establishing a freight platform in the city centre will generally only be possible when public areas are provided or subsidies are obtained. Because of the traffic involved a location in the outskirts is often preferred or even legally stipulated anyway (e.g. in the UK). In any case areas suitable for a future freight platform should be identified early enough and secured by land use planning measures.
BESTUFS II – D 2.3 Best Practice Update 2007 / Part I 155 Urban freight platforms
Location 1
Location 2
forwarder to the platform
consignee from the platform
Figure 59: Location of a freight platform and traffic generated [Baumgarten et al. 1996]
Involvement & PPP A clear point made by many projects, successful or failing ones, UDCs or freight villages, is the involvement of all parties, public and private ones. It is one of the main conclusions from over a decade of experience with UDCs in the Netherlands that durable solutions cannot be imposed by one side, but that improvement must be sought together with all players involved (see Annex VI, projects NL-01, NL-02). Also in Thun (CH-04) the success of the (small-scale) project is explained by the fact that the project is embedded in a larger partnership between private actors and authorities (see also project AT-01).
Degree of public intervention
The degree of public intervention varies from one city to another. Projects range from an entirely private initiative (e.g. project CH-02), based on optional participation and the assumption that operators will be rational enough to co-operate, to a local authority initiative quite coercive (e.g.
platform
platform
BESTUFS II – D 2.3 Best Practice Update 2007 / Part I 156 Urban freight platforms
project NL-02) and often based on a “distribution licence” with strong incentives attached to it (extended delivery schedules for example). Particularly the latter might imply the risk of monopoly (one carrier being given exclusivity for inner city distribution) or the risk of over-regulation (in Monaco the government is planning to ban all trucks above 3.5 tons and to create a “goods control squad”). All this multiplies the number of small vans which is not really what is best for the environment. [Savy/Dablanc 1995]
Attractive freight villages
A freight village can only be established successfully when private companies can be attracted to the platform. Therefore, the sustainable profitability associated to operating within a freight platform has to be proved to private companies. This profitability for transport companies can result from a variety of impacts: [REFORM 1999]
• suitable spaces with efficient transport infrastructure
• efficiently used combined transport
• location nearby other transport companies in order to facilitate co-operation
• benefits from additional services provided directly on site
• benefits when distances to customers are reduced.
When a large amount of transport operators and industries are established on the platform the service sector (logistics, customs, restaurants, post office, hotels) will, naturally, be drawn to site.
... with public support
Freight villages (and also UDCs) are often organised as Public Private Partnerships. Public support for freight villages is justified by the freight village pursuing twofold public aims, an economical and an ecological one:
• freight villages increase the region’s competitiveness and may help to attract industry (see e.g. Annex VI, project CH-01)
• intermodal freight villages promote modal shift reducing long distance road transport (see projects CH-01, D-03, AT-01)
Operating a transhipment terminal for modal shift is only profitable when a large freight volume is transhipped. At freight platforms this volume can be expected when: [REFORM 1999]
• the region of the platform is widely integrated into the national and international market
• a high regional freight volume with a strong affinity to freight platforms exists
• the platform is directly linked to a main railway route
• a large number of forwarders are established on site
In order to boost regional economy industrial companies have to be
BESTUFS II – D 2.3 Best Practice Update 2007 / Part I 157 Urban freight platforms
attracted. The decision of industries to locate at a platform depends on a variety of factors such as:
• availability of land
• land price
• availability and cost of educated/specialised labour
• distance to the sales areas
Public support of freight villages can take various forms, such as providing land at low costs, securing of appropriate areas, direct subsidies, etc. They can even be linked directly to the degree at which the public objectives are met (see project CH-01).
Requirements for successful freight villages
Given the mentioned requirements the implementation of freight villages and logistics areas to strengthen the competitiveness of the railway and to attract new industries to the region will only be successful when: [REFORM 1999]
• strong economic links to other European regions exist
• the platform is directly connected to the international rail and road infrastructure network
This strengthens again the importance of the location of the freight village as it has been pointed out by the case studies (AT-01, BE-01, CH-01, CH-02).
UDCs: benefits... From the case studies it has become clear that the transport industry, the public and the consignee alike can benefit from Urban Distribution Centres:
• For the transport economy a specialised city distribution offers efficiency benefits as for the average transport operator distribution is less profitable (or not profitable at all) than long distance haul.55 Furthermore they benefit from co-operation agreements and other on-site services (synergies).
• The public (residents, inhabitants) benefit from a reduction of delivery traffic achieved by better bundling and higher load factors resulting in less noise and air emissions.
• Finally, the consignees benefit from bundled deliveries and from shopping streets more attractive to customers.
... and costs On the other hand UDCs also impose costs, particularly on the involved transport companies, but also e.g. on the residents in the areas surrounding the platform (increased traffic):
• Every transhipment increases transport costs substantially (according to REFORM [1999] 1/3 of distribution costs are caused by transhipment)
55 According to a survey in Düsseldorf [IVM 1995] only 16% of the companies generate profits in the distribution
while 40% indicate that distribution causes them financial losses.
BESTUFS II – D 2.3 Best Practice Update 2007 / Part I 158 Urban freight platforms
• Transaction costs include information exchange but also fear of loosing competitive advantages and contact to the final customer etc.
Profitability and subsidies
There is no clear answer to the question whether the mentioned benefits outweigh the costs. To complicate things, those who benefit are not necessarily those who bear the costs. An answer would probably be case dependant anyway. The public benefits for instance are depending on values and on local framework conditions (in La Rochelle low emissions in the medieval town centre are an asset for tourism). Among the regarded case studies there are both profitable UDCs and others depending on public subsidies. In either case it seems important that those who benefit also pay for the costs. UDCs can (and have to!) generate added value. If the UDC creates substantial benefits for the public, it should also be actively supported by the public. This can be either by providing permanent subsidies, by active participation (co-ordination, promotion, initial financing), by establishing supportive legal framework conditions such as a lorry ban in the city centre or by supportive operational measures such as an extension of access time windows or the utilisation of reserved roadspace and parking/loading space for the transport companies participating in the scheme. The latter explains why UDCs are often mentioned in connection with access regulations (e.g. projects NL-02, CH-03, etc.). In general it can be stated that UDCs should preferably be integrated into general mobility planning.
Telematics / IT Although communication obviously is an key element of co-operation, the supporting technologies such as IT and telematics are not very common yet. Here some potential to overcome the difficulties of UDCs has been identified, as the key to co-ordination of channel flows is information sharing among channel members.
Minimum size ? In Leiden (project NL-02) the break-even point for the UDC was calculated to be at around 2000 shipments per day (or 600 shipments per day with subsidised labour respectively). Although these figures might differ from case to case, they clearly show that a certain volume is needed for a UDC to be profitable. In Leiden it was even found that the inner city alone would be too small an area to generate the necessary volume. On the other hand the UDC in Thun (project CH-04) is running without public subsidies on a very low scale (average delivery of around 50 tons per month in 2001). Obviously the way of calculating costs and benefits can differ (see below).
BESTUFS II – D 2.3 Best Practice Update 2007 / Part I 159 Urban freight platforms
The motivation of the partners involved is often mentioned as key element for success (see projects D-01, CH-04). A successful UDC requires innovative entrepreneurs who also take into account the intangible and long-term benefits and consider their engagement as investment into the future. Long-term advantages for the operating company include
• image gains (innovative and responsible company)
• possibility to pro-actively shape the future market conditions
• enlargement of market shares
• comparative advantage against competitors
USP: Local know-how
The know-how of the local conditions, transport network, obstacles (construction sites), delivery conditions (ramps etc.) and excellent local contacts form an important part of the Unique Selling Position of the UDC as urban distributor for other transport operators (see project CH-04).
The consignees Many forwarders deliver the retailers “for free”, i.e. the transport costs are included (hidden) in the product price. For own-account transport, last mile delivery costs are often not even known. If the distribution chains are switched to a UDC system and the last mile delivery is made by the UDC operator (for a certain fee per shipment) the deliver costs get transparent
BESTUFS II – D 2.3 Best Practice Update 2007 / Part I 160 Urban freight platforms
and the forwarders might seize the occasion and try to pass on these costs to the retailers. Those are obviously not amused. Although they also benefit from the new scheme (more bundled deliveries, more attractive shopping streets), they even complain about more inconveniences, for instance more complicated communication paths in case of problems and complaints. Therefore retailers are not seldom the main opponents against UDCs (e.g. project CH-05). This once again emphasises the importance of bringing together all stakeholders (from large transport operators to retailers and even pedestrians) right from the beginning (see project CH-04).
UDCs and freight villages: synergies
Last but not least: one of the most promising approaches seems to be the combination of UDCs and freight villages in a synergetic way (see e.g. projects D-03, AT-01).
BESTUFS II – D 2.3 Best Practice Update 2007 / Part I 161 Urban freight platforms
4.6 Conclusions and recommendations
4.6.1 Conclusions
Different types of freight platforms can be found across Europe:
Common Distribution Platforms
Distribution Platforms of single companies for improving the efficiency of the company’s distribution process by exploiting intra-company synergies are widespread and common in all countries. However, in accordance with current logistic trends they are increasingly laid out for regional or national distribution rather than urban distribution. They are often sub-optimal from the public’s point of view as they only optimise intra-company processes. Intra-corporate platforms, i.e. platforms that are shared between different companies of large corporations or holdings, can be seen as an intermediate form between single company and inter-company platforms (shared by independent companies).
Freight village: successful
Freight villages are large (usually multimodal) platforms established to make use of inter-company synergies and preferably to increase the competitiveness of intermodal transport. Many are successfully operating in a number of countries (particularly Germany: “Güterverkehrszentren”56, Italy: “Interporti” and France: “plate-formes logistiques”), while others are struggling due to unsuitable location or for other reasons. Generally, freight villages operate rather on a regional or national than on an urban level. In a very promising approach they might be connected to or combined with a UDC to form an urban distribution network.
UDC: Relaunch ? Urban distribution centres of / for several companies are implemented for improving the efficiency of urban distribution and for reducing urban truck traffic. The 90s saw a boom of new UDC projects mainly in Central Europe. Since then, many of these projects have been abandoned due to significant problems (see below). Today, the situation is quite heterogeneous among European countries. While some countries have completely closed the chapter or at least stay very sceptical after the disillusioning experiences (UK, Denmark, Belgium, Greece) others are awaiting a second wave of successful UDCs that have learned from the failures of the past. Given that growing environmental and transport problems will increase the need for action it seems well probable that UDCs will be increasingly discussed again as one possible solution.
Influence of legislation
In most countries there are a number of legal framework conditions that directly restrict or support urban freight platforms. Although legislation does
56 E.g. Cologne, Hamburg, Munich
BESTUFS II – D 2.3 Best Practice Update 2007 / Part I 162 Urban freight platforms
set certain constraints to the establishment of UFPs, there are generally no legal requirements which unnecessarily prevent their establishment. Restricting legislation includes:
• restrictions for particular goods (bundling, insurance)
Supporting legislation includes:
• governmental (co-)funding
• city access regulations favouring UFPs
• road pricing favouring intermodal transport and transport bundling
Main barriers for UDCs
In spite of these promising findings, experience to date has shown just as many failing projects as successful ones, particularly among the UDCs. Main barriers for transport operators to participate in UDC schemes proved to be:
• Increase in transhipment raising costs, risks and delays
• Fear of loosing competitive advantages and contact to customer
• Fear of new dependencies
• Large initiations and co-ordination efforts
• Difficulties in splitting costs, jobs and responsibilities
Often mentioned was the lack of support by public authorities. As a UDC also improves the general situation of urban traffic for the benefit of everybody, the public should also be prepared to support the project. This does not necessarily have to be through financial subsidies but can as well be through the establishment of supportive legal framework conditions.
Also local retailers were reluctant to new delivery schemes involving UDCs.
Success factors The following factors that offer potential (not a guarantee as obviously the final success of a project is case dependant) for a successful implementation of a UDC have been identified :
• PPP: As outlined above, barriers extend among all parties involved, transport industry, retailers and community alike. Therefore at least an informal partnership bringing together all stakeholders at one table is a key factor for a successful and sustainable solution.
• Technology (telematics / IT): Co-ordination, i.e. information sharing among partners, being a core element of any UDC, information technology offers a high potential for increased efficiency that has been rarely used so far.
• Networks (integration of different systems): One of the most promising approaches seems to be the combination of UDC and freight village in a
BESTUFS II – D 2.3 Best Practice Update 2007 / Part I 163 Urban freight platforms
synergetic way, thereby forming an urban distribution network.
• Local know-how: The know-how of the local conditions, transport network, obstacles (construction sites), delivery conditions (ramps etc.) and excellent local contacts form an important part of the Unique Selling Position of the UDC.
• Location: Consolidation and distribution costs depend heavily on the location of the platform. Therefore the location of a freight platform is crucial for its success. Land use planning is necessary to secure the most suitable areas.
• Intermodal access: Taking into account the increasing capacity problems on the road networks of today’s conurbations, rail can play an important role for efficient access to an urban freight platform. New developments for low cost transhipment equipment offer new opportunities with regards to transhipment of intermodal transport units.
• Share of own-account transport: Generally own-account transport offers more potential for bundling among companies, whereas professional transport operators already do bundle goods from different shippers. Thus, the higher the share of own-account transport in the city, the higher the success potential for a UDC.
4.6.2 Recommendations
REFORM Handbook
The suitability of a certain approach and the selection of the ideal platform depends highly on the specific goals of implementing the freight platform and on the local/regional characteristics. Because many local authorities and operators have requested an evaluation scheme to address these questions, REFORM [1999] has developed a handbook that “gives local authorities and transport oriented companies a guideline for establishing freight platforms, taking into account the specific demands of the different actors involved in the planning and operation process.”
Recommendations on project / city level
Although one of the main insights from the assessed projects is that a unique solution, to be directly transferred in different cities does not exist as each city has its peculiarities, the following recommendations on project level can be given:
• Urban Distribution Centres can contribute to solve urban freight problems. However, they are just one among many tools. In order to see if they are of use, a community needs to identify what problems or opportunities it has, and then consider a UDC only as one of several possible options.
BESTUFS II – D 2.3 Best Practice Update 2007 / Part I 164 Urban freight platforms
• An in-depth knowledge of the urban mobility system (offer, demand, logistics chain organisation, stakeholders, etc.) is necessary for understanding what kind of UDC can be realised
• Different tools, regulations etc. must be attentively applied together and harmonised in order to identify “integrated solutions”
• Once the solution identified, it must be implemented step by step, trying to generate consensus among retailers, transport and logistics operators, citizens.
• The system must be open to new participants at any time (no monopoly or oligopoly)
• Vehicle usage and efficiency can be increased even more by additional activities like collecting mail, reverse logistics, etc.
• An integrated approach taking into account access regulations, PPP, vehicle technology etc. is generally more promising.
Role of local authorities
Opinions diverge on the role of local authorities in the process of implementing an urban freight platform. While some projects concluded that “the government has to support the project in the initial phase as well as during operation” (project CH-03), others suggest that “it may not be best for a city government to do more than suggest collocation of 3PL operators and allow the free market to adjudicate who co-operates with whom” [BESTUFS 2002b]. The solution probably must be established on a case by case basis as also suggested by the LEAN and REFORM research projects.
Many city authorities have only limited understanding of the freight transport systems which is a complex system of actors and decisions. Therefore it is very delicate if city authorities try to impose a solution to the market players as it was confirmed by the experiences from the past. However, this does not mean that there is no need for action of local authorities. Together with LEAN and REFORM we would like to encourage cities to:
Facilitating • give active support to promoting the co-operation between market actors that is essential in establishing city logistic solutions and providing multi-modal hubs for freight transfer. The setting-up of regular stakeholder meetings is one aspect of this. Thereby city authorities can act as a sort of facilitator or catalyst for sustainable solutions. A shift from individually optimal solutions to socially optimal solutions requires the involvement of all actors concerned.
Land use planning • identify suitable sites at an early stage and secure them by appropriate land use planning measures
Shaping framework conditions
• shape the framework conditions of the transport market by appropriate regulations that internalise external effects and ideally make the individual decisions of the competing actors converge in a socially
BESTUFS II – D 2.3 Best Practice Update 2007 / Part I 165 Urban freight platforms
optimal solution. If urban freight transport is found to impose external costs on society, road pricing measures favouring combined transport or city access regulations favouring the highly occupied low-emission vehicles of a UDC is not a interference with free market but rather the establishment of “fair and efficient”57 market conditions.
Providing infrastructure
• provide the necessary transport infrastructure in order to guarantee the platform efficient access to the multimodal transport network (e.g. rail and intermodal access).
Policy-based encouragement
• eventually provide direct financial support, e.g. a start-up grant for the establishment of bi-modal transhipment terminals. The use of low-emission vehicles is also likely to need some policy-based encouragement. Whether society is prepared to pay for the environmental benefits it receives from a UDC (by subsidising it) or whether all costs are imposed on the market players (by establishing the necessary legal framework conditions) is a political question that in the end depends on the actual distribution of power.
Role of national policy
Single urban freight platforms enable the transition between local economy and international goods flows. On the national level, important goods flows and integration into the European networks are important stakes. The concerted action of the different stakeholders - hauliers, logistic service providers, clients, cities, regional and national authorities - is necessary in order to elaborate a clear strategy for the integration of the different planning activities on all levels concerning freight platforms.
Knowledge gaps Open questions such as profitability and success factors of urban freight platforms are very much dependent on local framework conditions as well as many of the identified success factors like PPP tradition, communication culture, personal commitment, innovative players etc. Therefore the transferability of research work is rather limited. Consequently the questions to be answered are less analytical questions but rather focused on the need for more empirical experiences.
Research recommendations
Therefore we recommend new demonstrators rather than analytical research projects in order to gain heterogeneous and widespread experience. However, the final benefit of a demonstrator project heavily depends on its evaluation. Therefore a first step might be a in-depth analysis of existing and even former pilots, demonstration projects and experiences (e.g. D-01, D-02, CH-04, JAP-01). Often these projects are independent or provided with very little financial means and have therefore no funds for the necessary evaluation.
57 see the European Commission’s Green paper on “Fair and efficient pricing in Transport” (1995)
BESTUFS II – D 2.3 Best Practice Update 2007 / Part I 166 Urban freight platforms
In the worst cases lack of evaluation means that even the benefits are disputed, in others the success is measured or obvious but the underlying reasons (success factors) are still unknown. Yet, only success factors would allow to multiply the success and the benefits. Therefore new research projects should:
• include demonstrators of UFPs for more empirical evidence
• evaluate in depth existing and new UFP (pilot) projects
• establish benchmarks for UFPs according to their type and local framework conditions (identifying criteria and benchmark levels)
• deepen the understanding of the interdependence between UFPs, access regulations, PPP and telematics applications.
In the long-term UFPs can only be successful if benefits can be generated for all participating partners: social benefits for the public ones, economical benefits for the private ones. Further practice analysis should therefore focus on the conversion of social/political targets into economical values.
One reason for the identified lack of knowledge is that the success factors of UFPs are rather intangibles (as outlined above) and therefore less accessible to quantitative research methods (usually preferred by transport engineers). Therefore more qualitative methods and “softer” research is needed, e.g. about how to promote innovations or about the successful establishment of Public Private Partnerships that proved such a key issue for urban freight platforms. Accordingly the next BESTUFS Best Practice Handbook will cover Public Private Partnerships. Although BESTUFS cannot provide new research, the Handbook will collect practice and experience and thereby identify starting points for further research.
BESTUFS II – D 2.3 Best Practice Update 2007 / Part I 167 References and contact persons
REFERENCES AND CONTACT PERSONS References for road pricing and urban freight transport Baker, Jo 2001 The implications of Urban Road
User Charging for the Distribution of Goods by Road
Presentation at the 6th BESTUFS Workshop, 8./9.11.2001 in Genoa (www.bestufs.net)
BESTUFS 2001a Deliverable D 4.3 First clustering
report www.bestufs.net
BESTUFS 2001b City inquiry: European survey on
transport and delivery of goods in urban areas
www.bestufs.net
Bjornstad, Ola 2001 Oral information by Ola Bjornstad,
Opplysningsradet for veitrafikken (OFV)
Not public
BTS (Bureau for Transport Studies)
2000 Fair and efficient - the distant related Heavy Vehicle Fee (HVF) in Switzerland
available at www.admin.ch/edmz
CAPRI 2001 Concerted Action on Transport
Pricing Research Integration (CAPRI), Final report
www.its.leeds.ac.uk/projects/capri/index.html
CERTU 2001 Tarification des déplacements
automobiles urbains. La question de l'acceptabilité (Urban Road Pricing: The question of acceptability)
http://www.certu.fr/transport/tarification.htm
CORDIS 2002 Community Research & Develop-
ment Information Service (CORDIS), Databases
www.cordis.lu
COST 321 1998 Transport Research COST 321 -
Urban Goods Transport (Final report of the action)
Office for Official Publications of the European Communities 2, rue Mercier L – 2985 Luxembourg http://eur-op.eu.int [email protected]
CUPID 2000 Co-ordinating Urban Pricing
Integrated Demonstrations (CUPID)
www.transport-pricing.net
BESTUFS II – D 2.3 Best Practice Update 2007 / Part I 168 References and contact persons
Dablanc, Laetitia 2001 BESTUFS Material collection on road pricing
Not public
De Moor et al. 1997 Subsidising unsustainable
development www.ecocouncil.ac.cr/econ/sud/subsidizing_unsd.pdf
Egger, Dieter 2001 BESTUFS Material collection on
road pricing Not public
European Commission 2001 White Paper, Eiuropean transport
policy for 2010: time to decide http://europa.eu.int/comm/energy_transport/en/lb_en.html
FISCUS 2001 Cost Evaluation and FInancing
SChemes for Urban Transport Systems (FISCUS), Final report
http://www.cordis.lu/transport/src/fiscus.htm
Forestieri, Francesca et al. 2000 Accessing your capital - the Rome
experience Article in the journal Traffic Technology International (Oct/Nov 2000)
Frey, Bruno / Kirchgässner, Gebhard
1994 Demokratische Wirtschaftspolitik Verlag Franz Wahlen, Munich
Güller et al. 2000 Road pricing in Switzerland, report
D11 of the National Research Programme NFP41
www.nfp41.ch www.admin.ch/edmz
Guttridge, John 2001 Congestion charging - the
operator’s view Presentation at the 6th BESTUFS Workshop, 8./9.11.2001 in Genoa (www.bestufs.net)
Holm, Ove 2001 Oral information given by Ove
Holm, Danish Transport and Logistics Association (DTL)
Not public
Hong, Lo et al. 1996 An Evaluation Taxonomy for
Congestion Pricing California PATH Research Report, California PATH Program, Institute of Transportation Studies, University of California, Berkeley
Howes, Tom 2001 European transport infrastructure
charging policy Presentation at the 6th BESTUFS Workshop, 8.11.2001 in Genoa (www.bestufs.net)
BESTUFS II – D 2.3 Best Practice Update 2007 / Part I 169 References and contact persons
Huschebeck, Marcel 2001 BESTUFS Material collection on
road pricing Not public
ITS 2001 Urban road charging- text edited at
the Institute for Transport Studies, University of Leeds, UK
multimodales et multiservices Report B9 of the National Research Programme NFP41. www.admin.ch/edmz
REFORM 1999 Research on freight platforms and
freight organisation Office for Official Publication of the European Communities 2, rue Mercier L - 2985 Luxembourg http://eur-op.eu.int
Savy M. / Dablanc L. 1995 Logistics and the city - international
experience and the case of the Paris region
Paper presented at the 7th World Conference on Transport Research, 1995, Sidney (Australia)
Schoemaker J. 2002 BESTUFS material collection on Not public
BESTUFS II – D 2.3 Best Practice Update 2007 / Part I 174 References and contact persons
Urban Freight Platforms Strub B. 2002 Transforming a former industrial
area into a distribution platform for Zurich - from planning to implementation
Presentation at the 7th BESTUFS workshop, 25./26. 4. 2002 in La Rochelle (France) www.bestufs.net
Taniguchi E. 2002 BESTUFS material collection on
Urban Freight Platforms Not public
Wichser J. / Schäffeler U. 2001 Städtischer Güterverkehr (Urban
Freight Transport) Lecture paper for the Institute of Transportation, traffic, Highway- and railway Engineering (IVT) at the Swiss Federal Institute of Technology ETH Zurich; Not public
UVEK 1998 Verkehr gestern-heute-morgen:
Daten, Fakten, Politik. Dienst für Gesamtverkehrsfragen. Bern (Switzerland)
Van Duin J.H.R. 1995 City distribution concept: Still
remaining? in: Urban Mobility Professional
Visser et al. 1999 Urban freight transport policy and
planning Paper for the First International Symposium on City Logistics, Cairns (Australia)
Zunder T. 2002 BESTUFS material collection on
Urban Freight Platforms Not public
BESTUFS II – D 2.3 Best Practice Update 2007 / Part I 175 References and contact persons
Persons who provided material on road pricing and urban freight transport Austria Reinhard DORNER/Juergen SCHRAMPF
Advanced Railway Research Centre (ARRC) 217 Portobello S1 4DP Sheffield (UK) United Kingdom Tel. +44 (0)114 2220156 Fax +44 (0)114 2220155 [email protected]
Julian ALLEN Transport Studies Group University of Westminster 35 Marylebone Road London NW1 5LS. United Kingdom Tel. +44 (0) 20 7911 5000 extn 3002 Fax +44 (0) 20 7911 5057 [email protected]
BESTUFS II – D 2.3 Best Practice Update 2007 / Part I 178 References and contact persons
Persons who provided material on urban freight platforms Austria Reinhard DORNER
Department of Civil and Environmental Engineering The University of Melbourne Victoria 3010 Australia Tel.: +61 3 8344 6774 Fax. +61 3 9348 1524 [email protected]
BESTUFS II – D 2.3 Best Practice Update 2007 / Part I 180 References and contact persons
Italy Giovanni RUBERTI
Centro Studi sui Sisteme di Transporto (CSST) Corso Re Umberto, 30 10128 Torino Italy Tel.: +39.011.5513840 Fax: +39.011.5513821 [email protected]
Japan Eiichi TANIGUCHI
Department of Civil Engineering Systems Kyoto University Yoshidahonmachi, Sakyo-ku, Kyoto 606-8501 Japan Tel.: +81-75-753-4789 Fax: +81-75-753-4788 [email protected]
NewRail, Newcastle University Newcastle upon Tyne NE1 7RU United Kingdom. Tel: +44 1226 379789 Fax: +44 7092 119058 [email protected]
Julian ALLEN Transport Studies Group University of Westminster 35 Marylebone Road London NW1 5LS. United Kingdom Tel. +44 (0) 20 7911 5000 extn 3002 Fax +44 (0) 20 7911 5057 [email protected]
BESTUFS II – D 2.3 Best Practice Update 2007 / Part I 182 Glossary and abbreviations
ROAD PRICING GLOSSARY [FISCUS 2001]
average costs (→ marginal costs) Average costs are the simple result of dividing total (fixed and variable) costs by the number of outputs involved in its generation. Having a particular amount of fixed costs, a doubling of the number of users will not lead to a doubling of total costs.
congestion pricing This is a collective term to specify road pricing measures that take into account the degree of congestion in order to price actual car usage. This form of collecting user contributions is capable not only to raise funds but also to incite behavioural change.
electronic urban pricing
This is a sophisticated form of road pricing within an urban environment allowing to charge car usage according to more than one variable (e.g. area and daytime, distance and degree of congestion), achieved by the implementation of electronic pricing systems (e.g. smart cards, radio-controlling, GPS-positioning, etc.).
external cost (→ internal costs) External costs are those cost elements which are carried by an actor different of the actor causing them.
fixed costs (→ variable costs) Fixed costs are those costs which do not change with traffic volume. Important elements of fixed costs in the short run are capital costs for traffic infrastructure or permanent staff. In the long run however all cost are variable.
internal costs (→ external costs) According to the definition of external costs, internal costs denote those cost elements, which are caused and carried by the same actor. If this happens due to policy instruments (e.g. pricing), costs are internalised.
marginal costs Marginal costs are equal to additional costs per additional unit. In transport they reflect those costs occurring, when an additional subject (or unit) is entering a system. For instance marginal congestion costs denote additional time and operating costs due to congestion caused by an extra vehicle. Marginal costs usually are not constant, but depending on the number of subjects who already are in the system. For instance marginal congestion costs rise progressively in relation to traffic flow.
social marginal cost pricing
According to this pricing principle, prices (both in private and public transport) are set equal to the marginal costs arising to society from consuming transport facilities. Regarding the condition “price equals
BESTUFS II – D 2.3 Best Practice Update 2007 / Part I 183 Glossary and abbreviations
marginal costs” this form of collecting user contribution is expected to lead to the best possible allocative efficiency. Its functional and practical feasibility depend on a proper calculation of the marginal costs and on the existence of techniques that are capable to differentiate the cost generators according to the magnitude of their cost generation (e.g. peak versus off-peak, polluting versus non-polluting, noisy versus low-noise, etc.).
social costs Sum of → internal and → external costs. Generally spoken, social costs are economic resource costs imposed on society.
variable costs (→ fixed costs) Full costs can be subdivided into fixed costs and variable costs. Variable costs depend on the amount of users and the traffic volume performed by them. This simple subdivision does not clarify to which degree or to which vehicle group these costs vary. E.g. road maintenance costs vary with the fourth power of axle loads and hence can be regarded as invariant to the number of private road users.
BESTUFS II – D 2.3 Best Practice Update 2007 / Part I 184 Glossary and abbreviations
ABBREVIATIONS ANPR Automatic Number Plate Recognition CNG Clean Natural Gas DC Distribution Centre DSRC Dedicated Short Range Communication EC European Commission EFC Electronic Fee Collection EU European Union GIS Geographic Information System GPS Global Positioning System GSM Global System for Mobile communications GVW Gross Vehicle Weight, maximum rated weight of a truck, including its cargo GVWR Gross Vehicle Weight Rating HACCP Hazard Analysis Critical Control Point HGV Heavy Goods Vehicles IR Infra-Red ITS Intelligent Transport Systems/Services LPR Licence Plate Recognition NGV Natural Gas Vehicles OBU On-Board-Unit OCR Optical Character Recognition, e.g. reading and interpreting number plates by
video control TEU Twenty Feet Equivalent Units UDC Urban Distribution Centre UFP Urban Freight Platform USC Urban Supply Centre VPS Vehicle Positioning System
BESTUFS II – D 2.3 Best Practice Update 2007 / Part I Annex
ANNEX
ANNEX I Situation concerning Road Pricing and urban freight transport within European countries
ANNEX II Overview on existing and planned road pricing schemes in the assessed European countries
ANNEX III Collected case studies (projects-level) - Road pricing and urban freight transport
ANNEX IV Overview on collected road pricing projects
ANNEX V General situation concerning urban freight platforms within countries
ANNEX VI Collected case studies (projects-level) – Urban freight platforms
BESTUFS II – D 2.3 Best Practice Update 2007 / Part I Annex I - 1 Annex
ANNEX I
General situation concerning road pricing within European countries
Country Description Austria Compared to other countries the rapid growth of traffic in Austria seems to be above average. Two main
reasons for this development should be pointed out: The special geographical situation of Austria which leads to ongoing growth of transit traffic. The economic development and liberalisation of Eastern-Europe, especially of Poland, Czech Republic,
Slovakia, Hungary and Slovenia, which leads to growing passenger and freight transport. In 1995 the whole freight transport in Austrian traffic was calculated with 29 Mio. ton-kilometres. Prognosis for 2015 show, that annual freight transport could grow up to 53 Mio. ton-kilometres if no appropriate political measures are taken. Due to this development, traffic and specially road pricing became very sensitive political topics within the last decade. In Austria the Federal Ministry of Transport, Innovation and Technology is responsible for issues dealing with traffic and transport. The awareness nowadays is very high, as people are convinced that the Austrian traffic policy will have a high impact on the economic and social development of the country, even within the next few years. Road-pricing models already existed at the beginning of the 1990´s for special sections of the Austrian motorway-network. As the financial situation became more critical (the government stated that it was not possible to finance the infrastructure any more) the discussion about a national road-pricing system on motorways started. This ended up with the vignette, a toll-system that was implemented in 1997, which was considered to be the first stage towards a modern electronic toll-system to be implemented at a later time. Of course toll systems are never really popular within the population because the benefits from reinvested earnings into infrastructure are not visible in a short-term period. A second problem is, that the population is not content with the condition of the motorway network. It is a quite general opinion that roads are too bad, roadwork is not well organised and work is done too slowly there. Due to this situation the argument is: "Why pay for this?". Generally speaking the Austrian discussion always focused on the motorways. There has not been a public discussion about urban transport or even urban freight transport in detail.
Since the beginning of the 1990´s the discussion focused on a national road-pricing for the motorway-network. To assure the financial and organisational administration of the road-infrastructure a form of Private Public Partnership (PPP) was established. The government decided to found a company (ASFINAG – Autobahnen- und Schnellstrassen- Finanzierungs-AG) which is responsible to execute decisions of the parliament concerning the road-infrastructure. The first act of parliament was to implement the vignette in 1997. Then a new act was decided on, to implement a nation-wide toll-station-system on the motorways. After several surveys and experts consultations is was decided that this system would be far too expensive. The reaction was a new law, which authorised the ASFINAG to put out to tender a modern, electronic-based toll system. In 2006 the Austrian heavy goods vehicle toll was implemented. It is charged on motorways for vehicles with more than 3.5 tons
The Austrian transport service providers are not generally against road pricing, but they insist on a fair solution, that charges cost due to the utilisation. Older models of road-pricing, like the installation of several toll-stations at highway approaches, often showed regional disadvantages for companies. To avoid these disadvantages is one of the main demands from the industry. The other demand is to avoid a "stand-alone-solution" within the European Union. The industry claims for a system that is compatible to the systems of other EU-countries, especially Germany.
Belgium The level of awareness among the different stakeholders can be considered early beginning. In Belgium, the only experiences of road pricing are the Eurosticker and the Liefkenshoek toll tunnel. The Eurosticker is a tax assimilated to income taxes which is levied as a duty for the use of the road network. The Eurosticker is levied on the motor vehicles and the combinations of vehicles which are exclusively destined for the transport of goods by road and whose maximum authorised mass is 12 tons at least. The Eurosticker price is fixed by a scale and varied according to the number of axles, the country of registration and the emission standard (non-EURO, EURO I, EURO II and cleaner). The Eurosticker is due:
BESTUFS II – D 2.3 Best Practice Update 2007 / Part I Annex I - 2 Annex
• for vehicles which are or must be registered in Belgium: as from the first day of the month of their registration in the directory of the Office of Traffic;
• for other vehicles subjected to the tax : as soon as they are travelling on the road system of Belgium, Denmark, Germany, Luxembourg and Netherlands.
The charged fee aims at infrastructure costs. The Eurosticker affects freight transport only. In Antwerpen, the Liefkenshoektunnel between the two banks of the Schelde reduces courses from 70 to +/- 10 km. Five lanes in each direction enable manual payment and 4 lanes are equipped with TELETOL. If paid with TELETOL, the fee is lower than if payment is manual. This road pricing affects both passenger and freight transport. Modification ofthe motorists’ global taxation is a topic of discussion in Belgium. Fixed taxes linked to the ownership of a car (tax on the entry into service and registration tax) could be reduced while taxes linked to its use could increase. The result of such a reform could be a re-allocation of the fiscal pressure which aims to dissuade car use without penalising its purchase. At present nothing is decided. Road pricing measures are rather well accepted from the private car users’ side. They agree to this concept if the revenue is used to finance the road infrastructure. They believe that trucks cause more damage to roads, as a consequence they have to pay more to use the network. From the transport companies’ side, lorry drivers are totally opposed to road pricing. The most popular arguments against road pricing are : • Belgian car drivers are already heavily taxed. • Road pricing systems are not 100% reliable. • The negative effects of the mechanism. Tolling the trips travelled on main roads causes car travellers to
look for alternative routes which do not include tolling sections. It induces a strong decrease of the traffic flows on the tolled roads but, at the same time, the traffic conditions on the other parts of the network are deteriorating and the average speed is decreasing.
• Road pricing penalise commuters and low incomes. For these, car will become a prohibitive luxury. • Macro-economical consequences. Road pricing could influence the enterprises’ localisation. • Road pricing is a system showing a deficit. Its main objective is to reduce cars flows on tolled roads. How
could it be profitable?
The legal framework of road pricing in Belgium is rather complex because of the different legislation levels which are used concerning traffic management and car fiscal system. Traffic management is a regional matter while car fiscal system is a national matter. So the question is which legislation level will apply to road pricing? The most probable solution could be the establishment of an agreement which allocates the revenues of the road pricing between the two levels.
Denmark At present, and for the following two years, a ministerial commission is investigating the possibilities for road pricing in Denmark. Focus is on passenger transport. With a change from social democratic to a new liberal/conservative government the political climate is less likely to be in favour for road pricing in the coming years. Toll fees are collected for vehicles crossing the Great Belt Fixed Link and the Oresund Fixed Link. There has been a small scale project on road pricing called FORTRIN including a test of GPS and GIS-technology commissioned by the Danish ministry of traffic (http://gk48.gk.dtu.dk/ts/fortrin/fortrin.html). There is also a project on road pricing in the city of Copenhagen testing a road pricing system in 500 private cars.
Legislation applicable includes EU-directive 1999/62 and the Danish legal act on road user charge (Euro-vignette).
In principle the professional transport service providers do not like further costs including taxes and duties. A replacement of the diesel fuel excise duty with road pricing might be a possibility. Road pricing is recognised as more fair in regard of time and place of the trip. In general the transport service providers see road pricing as a new means of tax collection. If “road pricing” is going to be introduced it should cover all means of transport (goods, persons, road, rail, air, sea) at the same time.
Finland There exists some interest in road pricing in Finland, but there are no real proposals to start it.in the near future. At present no urban road links in Finland have charges. Helsinki has taken part in a number of EU and national modelling and assessment projects and is currently participating in the CURACAO project that continues the work of the PRoGRESS project.
Finland currently has no legislation to allow road pricing.
BESTUFS II – D 2.3 Best Practice Update 2007 / Part I Annex I - 3 Annex
France Although a very common practice on national highways, road pricing is not much developped in urban areas in France. Urban road pricing was a very controversial issue in the 1990s when a few experiments were proposed or implemented (tunnels in Toulouse, Marseille and Lyon for example). Today the issue is not as controversial and the London and Stockholm congestion pricing schemes raise interest. The metropolitan areas of Lyon, Grenoble and Saint Etienne have been imagining a common strategy for urban pricing. In 2006, the state agency DREIF (transport and infrastructure direction for the Paris region) has proposed to develop a pricing scheme for the urban part of the Paris regional highway network. However, the Paris administration is opposed to a road pricing scheme for the central area. In most French cities’ Urban mobility Master Plans, road pricing remains low in the hierarchy of proposed strategies and measures. Road pricing is often considered unfair to the suburban traveller. Regarding trucks specifically, such experiments as the German LKW Maut or the Swiss and Austrian lorry pricing systems have raised interest from many French regional governments. However, projects are mostly focused on non urban areas. French pricing projects include: • Paris A14 (effective since 1999) : single highway pricing • Paris A86 (in construction) : single highway (tunnel) pricing • Toulouse (1996-1997 then toll abandoned) : single highway pricing • Marseille (effective since 1993) : single urban tunnel pricing • Lyon périphérique Nord (effective since 1997): single urban tunnel/bridge pricing • Grenoble, Lyon, Saint-Etienne (project) : cordon and/or complex area pricing • Paris metropolitan region (2006 proposal) : pricing within the A86 limit. • Alsace region (project) : lorry pricing on highways to alleviate the increased traffic due to the introduction
of the German LKW Maut.
The French law remains quite restrictive. Road pricing is authorised only on new roads or works such as tunnels and bridges during the time necessary to pay back the investments. The law may be changed in order to make it possible for local governments to charge vehicles on existing infrastructure.
Many business or carrier organisations oppose pricing and consider it a new form of taxation on business. However, in regards to urban pricing specifically, professionals are not opposed to road pricing schemes (as long as they do not target too heavily delivery vehicles…), because they may reduce global city congestion, which may be beneficial to business.
Germany The discussion on road pricing in Germany is mainly related to the financing and to the cost coverage of infrastructure in inter urban transport. In general there are shared responsibilities on the financing and levying of charges for the use of infrastructure. The national level sets the general framework conditions (mainly for motorways and federal roads) while lower levels (federal and urban) act on behalf of the national authority. Basically, the following charges on road usage can be distinguished in Germany: Vehicle tax, Fuel tax, Road user charges and Parking fees. On national level, road pricing is not regarded as measure to influence transport demand, but as part of the coverage of the costs for construction, operation and maintenance of infrastructure. For charging goods transport German law foresees taxes on fuel and vehicles. Germany has introduced a distance-based toll for all trucks of twelve tonnes gross vehicle weight and above, in order to redistribute these costs to all users - from inside and outside Germany. This road pricing scheme also consideres different emission levels of the vehicles. The toll amount is based on the truck´s emission category and number of axles, as well as on the length of the toll route. Each vehicle is classified into one of the three categories – A, B or C – depending on its emission category. Because of frequent and regular excess of the European Union air quality limit values for particulate matter and nitrogen dioxide announce more and more cities in Germany announce to furnish environmental zones. Only vehicles which fulfill a certain pollutant level are allowed to enter an environmental zone. Thus the impact of the traffic - as one of the main causer - is to be reduced.
Greece Road pricing is a rather widespread practice in Greece basically at an interurban level and only as regards matters of road maintenance and operation. Most parts of the national interurban road network have toll stations (the newest the road stretch, the more the stations). Especially in newly built roads, tolls are considered to be indispensable, as most of these projects are up to a point self-financed. No major road
BESTUFS II – D 2.3 Best Practice Update 2007 / Part I Annex I - 4 Annex
pricing projects have been implemented as a demand management tool. As regards urban areas, although most of them tend to be congested (with the respective trends being ever increasing), demand management takes place only through access prohibition rather than through road pricing. There is a high awareness of road pricing techniques among transport professionals and some awareness among administrations and politicians. Nevertheless, implementation of road pricing for demand management purposes within urban areas is still considered highly improbable due to the expected low acceptance by the public. Athens, the capital city, has significant congestion problems which at the moment are tackled solely through access prohibition measures. On the other hand, in Thessaloniki, the second largest city of the country, traffic is ever escalating and the use of public transport is decreasing (which means ever more cars on the roads). In their effort to tackle this problem, the city authorities have once considered some measures involving road pricing, which however were abandoned even before they became concrete. Public perception of congestion problems and associated environmental problems is high. Nevertheless, public acceptance of any kind of prohibition counteracting to these problems is relatively low. Solutions involving pricing are even less welcome, especially when they are electronically implemented (e.g. using smart cards, etc) because they are seen also as a violation of data privacy. Perceived lack of public accessibility of pricing measures has always lead to a hesitant attitude of the political authorities when it comes to adopting them. A survey by the TransPrice project which was undertaken in Athens revealed that, from different TDM measures, the highest acceptability was given to improvements in public transport, park & ride and access restrictions. Road pricing methods were generally poorly accepted. The perceived acceptability of road pricing increases when the revenues are used to improve traffic conditions, public transport infrastructure or the environment. For example, when people in Athens were asked whether they would support a traffic demand management measure involving charging motorists a fee for driving in the inner city, 64% of the respondents declared they would support a package including cordon pricing plus revenues allocation, whereas only 16% would support an isolated cordon pricing measure.
Road pricing is subject to the national law mainly. A legal issue that could give rise to certain constraints regards data privacy in some cases of application.
No official view of the professional transport service providers exists on this matter. The fact is that most of these professionals believe (and it is true) that the main source of the congestion problems in the cities nowadays is the unlimited use of the private car. Therefore, professional transport service providers would never accept a road pricing solution that would not “penalise” mainly the private cars but would focus mainly on freight transport. In addition, it must be noted that, the undertaking of deliveries on certain routes in congested cities is in many cases not profitable for the transport service providers therefore, road pricing of these routes would further surcharge excessively their operation.
Italy Road pricing schemes exist in Italy today in the form of “park-pricing” in almost all the Italian cities. Specific road pricing schemes are being investigated in cities such as Rome and Genoa to reduce traffic and to protect the environment of the historical areas. Work is still continuing on a national level based on the “access control” approach. Technical, political and social issues, environmental policy and pricing criteria (including exemptions) are under examination in two main projects respectively in Rome and Genoa.
National legislation already exists in Italy to support road pricing initiatives. Two main acts exists today: • Road code which authorises road pricing when used to protect historical centres; • “Decreto Bassanini” that authorises the remote issuance of tickets for non-compliance with restricted
areas (i.e. the possibility to use ITS technologies for enforcing these areas). Netherlands The awareness of road pricing among the different stakeholders is high in The Netherlands. The Ministry of
Transport (Verkeer en Waterstaat) has been working on this subject since the early nineties. As a result in the past decade there have been many discussions in the media and in the Parliament about road pricing issues. The topic road pricing is regularly addressed in the media. There is already a kind of road pricing scheme for Heavy Goods Vehicles over 12 tons GVW which must have an Eurovignette for using the motorway network (besides in The Netherlands, the Eurovignette is also operational in Germany, Belgium, Luxembourg, Denmark and Sweden). The Ministry of Transport however wants to introduce a road pricing scheme in order to fight congestion. First the plan was to introduce a vignette for driving in peak hours (Spitsvignet). Later this plan was abandoned and converted to create a
BESTUFS II – D 2.3 Best Practice Update 2007 / Part I Annex I - 5 Annex
cordon-pricing scheme around the 4 major cities in the Randstad area (Amsterdam, Rotterdam, The Hague, Utrecht). In the beginning of 2001 this plan was abandoned also and now the Ministry of Transport heads towards introducing distance related (km) based road pricing scheme for all vehicles, all roads in the whole of The Netherlands. This km-based road pricing scheme for The Netherlands is to be introduced from 2004-2006. The Cabinet and the Parliament support the current plans of the Minister of Transport (Mrs Netelenbos) since the proposed km-based RP system makes the tax system more fair and supports the ‘user pays principle’. The main objective of introducing road pricing is to fight congestion, however there is now a tendency to satisfy also fairness objectives as well (user/ polluter pays principle). By means of making fixed costs variable using a distance related RP scheme with (on a later stage) differentiation to time and place the Ministry of Transport wants to catch both objectives in one scheme. The general acceptance for the current plans are rather high although there are doubts that a flat-rate km based RP scheme will actually lead to a decrease of the congestion problems. In the current plan the main issue is how to ensure the privacy of the driver. To solve this on board units are foreseen that directly calculate the cost. Furthermore the less populated provinces claim that there is an unfair situation because the road usage costs are at the same level in cities as in low populated areas with much less road infrastructure. The Dutch transport industry doesn’t want to pay more than in the zero-state situation and if they have to pay more then there should an equal development in other EU countries (especially the neighbouring countries) and in other transport modes as well in order not create any market disruptions. Private car users (which are of course the voters for the parliament) don’t favour road pricing either if it leads to an increase of their costs without proper usage of the revenues (earmarking it to transport infrastructure). This became clear while the Ministry of Transport developed the Rekeningrijden system where there was a big resistance from the motorist association called “ANWB”. This passage/cordon system to fight congestion was seen by the public as being a new way of taxation for car usage just to increase the money in the Public treasury.
Currently only the Eurovignette is the existing road pricing scheme. There is one other piece of infrastructure that is financed by passage tolling and this is the Kiltunnel. For other types of road pricing schemes new national laws have to be proposed. Legal constraints are in the protection of privacy of the driver, ensuring fair competition and equal treatment. In The Netherlands road pricing is a national issue but discussions take place with representatives of provinces, regions and cities.
The professional transport operators do in principle agree with introducing a road pricing scheme with the objective to fight congestion and with the polluter pays principles. This is because they expect/ hope that making fixed costs variable and congestion charges will lead to less private cars using the roads so that the driving times can be reduced (higher average speeds) leading to an efficiency gain. Although commercial operators will have to pay the charge as well, their high value, it is expected that introduction a road pricing scheme for fighting congestion will result in a net benefit. However some commercial operators are having doubts about the effectiveness of the proposed system and therefore doubt whether it will be resulting in a net benefit for them. The key question is in fact does the scheme really lead to a decrease of congestion?. At the objective of full internalising external costs the operators have a reserved attitude. The road transport sector pays already a big share of its external costs by means of the fixed taxes and the fuel tax that has to be paid. They fear market distortion because of unfair competition with other modes (rail and waterway doesn’t pay for external cost) and unfair competition with foreign transport companies. Therefore, the Dutch association for road hauliers (TLN) has stated that they accept the road pricing scheme but that this should not result into a raise of the total tax pressure on the road transport sector as a whole. They state that if there will be a higher tax pressure then there should be an equal development on road pricing in other EU countries and also other modes should be treated equally and pay for their external costs.
Norway In Norway, several road pricing schemes are operational, from single road pricing approaches to network pricing as well as cordon pricing such as the toll rings around Oslo, Trondheim and Bergen. These toll rings solely aim at financing transport infrastructure, but there are plans to extend the concepts in order to manage demand.
According to the law (Vegloven) road pricing can be introduced in Norwegian cities if the local authority wishes to. The final decision has to be taken by Parliament. However, the toll rings around many cities are not defined as road pricing, and road pricing and tolls can not be used at the same time.
Transport professionals are generally against road pricing, but the toll road systems have funded a lot of new
BESTUFS II – D 2.3 Best Practice Update 2007 / Part I Annex I - 6 Annex
roads and given less congestion and better traffic flow. Many providers are in favour provided there are significant road improvements as a consequence of charging.
Spain The subject of road pricing has been completely abandoned in Spain. No city is thinking about the implementation of a road pricing system. These kinds of measures are completely at odds with the Spanish mentality which hinders the future development of road pricing. As an example: people do not pay the parking meter without the municipal authorities being able to enforce it.
Professional transport service providers are against road pricing. Among other reasons road pricing is opposed because it will lead to a concentration in the transport market: competition increases and big companies can take up the pricing, whereas small companies or independent operators might be forced out of the market.
Sweden Most important development in terms of road pricing was the permanent implementation of the Stockholm congestion charge in August 2007. After the trial in 2006 ther was change in public view as the aims (such as reduced congestion, and traffic nuisances) were achieved. The implementation not only needed local but also national agreement on the scheme. Gothenburg has been the site for a number of trials involving road pricing technology and further trials as part of the PRoGRESS project are currently underway. As yet there has been no official proposal for a road pricing system in the city.
In general reluctant to pay added costs. Support is dependent upon the use of funds and whether the charges will be revenue neutral. The use of incomes for improving conditions for road users, as in Norway, would make the charge more acceptable and a reduction in fuel duty or vehicle excise duty to lessen the impact of charges may also be required.
Switzerland Urban road Pricing is a sporadic topic in the media and on the political agenda. Left wing and green politicians deem urban roadpricing as an answert to today’s traffic related problems and to future traffic growth. This would be an alternative to a rise in fuel taxes which is seen as unfair, as with general fuel taxes rural areas are cross-financing urban areas. An increase of this tax has been rejected several times in the last years, and is today under consideration in the form of a CO2 emmission tax. The use of public roads is free of charge by constitutional law. There are some exceptions to this rule. Users of the national highway network are charged 25 EUR per year (“Autobahnvignette”). This is a flat rate which is independent of whether the network is used regularly, for long or short distances, day and night, etc. Furthermore, Heavy Goods Vehicles (HGV) are charged a fee (LSVA) for every driven kilometre on all public roads within Switzerland according to their weight and emissions. This system was introduced in 2001. The LSVA was heavily debated in the media as well as in the public during the time before the public vote. In the meantime (2007) the scheme is well established and widely accepted. A third in crease of the fee (which allows the maximum charge of CHF 315 per heavy vehicle transit from Basel to Chiasso) is due for 2008. However, apart from the Heavy vehicles fee (LSVA) there are no planned road pricing measure for Swiss cities not even on a general project level that could be discussed in the public. There have been 3 projects for new infrastructure that were planned being financed by road pricing, but the projects have been rejected for other reasons (Geneva: Traversé de la Rade; Bern: Schanzengraben; Rapperswil: Seedamm). In the City of Berne experts (ECOPLAN) have proposed road pricing combined with parking fees. The idea has been taken up into the official transport planning but after lively public discussion the topic quickly disappeared again. In the city of Zurich road pricing has not been considered yet by transport officials but there are political iniciatives which aim at solving traffic nuisances in Zurich by city access charge. And there were ideas to finance new infrastructure projects by means of single road pricing (e.g. tunnel under the lake of Zurich). The Road Transport and Traffic Telematics Strategy for Switzerland (RTTT) (“Leitbild Strassenverkehrstelematik SVT-CH 2001”) postulates in the last of its 10 principles road pricing trials in urban areas (based on extraordinary parliamentary permission). However, Road pricing was one of the two most heavily disputed principles in the RTTT. Probably, road pricing would only gain the necessary acceptance by the public in the next years when congestion would increase substantially which might be the case in the long-run. Need for action is seen rather for highway-bypasses and city-access axes than for the city-centres.
Road Pricing is increasingly seen as an additional measure for financing infrastructure projects or for managing transport demand. However, even the left wing and ecological politicians who generally are more sensitive to transport problems do not see road pricing as a panacea but rather as complementary step to
BESTUFS II – D 2.3 Best Practice Update 2007 / Part I Annex I - 7 Annex
other measures. Whereas some of them still consider fuel taxes as “the fairest solution”, others locate the main problem in the never-ending construction of new roads. Many right wing politicians and liberals are generally against any fees because they consider them as a new form of taxes. Others would accept road pricing as a financing measure for a certain infrastructure (e.g. a tunnel), but not as a demand management tool. This corresponds with the findings of a public opinion survey in 2000: The majority of the Swiss rejects road pricing as a measure to adjust transport demand. Within the PRIMA project interviews with 30 stakeholders led to the following general opinion patterns: [Güller et al.; 2000;S. 44-48] • Right wing / liberal politicians: some are absolutely against road pricing, for others it is only an option of
last resort (if all other measures didn’t work out). • Left-wing / green politicians: The initiative for urban road pricing has to come from the cities themselves.
Road pricing is seen as one possible measure among others. It is not a priority issue and more potential is attributed to other measures such as reducing parking spaces, speed limits, stricter enforcement in residential areas and supporting bicycle transport.
• Car-Lobby: There is no need for road pricing as congestion is scarce, ecological quality high and road financing assured. Road pricing is considered acceptable at all only if the revenues are used for financing new road infrastructure. Furthermore the charged fees have to be transparent all time and there should be an alternative route free of charge.
• Public transport-Lobby: Road pricing is seen as an important tool for transport demand management in the future. It should aim at increasing cost-coverage of urban traffic. The final goal is an distance-related electronic road pricing with differentiated fees according to the level of congestion and the vehicle’s emissions.
• Transport experts: A majority of the population is against road pricing. To increase acceptability road pricing must be favourable for road users too. But as long as congestion does not increase road pricing will not find a majority. Road pricing is seen as demand management tool rather than as financing measure. Road pricing is not a taboo but it is not on the political agenda as the main part of the Swiss road network is considered free of congestion. However, especially in urban areas congestion is expected to increase within the next years.
Popular arguments against road pricing are that the level of the levied fee is arbitrary and that road pricing might be abused as another fiscal instrument in order to increase state revenue. Within the European PRIMA project (PRIcing Measures Acceptance) there have been representative public opinion polls among 500 citizens of the cities of Berne, Zurich and Geneva. The results can be summarised as follows: [Güller et al.; 2000] People do perceive motorised urban transport as a problem, especially with regards to parking and congestion. In Zurich and Bern the solution to these problems is seen in improved public transport and in the polluter pays principle. Nevertheless, there is no stable support for road pricing. [S. 25] Road pricing is rather accepted as “facilitating instrument” for financing measures towards sustainable mobility (particularly public transport) than as a form of “punishing” undesired behaviour. In contrast to other European cities public transport is considered quite good. This holds especially for the German speaking cities of Switzerland. Several results indicate that road pricing issues are dividing Switzerland: whereas in Zurich and Bern people think that road users are prepared to pay for time gains the citizens of Geneva don’t agree and rather stress the already existing taxes levied with motorists. Also the general rejection of road pricing measures is much more distinct in Geneva than in Zurich and Bern. The road account or the comparison between road-related taxes to total road expenditure is more or less in equilibrium (neglecting external costs). But the vertical division between federal, regional and the municipal level shows a striking imbalance. Especially large cities which have to carry high road expenditures carry an overproportional burden of road expenditures which they finance through general taxes. Thus the metropolitan citizens cross-finance the road-users from the conurbation.
Article 82 of the federal constitution states that the use of public road is generally free of charge. Exceptions are made for Heavy Vehicles (Art. 85) and for the network of national roads (Art. 862). General introduction of road pricing would thus require a change in the constitution which is linked with a public vote. If accepted, also the federal law on road transport would have to change (and probably other federal, regional and municipal laws). However, the parliament can allow road pricing for single projects (e.g. pilots). The legislation level applicable depends on the character of the roads to be priced. In any case the superior law has to be
BESTUFS II – D 2.3 Best Practice Update 2007 / Part I Annex I - 8 Annex
respected. United Kingdom
In the early 1700s the British Parliament put in place legislation to allow the introduction of turnpike companies. These were private businesses that constructed and maintained roads using the income obtained from charging for its use. By 1830 there were more than a thousand turnpike roads covering a total of approximately 50,000 kilometres. With the introduction of the railways the turnpike roads lost business and in 1888 most roads in the UK became the responsibility of the newly established local authorities. There are still a few cases of tolls for the use of roads, road bridges and tunnels in Britain. There are tolls for vehicles at the following (inter-urban) locations in England: M6 toll road, Humber Bridge, Tyne tunnels, Mersey tunnel, Dartford crossing and tunnel, Middlesbrough Transporter and Newport Transporter bridges, Itchen Bridge, and the Tamar Bridge. In addition, there are at least 15 other ancient toll locations on bridges and roads in England. In Scotland there are tolls on the following bridges: Skye Bridge, Forth Bridge and the Tay Bridge. In Wales there are tolls on the Severn Bridge and the Cleddau Bridge. On an urban level, road pricing schemes exist in two British cities: London and Durham. The M6 Toll (often referred to as the Birmingham Northern Relief Road or BNRR) was constructed in order to provide a motorway link around the northern and eastern edge of the West Midlands conurbation with the aim of relieving pressure on the congested M6. The road was privately built at an estimated cost of £900 million (€1.5 billion) and is being operated and maintained by Midland Expressway Limited (MEL) for 50 years. It opened in December 2003. It connects Junction 4 of the M6 motorway with Junction 11A of the M6. It is 43 kilometres of three-lane motorway and its operators estimate that it provides a time saving of 45 minutes. When the M6 toll first opened the charges were £2 (approx. €3.20) for cars, £5 (approx. €8) for vans and £10 (approx. €16) for lorries. The lorry toll was reduced to £6 (approx. €10) in 2004 due to fewer than expected lorries using the road. It has since risen to a current toll of £8 (approx. €13), A slightly lower charge is made during off-peak hours (23:00 - 06:00). Users can pay the toll either at a junction, at toll plazas at certain points across the road, or electronically using a tag system. Approximately 50,000 vehicles use the M6 toll on a typical weekday. A UK government-commissioned report (The Eddington Study) published in 2006 has suggested that a national road-pricing scheme could bring benefits of up to £25bn a year by 2025. The central government is keen to study and promote road pricing at both national and urban levels. However, road pricing at a national scale is probably still at least ten years away in terms of the technical issues is raises. After a consultation exercise in 2002, the British government planned to introduce a distance-based lorry road user charge by 2008 which would ensure that lorry operators from overseas pay their fair share towards the cost of using UK roads. The new charge was to be accompanied by a reduction of existing taxes ensuring that the UK haulage industry does not pay any more than today. According to the government's provisional view the charge would apply to all lorry operators regardless of their nationality, apply on all UK roads, vary according to the characteristics of the lorry (e.g. weight, axle structure, emission standard), vary according to the type of road (e.g. charging less for motorways) and have the potential to vary according to the time of the day (e.g. different tariffs at night and during daytime). However, the UK Government announced in July 2005 that it would not now proceed with the introduction of this lorry road user charging scheme. The UK government facilitated the introduction of urban road user charging through the Greater London Act and The Transport Act 2000 by giving powers to the London mayor and to local authorities outside London to introduce charging schemes. The Treasury agreed to road user charging revenue hypothecation, allowing net charging revenue to be ring fenced for local transport measures for a minimum period of 10 years. The city of Durham was the first UK city to make use of the government legislation which allows the introduction of road pricing schemes in town centres. It was felt by Durham City Council that unnecessary vehicle activity within the historic core of the city on the Durham Peninsula World Heritage Site was creating a congested environment, which detracted from the attractiveness of the area and gave rise to conflicts with pedestrians. The scheme was introduced in October 2002 and covers just one street (Saddler Street). A flat-rate charge of £2 (approx. €3.20) is charged to access this street during specified times (currently 10 am to 4 pm), apart from those for whom access is essential who will receive permits. Permit holders include the residents in the area who have off-street parking, establishment who have paring such as Durham Cathedral and Durham University. The access to the street is controlled by a bollard. Approximately 100,000 vehicle drivers pay, when they leave the street, the charge each year. A park and ride scheme was introduced in Durham in 2005, which provides a bus service to cater for tourists, shoppers and workers travelling to the city
BESTUFS II – D 2.3 Best Practice Update 2007 / Part I Annex I - 9 Annex
centre. A congestion charging scheme was introduced in central London in February 2003. It contributes to four of the Mayor of London’s transport priorities, as set out in the Mayor’s Transport Strategy, to: • reduce congestion; • make radical improvements to bus services; • improve journey time reliability for car users; • make the distribution of goods and services more efficient.
In addition, by reducing traffic levels the London scheme has also contributed to reduced vehicle emissions. It also generates net revenues to support the Mayor’s Transport Strategy more generally. The London congestion charging zone initially included the whole of the City of London (London’s financial district, and the West End (the city's main commercial and entertainment centre), with an area covered by the scheme of approximately 22 square kilometres. In February 2007 the original central London congestion charging zone was extended westwards, creating a single enlarged congestion charging zone. This extension approximately doubled the area of the London congestion charging zone. All drivers entering the London charging zone were initially charged £5 (approx. 7.50 EUR) a day to drive within the zone between 07.00 and 18.00, on Mondays to Fridays. This was increased to £8 (approx. 12 EUR) in 2005. There is no charge at weekends or on public holidays. Several exemptions and special tariffs are available for special transport vehicles. There are no tollbooths or barriers around the London congestion charging zone and no paper tickets or licences. Instead, drivers or vehicle operators pay to register their vehicle registration number on a database for journeys within the charging zone during charging hours for single or multiple charging days. The vehicles are not required to display a licence in the London scheme. The registration numbers of these vehicles are entered into a database. The number plates of vehicles entering or moving within the central zone are observed by a network of 700 fixed and mobile cameras. Failure to pay the congestion charge or pay or register correctly for a discount results in a PCN of £100 (approximately 160 EURs) being issued to the registered keeper of the vehicle as supplied by the DVLA. Traffic entering the central London charging zone during charging hours in 2006 was 21% lower than before charging in 2002 (vehicles with four or more wheels). Bus patronage has increased sharply since the scheme was introduced (passengers entering the central charging zone by bus increased by 37% during charging hours in the first year of the scheme). Transport for London (TfL) has calculated that, comparing average congestion levels for 2006 against a pre-charging baseline in 2002, congestion was 8 percent lower in 2006. This compares with an average reduction of 30 percent in 2003, the first year of the scheme. It is thought that congestion levels were being negatively influenced by an increase in streetworks in the latter half of 2006. It has also been estimated that the London congestion charging scheme directly leads to between 40 and 70 fewer personal injury road traffic accidents in the charging zone per year. In the first three months of the western extension (February to April 2007), traffic entering the extension zone was down by between 10-15% against comparable pre-extension data. There is some evidence from recent counts that traffic entering the original central zone has increased by up to 4% since the introduction of the western extension. This may in part reflect an increase in discounted trips to and from the original central zone by western extension residents. The first comprehensive survey of congestion in the western extension zone gives a representative reduction of 20-25% over equivalent conditions before implementation, based on a night-time (uncongested) travel rate of 1.8 minutes per kilometre. Results from TfL research and an independent external audit of the TfL monitoring programme suggests that congestion charging has had a broadly neutral impact on overall business performance in the charging zone. However, some retailers and retail groups believe they have been adversely affected. The number of Penalty Charge Notices (PCNs) issued in the London scheme has gradually reduced and compliance has improved since the scheme was introduced. The London congestion charging scheme produced a total provisional revenue of £123 million in 2006/7, and had operating and administration costs of £90 million, thereby providing a net provisional revenue of £123 million. Residents of Edinburgh were given the opportunity to vote for whether or not they wanted an urban (£2) congestion charging scheme in 2005. The vast majority (62%) of residents voted against the proposed scheme. Ten authorities (in Greater Manchester; west Midlands, incorporating Birmingham, Wolverhampton and
BESTUFS II – D 2.3 Best Practice Update 2007 / Part I Annex I - 10 Annex
Coventry; east Midlands, in a joint bid by Leicester, Derby and Nottingham; Tyne and Wear; Durham; Bristol; Reading; Cambridgeshire; Shrewsbury and Norwich) expressed interest in road pricing and were provided with funding by central government in 2005 and 2006 from the newly established Transport Innovation Fund to consider road pricing schemes in greater detail. In 2007, the central government published a draft Bill updating the rules for local authorities who want to set up road pricing trials. Greater Manchester could introduce congestion charging on key routes into the city by 2012 or after. All the Greater Manchester local authorities met in January 2007 and agreed in principle to a charge on 15 roads. In the West Midlands a body that represents local and transport authorities from across the region has produced a green paper which lists congestion charging as one of a number of options. But no decision has yet been reached and the authorities believe any scheme would be dependent on major improvements in public transport and would not be in place before 2014. The city authority In Derby has proposed congestion charging; Derby together with Nottingham and Leicester are carrying out a project to study traffic in the East Midlands and to consider the potential of congestion charging. Cambridgeshire County Council is using its funding from central government to carry out a study to find ways of reducing congestion; a report is due later in the year. Further local charging systems in urban areas could potentially be implemented within the next five years, but none of the cities that have considered road pricing schemes are at the point of putting them into practice yet. There have recently (July 2007) been allegations that in some areas local authorities have felt they are being pressured into signing up road charging schemes. Members of Parliament in these areas have suggested that funding for new road improvement schemes was being withheld. In addition to some opposition from local politicians, the central government views on road pricing are also the focus of distrust among a vocal and large group of the general public. Almost two million people signed an online petition on the Downing Street website in 2007 which called on the Prime Minister to abandon the government’s positive stance towards road pricing.
BESTUFS II – D 2.3 Best Practice Update 2007 / Part I Annex II - 1 Annex
Annex II: Overview on existing (in bold) and planned (in brackets) road pricing schemes in the assessed European countries, according to extension and transport charged
Extension Charged transport
Type urban non-urban both passenger freight both
single road pricing AT, BE, DK,
GR, NL, CH
F, NO (D, F,
NO)
AT, BE, DK,
F, GR, NL,
NO, CH (D, F,
NO)
network pricing
AT, GR, CH,
NL, DK, BE,
SE, D (GB,
GR)
NO (NO) CH
NL, D, BE,
SE, DK, AT
(GB)
AT, GR, NO
(GR, NO)
area pricing AT (NL) AT, BE (NL)
cordon pricing NO, SE, UK
(NO, BE)
NO, SE, UK
(NO, BE)
complex area pricing CH (NL) CH (NL)
BESTUFS II – D 2.3 Best Practice Update 2007 / Part I Annex III - 1 Annex
ANNEX III
Collected case studies (projects-level) - Road pricing and urban freight transport
Code City/Region Name of concept Short description of concept
AT - 01 Austria Toll-vignette
(existing inter-urban network pricing scheme for financing road infrastructure)
The toll-vignette system was introduced on the whole network of motorways in the country in 1997 because the costs for providing and improving the road infrastructure were raising permanently and it was no longer possible to finance this expensive system without generating any appropriate earnings. Since then, everybody who wants to use any part the 1789 km of motorways in Austria has to buy a sticker (the vignette) that has to be put on the front window of the car. It can be bought at motorway stations, tobacconist shops, etc. The vignette is a pre-pay time-based system. You can buy a vignette valid for 10 days, 2 months or a whole year which entitles you to use all motorways within that period. The prices are depending on the vehicle type. A sticker valid for one year costs 29 EUR for Motorbikes, 73 EUR for cars, 581 EUR for Heavy Goods Vehicles below 7.5 tons, 727 EUR for Heavy Goods Vehicles between 7.5 and 12 tons. For heavy goods vehicles with a total weight of more than 12 t a special tax ("Stassenbenützungsabgabe", see AT - 04) has to be paid instead of a vignette. The toll-vignette system is run by the ÖSAG, the Östereichische Autobahnen- und Schnellstrassen-Aktiengesellschaft, which is owned by the Austrian federation and various federal states. The toll vignette does not aim at managing demand, but at generating revenues which are re-invested in the road infrastructure. In 2000 approx. 15 Million vignettes have been sold generating revenues of around 192 Million EUR. Out of these over 85% are paid by car or motorbike users. The vignette has no visible impact on urban freight transport. The vignette is quite efficient in generating revenues, practical and accepted. However, the system is not able to charge the effective utilisation of the motorways. A driver using the motorway daily pays the same as another driver using it every two weeks once. [www.asfinag.at]
AT – 02 Austria Toll for defined motorway sections
(existing inter-urban single road pricing scheme for financing road maintenance and partly for demand management)
This toll is levied by the ÖSAG (see AT - 01) on 5 sections of motorways which show a very high traffic frequency because of transit traffic. These sections are mainly in the Alps and have very high maintenance costs. The main objective of the charges is to finance maintenance of these inter-urban motorway sections, partly also to reduce demand. The charged fee is depending on the kind of vehicle used, the period of validity, if the car has a vignette, if the driver is a commuter, etc. The toll has to be paid at toll-stations when entering the special section of the motorway.
The acceptance for these tolls is very low. During the years there has been permanent protest from the local and foreign transportation service industry. This conflict reached its peak when the EU brought in a charge against Austria because of the "Brennermaut" (toll for A13 Brennerautobahn). The EU withdrew the charge after negotiations with Austria and Switzerland, which had a very important role in this conflict. [www.asfinag.at]
AT - 03 Austria Electronic pricing system for Heavy Goods Vehicles (HGV) with a total weight of more than 3.5 tons
Throughout the years there have been various discussions about implementing a toll-system that is charging the effective utilisation of roads. The vignette is not able to fulfil this demand, the toll charged for special motorway sections shows strong disadvantages for persons/organisations operating in this areas. Therefore, a new system should guarantee that
BESTUFS II – D 2.3 Best Practice Update 2007 / Part I Annex III - 2 Annex
Code City/Region Name of concept Short description of concept
(Planned complex inter-urban network pricing scheme for financing road infrastructure and partly for demand management)
the amount charged is depending on the "real" utilisation (time, distance,...) of the road without making the cars stop when entering the network. To fulfil these requirements an electronic system is planned to be implemented in 2004 for the whole Austrian motorway network. The legal basis for implementing this system was set up by the Austrian government: "Bundesstraßenfinanzierungsgesetz" (BGBl. Nr. 142/2000 from 16.01.2001). The prices are not fixed already and there is an ongoing political discussion about the price structure. The fist suggestions were: € 0,14 per km (for vehicles with 4 or more axles), € 0,12 per km (for vehicles with 3 axles) and € 0,09 per km (for vehicles with 2 axles). The revenues should only be used to finance the maintenance and expansion of the road infrastructure. Today there are many controversial opinions weather this system is able to finance the Austrian infrastructure or not. Some believe that the system is only able to finance its own costs or even makes a loss. The discussion is not over yet, and will be strongly depending on the systems offered in the tender procedure. [www.asfinag.at]
AT - 04 Austria Strassenbenützungsabgabe (StraBA)
(existing time-dependent area pricing scheme for generating non-earmarked federal revenues and partly for demand management)
The StraBA is a tax for HGV with a total weight of more than 12 tons that is levied since 1995 by the Federal Ministry of Finance. It is obligatory for the utilisation of the whole Austrian road-network for vehicles permitted in Austria or non-EU member countries. For vehicles permitted in another EU-country than Austria it is only obligatory for the utilisation of the motorway-network. Several special transports are exempted from the tax, such as road-cleaning vehicles, military, vehicles used for agriculture and forestry, etc. Basis for the federal law is the EU-directive 93/89/EWG from 1993-10-25. This directive assigns the EU-members to install federal taxation-laws for specially defined freight transport vehicles. The tax is calculated according to the amount of axles and the degree of noxious emissions (EURO II, I, other). The earnings from the StraBA are approximately 72 Million EUR per year. These earnings go directly into the national budget and are not earmarked for road-infrastructure. Especially this is often criticised by the transport service industry. [www.bmf.gv.at]
AT - 05 Graz Impact analysis of urban road-use pricing on travel behaviour, the environment and the economy (Dissertation)
(Study on an urban cordon pricing scheme with demand management and revenue generation objectives)
Graz (capital of Styria) is the second largest city in Austria with approximately 240.000 inhabitants and another 110.000 inhabitants living in the surrounding region. As a part of the European Union project TransPrice, a toll cordon measure for the city of Graz was investigated. This study investigates an inner urban cordon toll scenario for the city of Graz, Austria. The measure tested comprises charging private vehicles entering the city-centre together with parking management and improvements in public transport and the cycle-path network. Several scenarios have been modelled, and various charge levels and additional bonus systems analysed. The study focusing on passenger transport addresses the following questions: What are the practical experiences with urban road-use pricing to date? How do transport users react to the measure and how can their behaviour be modelled in discrete choice analysis? How does the value of time influence travel choice behaviour? What are the effects on traffic congestion, the environment, noise and traffic safety? What are the economic effects? What are the impacts in respect to the area covered by the toll cordon? What are the impacts of road-use pricing on land use planning? Who is favoured by the measure and who is put at a disadvantage? How practical is the measure in general?
Its main findings can be summarised as follows: “Modelling a city-wide toll cordon changes the character of the toll scenario. From the point of transport planning, a city-wide toll cordon has very little effect on travel behaviour compared to an inner-city toll ring with the same accompanying measures. Changes in travel behaviour are less frequent with all consequent effects following. An economic assessment of all scenarios and their effects underlines the overall practicality
BESTUFS II – D 2.3 Best Practice Update 2007 / Part I Annex III - 3 Annex
Code City/Region Name of concept Short description of concept of the measure. The internalisation of external costs shows large economic benefits in all scenarios compared to the reference situation. ... Hence, a sincere recommendation of urban road-use pricing to transport policy makers can be made.” As the study mainly focused on urban passenger transport, no special assumptions about freight transport have been made. [Source: Thaller, Oswald: "Impact Analysis of Urban Road-Use Pricing on Travel Behaviour, the Environment and the Economy", in: Forschungsarbeiten aus dem Verkehrswesen – Band 102; published by the Federal Ministry of Transport, Innovation and Technology; Vienna 2000]
AT - 06 Vienna Road pricing - management of road traffic in agglomerations by prices: The Vienna example considering ecological and political aspects
(Road Pricing - Steuerung des Strassenverkehrs durch Preise in Agglomerationen am Beispiel Wien unter Berücksichtigung umweltpolitischer Aspekte)
(Diploma thesis)
At the centre of this diploma thesis dating from 1995 lies the evaluation of external costs of traffic in Vienna and the question how these costs can be internalised through measures of urban road-pricing. In the study the theory about internalising external costs is presented, external costs are defined, evaluated and calculated for Vienna, different forms of road pricing are evaluated and the requirements and aims of a system are defined, forms of urban road-pricing measures in other countries are evaluated, a traffic analysis for Vienna is made and finally possible tariffs for road-pricing are calculated for Vienna.
The traffic analysis shows that heavy goods vehicles (HGV) account for 8,3 % of all registered vehicles in Vienna. On defined road sections in the city the HGVs account for 7 % up to 16 % of total traffic. Compared to this, HGVs are responsible for 50 % of nitrogen oxide - emissions and 90 % of CO2-emissions. Due to this figures a result of the study is, that freight transport with HGVs has to be charged higher, when implementing a road-pricing system. [Diploma thesis by Andreas Zeilinger, Vienna University of Economics and Business Administration, Department of Environmental Economics and Management; www.wu-wien.ac.at]
BE - 01 Brussels region Road pricing at the entrance of the Brussels region
(Planned urban cordon pricing scheme aiming at modal shift)
The lack of accessibility of the Brussels region generates a handicap for the economic growing of the Brussels region. The introduction of RER (Réseau Express Régional) services will generate an accessibility improvement which will generate retails and services increases in the centre; however it will intensify population diffusion to the periphery of the region. The Belgian Federal Government therefore has plans to introduce road pricing at the entrance of the Brussels region after 2005 in order to could mitigate the negative land-use impact (population diffusion) of the introduction of RER services. This transport strategy is based on the idea that it is necessary to co-ordinate land use changes with transport measures in order to achieve an environmentally and economically sustainable transport system. The technical and institutional solution is not decided yet. Nor is the pricing structure. The primary aim of these policies is to encourage a modal transfer of the commuters entering the city centre toward public transport or park & ride in order to reduce congestion on the ring (high standard motorway network surrounding the Brussels region). A study found that the cross-subsidisation of public transport with the road tolling revenues could multiply the positive impact of the road tolling on the modal split and contributes in that way to improve the transport accessibility. Accordingly, the charged fee is planned to target the road users’ behaviour. The revenue of the road pricing should be used to finance the public transport services including the RER. Implementation costs are estimated at 12 Million EUR, running costs at 1.2 Million EUR. The pricing will be accompanied by the introduction of the new public transport network RER and eventually the cancellation of other existing charges for road users. However, the legislation for the project is not in place yet. [www.stratec.be]
BESTUFS II – D 2.3 Best Practice Update 2007 / Part I Annex III - 4 Annex
Code City/Region Name of concept Short description of concept
CH - 01 Switzerland LSVA The distant related Heavy Vehicle Fee LSVA was introduced by the Swiss Government in 2001 with the following objectives: • Internalisation of external cost of heavy vehicle traffic (principle of real costs) • shift heavy vehicle traffic from road to rail and increasing the rail’s competitiveness • preventing the forecasted increase in heavy vehicles traffic • compensating for the increase in productivity due to the admission of 40-tons goods vehicles that became legal after
the bilateral treaties with the European Union. • generating revenue for financing large-scale public transport projects, e.g. the New Alpine Rail Transversal (NEAT) • bring the Swiss transit fee for crossing the Alps in line with the corresponding fees in France and Austria, thus
avoiding distortion of competition and ecologically undesirable detours. The LSVA is based on the constitutional article 85 which is implemented by a federal law. A referendum against this law was called and in the subsequent plebiscite in 1998 the Swiss people adopted the law with a large majority. The LSVA is managed by the Swiss Customs Authority which was chosen for this task as it is already collecting other fees and taxes, e.g. the VAT, mineral oil taxes, vehicle taxes, etc. The LSVA replaces the since 1985 existing flat fee for heavy goods vehicles. It is the first nation-wide implemented kilometre charge. The LSVA applies to all domestic and foreign heavy vehicles and trailers for goods or passenger transport with a max. laden weight in excess of 3.5 tons. The LSVA is levied according to: • number of kilometres driven on all public roads in Switzerland • the maximum permissible laden weight • emission category of the heavy goods vehicle. Passenger transport vehicles such as coaches, motor homes etc. are charged a time-related flat fee (no distance relation). There are special regulations for unaccompanied combined road/rail transport, transport of log, unpacked milk and livestock. Agricultural and public transport vehicles, ambulances and vehicles of the armed forces, police, etc. are completely exempted from the LSVA. The revenues of the LSVA are about 1 Mia. EUR per year. Two third of the net-revenue are earmarked for federal expenditures for rail modernisation projects (New Alpine Rail Transversal NEAT, Rail2000, TGV-connections, Noise reduction) and for uncovered costs related to road transport. This includes uncovered infrastructure costs as well as uncovered external costs. One third of the net-revenue is passed on to the cantons (regions), earmarked for uncovered costs related to road transport. The LSVA aims at shifting heavy goods transports from road to rail, reducing overall transport distances and increasing vehicle capacity usage. As the levied fee depends on the emission category of the vehicle too, the LSVA will also influence the choice of vehicles towards environmentally friendlier solutions.
For the years 2001-2004 the fee was around 0.01 EUR per ton-kilometre depending on the vehicle’s emission level. For 2005 the Federal Council set new rates, taking into account technical developments. However, the maximum rate is fixed by 0.018 EUR per tonne-kilometre. In 2008 there will be the next adaptation of the fee. Then the minimum rate will be at 0.014 EUR and the maximum at 0.022 EUR per tonne and kilometre. Furthermore federal law states that the fee must not
BESTUFS II – D 2.3 Best Practice Update 2007 / Part I Annex III - 5 Annex
Code City/Region Name of concept Short description of concept exceed infrastructure costs and external costs related to road transport. With the LSVA the transalpine route from Basel to Chiasso became approx. 5 times more expensive: from 17 EUR (before 2000) to 30 EUR (year 2000) and approx. 200 EUR (LSVA, after 2001). The fee level is a result of both political negotiations and the calculations of external costs of heavy goods traffic. The fee collection is based on the principle of self-declaration. The liable person (vehicle owner or driver) is obliged to actively participate. For domestic vehicles a On-Board-Unit (OBU) is mandatory. Foreign vehicles basically are using a ticket fetched at self-service machines. The OBU records the required trip data automatically. The distance is recorded by the tachograph. A GPS sensor and a movement sensor provide a second, redundant measurement in order to make sure that the tachograph signal is not intentionally interrupted or falsified. A Dedicated Short Range Communication (DSRC) air-link is used to switch the recording of the kilometres on and off when crossing the border. Radio beacons are installed over the carriageways at the 82 border crossings concerned. For foreign vehicles an ID-Card issued at the first entry provides for self-service on entry and simplifies the processes on exit. When entering the driver declares the relevant data (mileage reading, trailer status, payment mode) at the self-serving machines and receives a ticket. The whole declaration process takes less than 2 minutes. Fee collection: domestic vehicle owners monthly declare the fee parameters (distances and weights) to the Customs Authority SCA. The SCA processes the data, determines the amount due, invoices the vehicle owner and collects the fee. Foreign vehicles declare their trip data when leaving Switzerland. The fee may be settled via a petrol card or via an account held with the SCA. Immediate cash payment is also possible. Around 54'000 domestic trucks and 30'000 trailers are affected by the fee. In addition, around 20’000 foreign trucks cross the Swiss border daily. Enforcement: Domestic vehicles can drive for a long time within Switzerland without ever crossing the border where the correctness of their recorded data is checked. Therefore checks in the interior are indispensable in order to enforce a correct declaration. The checks do not influence the moving traffic as they are done via the DSCR air-link and by making use of the externally visible lamps of the OBU. Vehicles with a wrong declaration, e.g. a missing trailer declaration, can be sued. The rather costly OBU (about 800 EUR each) were distributed free of charge to domestic and foreign vehicle owners until 2004. The installation costs of up to about 300 EUR have to be carried by the vehicle owner. Implementation costs were within the credit limit of 100 Million EUR, plus another 50 Million EUR for the free distribution of the OBU. Operations costs are only 4-6 % of revenues which is very low compared to the usual figures of around 20%. Revenues were 800 Million EUR in 2005. The LSVA replaced the existing annual flat fee. It is one component in a whole package of measures that aim at strengthening the position of the railways. Other measures include the new transalpine rail tunnels through the Gotthard and Lötschberg and a rail reform that aims at improving the railway’s productivity and competitiveness. Additionally the parliament approved the so called “Transfer law” that grants additional funds to promote rail transport. Furthermore, unaccompanied combined road/rail transport is encouraged by a flat-rate refund per journey that offsets more or less the average LSVA-costs.
Economically the LSVA is very efficient as operation costs account only for 4-6% of the revenues. The effects of the LSVA are currently being evaluated. First results indicate that the LSVA shows the desired effects, but on a rather low level: 4% less lorries have been counted on Swiss roads (compared to an annual 5% increase since 1997). This reduction is attributed to an increase in transport efficiency that is either triggered by the LSVA (restructuring of logistics operations
BESTUFS II – D 2.3 Best Practice Update 2007 / Part I Annex III - 6 Annex
Code City/Region Name of concept Short description of concept and route planning, higher capacity utilisation) or the increase of the max. weight limit from 28 tons to 34 tons and 40 tons in 2005. Various transport operators have optimised their operations or switched to less polluting vehicles. Investments in heavy lorries have increased by 45%. The fear that the LSVA would make transport operators switch to small delivery vans that are exempted from the fee did not come true. Swiss Railways could increase their national freight transport performance by almost 9%. Transit traffic did increase but to a lesser extent than feared. The LSVA works and after the plebiscite it is also well accepted. In the propaganda phase preceding the public vote there was a strong majority of transport operators opposing the project, well organised by the Swiss association of road transport operators ASTAG. A silent minority recognised the chances. After the implementation, the Swiss Association of road transport operators ASTAG seized the occasion to adapt their price recommendations. Thus the fee is generally being passed on to the customers. Sometimes it is abused in the sense that the LSVA serves as an excuse to increase prices overproportionally For the transport operators part of the cost increase was offset by the increase in productivity as a consequence of the max. weight limit increase. In any case, the LSVA triggered quite some innovation in the transport and logistics sector. The project is considered a big success. It could benefit from an existing organisation, the Swiss Customs Authority. A lot could be learned and improved in the indispensable field trials. For acceptance it was crucial, that the project was legitimated by the plebiscite (heavily attacked before, but democratically accepted afterwards). For the scheme design, a key factor is that techniques, rather than being fancy, should follow the needed procedures. [www.zoll.admin.ch]
CH - 02 Switzerland Possibilities and restrictions for additional applications of the LSVA pricing system
(Möglichkeiten und Grenzen zusätzlicher Anwendungen des LSVA-Erhebungssystems)
This research project was part of the comprehensive national research programme NFP41 on “Transport and Environment” (Report E2). It investigates the possibility to use the Swiss LSVA-On-board-units (see project CH - 01) for different applications and services. These applications encompass on one hand other European Electronic Fee Collection (EFC) systems, on the other hand a diverse range of telematics applications. The study assesses in particular questions of interoperability between various operational and planned EFC-Systems, especially between cordon / network tolling and area tolling which differ considerably in their design. A second focus is the interoperability of the LSVA-On-board-unit with other applications with public and private interest, such as Access control (city logistics, construction site logistics), urban road pricing, enforcement, management of transit contingents, fleet management, transport of dangerous goods, floating car data and distance related vehicle tax. For each application the involved actors, the possible operators, the chances for interoperability and environmental aspects are assessed. The study comes to the conclusion that the telematics technologies and the processing capacities of the LSVA-On-board-unit provide for considerable potential with regard to interoperability, either with other EFC-Systems or with applications in other domains. It recommends the acceleration of standardisation processes and of political, legal and institutional harmonisation. [www.nfp41.ch]
CH - 03 Switzerland Technical and operational possibilities for collecting fees on road transport
(Technische und betriebliche Möglichkeiten der Gebührenerhöhung im Strassenverkehr)
This research project was part of the comprehensive national research programme NFP41 on “Transport and Environment” (Report M20). It deals with technical and operational aspects of road user charging schemes. Technically, most is feasible but only part of it can be implemented from an institutional and operational standpoint. In the report, the different options of fee collection systems are evaluated with respect to their practicability according to the following criteria: existence of technically and institutionally feasible solutions, efficiency of the fee collection technique, ease of use, efficiency of enforcement, possibility of incremental implementation, interoperability. Five key questions for fee collection
BESTUFS II – D 2.3 Best Practice Update 2007 / Part I Annex III - 7 Annex
Code City/Region Name of concept Short description of concept systems are identified: the availability of space, the handling of non-equipped users, the classification of the fees, enforcement and security, installation of on-board equipment. The evaluation led to the following main findings: • For fee collection on single road sections single lane tolling stations are proven technology. A wide range of payment
means can be accepted in automatic lanes or electronic tags or OBUs can communicate with beacons installed. • For area licensing, i.e. for selling the right to drive in a given zone, and cordon pricing automatic or single lane EFC
systems are feasible provided that traffic volumes are low (e.g. at entries to inner city zones) or if there is room for installing toll plazas. In special areas where there is the possibility to require that all vehicles are equipped with an electronic tag it is possible to use a multi-lane EFC system and to enforce payment by means of licence plate reading (Singapore solution). However, multi-lane systems are not suitable for a fine scaling of fee classes because non measurable criteria are practically impossible to check in a multi-lane environment.
• Complex area pricing with distant related or trip related fees is only feasible with autonomous on-board EFC-systems using GPS and a digital representation of the road network within the OBU.
• Network-wide distance charging for all vehicles is problematic because the handling of the non-equipped foreign users at the borders requires space and personnel.
• On-board equipment with a high level of functionality offers theoretically the possibility for added value telematics services. From a practical standpoint the multifunctionality is limited because fee collection is an authoritative function with the highest requirements as to all-time availability, data security and data privacy. [www.nfp41.ch]
D - 01 Stuttgart MobilPASS (Mobility Pricing by Automatic Systems in Stuttgart)
(Field trial of an urban cordon pricing scheme, mainly for demand management)
The MobilPASS was a demonstration project by the Ministerium für Umwelt und Verkehr Baden-Württemberg (Ministry for Environment and Transport Baden-Württemberg) in 1994/95. The field trial aimed at improving the expertise on the adaptation process of road users (shift to public transport, shifting journey to other daytimes, trip choice, trip frequency, increase of vehicle occupancy, etc.), the reduction of traffic, the acceptance of the system and the transparency of the tariffs. For the project the cars of 350 participants who regularly use the three access roads to Stuttgart were equipped with on-board units. The charging was made via a Smart Card which had to be pre-paid by the participants. With a delay the fees were paid back. Overall 30 charging devices were installed on the 3 roads charging only the incoming traffic. Ahead of the charging stations an information system on the price level was installed. The fee was charged when the cordon was passed. Before entering the cordon there was the possibility to use a Park & Ride facility and change to public transport. Within the demonstration 5 different phases of charging were evaluated. In particular the following charging phases were demonstrated:
Phase 1: In peak hours (7:00 to 9:00) and at afternoon (16:00 to 18:00) 4,-- DM were charged, between 9:00 and 11:00 3,-- DM for all other time between 6:00 and 22:00 hour 2,--. No fee had to be paid during the night hours (22.00 to 6:00)
Phase 2: The peak hour charging was split in three times 30 minutes intervals. Between 6:30 and 7:00 and between 7:30 and 8:00 hours 4,-- DM had to be paid. During the interval of 7:00 and 7:30 2,-- were charged. This should test the shifting of trips in time. For the afternoon peak hour 3,-- DM were charged. For all other times between 6:00 and 22:00 hours 2,-- had to be paid.
BESTUFS II – D 2.3 Best Practice Update 2007 / Part I Annex III - 8 Annex
Code City/Region Name of concept Short description of concept
Phase 3: Two high price intervals (6:45 to 7:15 and 7:45 to 8:15) with 8,-- DM were established. Between 7:15 and 7;45 6,-- DM were charged. From 8:15 to 9:00 4,-- DM. The afternoon peak hours from 16:45 to 18:45 were charged with 4,--. For all other times between 6:00 and 22:00 hours 2,-- DM were charged.
Phase 4: Different fees at the charging stations. Lower fees at roads with lower traffic flows, stepwise period of charging interval, maximum charging fee was 6,-- DM in the morning peak and 4 DM,-- in the afternoon peak hours. The whole charging period was for the high traffic flow road from 5:45 to 21:45 hours and for the low traffic flow road 6:00 to 21:00 hours.
Phase 5: Very low fees at roads with low traffic flows (1,-- DM), stepwise short charging intervals, maximum charging fee in the morning peak hours of 6,-- DM while the charge at the alternative road was 2,-- DM. In the afternoon peak up to 4,-- DM at the high traffic flow road while the low traffic flow road had a tariff of 1,-- DM. The whole charging period was for the high traffic flow road from 5:45 to 21:45 hours and for the low traffic flow road 6:00 to 21:00 hours.
The reactions of the participants were measured by the registration of the cars passing the charging station per time frame. Furthermore, the participants documented their trips within a log book.
The number of shifts of journeys in time was the higher the higher the fee (up to 12,5% in phase 3). A shift of routes was recognised of up to 10,9%. Especially by the introduction of differentiated fee scheme (phase 4 and 5). According to an inquiry 30% of the participants would change their destination (the inner city) if a road charging scheme would be introduced (but not reliable). The number of vehicles decreased up to 15,9% due to the set up of trip communities or the use of public transport. The recommendations from MobilPASS were that more mature technical equipment is needed, legal prerequisites need to be established, data security must be ensured, a common decision on the introduction of road pricing in several cities will be needed and that a technical standard for various cities should be promoted. [Forschungsinstitut für angewandte Wissensverarbeitung, Ulm, MobilPASS Feldversuch 1995]
D-02 Germany Heavy Goods vehicle toll After a delay due to technical problems the country wide HGV toll was implemented in 2005. All heavy goods vehicles above 12t tons on federal motorwas are subject to the toll. Prices are distance dependent and vary according to the number of axels and emission class between 9 and 14 Euro-Cent per kilometre. The aims of the toll system are manifold. Financing of the further transport infastructure development and maintenance, user based charge of the infrastructure costs, fostering ecolocigally reasonable modal shift to rail and inland waterway transport and efficient use of vehicles. 50 % of the revenues are spent for motorways, 38% for rail and 12% for inland waterway. The toll is charged through two systems. On the one hand this is the automatic satellite based system (GPS/GSM), in which the on-board-unit equipped and registered vehicle recognises the used motorway section automatically, and charges the fee according to the driven distance. For vehicles without OBU ther is a web and terminal based booking system in which rout, time, vehicle type etc has to be provided. Enforcement is ensured with 280 automatic control gates (infrared DSCR for vehicles with OBU and video for vehicles without OBU), fidex and mobile control points. 86% of the trips are automatically recorded via the OBU. Enforcement statistics show a low disregard of 2%.
BESTUFS II – D 2.3 Best Practice Update 2007 / Part I Annex III - 9 Annex
Code City/Region Name of concept Short description of concept
DK - 01 Copenhagen FORTRIN
(feasibility study on an urban complex area pricing scheme for demand management)
FORTRIN is a small scale project on road pricing called FORTRIN by the Danish ministry of Transport in collaboration with the Danish Transport Council and the Technical University of Denmark. The programme started in 1998. Its primary aim is to analyse the possibilities of regulating traffic by means of a road pricing system that is based on car type, number of kilometres driven, time of the day and place. One of the first activities of the programme has been to describe how such a system works (including a test of GPS and GIS technology). In the course of this task some questions have turned up that cannot be answered unambiguously at present. In several cases political decisions are involved.
DK - 02 Copenhagen AKTA - Forsøg med kørselavgifter i København
(field trial for different urban complex cordon/area pricing schemes in order to manage transport demand)
The project is part of the EU PROGRESS project that has started in 2000 and will last until 2003. The project has 4 main aims, namely to assess the price sensitivity of road users, to discover the principal barriers to acceptance, to assess the technologies and to raise awareness of the road pricing concept. The project’s core element is a cordon/area pricing field trial in the Greater Copenhagen Region with 500 participants that is taking place from autumn 2001 to autumn 2002. About 500 cars will be equipped with a vehicle positioning system (using GPS technology) with the ability to read virtual cordon rings and zones. A display will keep the motorist up to date with the charge in a current zone and the total cost of his trip. All in all this forms an advanced taximeter system. It is the intention to test 3-4 different charging schemes, e.g. based on kilometre charge or cordon crossing charge with different fee levels. To simulate a situation where reduced driving is equal to money saved, each test motorist will be given an account with a fixed cash amount. The taximeter will count down for the cash amount according to the charging scheme and motorists driving behaviour. At the end of the trial, the motorist is allowed to cash the amount left on his account. If the motorist reduces his driving during the trial he will cash a larger amount compared to no change in driving behaviour. Beyond a substantial data collection of the test motorists’ travel behaviour, a survey on motorists and public acceptance of road pricing will be carried out before and after the trial. Parallel to the demonstration project, it is the intention to start a dialogue on road pricing with interest groups and stakeholders. Charging area in the Copenhagen project is about 250 square km. At present a rational GPS-based taximeter technology, as it is used in the Copenhagen trial, is not available on the market, but it is likely to become available within a few years. To introduce road pricing in Copenhagen, new legislation has to be in place. [www.progress-project.org/progress/cop.html]
FI - 01 Helsinki PROGRESS in Helsinki
(theoretical modelling of different road pricing schemes)
For the Helsinki Metropolitan Area some road tolls proposals have been made in the late 1980’s and early 1990’s. None of them reached the final political decisions before they were doomed by the media, motorists organisations and political parties as well. Within the PROGRESS-project Helsinki will not carry out a physical demonstration project, but will carry through an extensive modelling exercise to prove the potential of road pricing as a demand management tool. Also the acceptability of pricing and expected behavioural impacts will be studied by organising a Stated Preference survey and interviews with various stakeholder groups. In this phase special emphasis will be put on to identify the opinion leaders in order to be able to define the way forward from the procedural point of view. The project is carried out by the main contractor Traficon, a private traffic planning and transportation consulting company, in co-operation with the City of Helsinki, the Helsinki Metropolitan Area Council and the Finnish Road Administration Authorities. [www.progress-project.org/progress/hels.html]
FR - 01 Marseille Tunnel Prado Carénage The tunnel constitutes the first urban road pricing experience in France. It runs on 2.5 km under the city centre of Marseille
BESTUFS II – D 2.3 Best Practice Update 2007 / Part I Annex III - 10 Annex
Code City/Region Name of concept Short description of concept
(existing urban single road pricing scheme for covering infrastructure costs)
joining different urban highways. It used to be a rail tunnel. In 1993 a private investor, the Société Marseillaise du Tunnel Prado-Carénage (SMTPC), has been designated to transform it into a road tunnel and has been allowed to price it so as to reimburse the initial investment. The SMTPC is granted this licence for 30 years. The main reason for integrating the tunnel into the road network was the congestion of the city and the huge difficulties to cross the city rapidly. To make this Marseille project possible, a national law was passed which allowed all municipalities to concede a tunnel or a bridge to a private investor with the possibility for this investor to put a price on the use of the infrastructure concerned. Since 2000, the fee is 2.1 EUR per car. A “business tunnel pass” provides slightly lower fees. For those with a “tunnel pass” fees are charged electronically. The fee should cover the tunnel’s infrasctructure costs. However, despite a constant increase of the fee since 1993 the financial situation of the SMTPC is still fragile. The tunnel is prohibited to trucks over 3.5 tons. However, it affects goods transport indirectly as it eases car traffic in the centre of Marseille. As implementation and running costs of the charging system are not known, no statement can be made about the system’s efficiency. But the pricing system works and is well accepted by car users, mainly due to a long and intensive information and communication strategy.
FR - 02 Lyon Périphérique Nord de Lyon (previously Trans Est Ouest)
(existing urban single road pricing scheme for revenue generation)
In 1997 the Urban Community of Lyon has launched a bid for the construction and operation of the périphérique Nord. The Périphérique Nord is made of two tunnels and a bridge (viaduct). It is located on the Northern ring of the city of Lyon. A private investor, the Société Concessionnaire du Boulevard Périphérique Nord de Lyon, has won the bid and ran the tunnels and the bridge during the first year of implementation. After less than a year the tunnel was closed due to public protest and legal problems. It is now operated normally by a public owned company, after the Community of Lyon bought back the tunnel. The revenues go directly to the operating company for operating costs, and to the Urban Community. After the public protests in 1998 the fees have decreased. Currently, they are 1.5 EUR for cars, 2.7 EUR for vans, light trucks and buses, 4.6 EUR for trucks with 6 wheels, 6 EUR for trucks with 8 wheels, 7.6 EUR for larger trucks. A " tunnel pass" provides slightly lower fees. There is no automatic charging system for trucks.
Initially, the capacity of local parallel roads was reduced so that people would be more inclined to use the paying infrastructure. Due to protest raised, two stretches turned back to gratuity and the initial capacity of local roads was restored in September 1997 after one summer of heavy protest. The tunnel in Lyon Nord has been finally accepted after the reduction of the fees. Initial communication was poor and might have been a reason for the protests.
FR - 03 Toulouse Péage de Roques
(abandoned urban single road pricing scheme for financing infrastructure)
This pricing project of an existing single road (formerly free of charge) located in the Southern suburbs of Toulouse was started in 1996 by a semi-private company with a majority of public capital, acting as a private investor, the Autoroutes du Sud de la France (ASF). The charge was collected at toll booths. Initial fees were between 0.8 and 1.5 EUR for cars with reduction for regular users. For freight transport other tariffs applied. The revenues were supposed to go directly to the operating company for paying back infrastructure investment. Initial communication was deficient. This and the fact that the road was free of charge before led to huge protests and a suppression of the toll. The project was abandoned in 1997. Apparently the public did not accept that a traditionally free infrastructure was transformed into a charged highway, even though it meant better quality of service.
BESTUFS II – D 2.3 Best Practice Update 2007 / Part I Annex III - 11 Annex
Code City/Region Name of concept Short description of concept
GR - 01 Athens TransPrice field trial
(Executed field trial on an urban single road pricing scheme for demand management)
From 1996 until 1998 the City of Athens took part in the European TransPrice project (EU 4th Framework Programme). The pilot on single road pricing took place on a central avenue in Athens linking the city centre to key northern suburbs. The pricing scheme should relief the heavy congestion in the city centre and decrease the ever increasing use of private cars (it must be noted however that the project took place before the introduction of the Athens metro which has attracted a significant portion of passenger demand). The pilot application involved vignette road use pricing with park & ride and, as a secondary activity, an evaluation of the effects of the reintroduction of a monthly pass for all public transport modes. Initially the project intended to apply an automatic debiting road use charging system based on a smartcard transponder device. However, facing serious problems with the equipment supplier company, they finally had to apply a compromise solution and undertake the experiment with a “vignette” or paper based system. Coincidentally this type of charging system had been proposed bin a consultative “Green Paper” published by OASA (the Athens Urban transport Authority) on the Athens urban transport system as a means of funding public transport developments. Thus 200 users of the selected corridor were presented with the choice of driving to the city centre as before but paying a toll when passing a toll point, or parking their car at a designed car park in the area and using a park & ride service with a single, integrated fare. In other words, the experiment targeted passenger transport and aimed mainly at modal choice shift.
The results of the pilot indicated that up to 15% of car drivers would transfer to park & ride with a 5:1 pricing regime in favour of park & ride. Attitudinal research also suggested that a vignette based system would be more acceptable to the public and politicians than electronic cordon tolling. Demand for the all public transport modes travel card had stabilised at about 10% of total ticket sales. Moreover, the survey undertaken revealed that, from all transport demand management measures, the highest acceptability was given to improvements in public transport, park & ride and access restrictions. Road pricing methods and restrictions in parking space were generally poorly accepted. The perceived acceptability of road pricing increases when the revenues are used to improve traffic conditions, public transport infrastructure or the environment. For example, when people in Athens were asked whether they would support a traffic demand management measure involving charging motorists a fee for driving in the inner city, 64% of the respondents declared they would support a package including cordon pricing plus revenues allocation, whereas only 16% would support an isolated cordon pricing measure.
The demonstration pilot has been completed in 1998 but no real implementation followed.
IT - 01 Rome Automatic Access Control System
(existing urban time-based area pricing scheme for demand management, planned to evolve towards a complex area pricing scheme)
Since 1989 Rome has access restrictions to the city centre (Zona Traffico Limitato ZTL). The restrictions apply to an area of about 5.5. km2 with 42'000 residents, 12 Ministries, Municipality’s offices, corporate headquarters and tourist sites. Access is restricted on weekdays from 06:30-18:00 and on Saturdays from 14:00-18:00. These restrictions were not enforced in a systematic way until 1994 when municipal police were used to block the entrances into the area. Permission to enter is given free of charge to residents (30'000 vehicles) within the ZTL. Other users may obtain permission to circulate and park in the area (approx. 90'000 vehicles) if they fall into certain categories such as freight lorries, doctors with offices in the centre, artisans, etc. Since 1998 these authorised non-residents are required to pay yearly the equivalent of a 12 month public transport pass (340 EUR) in order to obtain an access permit. Because of difficulty in enforcing this restriction by the municipal police, Rome, after the test of a prototype within the EC DG XIII CAPITALS
BESTUFS II – D 2.3 Best Practice Update 2007 / Part I Annex III - 12 Annex
Code City/Region Name of concept Short description of concept project is in the process of implementing an automatic access control system (within the PROGRESS project). The system comprises 24 electronic entry gates able to effectuate, without user intervention, the identification and/or the applicable tariff for vehicle entrance into the restricted area, and 29 exit gates. Currently, the area faces 250’0000 trips per day. The gate infrastructure, based on the TELEPASS system, includes TV Camera, IR illuminators and Microwave Transponder for the communication with the on-board units incl. smart card in the vehicles. 35'000 on-board units and smart cards have been distributed to residents and handicapped in 2001. Since October 2001 the electronic enforcement against violations is operational. In 2002 the Automatic access control system is to be consolidated. In a second stage (2002-2003) the incoming non-residents vehicles will be charged per trip instead of the annual fee. In a third phase (2004-2005) charges will be according to the duration of stay in the area. The pricing approach aims at shifting modes from private to public transport and reducing congestion.
After the start of the automatic access control and enforcement system in August 2001first experiences indicate that the system is performing with high reliability. The total flow of incoming traffic already decreased by 15%. However, there are still over 70'000 vehicles entering per day, 20% out of these illegally - on purpose or due to lack of knowledge. The handling of special cases such as foreigners to the city, handicapped, etc. turned out to be a key issue for the success of such as system. For freight delivery in the ZTL there is a freight delivery reorganisation project including monitoring of the distribution process, loading/unloading reorganisation, incentive programme for promoting better loading factors and low emission vehicles, etc.
IT - 02 Genoa PROGRESS demonstration project
(planned demonstration project of an urban cordon pricing scheme aiming at demand management)
In Genoa traffic congestion and pollution in the downtown area are existing problems that the administration is trying to solve by adopting various measures including road pricing. Within the PRoGR€SS project, Genoa is testing a cordon pricing scheme, designed to protect the historical centre and the downtown. The scheme covers a zone of about 2.5 km² with current traffic flows at peak hours of over 5000 vehicles per hour. Fees are collected per trip (at each entrance in the protected zones); repeated entrances within a given time period are not charged. Two schemes with different fees and different complementary measures are going to be tested. These measures include shuttle services connecting the city centre, park&ride facilities, etc. The technology adopted in the Genoa demonstration is based on video plate recognition by Optical Coverage Recognition (OCR) and central software data processing. No in-vehicle equipment is required. The roadside single-lane video camera embeds the image recognition module and has a recognition time of less than 2 seconds, i.e. 1800 vehicles per lane and hour can be recognised and processed.. The plate number list is sent to the central processing unit every given time period. Here, dedicated software matches data with a car owners' database and checks eligibility of charging. The expected effects of the pricing schemes are a change in the modal split towards public transport and discouraging private drivers using routes crossing the city centre (demand management).
NL – 01 Randstad area, Amsterdam, Roterdam, The Hague, Utrecht
Rekeningrijden / Spitstarief
(tested but never implemented urban cordon pricing scheme, mainly for
The Dutch Ministry of Transport started this project in 1995 in order to fight congestion that was caused by private cars driving in the morning hours towards the cities (commuters). By means of introducing a cordon pricing scheme the intention was to flatten the peaks in demand and to stimulate public transport. During morning peak hours all road users would have had to pay for accessing the cities on the priced roads. At start of the new coalition in the parliament in 1998 one of the intentions was to implement the Rekeningrijden system within four years. After the start the support within the
BESTUFS II – D 2.3 Best Practice Update 2007 / Part I Annex III - 13 Annex
Code City/Region Name of concept Short description of concept demand management, but also generating revenues for transport investments)
cabinet for full implementation decreased. The liberals within the cabinet feared that the car would only become an extra tax object. Also regional and local administrations offered big resistance against the plans. They feared that their area would become more expensive to live and they wanted a piece of the revenues to be able to do investments in their area. Also the lobby organisation for motorists (ANWB) was giving much resistance. The Rekeningrijden system was then given a new name: “Spitstarief”.
The “Spitstarief” was integrated in a policy package deal consisting of a mix of policy measures combined with plans for new investments (in total about 5 billion EUR). The revenues of the “Spitstarief” flow back to the resources of cities, earmarked for general transport investments (roads and public transport). By providing these big resources for local investments, the local administrations were more or less turned over to co-operate. However, the main objective was still the peak hour demand management. Three concepts existed for the implementation of “Spitstarief”. The first one (Cordon) is to make a cordon of toll payment gantries around the city. The second concept (ASW) is that only highways are equipped with payment gantries. Therefore only traffic on highways would have to pay a fee and not traffic on secondary or even smaller access roads. The third concept (ASW+) was an extension of the second concept. In this concept the scope was not only the highways to the city but also some important secondary access roads.
Ultimately in total 11 fee collection gantries were planned around the 4 major cities Amsterdam, Rotterdam, The Hague and Utrecht. For this system, pilot experiments with a dual Electronic Fee Collection system have been undertaken on a 3-lane motorway (A12 The Hague -> Utrecht). Road users could be equipped with an on board unit with an electronic purse and a Dedicated Short Range Communication (DSRC) transmitter/receiver for communication with the road side infrastructure. This on board-unit allowed in-vehicle electronic payment and cost 30 EUR per unit. Tariff for equipped users was set on 2.2 EUR. Unequipped vehicles or vehicles with an insufficient chip-card balance could be identified by means of photographing and recognising their licence plate (OCR technology) but their fee was set 1 EUR higher. Payment then was retroactively in a way that the tax department combined collection of the fees with the collection of the road tax. It was not clear how to charge foreign users of the infrastructure.
A system test took place in 1999 on the A12 in the direction of Utrecht (a six-lane highway). The system test covered all technical aspects of fee collection systems under Dutch weather and traffic conditions. During the 6-week test period, the systems detected and registered approximately two million vehicles. 400 volunteers’ cars were equipped with in-vehicle payment on-board units. The test showed that automatic payment by means of an in-vehicle payment unit worked reliably and in accordance with the requirements set for the test. The test did reveal certain shortcomings, mainly with respect to the performance of the systems in bad weather in combination with high speeds on non-porous asphalt, which has a direct effect on payment on the basis of the licence number. It was estimated that one year after introduction of the system 80% of the road users would be equipped with an on-board unit. For the remaining 20% of the vehicles, the licence number would have to be recorded and processed. This was estimated to be possible with a margin of error less than 0.01%. The remainder would have to be processed manually. During the test it turned out that 3% of the registered licence numbers couldn’t be processed neither automatically nor manually. This number was expected to be reduced to 0.5%. However, if the system was to be introduced in the whole Randstad region, the manual processing of the registered licence numbers
BESTUFS II – D 2.3 Best Practice Update 2007 / Part I Annex III - 14 Annex
Code City/Region Name of concept Short description of concept would require about 20 full-time workers. Two consortia, Q-Free and Siemens Combitech Traffic Systems, were selected for detailed development and further tests. However, Siemens stepped out of the project. The support for this road pricing scheme deteriorated further. The systems was being seen as unfair and resulting in too much problems with detouring traffic avoiding the fee collection points. The technology and methodology was seen as superseded after an independent ICT expert showed in a study that it is feasible to introduce a kilometre based road pricing system within a time span of 5 years (2001-2006) with the current ICT systems in place (GSM / GPS) and that the privacy problems could be overcome (see NL - 02). Finally in March / April 2001 the plans to introduce this type of road pricing system were totally abandoned after many years of research and development.
Finally the Rekeningrijden / Spitstarief project was a failure and it has never been introduced. The effectiveness can therefore not be judged based on empirical results. Based on models assuming a fully closed cordon of fee collection points around the 4 cities a reduction of 30-40% of the congestion in the Randstad region was calculated. With only 11 planned fee collection points in the Randstad the Ministry realised that this percentage wouldn’t be achieved. The acceptance of the system proved to be the main bottleneck. Within the acceptance of road pricing schemes fairness and equal treatment of road users proved to be main problems. After it became clear that a more fair and advanced system (distance related road pricing) was feasible the project Rekeningrijden / Spitstarief was finally stopped.
NL - 02 The Netherlands Kilometerheffing
(planned complex area pricing scheme for demand management)
Kilomterheffing is a project for a (complex) distance related road pricing on all Dutch roads. It was started in April 2001 and it is planned to implement the scheme from 2004-2006. In the first stage a flat-rate km based tariff will be introduced. After 2006 differentiation to time and place is foreseen. The revenues of the KMH will be fed into the Public funds. Fixed taxes (registration tax, Eurovignette, fuel tax and taxes on new vehicles) will be decreased and processed into a variable km-based tariff. Furthermore, the Ministry assumes budget neutrality. The fee is aiming at tax pressure neutrality for the average road user. When driving below 18,000 km per year one will have less tax to pay compared to the current situation. Technically, On Board Units (OBU) will have to be installed in the vehicles. The OBU does have communication functions (DSRC/GSM/GPRS), locating functions (GPS), a SIM card, a digital map, memory and a calculation function. The OBU (called Mobimeter) can calculate the road usage costs itself and periodically (each 1000 km) send this information to a service provider who passes the information to the Ministry of Finance where the bills will be composed. In this way the position and time of road usage doesn’t have to be known by others than the driver himself and so the privacy of the driver is ensured. Furthermore the OBU should be able to communicate with road side equipment (RSE) for subjection to automatic enforcement systems working with IR / Short range radio communication between the OBU and RSE linked to a central database. It is possible to link additional services to the OBU like route navigation, traffic information, road conditions, parking information, entertainment, etc. The standard costs of an OBU will be about € 125 (not included installation costs and VAT). The government will be paying for the OBUs and installation costs. In 2003 the mass production of the OBUs is planned so that in 2006 every Dutch vehicle will be equipped with an OBU.
The system affects both freight transport and passenger transport. However, currently the legal basis for charging HGV (vehicles over 12 tons) on all roads is not in place. A revision of the European law is required first but this has already
BESTUFS II – D 2.3 Best Practice Update 2007 / Part I Annex III - 15 Annex
Code City/Region Name of concept Short description of concept been announced by EC DG TREN (directive 1999/62/ECC will repeal). The institutional model will probably be a public private one. Commercial service providers can be used to disseminate information about actual tariffs and they can collect the information that is sent out from the OBUs periodically. They will also offer additional services to the users. The distance related road pricing scheme is seen as being fair because it is based on “the user/polluter pays principle”. In the average it is tax pressure neutral. Therefore the acceptance of the system is in principle high. Initially the privacy of the driver was seen as a potential bottleneck. However, the effectiveness of the flat-rate system is not obvious to all stakeholders and therefore there are still some discussion about the ex ante success estimations. Furthermore, due to the flat-rate some regions with low infrastructure agitate because they fear paying more than their share for the infrastructure in The Netherlands as a whole. The transport operators agree with the introduction of the km-based road pricing system, however they will offer resistance if their tax pressure is increased and if there is some kind of unequal treatment of other (foreign) road users or transport modes. The impact on urban freight transport cannot be estimated yet. With the introduction of tariffs differing by time and place, there could be a very substantial improvement of urban freight transport operations.
NO - 01 Oslo Oslo Toll Ring
(existing cordon pricing scheme generating revenue for infrastructure)
The Oslo toll ring began its operation in 1986. It is intended exclusively to raise money for improvements to the road network, originally to put the E18 through the city centre in a tunnel. Nineteen toll stations circle the centre of Oslo. Vehicles up to 3.5 tons pay approx. 2 EUR per passage, vehicles over 3.5 tons pay around 4 EUR. There are discounts for monthly, quarterly or annual subscriptions. The toll stations are divided into three different lanes: an attended “manual lane” for manual payment to a cashier, a “mint/coin lane” for payment with the correct amount of coins to a machine, and “passholder lanes” where the charging/control is done electronically. The system is currently being developed to an entirely electronic system. It is operated by Fjellinjen AS, the company charged with financing of road and public transport developments in Greater Oslo, which it does though raising tolls on the Oslo toll ring. It is 60% owned by Oslo City Council and 40% owned by the neighbouring Akershus County Council.
Initially low acceptance has slowly increased. There has been little impact on overall traffic levels, but many new road and now public transport developments have been funded. Investigations of the results have been carried out by a number of organisations, principally the Oslo Transportøkonomisk Institut (www.toi.no). [www.fjellinjen.no]
NO - 02 Bergen Bergen Toll Ring
(existing cordon pricing scheme generating revenue for road infrastructure)
The Bergen Toll Ring began operation in January 1986. It consists of 7 toll stations that circle the Bergen city centre. Access to the centre costs approx. 1.2 EUR for vehicles less than 3.5 tons and around 3.5 EUR for vehicles over 3.5 tons. So far, the funds raised are used for road improvements in the Bergen region. But as the current charging period will come to an end in 2003, the city is investigating the possibility of converting the system to a differential congestion charging method of demand management. The toll ring is operasted by the Bro & Tunnelselskapet AS, which is 51% owned by the Bergen City and County Councils and 49% by banks, insurance companies and local industry. For a successful project, the operators of the Bergen toll ring give the following recommendations:
1. Consensus in the public sector: Political and administrative consensus is vital.
2. Build coalitions: Involve opposing interest groups and build coalitions between them. Get agreement about how to use
BESTUFS II – D 2.3 Best Practice Update 2007 / Part I Annex III - 16 Annex
Code City/Region Name of concept Short description of concept the money, give something to both sides.
3. Compromise: Present the project as a compromise, a balanced solution; a transportation system that is both economic efficient and environmentally sound.
4. Redefine: Define and treat the scheme as a technical/environmental/financial problem, not as an extra tax.
5. Inform, illustrate benefits: The project must be accompanied by advantages clearly visible to the user, both motorist and environmentalist: improved accessibility for car and public transport, more efficient public and commercial transport, environmental projects etc.
6. Some is better than nothing: Incremental approach, demonstration projects, tolls for improved capacity more acceptable than tolls for traffic regulation
7. Find your own way: Much to be learned from existing projects. However, traffic conditions, political system and public opinion vary widely. General recommendations must therefore be adjusted to suit local conditions. [www.brotunnel.no/index.htm]
NO - 03 Trondheim Trondheim Toll Ring
(existing urban cordon pricing scheme for financing road infrastructure)
The Trondheim toll ring became operational in 1983 as the first of the Norwegian toll ring schemes. It charges the access to the city centre of Trondheim in order to provide funding for a package of improvements to the road network in the Trondheim region. It is run by the Trondelag Bomveiselskpa AS. Access fees are approx. 2 EUR for vehicles under 3.5 tons and around 4 EUR for vehicles over 3.5 tons. There are discounts for monthly, quarterly or annual passes. Currently, Trondheim is investigating the possibility of using the tolls for demand management. [www.trondelag-bomveiselskap.no; www.aksess.no/vegvesenet/concert]
SE - 01 Gothenburg Gothenburg Road Pricing Trials within PROGRESS
(various field trials of urban area pricing schemes for demand management)
Gothenburg has taken part in several road pricing trials and projects in recent years. Within the PROGRESS project another field trial is being done in order to identify feasible pricing strategies and their different impact upon travel behaviour. Two scenarios will be tested: One, based on three geographical zones, as well as charging on the arterial routes, will concentrate of producing congestion benefits. The other, based on three concentric zones, will aim to produce benefits for the environment. The technology used is a fully functional Vehicle Positioning system - based charging system. The evaluation of the technical system is a part of the project work. Previous investigations demonstrated that the city of Gothenburg was not well suited for traditional single cordon pricing schemes. Thus, the City of Gothenburg found that an area based pricing scheme would better contribute to the goals defined. The project is co-ordinated by Transek, a private transport analysis and consulting company. [www.progress-project.org/Progress/got.html]
SE – 02 Stokholm Stockholm congestion charge The Stockholm congestion charge is a traffic congestion and environmental tax that has been imposed on the majority of vehicles in Stockholm; it is the second of its kind to be introduced in Europe following the highly controversial but none-the-less successful London Congestion Charge introduced by the London Mayor, Ken Livingstone.
"Transponders fitted in vehicles provide a reliable capture rate and cost-effective back-room operation."The Stockholm congestion charge was first introduced as a trial between 3 January 2006 and 31 July 2006. A referendum on the future of the congestion charge was held in September 2006; the residents of Stockholm municipality voted yes, and 14 other
BESTUFS II – D 2.3 Best Practice Update 2007 / Part I Annex III - 17 Annex
Code City/Region Name of concept Short description of concept municipalities voted no to implement it permanently.
In October 2006, the Swedish government declared that the Stockholm congestion charge was to be introduced permanently during the first half of 2007. The incomes from the reintroduced congestion charges in Stockholm are to be used in partly financing a new bypass road, 'Förbifart Stockholm'.
The Vägverket (Swedish Road Administration) is the body responsible for the administration of the charge and its systems, while IBM was involved as prime contractor responsible for solution design, development and operation.
IBM built the on-demand solution using wireless RFID technology supplied by Norwegian company Q-Free, one of the leading suppliers of technology for road charging systems. The system works by using a Q-Free on-board unit and road side technology in combination with an operational system provided and run by IBM.
Payment is via a number of channels including by direct debit triggered by the recognition of the on-board electronic tag that is loaned to drivers. Q-Free cameras can also detect and record car number plate images using Automated Number Plate Recognition (ANPR) software to identify those vehicles without tags, and are also used to verify tag readings and provide evidence to support the enforcement of non-payers.
The use of the transponders fitted in vehicles means the system has a more reliable capture rate and a more cost-effective back-room operation than congestion charging systems that do not use such devices. It also makes it far easier to operate variable charging with automated direct debit after the passage.
Exemptions to the charge include emergency vehicles, buses, diplomatic vehicles, disabled persons vehicles, military vehicles, hybrid or electric cars, motorcycles and mopeds, and foreign-registered vehicles.
"The payment gates are equipped with number plate recognition cameras to record the identity of vehicles."The area of Lidingö has its only access to the mainland through the congestion tax affected area – all traffic to and from Lidingö, to and from the rest of the Stockholm County, is exempt from the tax, provided that one passes the Ropsten payment station and some other payment station within 30 minutes of each other.
The Essingeleden motorway (E4) that passes through the effected area is also exempt, due to it being the main road when travelling past central Stockholm. All exits and entrances of Essingeleden that are within the congestion tax area have payment stations placed at them.
The congestion charge area includes the whole of the Stockholm city centre areas such as Södermalm, Norrmalm, Östermalm, Vasastaden, Kungsholmen, Stora Essingen, Lilla Essingen and Djurgården. There are 18 unmanned electronic payment stations at all entrances to this area (this is helped by the fact that Stockholm was built on a series of islands). The congestion tax is applied to vehicles on both entry and exit of the affected area.
The payment gates are equipped with number plate recognition cameras to record the identity of vehicles passing through. Over 400,000 drivers in Stockholm have already equipped their cars with a transponder for easy payment and can pay automatically by Autogiro directly from their bank account.
The amount to pay depends on the time of the day the driver enters or exits the congestion tax area. The tax may be paid
BESTUFS II – D 2.3 Best Practice Update 2007 / Part I Annex III - 18 Annex
Code City/Region Name of concept Short description of concept directly via a website or over the telephone by credit card, or alternatively it can be paid at any 7-11 and Pressbyrån convenience stores in the City.
The tax is not paid on Saturdays, Sundays, public holidays or the day before public holidays, nor during the night time period (18:30–06:29). The maximum amount of charge per vehicle per day is 60 SEK (€6.44, $8.23, £4.42). If the charge is not paid within five days, a reminder is posted to the driver with an additional charge of 70 SEK; if the charge is not paid within four weeks an additional fine of 500 SEK is added and if not paid then the authorities can automatically remove the amount from the offenders bank account.
UK - 01 London Central London “Congestion” Pricing Scheme
(planned urban time-based area pricing scheme for demand management)
With all this traffic, drivers in central London spend 50% of their time in queues. Average traffic speeds in central London are now under ten miles per hour throughout the working day. Following lengthy consultation, in July 2001 the Mayor of London published his Transport Strategy for the capital which included a central London congestion charging scheme - together with other measures - to tackle the traffic jams. There has since been specific public consultation on Transport for London's proposed central London congestion charging scheme. In the light of views received, Transport for London has proposed modifications to the scheme, paying particular attention to exemptions and discounts. These changes will be consulted on again until 18 January 2002. The Mayor will then decide whether or not to go ahead with the proposed scheme and if so in what form, and whether a public enquiry is appropriate. If the Mayor confirms the scheme, the next stage will be spent putting the technical, traffic and environmental management measures and administrative elements in place, ready for the scheme's start. The earliest the scheme can start will be February 2003. Legal prerequisites are in place since 1999 with the Greater London Authority Act.
The priority of the proposed central London congestion charging scheme is to reduce traffic congestion. All the revenues generated would be invested in transport in London for at least ten years. Charging would only apply in central London where traffic congestion is at its worst. Motorists would be charged £5 a day to drive within the central zone between 7am and 6.30pm only, on Mondays to Fridays. There would be no charge on public holidays. Several exemptions and special tariffs are foreseen for special transport vehicles such as London licensed taxis, vehicles of disabled persons emergency service vehicles, motorbikes, alternative fuel vehicles, vehicles that attain very strict emission standards, etc. Drivers using a vehicle in the central zone would pay the charge, either in advance or on the day. The registration numbers of these vehicles would be entered into a database. Drivers would be able to pay the charge on a daily, weekly, monthly or annual basis by telephone, post, internet or at retail outlets. They will not be required to display a licence. The number plates of vehicles entering or moving within the central zone will be observed by a network of fixed and mobile cameras. There will be no toll booths, gantries or barriers; drivers will not have to stop. The number plates collected by the cameras will then be checked against the registration numbers of those who have paid. The registered keeper of any vehicle identified within the central zone without the congestion charge having been paid (unless exempt/discounted) will be liable to a penalty charge. However, motorists will not automatically be penalised if they enter the central zone without buying a licence- they will have until the end of the day to register and pay the charge. It is proposed that drivers will pay the standard £5 if they pay before 8pm on the day, rising to £10 if they pay between 8pm and midnight.
BESTUFS II – D 2.3 Best Practice Update 2007 / Part I Annex III - 19 Annex
Code City/Region Name of concept Short description of concept
The charging scheme is to be accompanied by a wide range of measures designed to make public transport and other alternatives to car travel easier, cheaper, faster and more reliable. When congestion charging is introduced, Transport for London's projections show that 20,000 will transfer from their cars to public transport - 5,000 to the tube and rail and 15,000 to buses. The money from congestion charging will enable these improvements to public transport to be expanded and developed, since the scheme is expected to raise about £130 million per year. By law, this has to be spent on improving London's transport system for ten years from the start of the scheme.
Once the congestion charging scheme is in place, traffic in central London is estimated to reduce by 10-15%. This will help essential journeys (such as those by delivery vehicles) to be quicker and more reliable. Although a few areas outside the central zone may experience a small increase in traffic, the congestion charging scheme would reduce the overall levels of congestion. More than £100 million is being made available over the next three years to implement the traffic management for the scheme and to minimise any adverse effects of congestion charging, for example to manage traffic on main routes, to protect local side roads from 'rat-running' and to protect areas from increased commuter parking. [www.transportforlondon.gov.uk]
UK - 02 United Kingdom Lorry road user charging scheme
(planned distant-based charging scheme for lorries on all UK roads)
After a consultation in 2002 the British government plans to introduce a distance-based lorry road user charge in 2005 or 2006 which should ensure that orry operators from overseas pay their fair share towards the cost of using UK roads. The new charge would be accompanied by a reduction of existing taxes ensuring that the UK haulage industry does not pay any more than today. According to the government’s provisional view the charge should apply to all lorry operators regardless of their nationality, apply on all UK roads, vary according to the characteristics of the lorry (e.g. weight, axle structure, emission standard), vary according to the type of road (e.g. charging less for motorways) and have the potential to vary according to the time of the day (e.g. different tariffs at night and during daytime). [www.dtlr.gov.uk/itwp]
BESTUFS II – D 2.3 Best Practice Update 2007 / Part I Annex IV - 1 Annex
ANNEX IV
Overview on collected road pricing projects Country City/Region Name of concept Project Phase
(1 - 4)
Extension Pricing scheme
Objective(s)
(infrastructure revenues / demand management)
charged segments
technical solution
AT - 01 Austria Toll-vignette implemented inter-urban time-based network
road infrastructure revenues
both vignette
AT – 02 Austria Toll for defined motorway sections implemented inter-urban single road road maintenance, (demand management)
both tolling gates
AT - 03 Austria Electronic pricing system for Heavy Goods Vehicles (HGV)
implemented mainly inter-urban complex network
road infrastructure (demand management)
freight DSRC multi-lane free-flow
AT - 04 Austria Strassenbenützungsabgabe (StraBA) implemented both time-based area
federal revenues (demand management)
freight tax
AT - 05 Graz Impact analysis of urban pricing ... not followed urban cordon both both -
AT - 06 Vienna Road pricing - management of ... not followed urban various demand management (revenue generation)
- -
BE - 01 Brussels region Road pricing at the entrance of the Brussels region
not followed urban cordon demand management both -
CH - 01 Switzerland LSVA distance related heavy vehicles fee
implemented both distance in area demand management (transport infrastructure)
NL – 02 The Netherlands Kilometerheffing consultation both complex area demand management both OBU, GPS, GSM, GIS, DSRC, IR, OCR
NO – 01 Oslo Oslo Toll Ring implemented urban cordon infrastructure revenues both DSRC and manual toll booth
NO – 02 Bergen Bergen Toll Ring implemented urban cordon road infrastructure revenues
both DSRC and manual toll booth
NO – 03 Trondheim Trondheim Toll Ring implemented urban cordon road infrastructure revenues
both DSRC and manual toll booth
SE – 01 Gothenburg Gothenburg Road Pricing Trials within PROGRESS
demonstration
(not followed)
urban area demand management both OBU, VPS
SE – 02 Stockholm Stockholm congestion charge implemented urban cordon demand management both (DSRC), OCR
UK – 01 London Central London “Congestion” Pricing Scheme
implemented urban time-based area
demand management both OCR
UK – 02 United Kingdom Distant based lorry road user charge cancelled both complex area road infrastructure freight Not decided
BESTUFS II – D 2.3 Best Practice Update 2007 / Part I Annex V - 1 Annex
ANNEX V
General situation concerning urban freight platforms within countries
Country Description Australia There has been little interest in inter-company urban freight platforms in Australia until recently. However,
current initiatives by government to promote rail and reduce the impacts of trucks in inner urban areas have led to some new developments. In the last five years there has been a growing interest in inner city living in Melbourne. Redevelopment projects in the Docklands and SouthBank areas immediately adjacent to the central business district have been successful in attracting residential development. However, as the port grows there is increasing pressure on residents living in inner areas from road freight activities. Currently there are limited rail connections with the port and these have limited capacity. There is considerable interest by government and the private sector to increase the use of rail for freight.
Austria First attempts with urban freight platforms appeared in the mid 90ies. They were driven by the goal to reduce transport costs by sharing and bundling deliveries. There have been several projects trying to develop concepts for urban freight platforms, but a real success is still missing. The main problem in realising such concepts is the strong competition between transport operators, which does not allow co-operation, although the urban transport conditions lead to increasing transport costs. A general concepts is not recognisable. Most projects follow the trial and error method. There is only one freight village in Graz (capital of Styria, see project AT-01), which is still under construction. Urban distribution centres are usually owned and run by one single company (sometimes co-operation). These small and limited forms exist in many Austrian cities. The degree of innovative concepts is very low. The view of the urban administrations on the issue is mainly “transportation planning” minded than logistic oriented. In general there are strategies to slow down the increase of freight transports at least, or better to stop on the actual level by restrictive measures. In most of the cities there are no concepts of freight villages or urban freight platforms. The predominant type is the private freight platform (single company freight platform for transhipment and consolidation). The problem of urban freight transport is a public issue and discussed in several groups on urban level including the local authorities, representatives of the transport operators as well as representatives of retail and wholesale, civic action groups etc. There is the need for measures and instruments like urban freight platforms but there is no readiness for co-operation between the transport providers as well as between the private and the public sector. It seems that under the present conditions, there is no chance for operating such a platform on a profit oriented basis. There have been a lot of initiatives, studies, research on urban freight platforms in Austria in the past but no project was implemented. The present situation is influenced by the more or less not very successful examples of city logistics in other countries and by the increasing traffic problems in the cities combined with higher costs for the shippers. Some pilot projects like the CCG and Styrialog (see projects AT-01 and AT-02)) seem to indicate a turning point in the handling of the problem. Therefore we can expect maybe a so called next generation of projects in this field, but on a low level. In case of the so called “city logistic useful goods” (goods on pallets and parcels, city logistic boxes) there are no legal constraints; in case of food, frozen products and other sensible goods there are special constraints like HACCP and other national laws. There is no special zoning for urban freight platforms. There are no specific restrictions compared to other industrial areas (limits for noise, traffic, emissions) but there is also no form of promotion. The trend in case of zoning leads to more peripheral facilities far away from the raising of civic action groups. Most of the Austrian cities have limited time windows for deliveries in the centres; transports and deliveries during the night are prohibited; other restrictions are mostly caused by technical limits: medium and small lorries because of the density of the historic buildings and capacity of streets and bridges. Usually there are loading zones situated next to the outlets, but often used by illegal car parking.
Belgium There are no multi-company City Distribution Centres such as that of Monaco or La Rochelle in Belgium. Until the 1970s, freight distribution was organised on a provincial basis. Each province had a general freight market with all types of goods. In Brussels, distributors were essentially located in the city-centre and along the Canal. The Tour and Taxi site in the city-centre was used for the dispatching in the city of products coming from far
BESTUFS II – D 2.3 Best Practice Update 2007 / Part I Annex V - 2 Annex
away by water or by rail. When water and rail transports decreased, the site’s activities changed and mainly focused on custom activities for expensive products. Due to the evolution in the scale of markets and the opening of borders within Europe, this type of activity has now disappeared. Over time, wholesale activities in provincial capitals have disappeared. Distribution activities formerly located within cities have most often relocated to the outskirts of cities nearby important highway intersections. Evolutions in distribution markets’ size have lead to distribution systems involving an increasingly larger number of urban areas as shown for example by the development of the Garocentre freight village. Plans for an urban distribution centre in Ghent have been proposed but have faced opposition from shop owners and transport and logistic companies. Arguments against the development of an urban distribution centre included required investments, the necessary volumes needed for the centre to be cost efficient, technical problems, difficulties with regards to the collaboration between transport operators, shippers and receivers, cost of intermediate treatments and problems concerning responsibility in case of loss or damage of products. Shop owners expressed worries regarding cost increases, increased delivery times, a loss in flexibility and increased paper work. The development of an urban distribution centre in Brussels is under discussion. The city of Antwerp has always played an important role in freight distribution in Belgium. With around 130 million-tons of goods handled every year the port of Antwerp is the largest in the country. In very early days transhipment took place within city centre limits, but from the twentieth century, port activities have continuously moved northwards. With these developments we can nowadays distinguish the “port of Antwerp” with transhipment activities, logistics, maritime industry and chemical industry and the “urban economy” which is more focused on cultural products, diamonds, fashion, etc. In Antwerp, urban freight transport hardly received any specific attention. The local government’s agreement 1995-2000 provided for the establishment of distribution centres to diminish the negative aspects of urban freight transport. Heavy freight transport should be kept out of residential neighbourhoods. Goods were to be transhipped into smaller trucks or other conveyances at the city border. Unfortunately there has never been any real action to achieve this goal. Some forms of urban distribution centres have grown spontaneously in early or later days (see projects BE - 04 and 05). During many years companies in Flanders could settle wherever they liked. There was a strong tendency for companies, especially companies with large consumer goods such as furniture shops, large clothing stores, etc. to establish themselves along the main roads that lead to the cities, leaving the city centres itself. This was mainly because the “road shops” were much easier accessible than the city centre, ground prizes were much lower and there were more expansion possibilities. This tendency has obviously done much harm to real city centre functions. This tendency could not continue without doing anymore harm to cities and did no good to the open countryside, which became more and more cut into bits. The Flemish government realised this and started its urban planning process. In 1997 this resulted in a plan with indicative and imperative guidelines concerning urban planning. This included the definition of the “Flemish diamond”, an urban network at the international level. This diamond, consisting of various cities, can be seen as a large freight platform on European scale, from where goods can be transported to and received from other European level platforms. The port of Antwerp plays a significant role in this. Two large logistic parks will be established in or near the port (Hoevenen and Beveren), because the port is seen as the gateway to this urban area. At a more local level - the Antwerp region - the “ Strategisch Plan Regio Antwerpen” (Strategic Plan Antwerp Region, Jodenstraat 44, 2000 Antwerpen, Belgium) was established. One of the concerns of this strategic plan is infrastructure and mobility. This organisation tries to solve mobility problems mainly by supporting and initiating projects. There are currently no regulations restricting or promoting urban freight platforms in Belgium. Inner-city deliveries by heavy goods vehicles are not legally restricted. Some local regulations exists with regards to time of delivery in pedestrian areas of some city centres (e.g. Namur) and some policies have been developed to regulate transit traffic of heavy goods vehicles (eg. on the Quai de la Dérivation in Liège).
Denmark For more than 50 years, Denmark has had three dominating transport companies, which have offered national distribution of parcels and part-loads, - except refrigerated and frozen goods. Each of these has worked through a large number of single-company freight centres, which are located in all larger cities. Throughout the 70s and 80s, another 4-5 new operators appeared, which also operated with their own route systems and freight centres. Since the early 90s, the development in the transport sector has been marked by national and international merges and increasing customer demand for specialised services, quality control and IT solutions. This development means that larger amounts of goods have been concentrated on fewer,
BESTUFS II – D 2.3 Best Practice Update 2007 / Part I Annex V - 3 Annex
specialised distributors. In year 2002 Denmark has 5-6 national and international transport companies, which operate with distribution of parcels and part-loads through single-company freight centres. These companies, typically in Denmark, work with between 5 and 10 local freight centres, some of them with a large number of sub-terminals. Further there is 4-5 retail suppliers with direct national distribution from central warehouses to their own chain of retail outlets. These large transport companies and retail suppliers have the necessary amounts of goods to fulfil the demand for efficient city logistic in most larger cities satisfactory. i.e. a high load factor in a reasonably concentrated urban area. Besides the general controversies in relation to multi-company freight centres, the historical background and the concentration on few distribution systems means that there is a very low commercial interest in establishing multi-company freight centres in Danish cities. Nor have any Danish municipalities been interested in participating financially in establishing partly or fully public freight centres. The increased concentration in the transport sector means that the number of trucks, which distribute national consignments in larger cities, is decreasing. There is of course a potential for further reduction of the number of trucks, but in Denmark there is first and foremost a focus on: promoting the use of newer and more environmentally friendly engine technology working towards making the practical transport and delivery conditions on street and shop level effective limiting the problems caused by the continuously increasing number of delivery vans, which are used for
local distribution, technical service and restate maintenance In Denmark, a number of analyses and project proposals concerning environmental zones, co-ordination and consolidation of transports, practical delivery conditions and use of more environmentally friendly engine technology have been carried out. Currently there is (1) a recently finished large-scale in-use test of particulate traps in the city of Odense, initiated trial projects in (2) Aalborg concerning transport co-ordination and the alteration of the physical transport and delivery conditions and (3) Copenhagen concerning increased load factor and more environmentally engine technology, and there is plans of trial projects in (4) Aarhus and (5) Høje-Taastrup. However, none of these projects include direct initiatives concerning establishment of new urban freight centres. In 2001, Aalborg, Aarhus and Copenhagen’s municipals established a mutual 2 year project supported by the Ministry of Traffic, Forum for Citylogistics. The purpose was among other things to co-ordinate the Danish trial projects, collecting and distributing knowledge and experience from Denmark and abroad and establishing a network between the stakeholders. In Denmark it is the perception, that there is no easy and simple solution for urban transport by van and lorry. Therefore, these initiatives being carried out in a number of Danish cities are implemented with a trial phase of the ordinances, where the individual cities can try out different solutions. There are off course legal constraints, which set particular requirements to the handling facilities and the distribution conditions for unpacked and temperature sensitive provisions (refrigerated and frozen foods). However, there are no unrealistic legal requirements, which block realistic wishes for bundling with other products nor land use planning regulations, which prevent establishment of urban freight centres either. In the national Traffic Law, the opportunity for the individual municipality’s and the local Police to regulate the traffic in certain city areas is limited to restrictions in the form of : time windows for transport weight of the vehicle purpose of the transport (i.e. person-, goods- or bus transport) topping and parking
With the latest change of the Traffic Law there is a possibility to carry out temporary environmental trials. Copenhagen Municipality has used this trial paragraph to introduce restrictions, which sets requirements to the load factor and the age of the vehicle’s engine. Using the trial paragraph is so administrative complicated that no other municipalities has yet shown any interest in working with it. On a final note, the State politics on duties and taxes influence the investment in more environmentally friendly engine and fuel technology. Lower duties and taxes on environmentally friendly technology would promote the penetration for urban use. Generally, there is a high awareness among the large municipalities, even though it is still often based on an unrealistic and simplified perception of the situation . Among the 5-6 largest transport companies and with some retail suppliers, a high and qualified awareness has been created. But among the remaining stakeholders – particularly the retail trade – there is typically a very low awareness or the problems are not acknowledged as they believe that it is not theirs, but the transport’s or the municipality’s problem. [[email protected]]
BESTUFS II – D 2.3 Best Practice Update 2007 / Part I Annex V - 4 Annex
France The first UDCs appeared in 1967-1969 in the Paris region (2 freight platforms laid out for urban distribution). Then after several projects in the 1990s (most notable : Aix en Provence), an UDC opened in La Rochelle in 2001. Also, even though Monaco is not, strictly speaking, in France, the Monaco UDC which opened in 1989 (see project MO - 01) can be considered an important step for the history of UDCs in French cities. In the between, what have developed in France in the nearby outskirts of cities are : 1. "logistic platforms" (freight villages), open to many operators but which generally serve very few urban
clients 2. transhipment terminals for parcel (and other) companies, generally focused on urban clients but devoted
to one operator only, therefore not aiming at bundling the goods for a city centre nor decreasing the number of freight vehicle-kilometres.
In 1967, the main motivation was to bundle freight destined for Paris so as to decrease the number of trucks circulating in Paris. Same thing in La Rochelle 34 years later! The UDC of La Rochelle, as were the Paris UDCs in the 1960s, is open to all transport operators. Transport companies leave their goods and parcels that need to be delivered in the city centre to the UDC manager which organises the final deliveries. In La Rochelle, the final deliveries are made with electric vehicles (which was not the case in Paris). The experience in Paris lasted 2 years (1967-1969), after which the managers decided to turn the terminals into something else due to the lack of a sufficient number of clients (transport operators). The financial profitability of the system was not achieved. The UDC managers incriminated the lack of enforcement of delivery regulations in Paris. At that time too (end of the 1960s), traffic congestion in Paris was not so serious as to make the use of the UDCs attractive. These UDCs at the time were also rather far from the city centre (whereas today, as they have been transformed into very successful logistic platforms, they appear to be very close to the urban core!). For La Rochelle, after one year and a half of operation, only half of the potential market share in parcel delivery for the city centre has been achieved (see Project F - 01). Other projects (such as Aix en Provence) have not been carried away due to financial issues and resistance of local carriers. • Freight villages (called logistic platforms in France) are extremely successful. Although offering
expensive warehouses for rent, they are well commercialised. Two companies are leaders in the concept: Sogaris and Garonor (group Prologis). These freight villages have a role in urban distribution, but this role is minor. They are mostly used for non urban transport and logistic activities.
• Urban Distribution Centres are considerably less developed. So far, only La Rochelle has opened one. Other cities are thinking about it, but they wait for the results in la Rochelle UDC before going forward. They view UDCs as expensive experiments. Nancy, Paris, Toulouse, Strasbourg and Aix en Provence are examples of cities with a strong interest. No project is finalised yet.
La Rochelle has launched a European bid to select one operator to run the UDC. All other cities interested wish to do something similar, i.e. have a private operator manage the distribution centre. La Rochelle has also defined strict city centre access regulations. Other cities should also follow. La Rochelle runs the UDC with electric vehicles. This may not be an option elsewhere. In Toulouse (see project F - 02), the chosen option is also electric but other cities favour NGV or regular vehicles. General awareness on urban goods is increasing. UDC do not appear as the most relevant solution everywhere. There is a strong commitments of SNCF, the national railway company, in the concept of UDC (with projects in Toulouse, Paris, Strasbourg, Lille). However, this commitment is so far only verbal : no project has been realised yet, and SNCF has recently seemed to retrieve from urban logistics. Strong commitment from all French cities to open an UDC only if there is a partnership possible with private transport operators. UDCs face strong opposition from one of the main transport operator professional organisations (Transport et Logistique de France). Indifference of the other organisations. La Rochelle UDC is very controversial among transport operators, but many view it as a way to have cities pay for costly transport and warehouse activities (costly because they take place in urban areas). An expert group is actually evaluating the relevancy of UDC. These experts have replaced UDC concept into what are called "urban logistic facilities" (espaces logistiques urbains), ranging from small pick up points or relay depots for e-commerce goods to large logistic platforms at the outskirts of cities. Business needs for new urban logistic services (home deliveries for clients, intermediary stocks and warehouses for retailers, pick up of pallets and conditioning, etc.) have been assessed through a recent study. Legal framework conditions include inner city traffic restrictions. In order to favour the UDC, La Rochelle has set up very strict regulations for inner-city deliveries : all trucks over 3.5 tons are prohibited except between 6 and 7:30 in the morning. As long as the UDC vehicles are submitted to the same regulations, this regulation
BESTUFS II – D 2.3 Best Practice Update 2007 / Part I Annex V - 5 Annex
was considered legal by the judge. Furthermore, the general public law requires that you favour one operator other the others only if you have a good environmental or "public order" reason for that, or if the private sector is "deficient". The La Rochelle UDC has been assessed recently in this regards, and it seems that the bid to select one operator and give him the monopoly other the UDC management was legal, because private services regarding electric distribution in the city centre were considered deficient.
Germany Generally, there are 3 forms of urban freight platforms to distinguish in Germany: A terminal operated by a transport operator within the city limits to carry out urban distribution processes
(single UDC) A terminal operated by a transport operator on behalf of a city logistics co-operation to consolidate single
consignments from different transport operators (multi UDC) A freight village on the city borders
The discussion to implement urban freight platforms (in particular freight villages) in order to achieve logistical, transport and environmental benefits in Germany started 20 years ago in the early 80s. As a result of this in almost all federal states of Germany concrete planning and implementation processes started. Especially within the mid 80s and early 90s a lot of scientific release appeared on freight villages. Reasons for this was that cities restructured their land use planning to that time and also a certain enthusiasm existed establishing new and innovative logistical structures in urban areas. At the beginning of the freight village development it appeared that the planning and implementation process was long and problematic, especially on local level. In particular this was due to a lack of consensus among the parties involved (city planners, transport operators etc.). It was very difficult to identify and declare area of more than 100 ha for transport services in urban areas. A lack of available land and the temporal availability of this land were one reason for the delays in implementation. Other factors addressed especially the uncertainties on the public side about the impact on the local employment situation within freight villages. The integration of the rail mode on some freight village locations was difficult to realise. Deficits are also to recognise in the marketing of freight villages. The focus in the past was much related to the integration of different transport modes (intermodal transport). The strengths of freight villages in the field of realising synergy effects and providing logistical competencies are not emphasised enough. Studies carried out for the freight village Bremen show a cost benefit ratio of 1 to 6. This implies that freight villages are a big business factor for a city or region. Not only regarding the environmental benefits of freight villages a new view is to focus on: Logistics as regional success factor Supporting the trend to intermodality and sustainable development Being a nodal point within international logistic network structures.
From the governmental side the development of freight villages has been supported from the beginning by initiating research and feasibility studies. Presently, freight villages are funded by given that a intermodal interface will be build (in parallel to the freight village development). Initially the national rail operator Deutsche Bahn (DB) AG supported the approach setting up a “Masterplan GVZ” in the mid 90s. But due to several strategic restructuring the DB AG is also seen as a barrier for the freight village planning. As the strategy of the DB AG foresees to concentrate rail and intermodal network on major routes and terminals a lot of freight village locations and development companies are uncertain about the commitment of the rail operator to build a terminal. Closely related to freight village activities is the initiation of city logistics co-operations which started by the end of the 80s/beginning of 90s. In 1997 between 70 and 100 cities or regions implemented or had plans for city logistics. The approach followed was that transport and forwarding companies co-operate delivering specific customers or zones in the inner city area. Different approaches occurred, some of them using urban distribution centres to consolidate and co-ordinate transport flows. In contrary to the establishment of freight villages urban distribution centres were not that politically pushed. A negative example – but which provided useful information for the further development of urban distribution centres in Germany – is given by the Nürnberg city logistics ISOLDE. An urban distribution centre was established in the inner city of Nürnberg to consolidate parcels distribution from 2 major parcel operators. In the end the approach failed as the high costs, especially for paying the rent for the distribution centre, but also time losses in the delivery process were the major reasons to close the distribution centre after a short operational period. Nevertheless, due to this (and other experiences) follow up approaches occurred, for instance in Kassel and Essen (see projects D-01 and D-02) but also in Berlin where the urban delivery centres
BESTUFS II – D 2.3 Best Practice Update 2007 / Part I Annex V - 6 Annex
are integrated into a common urban transport strategy. Greece The concept of “Freight Centres” started being discussed in Greece in the early 90s mainly through initiatives
of the Chambers of Commerce and Industry. At that time (and today as well), the three main challenges related to transport which had to be overcome both by decision makers and users in Greece were: difficulties in linking with the rest of the EU due to Greece’s peripheral location in conjunction with the
geopolitical instability in the Balkans trade imbalances leading to extremely inefficient loading factors especially as regards outbound transport a very fragmented road transport industry in which, a large number of very small players strive (without
the appropriate resources) to be competitive Thus, the main concern of the Chambers was to improve the efficiency of freight flows at a national and regional level and enhancing the competitiveness of the respective service providers. To this, the aim of shifting some road traffic to rail was gradually added (mainly for policy-related reasons) as well as improving urban distribution conditions (although this has always been a secondary goal mentioned in the respective studies but not investigated). In this context, the EU Cohesion Fund assigned the Hellenic Chambers Transport Association the „Study of the Hellenic Network of Freight Villages“, in 1996. The Study estimated the freight moved within or through Greece and proposed the locations of freight platforms which would handle these flows. These platforms formed an hierarchy with 10 of them undertaking an international role (Freight Villages), 14 of regional importance (Freight Centres) and 13 minor ones of local importance (Freight Nodes). Although almost all of these platforms are located in the vicinity of an urban centre, no specific mention is made in the Study of how exactly they could contribute in urban distribution improvement. Moreover, no particular estimations are made in the Study on the urban distribution throughput or the specific related problems in each area. Since then, feasibility studies have been assigned regarding some of the Freight Villages proposed in the Network Study. All of them regard multi-company facilities to be developed through PPP schemes and tend to focus on international and inter-regional flows rather than on urban distribution. Moreover they retain the main aims of the Network Study, whereas optimisation of the logistics operations in the urban conglomeration and urban traffic reduction are simply mentioned as a benefit but are not quantified. The fact that most of these studies were assigned either by local Chambers or Port Authorities also testifies the point of view adopted. Although significant mobility was observed regarding the issue, with the above mentioned studies and the organisation of related presentations and conferences mainly by the Chambers, no actual progress was made during the last decade as regards the actual development of these multi-company platforms. This was mainly due to the lack of real funding initiatives. An exception to that is the Freight Village of Piraeus (Thriasion Pedion) which is already under development. Nevertheless, urban distribution remains also in this case a secondary aim with the primary one being the facilitation of international flows (through the port of Piraeus as well as the railway) providing Free Zone, transit and light manufacturing facilities. It must be noted here that, although the development of the Platform is rather advanced, its operational focus is not still very clear. A reference is also made to a study recently completed, which was assigned by the Thessaloniki Port Authority. It concerned the development of a Freight Centre within the port area, which would have as a primary objective the provision of Third Party Logistics (3PL) services in the area. The centre’s throughput was therefore estimated on this basis and not on the general flows generated within or crossing the area. The business model of the platform was also examined in the same light and mention is made to the company mix that would promote this objective. Finally, one should mention also that, in the last 5 years, a number of individual companies (mainly large freight forwarders) had the opportunity to take advantage of a global grant by the EU, to develop their own one-company urban freight platforms at city outskirts. These platforms operate as local distribution centres, are in most cases located in industrial areas of cities and have in general nothing really innovative to show. Moreover, the benefits from their operation, as regards urban traffic and environment are not recorded. Only improvements in each company’s operational effectiveness as it translates in financial figures may be traced, but this is considered to be sensitive data and is not generally shared by companies. Still, this increase in operational effectiveness stems mainly from facilities and equipment modernisation rather than from any synergies or breakthroughs achieved within the companies’ urban distribution process. The main type of UFPs operating in Greece today are the one-company distribution facilities mentioned above (most of them located outside the two main urban centres, Athens and Thessaloniki). As regards the development of multi-company platforms, the Ministry of Transport has recently assigned the “Feasibility Study for the Development of Intermodal Freight Centres along the Hellenic Trans-European Network”.
BESTUFS II – D 2.3 Best Practice Update 2007 / Part I Annex V - 7 Annex
Despite the ever augmenting traffic congestion and environmental problems currently faced by most Greek urban centres, it is evident from the study title that the primary aim is again rationalisation of the international and inter-regional freight flows, improving the operators’ competitiveness and modal shift from road to intermodal combinations (mainly involving the railway). The study will finalise the network formulation proposed by the previous network study, choose the exact locations for six major Freight Villages with international orientation (as they lay at strategic points of the Hellenic Trans-European Network) and, for these 6 nodes, it will propose the suitable operational orientation and therefore, the services to be provided, it will formulate their detailed Master Plans and perform a detailed assessment of their financial and socio-economic feasibility and viability. The study will conclude with the centres’ strategic development plans and the formulation of the Terms of Reference for their development. Clearly, though this study, it is possible that concrete proposals should emerge, regarding also these centres’ roles in urban freight transport. Nevertheless, it is still in its initial phases and therefore, no particular proposals or concepts can be mentioned. More details about its progress and findings can be found at a later stage in the Web (www.freightcentres.gr). As regards general awareness, it can be said that the stakeholders (public and administration at all levels) are sufficiently aware of the need for some rationalisation of freight transport (urban, national and international) but it seems that the role of freight platforms in connection especially to urban freight transport is not always clear to them. The legal framework regarding the development and operation of freight platforms (urban or not) presents several gaps which however will be systematically studied within the above mentioned study recently assigned by the ministry of Transport. As regards urban planning and land use regulations, as the moment, those applied to the industry in general also apply in the case of Freight Platforms as well.
Italy Urban freight platforms (Urban Distribution Centres) represent a relatively old concept. Big private firms (that is big transport and logistic operators, express couriers etc.) have already realised their own platforms nearby the main Italian urban areas. These (mainly road-road) “single company” UDC allow the consolidation of goods flows and increase the efficiency of the collection/distribution process. The situation appears totally different when we examine UDC addressing the solution of the collection/distribution problem for small retailers. In this case the UDC concept is a new one and the debate about the development of this kind of UDC has begun recently. The main motivation for the development of UDCs (those for small retailers) is the external costs that urban freight distribution is responsible for. Light duty vehicles represent only 6.6% of the total “urban fleet” but they produce 13.2% of the total mileage (vehicle-km) substantially contributing to congestion and occupancy of the urban area. Furthermore this small amount of vehicles is responsible for 36% of the PM10 emissions. Therefore the main motivation for the development of UDC is quality of life and environment. No clear ideas exist about the real possibility of increasing the efficiency of the distribution process through the UDCs. Success or failure of the UDC concept is not clear enough when we examine logistic performance, cost of infrastructures, transhipment costs etc.. Anyway, one important fact is that the retail sector in Italy is quite fragmented. The small retailers (“piccole superfici”) still approximately account for 75% of the retail market (the corresponding value in France is 41% while in Germany it is 35%). This is a peculiarity of the Italian case and has an important impact in terms of organisation of the logistic chain, logistic efficiency and environmental impact. For this reason the “sensitivity” of the Italian urban systems to the Urban Freight Distribution issues is particularly high. Three main types of freight platforms can be identified. The first one is a road-road, single private company infrastructure. Its main scope is the optimisation of
logistics activities through internal re-boundling and economies of scale. The second one is the so called “Interporto”. Interporto is a freight village, generally owned by different
public authorities, where different transport and logistics operators establish their main offices or branches. Warehouses and other infrastructure or services are available. In some case this kind of freight village also have a Rail-Road Intermodal terminal. They are mainly interested by medium-long range freight flows and have an important role in the regional economic development. In many cases (ex. Bologna Freight Village) these freight platforms have been realised not far from the urban areas; therefore they seem to be good candidates for becoming also Urban Freight Centres addressing the freight distribution issues in urban areas (that is to become also UDC of the third type described below).
A third interesting concept is the Urban Distribution Centre aiming at reducing the light duty vehicle traffic
BESTUFS II – D 2.3 Best Practice Update 2007 / Part I Annex V - 8 Annex
in the inner urban area. Such a type of freight platform is not widely used in Italy at the moment, but a number of local authorities are developing specific studies and demonstration projects. This kind of platform would in general be managed by a consortium grouping retailers, transport and logistic operators and public authorities. Referring to the third type of freight platforms mentioned above, the main strategy followed in Italy is the use of this kind of UDC together with a fleet of low environmental impact vehicles.
The main peculiarities of the Italian case are the following two: Italian car and trucks industry produces new interesting solutions, that is Compressed Natural Gas
vehicles (cars, light duty vehicles and buses). The Italian industry is considered a leader in this field at world-wide level.
Italian Government, Unione Petrolifera (the organism grouping the main Italian oil industries) and Fiat have recently signed an agreement for a wider use of the CNG technology.
Due to these particularly favourable conditions UDC together with low environmental impact vehicles are expected to be a good solution in the next few years. The central government is well aware that city logistics is an important issue. The “Piano Generale dei Trasporti e della Logistica” (National Transport and Logistics Plan) contains some indications about the way of facing the city logistics problems. Particularly it establish that the “Piano Urbano della Mobilità” (Urban Mobility Plan) is the tool for treating both people and freight urban mobility. Local authorities are more and more conscious that City Logistics is an important part of the wider mobility problem. Among the City Logistics issues, urban freight platforms seems to be one of the most important concepts. Also transport professionals are aware that some change will probably occur in the next future and that they will probably be obliged to change their way of working due to the possible implementation of new UDC. The debate about UDC (still referring to the third type of freight platform mentioned above) has begun recently. No clear consensus still exist with respect the real capacity of UDC to optimise freight urban distribution. This is due to the fact that only a few projects have been done, and for the most part of them results must still be produced. A certain number of cities are doing studies and, in some case, real projects, combining the UDC centre concept with other solutions (regulations, new technologies, low impact vehicles etc.). Among these cities we can mention: Genova, Siena, Bologna., Ferrara, Vercelli. Only few real implementations have been done. The most part of these projects are still at a study level. Experts groups, workshops, conferences are frequently organised at national level. Public institutions, retail associations, transport and logistics operators associations, universities and research centres are all involved in the debate and in the organisation of specific events. The most important regulation of the urban transport system concerns vehicles emissions. The most part of proposed studies/projects concerns UDCs together with the use of low environmental impact. Once the UDC realised only low impact vehicles will be admitted in the urban city centre. Some general conclusions can be consolidated: an in-depth knowledge of the urban mobility system (offer, demand, logistics chain organisation,
stakeholders, etc.) is necessary for understanding what kind of UDC can be realised; a unique solution, to be directly transferred in different cities doesn’t exist. Each city has its own
peculiarities. different tools, regulations etc. must be attentively applied together and harmonised in order to identify
“integrated solutions”. Once the solution identified, it must be implemented step by step, trying to generate consensus among
retailers, transport and logistics operators, citizens. Netherlands Increasing traffic volumes made governmental institutions aware of the risks of their infrastructure networks
becoming overly congested, which might lead to what is called a “traffic cardiac” of the city, an urban infrastructure network malfunctioning because of extremely heavy congestion. The approach followed by cities in the early nineties was a establish a urban distribution centre with the purpose to consolidate (LTL-) freight flows. The goods would be transported into the city with (preferably with environmentally friendly) vans or small trucks that use less space and produce less noise and emissions. The approach was completely unsuccessful because hardly any market parties were involved in the planning, which resulted in a very low acceptance. Furthermore transport companies would not co-operate because they feared loosing clients. In order to develop a successful approach towards urban distribution, in 1997 a public private partnership between authorities and transport actors in the Netherlands called Platform Stedelijke Distributie (Platform Urban Distribution) was established to co-ordinate projects and disseminate information on urban distribution
BESTUFS II – D 2.3 Best Practice Update 2007 / Part I Annex V - 9 Annex
issues. One of the most important issues pointed out by the Platform regarding freight platforms is the necessity to involve market parties in the planning and development process. Successful implementation was achieved in a few cases where market parties were involved in the planning and development. In these cases the freight platforms are commercially operated distribution centres which can obtain an urban distribution status (see project NL - 01). This strategy focuses on the development of logistic parks in public-private partnerships. In this strategy, a logistic service provider can obtain a urban-distributor’s status which means that this provider has certain rights that other companies don’t have. An example could be the allowance to use bus lanes, or the allowance to enter the city centre outside of the delivery time frames. According to the view of the national government, these logistic parks should be part of a nationwide network. In the future, these logistic parks should be connected to underground transport and/or inland shipping. Following the trend of decentralisation of responsibilities, the national government limits its activities to stimulation and facilitating urban freight platforms; the responsibilities for developing initiatives will lay at provincial or municipal level. Because freight volumes to most cities are not large enough for urban distribution centres to be financially feasible, regional logistic parks are favoured by governmental and market parties alike. Public private partnerships are seen as a critical success factor. The main aims are to: Improve liveability of cities Reduce mileage of trucks (over 7,5 tons) Reduce emissions (pollution and noise) Improve safety Improve logistic performance
Governmental and research institutes acknowledge the present and future problems. The expected growth in traffic volumes is consistently stated in documents on urban freight distribution problems and solutions. Surveys however show that citizens consider the urban freight distribution as a minor problem. They rather refer to cars as a hindrance to the liveability of a city. Transport professionals refer to the reduced accessibility of cities caused by cars and the problems they have delivering within tight delivery time frames. There is consensus about the fact that regional logistic parks could help to improve freight distribution, but only when market parties are involved in the development. Market parties are very sceptical about the plans for a nation-wide network to connect the regional logistic parks. The transport and transhipment of fresh, cooled and frozen products is subject to strict legislation which limits the possibilities for consolidating freight flows. Transhipment of high value products is often prohibited by insurance companies. Cities that have implemented freight platforms, combine this with some of the following measures: delivery time frames, weight restrictions and length restrictions.
Spain There is no operational Urban Freight Platform in Spain. Although, a consolidated plan for one exists in the city of Malaga (see project E-01). This project is delayed because of technical problems, and probably should work in the beginning or spring of 2003. At this moment, the relevance of different type of urban freight platform, even the mean of UFP is not significant in Spain. Except the case of Malaga. The concept followed implies the PPP, public and private participation. The distribution in the historical centre will be limited to determined alternative vehicles that are associated to the Freight Platform. The initiative in this case are leaded by the Freight Providers’ Association together with the Traffic and Transport Authorities in Malaga Municipality. Relevant legal framework conditions include legislation for the bundling for fresh produce, as well as, dangerous products. There are no environmental and land use planning regulations restricting or promoting urban freight platforms.
Sweden The first urban freight platforms appeared in the 1950s. Transport companies started building terminals for distribution in the Stockholm area. In these terminals the trucks from far away could offload to smaller trucks for urban distribution. The terminals were also used for storage of goods if the customer asked for that service. Later the terminals were connected with a railroad track so that they could take freight trains directly in to the terminal. However, it was just one company per terminal and there was no co-operation. Today, there are many platforms of single transport operators or forwarders (wholesalers) which have been growing in size constantly. When the companies build new terminals they are built a few miles outside the cities. Rail connection is a natural thing in most of the newly built terminals. Although particularly among the forwarders there are efforts made to co-operate over company borders, examples of multi-company distribution centres are scarce. There have been a number of trials but most of them have failed for different reasons. However, experiences are shared within many networks and
BESTUFS II – D 2.3 Best Practice Update 2007 / Part I Annex V - 10 Annex
institutions. The awareness is good both in the political area and in the private sector, but the hardening competition in the market is a big hurdle for co-operation among companies. Freight villages are not common. Regarding freight platforms there is some restraint in the land use planning regulations when it comes to traffic disturbance. Furthermore, in some Swedish cities there is a restriction on how long a truck is allowed to be. That limit is 12 meters in most cities. In Stockholm we have a harder restriction in certain parts of the city. In three cities the trucks is restricted to a specific engine. If they don’t have that specific engine class they aren’t allowed in to the city. This is called environmental zone in the Swedish model.
Switzerland Logistic platforms in Switzerland are generally much smaller in size than those in other European countries. The biggest Swiss platforms are well below 100 hectares. Without the only exception of Embraport near Zurich (see project CH-02) the concept of freight villages as the GVZ in Germany is not known in Switzerland. Single company platforms however are abundant, but mostly distributing on a national or regional rather than an urban level. Most of these platforms gather in the region between Olten and Zurich in north-central Switzerland, where the main North-South and East-West transport corridors are crossing. Apart from the freight platforms in the narrow sense there are several ‘logistic zones’, i.e. industrial zones where a number of logistic and / or transport service providers have been grouping together. Logistic zones rather close to the city centre have developed historically (beginning of the 20th century) in parallel with industrial activities and railway in the larger Swiss cities like Zurich, Geneva and Basel. Today they face major problems because of poor accessibility and large hikes in land prices resulting in high pressure for using these areas for leisure or commercial activities. This pressure from urban development is likely to change these zones in the next years. Similar zones also have developed in the outskirts of large agglomerations such as Zurich, Basel and Geneva, sometimes even several per agglomeration. They serve both the supply of the agglomeration and the regional industry. In Switzerland, a public debate between private and public stakeholders is missing, resulting in uncoordinated development of logistic platforms. There is no specific plan for the co-ordination of logistic platforms on a national level. However, a recent national study (Poschet et al. 2000) suggests the establishment of a national strategic plan for logistic platforms of national interest in order to co-ordinate the national and regional planning. Furthermore the study encourages the development of multimodal freight villages in order to strengthen the role of rail. Also logistic zones are suggested to be developed towards multimodality as well as towards city logistics and urban distribution. Single companies shall be discouraged from building their own platform. Rather they should group with other logistic companies in order to use synergies making investments in rail connections and transhipment facilities more attractive. In the mid 90ties Switzerland followed the German trend in City logistics projects. From the national DIANE project on energy efficiency did emerge 4 city logistic projects: Bern, Basel, Zurich and Biel. However, none of these projects is operational anymore today after the demand staid way below what would have been necessary to be profitable. The Regiologistik distribution platform in Biel delivered only 110 consignments or 20 tons respectively within its last 12 months. In the Örlike Cargo project in Zurich the last mile delivery was executed by a single private transport operator for all participating companies and all receivers. The platform was located in the northern outskirts of Zurich and processed all kind of products. For the Basel experience see Project CH-03. A later city logistics project in the town of Schaffhausen failed too (see project CH-05). After these deceiving experiences the former boom for City Logistic projects has declined considerably in the last few years. Nevertheless another city logistics project was started in 2000 in the town of Thun. By today, it is the only operational and promising example of city logistics in Switzerland. Legal restrictions include the “Verordnung über die Umladestationen des kombinierten Verkehrs” and the “Accord general sur le transport combiné” that states certain technical and spatial requirements for the establishment of transhipment platforms. Spatial planning instruments on a regional (cantonal) level fix the location of existing and possible future industrial areas suitable for logistic platforms. The “Verordnung über die Umweltverträglichkeitsprüfung” requires a specific study on the environmental soundness for transhipment and distribution centres with more than 20'000 m2 of storage area. Further, the law on the introduction of the Swiss Heavy Vehicle Fee (LSVA) de facto exempts the pre- and end haulage of combined transport of up to 40 km from the fee which can influence the location decisions of logistic platforms (see project CH-01).
United Kingdom
For 25 years the subject of urban distribution centres has been promoted, studied, case studies built, and the idea found wanting. Studies have included Chichester 1975, Swindown 1976, Bradford 1976, Worcester mid 1980s, Hull 1978, Winchester mid 90s and Chichester mid 90s. No public projects had actually been launched. A cycle based distribution company in York is run as a private enterprise (see project UK-01).
BESTUFS II – D 2.3 Best Practice Update 2007 / Part I Annex V - 11 Annex
The UK at a governmental, industry and academic level has been somewhat sceptical of the publicly owned and operated multi-company UDC concept. Whilst it is not dismissed as a possible future tool the government’s Sustainable Distribution policy document voices that view: “6.58 There may also be scope for exploring more radical ideas. It has been suggested, for example, that the environmental and wider impacts of urban distribution could be reduced through dedicated "City Logistics" systems, in which goods destined for premises in city centres are diverted into common transhipment facilities and local/city centre distribution is carried out using specialised vehicles, which may be smaller, quieter and less polluting. Schemes of this kind have been brought into operation in other countries, for example in Germany, Holland, Denmark and Switzerland. (...) The continental experience would not necessarily translate directly to the UK, as industry structure and other relevant conditions differ from one country to another. Moreover, it is not clear that ambitious City Logistics projects have delivered the benefits that their sponsoring bodies intended. Physical transhipment is costly; regulated systems can be inefficient and smaller lorries are not necessarily better, if there are more of them on the roads. Systems which encourage greater consolidation of deliveries within urban areas may have more to offer. Pilot research has already been commissioned by the Retail and Distribution Foresight Panel, under the umbrella of the Department of Trade and Industry's Foresight programme. DETR is represented on the Panel and involved in this work, which has initially focused upon the prospects for improving co-ordination of collections and deliveries in cities and enhancing resource utilisation through better information systems; in effect a 'virtual City Logistics' concept. The Government will consider further research on specific aspects with a view to establishing the case for one or more 'pilot' projects, in order to develop trial systems and verify concepts under live operational conditions.” [Department for Transport, Sustainable Distribution: A Strategy, http://www.dft.gov.uk/itwp/susdist/index.htm]. The Freight Transport Association, one of two major freight organisations, is guarded in it’s response but still has no enthusiasm for them: “This type of centre offers a more practical opportunity than the more traditional view of a transhipment centre. However it is most efficiently conducted by market forces and not prescription (including vehicle bans) Where a common carrier can consolidate individual partnerships with the public sector may offer the possibility for priority delivery access for goods vehicles.” [Research carried out for the CITYFREIGHT research project, FTA written response.] A research project carried out by the University of Huddersfield reached very similar conclusions in the mid 90s: „A review of urban freight policy options available to planners and policymakers suggests that it will be very difficult, time consuming and expensive to arrive at a set of policies acceptable to all parties involved. A questionnaire survey of expert opinion confirms these findings and highlights clear differences of interest and priority , particularly between local authority planning bodies on the one hand and transport and logistics operators on the other. A literature review of previous U .K. research into urban freight problems and the potential for trans-shipment suggests that the disadvantages of trans-shipment depots and the extra costs they impose on operators and transport users are likely to outweigh any benefits obtained. Trans-shipment facilities of the type normally advocated are unlikely to be viable in urban areas of less than 150,000 inhabitants. This finding is supported by two brief recent U .K. case studies, in which the potential for trans-shipment has been investigated. (...) The two studies undertaken recently in Winchester and Cambridge would seem to confirm the findings from earlier investigations that urban freight transhipment is not viable in the U .K. in the present circumstances, despite the growing environmental problems in urban areas. The importance of such recent work (and particularly the work in Winchester) is that it has been carried out against the background of modern logistics management, rather than traditional freight transport. This highlights the important point that innovative solutions to urban freight problems will only be accepted if they are developed in co-ordination with business, in particular the major retailers and transport operators. It is the evolving strategies used by these companies that provide the essential links between national and local freight transport policies..“ [Freight in Urban Areas, University of Huddersfield, undated but believed to be 1996]. However, in the last two years this view has changed somewhat. A consolidation centre was opened by BAA (British Airport Authority) at Heathrow airport in 2001 as part of their environmental strategy to improve air quality and packaging waste management (see project UK - 02). During 2002, a consolidation centre was opened at Meadowhall shopping centre in Sheffield. This is one of the largest shopping centres in the UK. In this scheme participating retailers have their deliveries made to the 50,000 square feet consolidation centre which is located several hundred metres from the shopping centre rather than direct to their shops. The goods can be stored at this facility; pre-retail services performed on them and can then be transported to the shops at the retailers' convenience using a shared delivery system. These schemes represent a new development in
BESTUFS II – D 2.3 Best Practice Update 2007 / Part I Annex V - 12 Annex
logistics and distribution management in the UK. It is not yet clear whether similar schemes will be widely implemented in the UK. National planning policy guidelines 3, 6 and 9 do promote the placement of distribution centres at the periphery of towns and cities, and commercial/retail development in the centre. This might militate against a central placement for an urban distribution centre.
BESTUFS II – D 2.3 Best Practice Update 2007 / Part I Annex VI - 1 Annex
ANNEX VI
Collected case studies (projects-level) – Urban freight platforms
Code City/Region Name of concept Short description of concept
AT - 01 Graz Cargo Center Graz The Cargo Center Graz (CCG) is a freight village with additional urban distribution functions. The Styrian government together with chamber of commerce initiated the project and the idea of developing a Public Private Partnership in 1997. The platform should start operations in 2003. The freight village is located 12 km outside the city centre of Graz to the south where many of the automotive companies are situated. The facility was newly built in the open countryside. The Urban distribution centre, which will be integrated into the freight village, will mainly serve the city of Graz and the surrounding areas (400.000 inhabitants). Graz is a turntable for international transport connecting Northern and Central Europe with Italy and Eastern Europe. Graz is probably the most important and fastest growing economic area in Austria, especially enforced by automotive and high-tech industry. Like any other city in Austria Graz has traffic problems in the centre and the main connections. There is no space for urban distribution centres and efficient facilities for intermodal transport, especially a transhipment terminal are lacking. It is the aim of the CCG to switch transports from road to rail, especially the transports of the automotive industry. Different individual freight centres are already operating – including the RCA (Rail Cargo Austria) with intermodal deliveries within Austria. From the CCG there is direct connection to the motorway and railway system. The facility has a transhipment terminal for intermodal transport. The Airport Graz-Thalerhof is 4 km away, the Airport Business Center is located within 2 km. The whole facility will cover an area of 500.000m², whereof 75.000 m² covered transhipment area and 100.000 m² open transhipment area. The rest are storage (warehouses) and office buildings. Companies on site include carrier and forwarding agencies, ÖBB – the Austrian federal railway system, logistic providers (especially operator of the urban distribution centre), service providers (IT-support, repair and cleaning facilities, ...) and customs clearance. Any type of freight which is usually transported on road and rail (containers, parcels, ...) will be processed. Two cranes are installed for transhipment. At the beginning the facility will handle around 36.000 lifts a year, whereas the maximum capacity is at 100.000 lifts. Prognosis say that in 2030 around 95.000 lifts will be carried out on the transhipment terminal. The project is realised as a Private Public Partnership – PPP, involving private carrier and forwarding agencies, the three largest banks of Styria and the Styrian Energy Supplier. The province of Styria and the Federal Government are not directly in the partnership. The operating company is the Cargo Center Graz - CCG KG, which is owned by private carrier and forwarding agencies (51%), the energy service provider ESTAG (25,1%), and the three largest banks of Styria (23,9%). The terminal is financed by the Schieneninfrastrukturgesellschaft SCHIG and built by the Hochleistungs-Strecken AG, both state-owned companies. The SCHIG will lease the facility to the CCG KG for a duration of 30 years, who will then become the owner. Investment costs are about 130 Mill EUR. 80 Mill EUR are covered by federal financing (SCHIG), 50 Mill EUR by private investors. The users will be charged for logistic services. The local authorities including the
BESTUFS II – D 2.3 Best Practice Update 2007 / Part I Annex VI - 2 Annex
Code City/Region Name of concept Short description of concept provincial administration supported the project in case of zoning and legal procedures. The province of Styria supported the foundation of a co-operation called Styrialog (see project AT-02). The province of Styria as well as the federal government helped to finance the project. As far as the project proceeded it seems that the PPP-model works pretty well. The project is on time. [[email protected]; www.c-c-g.at]
AT - 02 Graz Styrialog In 2000 the Styrian government initiated the planning and design process for Styrialog, an Urban Distribution Centre (UDC) located within the freight village CCG (see project AT-01). Several consulting companies are involved in the planning process as well as a local railway company (LTE) and various transport providers including parcel services. The UDC will integrate road and rail transport and cover an area of around 2000m2. The UDC will provide transhipment, storing, bundling and distribution functions. In the future the deliveries for the hospitals in Graz and the surrounding area shall be optimised. [[email protected]]
AT - 03 Salzburg City Logistik Salzburg Due to the very difficult situation in the city centre because of time windows for deliveries and the historical structrue of the centre the Industriellenvereinigung (together with the Altstadt Marketing GmbH and the city of Salzburg) in 2001 initiated a planning and design process for an Urban Distribution centre (UDC). Salzburg is the capital of the province of Salzburg with 150.000 inhabitants. The city has road and railway connections to each direction and is a border station to Germany. The initiative is focussing on the inner city of Salzburg which is mainly delivered by lorries. The main part of the system is the City Terminal (CT) fulfilling storing-, bundling- and distribution-functions. Several scenarios have been developed, defining the functions of the City Terminal reaching from only transhipment, to cross-docking, to storing and commissioning of goods. The UDC was calculated to cover an area of 5.200 m², of which the terminal would have 1.200 m². It was calculated that around 60.000 kg a day could be forwarded from the UDC. The concept is created to tranship any type of goods on pallets and in boxes (parcels), although there are some exceptions, in case when special logistic solutions are needed. Time delays on the platform depend on the type of goods and the interval of delivery. There is no location considered until now, but it should be close to the city centre. The next steps include the development of a concrete business-plan and business-case model for realisation. However, it seems that the transport providers do not belief in a positive economic effect by city logistics. [[email protected]]
AUS - 01 Melbourne Port shuttle service The CRT company operates intermodal hubs in the inner western area (Altona) of Melbourne, Badiana in Wodonga and in the western suburbs (Yennora) in Sydney all connected by rail. Daily train services transport bulk polymer in containers between these locations. These avoids having to operate a large road transport fleet. Currently a shuttle service operates between the Yennora depot and the Port of Botany in Sydney. Empty export containers are railed back to Yennora where they are packed for export and railed back to the Port. Trucks are involved in local customer deliveries while rail does the linehaul. A Port shuttle service will commence shortly in Melbourne. A common user facility will be established at Altona aimed at carriers, importers and exporters in the Western region of Melbourne. The site will have Australian Customers approval and will offer transit storage for carriers to better manage their distribution task. Continuous receivals for exports will be available and the facility will operate on a double shift basis to increase flexibility to carriers and their customers. This shuttle service will greatly reduce the road congestion at both the Port and roads leading to the Port. This will alleviate
BESTUFS II – D 2.3 Best Practice Update 2007 / Part I Annex VI - 3 Annex
Code City/Region Name of concept Short description of concept many problems associated with trucks travelling within inner city residential areas. The State government has recently announced that it will construct a new bridge to improve access to the Altona site and reduce the impacts of trucks travelling to and from the site.
AUS - 02 Melbourne Austrak A freight platform is currently being developed at Somerton an outer northern suburb in Melbourne. This site combines a rail terminal, container park and a cluster of distribution centres. The site has excellent road access to the outer western ring road that has good access to a large number of private warehouses and distribution centres.
BE - 01 La Louvière region (Mons, La Louvière)
GAROCENTRE GAROCENTRE is a transportation and warehousing centre located in La Louvière at the intersection of the Paris-Brussels (E19) and the Dunkirk-Cologne (E42) highways. Direct access to the freight village exists from both highways in both directions. The freight village is located near the Canal du Centre and at the proximity of the urban areas of Mons, La Louvière, Charleroi and Nivelles, the industrial parks of Feluy, Seneffe and Strépy and the airports of Brussels (50 km), Charleroi (25 km) and Lille (80km). Responsible for the land property and real estate management of GAROCENTRE is the Intercommunale de Développement Economique et d’Aménagement du Territoire (IDEA), an association of 25 municipalities from the regions of Mons and La Louvière (in the Walloon Region). Its activities include the welcoming of new investors in the region, the supplying of technical services to companies as well as town and country planning. The idea of the GAROCENTRE project was first discussed in the 1970s at a colloquium on freight transport organised by the Economic Chamber of La Louvière, IDEA and ‘Mouvements’, a journal specialised in transports. Based on information available on the development of logistic parks in other countries, it was suggested that such a logistic park in the La Louvière region would be an interesting tool to be provided to the industries of the region carrying out import/export activities. GAROCENTRE was built in 1987. The 55ha freight village is fully designed and equipped to welcome enterprises of the logistic and transport sectors. It provides flexible warehousing rentals and on-site customs services. Some 25 enterprises are located on the site including, amongst others, truckers, senders, customs agents, centres for continued education and training of truck drivers, distribution centres and customs offices. The logistic park processes general freight (foods, computer materials, …). Dangerous goods (e.g. explosives) are not allowed to be stored on the site. Some specialised warehouses are present for the storage of refrigerated foods. Volumes of goods transiting through the freight village are variable. It may happen for example that companies who have constructed their own installations on the site rent additional storage space to IDEA for limited times to respond to punctual increased needs. A lot of international transport is transiting thought the freight village. As a result, a customs office has been installed on the site and is very active. A lot of cross docking is taking place. Many companies on the site also supply local surrounding municipalities and industries. Large 30 tonnes trucks arrive in GAROCENTRE and freight is redistributed to smaller trucks or vans to be transported to Mons or La Louvière for example. IDEA receives subsidies from the Walloon Region (usually 80%) as well as from the Phasing Out programme (50% EU, 40% Walloon Region, 10% IDEA). GAROCENTRE is presently a road terminal. Projects to develop a multimodal road/rail/water platform near GAROCENTRE are under discussion. Access to the fluvial network will be possible through the presence of the Canal du Centre in the area. A quay will be constructed for transhipment from trucks to barges. Extensions of the freight village are also underway to build a connection to the railway network. IDEA is currently in negotiations with the SNCB. It is expected
BESTUFS II – D 2.3 Best Practice Update 2007 / Part I Annex VI - 4 Annex
Code City/Region Name of concept Short description of concept that the connection will be effective in two years. The British distribution company Gazeley has recently bought 48 hectares of land on the site and is expected to build its first warehouse by the end of the year. A significant increase in activities in the freight village is expected as a result. The localisation of Garcentre at the intersection of the E19 and the E42 and thus easiness of access is an important factor in the success of GAROCENTRE both for international transports and for the distribution of imported goods to the surrounding municipalities and industries.
BE - 02 Halle (Brussels) Colruyt centralised storage and distribution centre
Colruyt’s centralised storage and distribution centre is located in Halle, on the outskirts of Brussels near the Ring road. The centre is nearby the rail network but is not directly connected to the network. Colruyt is a Belgian family company which has become one of the major players in the Belgian retail network. It has developed a large network of supermarkets with a particular sale strategy based on rapidity and efficiency of purchase and best prices on the market. The company owns 170 supermarkets across Belgium and employs approximately 10,000 people. The Colruyt network of supermarkets covers the whole of Belgium. Colruyt has centralised its administrative services, warehouses and production divisions in Halle and Ghislenghien. Suppliers bring their goods to the centralised warehouses from which they are then transported to the Colruyt supermarkets in urban areas across Belgium by trucks owned by the company. Total area of the warehouses exceeds 200,000 m2. Each day, Colruyt’s drivers drive more than 60,000 km to supply the stores. Products sold in Colruyt supermarkets mostly include fast moving consumer goods and electric household appliances. Recently Colruyt has also developed the sales of cars. Transport planning is established with computer programmes especially designed for this use. These programmes also allow to ensure that all trucks are loaded in an optimal manner to deliver the supermarkets without however exceeding the maximum authorised load. To reduce the number of kilometres driven, the company has decided that trailers can only leave the warehouse when they are 95% full. After delivery to the supermarket, the trucks bring the store’s wastes and empty packages back to the centralised warehouses. They thus never run empty. The localisation of the centre has been one of the important factor in the successful development of Colruyt as one of the major players in the Belgian retail network. [www.colruyt.be]
BE - 03 Brussels Brussels Morning Market (MABRU) The Brussels morning market is managed by the MABRU association which stands for Marché-Bruxelles. MABRU was founded by the city of Brussels and Gromagro, the association of the morning market users. The market is located in the north of Brussels along the Canal de Willebroek. The Brussels morning market is a covered market with a total area of 40,000 m2 designed essentially for the sale of fresh products including fruits, vegetables and flowers. It is the largest and the most specialised market for fresh products in Belgium. The market is open everyday during the week and on Saturdays. Fresh products from all over the world are sold by wholesalers and importers who rent their space in the market from MABRU. Shop owners from the Brussels region but also from across the country come to the market to supply their small and medium size stores with fresh products. Additionally, a number of product dealers from the market have come together to create the Brussels Market Service which delivers products ordered by telephone or by fax anywhere in the country with refrigerated vehicles. Transport of
BESTUFS II – D 2.3 Best Practice Update 2007 / Part I Annex VI - 5 Annex
Code City/Region Name of concept Short description of concept products to and from the market is carried out by road. Activities of the Brussels morning market have decreased over time as the market’s main clients, the small and medium stores are being replaced by large supermarkets, who do not supply themselves from the market. [www.mabru.be]
BE - 04 Antwerpen Slachthuissite (Slaughterhouse-site) It was the city of Antwerp that in 1998 initiated a planning and design process for the slaughterhouse in order to craete a long term vision for the site because it was no longer profitable. The slaughterhouse has been in the city since 1877. First it was located at the border of the city, now it is in the middle of a residential neighbourhood. Since the beginning the slaughterhouse was used for the slaughtering of cattle, the production of meat products and the distribution of the meat products. Until recently there was also a market place for cattle trade (without slaughtering). In 1998 the results of a study showed that even today the slaughterhouse has various strong points, but that restructuring was necessary because it was working at a loss. The strong points were: Excellent accessibility and location High tolerance towards the slaughterhouse by the neighbourhood Specialised in ritual slaughtering, which is important for a part of the multicultural population of the city.
The site consists of three large halls and many small firms around these halls. The restructuring of the site aims for a complex with slaughter lines in one hall, a training centre in the second and a wholesale company in the third hall. The companies around the halls (mainly meat cutting and packing companies) and around the site (mainly restaurants) could buy the goods they need from this wholesaler. Goods that can be bought from the wholesaler are: everything needed for packaging the meat, plates, knives, butchers clothing, but also all kinds of goods that can be used in restaurants. The place should become an area where everything related to meat and meat products can be traded. The distribution of the meat products is mainly to the city of Antwerp itself, restaurants, butchers, etc. The animals are brought in from elsewhere. The only transport modes used at this location are large trucks and smaller vehicles to deliver in the city. (No train or inland navigation, because of the perishable goods, which need to be transported in reefer trucks and be fast at their destination) In January 2002 the property of the slaughterhouse was transferred from the city to GOM, a regional investment company. They now have to negotiate with slaughter companies, and wholesale companies who would like to settle at the site. [[email protected]]
BE - 05 Antwerpen BPA Groothandelsmarkt (wholesale market)
The reason why in the 1970´s a number of fish companies were established on this site was in the first place that harsh rules with regard to law on nutrition companies were imposed on them. But also on the new site they were not of any hindrance to the residential areas in which they first were located. Moreover, this location was, and still is, very well accessible by trucks. The site kept growing and the local government decided that it should be given the opportunity to expand even more. Therefore the administration is now providing the conditions to enlarge this site into a full worthy Distribution Centre (DC) for nutrition products. The local administration prepares a BPA (Bijzonder Plan van Aanleg Special Plan for changing the purpose of land use). This plan will chance the destination of the land use so it can be used for other purposes than for what it is being used now. The aim for this area is to attract more wholesale companies so it becomes an even more important distribution centre than it already is. The project is still in a premature phase. It will
BESTUFS II – D 2.3 Best Practice Update 2007 / Part I Annex VI - 6 Annex
Code City/Region Name of concept Short description of concept provide more economical land use, co-operation between the companies, synergies, no unnecessary mobility movements, etc. The local government will make it possible for companies to settle at the site (legally) and will provide good framework conditions (infrastructure, utilities, …), but private companies must invest in their own real estate, etc. This will be in a competitive environment (no state-aid). New infrastructure will be provided. Each new company may have a limited space for parking facilities. On the site common parking space will be provided in order to pursue a more effective use of land. The costs of restructuring and expanding infrastructure and buffer zone will be paid by the city of Antwerp, the companies must pay for their own expansion. The area of this DC has developed partly spontaneously (outside the residential neighbourhoods, law on nutrition companies, smell pollution) and partly because of the great accessibility and expansion possibilities. From here the city centre can be reached very easily to supply the restaurants and stores and it is only a few minutes driving to the highways around Antwerp to deliver in the region or to receive the goods on the DC. At the moment about 15 companies are established on the site. Most of them handle in perishable goods (fish, vegetables and fruit) and therefore are bound to special regulation with regard to building restrictions, nutrition handling, etc. For example receiving and sending goods must take place at different places in the building, one can not use the same quays for both activities. Most existing companies in the area have clients in Antwerp or in the region. Some also serve the national market. Therefore we must look at this distribution centre on a city level within the urban area of the Flemish diamond. This DC is located in the southern part of the city close to the national highways. The aim is to attract new companies in the nutrition sector. The concentration of similar companies strengthens the identity of the DC and enlarges the possibilities of co-operation between the companies (synergies). Also unnecessary movements can be avoided. Activities that can take place at the DC are receiving large orders, re-packing the goods into smaller units and ship them to the buyers. At the moment only large trucks are used to receiving the goods at the DC and smaller vans are used to deliver the goods in the city centre. There are railway tracks leading to and from the DC but these are not in use at the moment. With the volumes handled now and in the future it is not expected that the train will become in use. There are no inland navigation possibilities. The total size of the area is 296,000 m². At the moment 71,104 m² is built upon (allowed is on 148,142 m²), 44,005 m² is used for infrastructure and buffer. The special plan for chancing the purpose of land use should extend the area allowed to build on by 24,295 m² and provide 36,098 m² extra space for infrastructure on the site. Some of the existing companies expect to enlarge their activities in the near future and will need their own space that until now has not been used. At the moment this ground cannot be built on since no building permission can be issued as long as the BPA has not been approved. In the future it might be possible that companies bundle their deliveries instead of driving all individually into town, that they organise their waste transport together, etc. [[email protected]]
CH - 01 Rekingen (Zurich) LGZ Hochrhein The logistics platform and freight village LGZ Hochrhein (Logistik und Güterverkehrszentrum Hochrhein) is currently taking up operation. It is a private initiative of a group of local entrepreneurs who want to realise a logistic centre on the premises of a former cement production plant. The feasibility study for the whole project and the planning of the transhipment terminal was done by a private consulting company (RAPP AG). Rekingen lies within a range of around 40 km to the cities
BESTUFS II – D 2.3 Best Practice Update 2007 / Part I Annex VI - 7 Annex
Code City/Region Name of concept Short description of concept of Zurich, Winterthur and Baden, a triangle forming the strongest economic region of Switzerland. It is well located with respect to the local traffic situation as it enables to reach Zurich from the North where traffic jams are less frequent than from the main access in the West. The shutdown of the cement production plant about 3 years ago was a backlash for the local economy of the region (jobs, supply of small enterprises). It is expected that the implementation of the logistic centre in Rekingen will improve the economic situation in the region. Essential parts of the existing infrastructure from the former cement production plant can be used for the Logistic Centre, such as the existing rail system and many buildings. As the cement plant was rather transport intensive already, the necessary road infrastructure is given. Enhancing modal shift being one of its main objectives, the logistic centre will be supplied as well by rail as by road. Shuttle trains bring containers from Basel (waterway transport on the Rhine), western Switzerland or Germany to the container terminal. The regional distribution particularly to the conurbation of Zurich, will be carried out by trucks. A possible consolidation of various containers for improving delivery efficiency might be done in the logistic centre. The new logistic centre of Rekingen is taking advantage of the distance-related heavy vehicle fee (LSVA) implemented in Switzerland in the beginning of 2001 which makes combined traffic more attractive. Heavy goods vehicles are charged LSVA on all roads in Switzerland. Vehicles in unaccompanied combined transport though get 20 or 25 SFr. per container or semitrailer reimbursed, amount that equals a pre- or endhaulage distance of around 40 km). Therefore the location of Rekingen in a range of less than 40 km to the centres of Zurich, Winterthur and Baden is very attractive, making combined transport a viable alternative to road only transport. The LSVA can be seen as a supporting measure for achieving a modal shift from road to rail. The demand for combined transport is estimated between 45’000 and 65’000 TEU/year. The size of the whole Logistic Centre in Rekingen is around 30ha. It is operated by the LGZ SA who rents the area to private companies. The platform is open to any company. The logistic centre is a private initiative. However, the transhipment terminal is strongly supported by the government whose stated policy is to support modal shift from road to rail. Therefore, based on the expected number of truckloads shifted from road to rail the government is paying more than 35% of the investment costs of the transhipment terminal and grants a loan for another 35% at a special interest rate. [[email protected]]
CH - 02 Embrach Embraport Embraport is the only freight village of that kind in Switzerland. It is run by the Zürcher Freilager AG, a completely private company, who also initiated its construction. The platform was built and opened in the mid 70ties and is still operational, even expanding (another 18'000 m2 of land have been bought in 2001). The platform Embraport was built newly in the open countryside after evaluation of several locations. It is located between the two cities of Zurich and Winterthur, in the heart of the economically strongest region of Switzerland. The current spot was chosen because of the good location with respect to the transport network, the abundance of construction site terrain and reliable partners in the region. Around half of the Swiss production- and consumer potential is situated within 70km around the platform. The platform disposes of good road links to the national highway network and lies at the very important railway line between Basel and Winterthur. The international airport of Zurich is nearby (9km), as well as the German border. The latter has been particularly important as it enables heavy trucks (44t) from the EU to reach the platform although they exceed the weight limit on
BESTUFS II – D 2.3 Best Practice Update 2007 / Part I Annex VI - 8 Annex
Code City/Region Name of concept Short description of concept Swiss roads (currently 34t). This is possible because the more restricted Swiss weight limits are not applicable within a radial zone around the terminal. However with the alignment of the Swiss and the European Union’s weight limits this advantage will loose importance in the future. Embraport plays an important role in the supply of the region around the largest Swiss city, Zurich. Around 50% of the goods delivered from the platform are bound for the economic area of Greater Zurich. The rest is mainly delivered in the eastern part of Switzerland. Embraport was built as a response to the market needs for centrally concentrated logistics and transport services and infrastructure. It profits from its location amidst the strongest economic region of Switzerland (between Zurich and Winterthur) and its good rail, road and air connections. Embraport was built for road and rail transport equally from the beginning. Every storage building disposes of a delivery ramp for both trucks and railway (sidings). 8.7km of rail tracks have been laid around the 150’000m2 covered area that hosts around 100 companies. Around 65% of the companies on the platform are either transport operators or logistics service providers, 35% is other commerce. Embraport is an open platform. There is no compulsory co-operation between the companies on the platform although some of them do co-operate deliberately for consolidation and distribution. The platform attracts transport and logistics companies because its facilities (storage space, transport infrastructure, transhipment equipment, free port, etc.) that can be offered at low costs thanks to economies of scale. Every year storage and transhipment of almost 1 billion tons of goods are managed by 450 employees. This is shared between 92'000 trucks per year and over 4000 rail wagons. The share of rail transport has been decreasing continuously. While in 1984 around 25% of all transport to the platform were done by rail, it is only meagre 8% today that are transported by rail. The platform’s own customs office treats 313'000 shipments each year collecting custom tariffs of 200’00 Million Swiss Francs. Hazardous goods are excluded from the platform as it is located in a groundwater protection zone. The platform includes a transhipment terminal, a terminal for road transport, a post office and its own customs and free port (12’000m2). Furthermore the site is equipped with a motel (currently out of service because of lack of demand), canteens, a small shop, a counter of the Swiss Federal Railway company, a repair station and a fuel station. The platform is financed through the rents the companies pay for settling on the platform and for using its facilities. It is a completely private initiative without public support or even partnership. The platform is economically profitable and financed through the rents the companies pay for settling on the platform and for using its facilities. From the 160'000 lorries that travel through the Embrach region per year around 60% are going to the Embraport. Not all inhabitants of the villages around the platform are happy with the ever increasing heavy traffic and some have demanded a bypass-road for their villages. On the other side, the platform also creates a lot of regional employment and the people of the nearby village Embrach are also proud of their platform which is considered as kind of “gateway to the world”. The main success factor for the Embraport freight village is its location in an economically important region with good transport network connections, the relative abundance of land and its proximity to the border (less restrictive weight limits). [[email protected]]
CH - 03 Basel Basel City Logistik The project was initiated as a two year pilot in 1994 within the federal program on energy efficiency DIANE 6. It was co-ordinated and designed by a local consortium of a logistic consulting, a transport consulting and a communication consulting company. The main idea behind the project was to relieve the inner city of Basel from delivery traffic. Main
BESTUFS II – D 2.3 Best Practice Update 2007 / Part I Annex VI - 9 Annex
Code City/Region Name of concept Short description of concept objectives included bundling of transports from different actors, increasing transport efficiency and vehicle usage and reducing pollution and energy consumption. Basel City Logistik was the organisation responsible for the project. It included the association of local commerce, the inner city association, the city of Basel, the Swiss post and several transport and terminal operators. After 1996 the project became a private initiative. However, activities declined gradually and today the project is not operational anymore. Nevertheless the various actors involved still meet on a regular basis, this communication platform being the main long-term benefit of the project. The city of Basel counts 200'000 inhabitants and is situated at the border crossing of three countries: Germany, France and Switzerland. Around 50% of the freight volume entering Switzerland is received in Basel, making transport business the second most important industry for the region. Due to the particular location Basel has always been served by multimodal transport: navigation on the Rhine, rail and road. Delivery in the city of Basle is mainly (85%) done by vans below 3.5 tons. 65% of these vans operate between the inner city (the target area of the project) and the rest of the town, performing 10'000 trips per day. 2300 tons are delivered to the inner city every workday. However, the average load factor of the delivery vans is only 28%. These figures reveal a high potential for increasing the efficiency of the inner city delivery which was the main reason for starting the project. Basel City Logistik was a co-operation between transport companies and forwarders which had built an open access pool. 4 terminals located in the outskirts of Basel, IT, disposition and vehicles were managed by 3 terminal operators. In the beginning 10 transport companies participated deliberately in the project. They delivered their goods to one of the 4 terminals until 18:00 to be delivered the next morning. Deliveries were made using 3 neutrally designed low-emission vans. Some of the terminals also offered rail access. The delivery area covered the inner city (downtown). The project was mainly designed for delivering retailers with consumer goods such as food, textiles, shoes, sports articles, toys, household articles and electronics. Fresh produce that needs cooling was exempted. The three main operators charged their clients for the delivery according to the weight of the consignment. Charges varied between 10 EUR for 100kg and 60 EUR for 750 kg (prices: 1994). The pilot project did reach some of its targets: transport bundling was improved, vehicle usage increased by 15%. the co-operation survived and was converted into a fully private partnership the project created a positive image in the public the project has initiated a communication process between transport operators and municipality
However, the wide break-through was not achieved. Demand staid below expectations. After a quite good start the distribution centres only delivered about 40 tons per month (less than 0.01% of the total deliveries into the inner city) . The project disposes of only 3 light vehicles compared to the 10'000 vans that enter the inner city every day. Profitability was very critical. Environmental effects in terms of mileage reduction were rather low. As key problems responsible for the semi-failure of the project are considered: transport operators are not willing to pay for the service (lack of demand) the absence of access restrictions that would favour the city logistics vehicles in comparison to the ordinary vehicles
BESTUFS II – D 2.3 Best Practice Update 2007 / Part I Annex VI - 10 Annex
Code City/Region Name of concept Short description of concept (although access to the inner city is restricted already to vehicles under 12 tons and the morning hours between 7 and 11)
Environmental issues lost importance and public attention during the last years and the congestion problems in the inner city are not perceived severe enough
local retailers, even those participating in the scheme, were very reluctant and would not support public relations activities for example.
The City logistics project in Basel can be seen as a prototype for the Swiss experiences with city logistics which can be summarised as follows: Bundling of deliveries is only successful if all relevant market players (transport operators) are integrated. The
operating organisation must be neutral. Transport co-ordination seems to be more successful between carriers/forwarders than between retailers. Low-emission vehicles adapted to the specific needs of inner city delivery offer high rationalisation potential. Cost covering operation is very difficult to achieve without changing the framework conditions and regulations The government has to support the project in the initial phase as well as during operation with supporting measures
(co-ordination, promotion, initial financing) Vehicle usage and efficiency can be increased even more by additional activities like collecting mail, reverse
logistics, etc. The system must be open to new participants at any time (no monopoly or oligopoly)
Main barriers for city logistics proved to be: Fear of loosing competitive advantages and contact to customer Fear of new dependencies Large initiations and co-ordination efforts Difficulties in splitting costs and jobs
CH - 04 Thun SpediThun SpediThun was started in summer 2000 under the motto “delivering together”. It emerged from the project “urban mobility” that was launched in 1997 by the municipality of Thun (40'000 inhabitants) and various transport associations. Participating actors include local transport companies, the association of inner city retailers and the Swiss post. In collaboration with two local transport operators a terminal was realised in the outskirts of Thun. At the terminal the goods are reconsolidated and then delivered twice a day to the retailers in the inner city using appropriate vehicles adapted to the network of narrow streets downtown. The project aims at delivering at least 200 consignments per week, reducing the number of trucks with trailer downtown to zero and reducing the number of trucks downtown up to 20%. The project is currently being evaluated. The project was started with an intensive marketing campaign including over 300 transport operators as well as local businesses. The costs for the service varies between 10 EUR for up to 50 kg and 30 EUR for 600 kg. The time gain for the transport companies (due to the fact that they can avoid entering the inner city) is estimated to outweigh these costs
BESTUFS II – D 2.3 Best Practice Update 2007 / Part I Annex VI - 11 Annex
Code City/Region Name of concept Short description of concept making the service also economically attractive. However, the service is not meant for every kind of goods and retailers. The SpediThun vans deliver mostly shops for household articles, entertainment electronics, sports articles, toys, books and newspapers. It is not suitable for textiles, fresh produce, watches and jewellery. In average, around 50 tons are delivered into the city per month (2001). The projects did not receive any subsidies apart from a kick-off credit. Today it is economically independent and apparently attractive for the two transport operators involved (at least when taking into account the image gains and PR-effects). A part from the location of the terminal its opening hours are estimated to be crucial for the success of the project. Another key factors is seen to be the fact that the whole project is embedded in the framework project “urban mobility” which takes a governing and co-ordinating part bringing together the various actors and their differing demands and supplies while knowing about the specific details and complexity of the transport business. Furthermore the involved transport operators are known to be highly innovative, have good local contacts and have a close relation to the project (it’s “theirs”). Another point is probably the less fierce competition in the local market, as the two participating companies are the major local market players. Like this they can take full advantage of their know-how of the local framework conditions. [[email protected]]
CH - 05 Schaffhausen City Logistik Schaffhausen City logistic project launched in the late 90ties by a single transport company “Hans Peter Brütsch AG” together with the municipality and the inner city association of Schaffhausen. Aim of bundling deliveries into the narrow cobbled streets of downtown Schaffhausen: less nuisance for the receivers and the town’s inhabitants, more flexibility for the shipper or forwarder as he does not have to consider access time restrictions nor cope with congestion. He delivers his freight to the distribution platform between 06:00 and 19:00 where the different goods will be newly consolidated and delivered the next morning latest. The platform disposes of rail connection for combined transport. However, after an enthusiastic start the project failed because nobody was prepared to bear the costs of the additional transhipment at the platform. While the transport operators were quite willing to co-operate, the retailers who are often used to delivery free of charge would not accept the new costs part of which the transport operators tried to hand over to them. Apparently the advantage of having only few deliveries and a less polluted shopping area was not perceived by the shop-keepers, in spite of the fact that they could even use the platform as short time storage facility having their weekly orders bundled to one delivery per week. Today, the only remnant of the project is a weekly collection of cardboard waste material financed by the municipality. [http://www.bruetsch-transporte.ch/citylogistik/city.html]
D - 01 Kassel City Logistik Kassel The still ongoing project started in 1994. 7 forwarding companies are involved in a co-operation to deliver the inner city of Kassel. One neutral transport operator is employed to carry out the transport operations. Kassel has about 200.000 inhabitants. It is located in Northern Hessen on the crossing of to the A 7 (North-South Autobahn) and A 44 (connection to the Ruhr area). Main industrial activities are: automotive and transport industry, telematics and software development, environmental and energy technology and culture and tourism. The implementation of an urban distribution centre was an integral part of the city logistics approach in Kassel initiated by the forwarding association and the chamber for industry and commerce Kassel. To the beginning of the project also a series of studies on the city logistics approach were carried out surveying the requirements, volumes and acceptance of a city logistics approach.
BESTUFS II – D 2.3 Best Practice Update 2007 / Part I Annex VI - 12 Annex
Code City/Region Name of concept Short description of concept Transport operation: A neutral city logistics operator delivers the inner city on behalf of the forwarding companies involved. At 6.00 he starts the collection tour. About 5 vehicles are employed to collect the consignments delivered at the forwards depots during the night. At the urban distribution centre the consignments are bundled according to the address of the consignees as well as on specific street corridors. At about 10.00 the urban delivery starts with 2 to 3 7,5 t vehicles. Usually 2 tours are carried out during the day (depending on the transport volumes). In average about 5 to 6 t are to be transported via the urban distribution centre. Information & communication: The city logistics operator receives the transport volumes in the morning via e-mail. The delivery takes place on the same day. In the case that a delivery can not take place the city logistics operator informs the respective forwarder (from whom he got the transport order) vi telephone. The processes of collection, commissioning, and delivery are not technically supported and are taking place on the basis of receipts. The services from the neutral operator (transport and transhipment) will be paid on the basis of a specific city logistics tariff. The operator is invoicing his services with each forwarder separately. According to statements and surveys carried out that the approach shows no significant benefits on the cost side for the forwarding companies involved (no extra costs to the usual delivery services). No specific institutional measures are initially foreseen to support the approach. According to studies carried out the urban distribution centre in the Kassel city logistics scheme is seen as unavoidable. The consignees in the inner city do not state differences in service quality compared to the former delivery scheme. A success factor in the beginning of the scheme was the motivation of the partners involved. Especially, the drivers and the neutral operators has to fulfil additional service requirements of the consignees. Plan to extend the approach (e.g. to create a link with the urban freight village) were not further followed. [[email protected]]
D - 02 Essen Stadtlogistik Essen With 600.000 inhabitants Essen is the sixth largest city in Germany. Formerly, Essen was well known for its coal and steel industry. In the present the industrial structure of Essen is determined by energy and environmental industry, media and information industry, retail and health care industry. The approach of the goods transport initiative in Essen can be traced back on a federal framework programme “Modellvorhaben Stadtlogistik NRW” in which 20 projects in 20 cities were involved. After the finalisation of this initiative 6 cities in 1997 founded the network “Netzwerk-Stadtlogistik” which includes the approach of Essen. The partners of the project Essen Stadtlogistik are the City of Essen, forwarding co-operations, the Retailer Association of Essen, the Essen Marketing Gmbh, the Essen regional development company, the Chamber of industry and commerce and the federal government of Nordrhein-Westfahlen. The main aspects of the Stadtlogistik Essen initiative are: Consolidation of goods deliveries into the inner city of Essen E-commerce: Delivery of book and grocery on-line orders Waste management for particular goods Book deliveries for schools Storage
6 co-operating forwarding companies deliver their goods volumes having its destination in the inner city of Essen to a city terminal (a depot of one partner located in the North of Essen). There the consignments will be consolidated for delivery.
BESTUFS II – D 2.3 Best Practice Update 2007 / Part I Annex VI - 13 Annex
Code City/Region Name of concept Short description of concept This terminal is also used for carrying out the home delivery services. In a new project Stadtlogistik Essen co-ordinated the delivery of the schools in Essen. School books from different suppliers were stored and consolidated in the warehouse and delivered in a consolidated transport. In total 3 vehicles are employed for carrying out the city logistics: one 18t truck, one 7,5 t truck and one 3,5 van. In total about 10 t per day are transported. The concept is still not commercial viable. It is expected that a break even point will be reached soon. Although there is the association of local retailers involved no concrete co-operation with the local retailer and with the Stadtlogistik Essen took place. This might be an approach for the future. It is under discussion to provide a Essen Card (similar to Payback card) offering the users to carry out free home deliveries for goods purchased in the inner city. Stadtlogistik Essens plans to buy an own warehouse, not using any longer the warehouse of one co-operating partner. Obviously, the approach has enough potential to fill these capacities. [[email protected]]
D - 03 Berlin Berlin-Brandenburg integrated goods traffic strategy
A big increase of transport movements in Berlin is expected up to 2010. In Berlin there is a hierarchy in the targets in the transport policy. First priority is to avoid transport, second level is to stimulate a transfer to an environmental friendly mode and the third level is to improve (unavoidable) truck traffic. There is close co-operation with Brandenburg. 3 freight centres (GVZ), 2 freight sub-centres and 6 goods traffic platforms are the components within the transport policy. New transport and information technology is being applied to facilitate the processes within the logistic, transport and information chain. The freight centre (GVZ) functions as a (regional) multimodal transhipment node (road, rail, waterways) and as a distribution centre. There is bundling of logistic activities in the freight centres (GVZ) and they are characterised by independence, synergy effects, efficiency and use of environmental friendly transport systems. The freight sub-centres (GVS) have a more local function. The role of the government is to facilitate the freight centres and sub-centres. They bring the potential partners together and create the framework enabling the freight centres to be established. As the freight centres are located outside residential areas noise is not a problem. In relation with goods traffic platforms double parking of lorries is a problem which was solved by installing acceptable delivery zones. Today around 60 million tons of goods enter the Berlin-Brandenburg area every year (68% by road, 25% by rail, 7% by waterway), whereof the freight centres (GVZ) process 5 million tons per year and freight sub-centres around 2.3 million tons per year. Thanks to these freight centres almost 20'000 road transports with HGV per year could be avoided. Estimations for 2010 show that freight centres would tranship even 8 million tons per year. However, the freight centres have not reduced the local congestion problems caused by the last mile deliveries. [[email protected]]
E - 01 Malaga Calle Camas The project that has been started in 2002 consists of the set up and operation of a new Urban Freight Distribution Centre (UDC) located at the fringe of the historical Malaga centre whose aim is to be the end point of the supply chain of urban goods transport carried on non-friendly vehicles. From there, the final distribution to the historical centre will be exclusively done over clean and energy efficient vehicle fleets. Malaga is one of the largest municipalities sited in the south of Spain and one of the most important tourism focus in the south of Europe. All these aspects make necessary the development of a well-structured infrastructure network. The Malaga city centre is 40 ha shaping approximately an ellipsis with axis of 1 km and 0,6 km. Malaga, as other large cities in
BESTUFS II – D 2.3 Best Practice Update 2007 / Part I Annex VI - 14 Annex
Code City/Region Name of concept Short description of concept Europe and in the Spanish context in particular, incorporates the associated difficulties due to the coexistence of the commercial activities supply requirements and their impacts implying results of pollution, non-cleaning environment and energetic inefficiency. Downtown area in the city is provided with several pedestrian areas, free of vehicles. Many local business, mainly SMEs are located in these areas. Hence, there is an accessibility problem for freight distribution vehicles. The only way to access into these areas consist in a reduced space in several public squares, which are always collapsed. The local regulations of urban freight transport is part of the Municipal Traffic Norms. Not much has been done until now providing specific facilities dedicated to offer solution for the transport, pick up and delivery of freight in the area. In this context, financial services, such banks, foods, for restaurants and bars, clothes, for shops, and public services supplies represent approximately the 70% of the total freight demand. All these involves a daily demand around 6000 parcels/day carried on 1000 freight trips. The project is an initiative of the Local Municipality of Malaga with the contribution of the transport firms active in urban freight distribution in Malaga. It is an instance of joint private and public investment in shared facilities introduced by independent transport firms and local authorities in order to implement co-ordinate action for urban freight distribution. Also the Chamber of Commerce, the Local Parking Society and the associations of the historical centre residents impulse and support the project. It is an objective of this project to include in its development the maximum of existing projects, which can benefit to the traffic situation and the freight supply and distribution, not only at the local level, also including other experiences in Spain and Europe. To do so, the Malaga project will make use of the recommendations in COST 321 and LEAN EU completed projects with respect to City Logistics. It also draws on the shared experience of other European cities acquired through EU projects such as ISOLDE and the BESTUFS network. The selection of clean and energy efficient vehicle fleets will be done following experiences such as ELCIDIS and IDIOMA. The UDC will be used as the starting point for a shuttle service by means of small alternative-electrical vehicles, applying strategic concepts for distribution and pick up of freight goods. The UDC will works mainly as a good transhipment point for urban goods distribution in the Malaga city centre, but it will include additional goals with the aim of making an integrated centre capable of adding value to the logistic chain. Among its possibilities we have to highlight: Central delivery service. Co-operation of transport firms with electrical propulsion vehicles and exception provisions. Storage management for small intervals with value added services. Packing disposal services. Bundling and picking services for retailers. Integration of Information Systems via telematic tools allowing a real time UDC operation.
A central delivery service will be set up to prepare the goods into well-organised and rational consignments. A central co-operation unit will co-ordinate the reception from the freight village, the goods storage and the electrical vehicles loading, according with the strategies for bundling and picking. Additional services such as packing disposal services or utilisation of loading and unloading-in-vehicle instruments will be offered. From the UDC the final distribution to the historical centre will be exclusively done by clean and energy efficient vehicles, through the few existing streets allowing access to the
BESTUFS II – D 2.3 Best Practice Update 2007 / Part I Annex VI - 15 Annex
Code City/Region Name of concept Short description of concept pedestrian centre. Another goal in the Malaga UDC project is to implement a logistic management application, which integrates the whole logistic chain, with logistic information data and processing on board, as well as tracing, tracking, positioning, navigation, order reception and filling, invoicing, etc. via telematic tools. The possibility of using alternative automatic identification is also considered. The UDC setting up will allow the centralisation of the freight distribution, the traffic and parking ordination, the environment improvement trough the utilisation of non-pollution vehicles and will make Malaga the Spanish pioneer city in such kind of projects. The UDC will be sited over a new parking building with 4 floors and a capacity of 500 parking places which is being constructed in the centre of Malaga. The physical location for the UDC is among the following streets: Marques Villafiel, Camas, Fernan Gonzalez, Agujero and Marques, closed to the main central city market. It is located in a piece of ground closed to the centre ring road which connects the city centre to the freight village at the outskirts of Malaga. The artery communicating the freight village to the UDC is a high capacity three lanes way allowing freight transport on 16 Tons trucks. The proposal is to use the first floor of the parking (with an area of 3,148 m2) as a urban freight distribution centre (UDC). The UDC will be the end point of the supply chain of urban goods transport carried on non-friendly vehicles, such as 16 Ton fuel trucks. The facilities are conceived as a transhipment point with storage service and information technology systems. For the final distribution electrical vehicles will be used. The fleet of vehicles will enter and leave the UDC trough a ramp. To allow a longer life of the batteries vehicles will be helped in the climbing process by means of a towing mechanism. The loading and unloading process will be done using special spring cells. It will also required special instruments for charging and maintaining the electrical batteries of the vehicles. Supporting or related measures include the prohibition for freight transport in the city centre, the definition of distribution routes and the enhancement for co-operation. [[email protected]]
F - 01 La Rochelle Plate-forme ELCIDIS The conurbation of La Rochelle counts 140'000 inhabitants whereof around 80'000 live in the city itself. La Rochelle is famous for its historic city centre. However, the cobbled and narrow streets make delivery noisy, time consuming and disturbing for both residents and tourists. In order to test new ways of relieving the city centre from the delivery traffic, the city of La Rochelle joined the European ELCIDIS program (Electric CIty Distribution Systems) which aims at assessing the efficiency and environmental impact of electric vehicles in urban goods distribution systems. The objectives of the ELCIDIS platform in La Rochelle were: better use of delivery space encourage people to abide by regulations (parking zones, hours, size of vehicles) promote organisational systems that generate less congestion and pollution
The ELCIDIS platform is running as a pilot project from 2001 to 2003. The ELCIDIS platform in La Rochelle is open to all kind of transport and logistics operators. It offers last-mile distribution for the city-centre of La Rochelle, a historic area of about 1.5 km2. It is not compulsory to use the platform. The city centre can still be delivered individually, although big trucks are banned from the area and for small vans there are access time restrictions. The platform is situated right at the border of the delivery area. The platform which is managed by transport Genty, a local freight company, is running as a two years trial since February 2001 with the support of the community (Public Private Partnership). It disposes of 700m2
BESTUFS II – D 2.3 Best Practice Update 2007 / Part I Annex VI - 16 Annex
Code City/Region Name of concept Short description of concept storage and transhipment area, 7 electric vehicles (6 Berlingos, 1 Saxo), electric handling equipment (like pallet jacks) and computer hardware. There is no rail access to the platform. The transport companies that have signed up to the scheme deliver their goods to the platform where they are grouped by destination (street) and delivered accordingly the next day using the electric vehicles. In principle any goods can be delivered through the platform, but the lack of cooling equipment limits the possibilities for fresh produce and edibles. Apart from the electric vehicles the platform is very low-tech with a lot of work to be done by hand. The platform charges the transport operators around 3 Euros per parcel for their service of storage and delivery. To cover the whole costs of around 4 EURper parcel, the city is subsidising each parcel with 1 Euro. This subsidy has been decreasing constantly since the beginning of the project. Although the transport operators benefit from the platform as they do not have to enter the often congested inner city anymore, the actual demand stays way behind the expectations. The objective of delivering 600 parcels per day was missed by far, actual figures varying between 200 and 300. Even in its best periods the average daily volume would not exceed 400 parcels per day. Accordingly, the delivery vehicles only make around 30km per day, although the electric capacity would allow as much as 80km. In the near future it is planned to have more capacity for delivering entire pallets instead of single parcels, and to equip 3 vehicles with cooling units which would also allow the transport of fresh produce. When the trial ends in February 2003 the whole project will be evaluated economically, environmentally, technically and legally in order to identify failure and success factors. The future of the project depends on the results of this evaluation but even more on finding financial sources or subsidies for supporting the project. One problem already noticed is that the many pallets do not fit into the Berlingo cars. Another experience made with the electric vehicles is that the absence of noise can also be dangerous, because pedestrians might not be aware of the approaching car. [www.elcidis.org/rochelle.htm]
F - 02 Toulouse CDU Toulouse-Raynal The initiative for this project that should be implemented by the end of 2002 comes from SNCF Toulouse and Toulouse metropolitan transport authority. SNCF (French rail operator) has expressed a national will to try and experiment a few Urban Distribution centres in big cities using existing rail facilities. Toulouse is the most advanced of these projects. The project has been also supported by Toulouse metropolitan transport authority, depending from Toulouse local governments (mainly City of Toulouse). EDF (Electricity of France) is also a partner, and will provide electric trucks for the inner city distribution. Other partners include ADEME (French environment agency), CCI of Toulouse, etc. The project would be devoted to inner city of Toulouse only (14 000 companies and 390 000 inhabitants). Metropolitan area of Toulouse is about 1 000 000 people (one of the largest urban areas of France). Toulouse is situated a little apart from national and European logistics networks. Nevertheless it is an extremely important regional economic area, a flourishing regional economic centre, in a rather rural region apart from large economic French corridors. Many exports (Toulouse is a large industrial centre, starting from Airbus production…). As a consumer centre, many regular imports of consumer goods. The region exports vegetables crops fruits. For freight, mostly road relations. Some rail connections with Paris, that the UDC project wants to revitalise. Toulouse has a good urban road network, and good public transport (recent metro). There is no crucial congestion issue due to goods movement in Toulouse, although city representatives find trucks too intrusive in Toulouse. Actually, one of the reasons for the UDC project is for the SNCF to find a use to the Raynal rail
BESTUFS II – D 2.3 Best Practice Update 2007 / Part I Annex VI - 17 Annex
Code City/Region Name of concept Short description of concept facility, which otherwise would have disappeared (bought by private developers for housing or offices). The project is actually an integrated chain from Paris (mostly parcels then any type of consumer goods) to Toulouse in train, then electric vehicle distribution from the station to Toulouse receivers. The platform is a large former SERNAM transhipment terminal and warehouse facility, located in a set of various freight rail facilities. The objective is a market share of 10% of current parcel and consumer goods distributed within the city of Toulouse, with the traditional exceptions (perishable or bulk products, hazardous goods…). For the moment, one company (SERNAM if it still exists by the time !) which is controlled by SNCF would manage the UDC. To attract more clients, the management may be open to other transport operators in a business grouping called Economic Interest Group (under discussion at this time). The platform has good road access and is located right in the city centre. Investment and some operating costs should benefit from subsidies from various partners (region, CCI, city, EDF, private sponsors). However, main payers should be the users (transport operators). Toulouse knows a lorry ban. The city wishes to have it better enforced, which would help the UDC become more attractive. If the centre does not open rapidly, two failure factors can be proposed: one obstacle is a minor one: the electric vehicles have not received the national homologation yet (permission to run
in public streets), and the process for homologation is far too long in France. But the UDC could start with a regular truck, and this should not be a major problem
one obstacle is more fundamental : due to economic constraints, SNCF seems to be retrieving from urban logistics projects today.
The experiences of Toulouse are important for other French cities wishing to use existing rail facilities to develop urban logistics services. Strasbourg has decided to take full initiative and control other a similar project (a feasibility study is under way), taking over from SNCF.
IT - 01 Siena Siena City Logistics The historical centre of the city of Siena with its total surface area of 166 hectares (1.660.000 square metres) – is an entirely limited traffic zone (LTZ). Within this precinct about 750 shops are daily supplied with about 160 tons of goods. The Restocking of shops is performed during established time bands by more or less 450 motor vehicles 77% of which are vans and small lorries propelled by petrol or diesel with a full capacity up to 3500 kilograms of cargo. About 70% of these means transit with a cargo size lower than 50% of their full capacity. Only the 13% of them transport a cargo higher than 70%. According to these data, if we take into account the high effect of freight transport on the flow of vehicles within the historical centre, notwithstanding the restrictions imposed by the LTZ, Siena Local Authority has set out a programme for the realisation of a city-logistics service. In practical terms this project envisages the implementation of a logistics service allowing the management of the delivery of 60% (90 tons per day) of goods arriving in Siena and directed to outlets such as shops, bar and restaurants located within the LTZ. Different integrated applications will be developed, including two “operative logistic headquarters”, that is two UDCs. The applications are Development of an automatic access control system to the LTZ for all authorised vehicles, freight transport modes
included Establishment of a city-logistics Company
BESTUFS II – D 2.3 Best Practice Update 2007 / Part I Annex VI - 18 Annex
Code City/Region Name of concept Short description of concept Setting up of two logistics headquarters, highly specialised on groceries as well as other categories of goods than
foodstuff Setting up of an Operations Centre with co-ordinating function Purchase and employment of 14 transport vehicles propelled by GPL (liquid propane gas) and 6 vehicles propelled
by electric engine Monitoring of the effects on environment
The investment and management cost of the project amounts to 1.817.000 Euro. The management costs, once the project will be completed and under way, are estimated to be of 145.000 EUR per year. The effective average revenue is estimated to be of 1.342.000 = per year. The following parties are involved in the project: Siena Parcheggi S.p.a. (Car park management company): As Partner of the new city-logistics Company it gives its
contribution and takes care of its administrative and practical working aspects. It takes responsibility for: the drawing up of the project, for layout studies of the area of the City of Siena and the impact on mobility as well as for the work management. It takes responsibility for the purchase of the assets necessary to provide a co-ordination service (namely HW and SW technological facilities, technological innovations towards zero and low emission vehicles, and so on). As main co-ordinator of the freight mobility service, it will host, within its premises, the Operations Centre for the integrated management of the technological equipment and for the technical management of the system facilities for the automatic control of access to the city centre.
Siena Local Authority: As Partner of the new freight transport city-logistics Company it gives its contribution through two Special Companies under Siena Local Authority (Siena Parcheggi, Train). It contributes with funds destined to the purchase of the necessary assets (technical facilities for the automatic control of access to the city centre, vehicles fleet, and so on) and in part destined to services management. Guarantor of the applications of rules and regulations which in the medium/long run might be adjusted to the needs deriving from further developments of the project, it manages the system of the concession of services along with the Municipal Police Department. It takes responsibility for the legal and administrative management of permits and infractions to rules (namely main points of access to the city centre). It is responsible and provide for the necessary authorisations for the city-freight-transport service of the new logistics company. Another target it’s the co-ordination with neighbour Local Authorities for the definition of a Catchment area Plan so as to co-ordinate and provide for the required authorisations to the loading and unloading operations
COTAS-Siena / Freight-transport-service Department (Consortium Taxi Transport Services for Passenger and Freight): It is Partner of the new freight transport city-logistics Company. It gives its contribution to the purchase of the vehicles fleet, thanks to the funds given to Siena Parcheggi by the Local Authority. It takes responsibility for the delivery service to the LTZ users through its own technological facilities. It will be oriented mainly towards the delivery of groceries coming from the shopping centre located in via Toselli as well as towards other categories of goods.
CRAI TOSCANA - SCRL -Monteriggioni Badesse District (Wholesale groceries distribution centre serving retailers
BESTUFS II – D 2.3 Best Practice Update 2007 / Part I Annex VI - 19 Annex
Code City/Region Name of concept Short description of concept located in Tuscany and in Umbria): It is Partner of the new freight transport city-logistics Company. It gives its contribution to the purchase of the vehicles fleet, thanks to the funds given by Siena Local Authority and Siena Parcheggi. It takes responsibility for the delivery of goods from its own headquarters, located in the Badesse district to the LTZ users. It will be oriented mainly towards the delivery of groceries coming from the main goods suppliers.
TRAIN-Siena (Company responsible for public road transport): It is Partner of the new freight transport city-logistics Company. It contributes to the management of further developments of the logistics Company for a combined passenger and freight transport service (namely call-out service).
ENEA-Roma (National Research Body for Energy and Environment): It is responsible for those aspects of the project related to energy and environment. It will be an active part in the choice of highly innovative vehicles to be adopted by monitoring their good working performance. It will also be in charge of leading estimation studies and overall assessments of the impact deriving from the implementation of the projects in terms of reduction of energy consumption and polluting emissions. [[email protected]]
IT - 02 Ferrara Coopser UDC Ferrara is a medium size Italian town. Coopser (a co-operative group) has realised a real UDC with 200 associates, 700 involved people, 120 vehicles (80 refrigerated, all CNG). The UDC comprises 20'000 m2, whereof 7500 are covered. Two main motivations for the development of such a UDC have been adopted: reduction of logistics costs and reduction of pollution through the use of Enhanced Environmental Vehicles. The project is real and operating. [[email protected]]
JAP - 01 Fukuoka (Japan) Joint Distribution System A joint distribution system that centralises delivery and collection services started in 1978 in order to alleviate the traffic congestion and improve the environment in Tenjin district of Fukuoka City, Japan. Tenjin district of 370,000 m2 is the central business area with about 2,200 offices that produce 2 trillion Japanese Yen of the wholesale and retail sale. The limitation of loading/unloading spaces on and off street generated illegal parking, which led to higher level of congestion. In 1978 twenty-nine freight carriers joined joint delivery systems under the supervision of the Regional Transport Office of Ministry of Transport. In 1994 thirty-six companies have established the Tenjin District Joint Distribution Company Ltd. for promoting the systems. The Tenjin-District Joint Distribution Programme is now being commissioned for delivery and collection services to/from the Tenjin 1st Street ~ 5th Street area.
Freight carriers bring their goods to Hakozaki distribution centre of the Joint Distribution Company that is located in the suburb of Fukuoka City, close to the interchange of urban expressways. Then the Joint Distribution Company will deliver goods from member carriers to each receiver at Tenjin district after sorting goods to each building. The Joint Distribution Company also collects goods from customers in Tenjin district and unloads them at the distribution centre of the Joint Distribution Company where the freight carriers take them over individually. The Joint Distribution Company delivers about 90,000 parcels and collects about 10,000 parcels per month at Tenjin district. Each freight carrier pays 160 Japanese Yen per parcel, the weight of which is less than 50 kg. No subsidies are provided by the public agencies. ‘Truck only’ parking lots are very helpful for truck drivers to easily find loading/unloading space, although they are not dedicated to the Joint Delivery Company. The Regional Transport Office of Ministry of Transport supports the joint distribution systems in Tenjin district in institutional ways. The Regional Transport Office provides a platform for discussing related things and co-
BESTUFS II – D 2.3 Best Practice Update 2007 / Part I Annex VI - 20 Annex
Code City/Region Name of concept Short description of concept ordinate many stakeholders including shippers, freight carriers, residents and administration who are involved in the systems. The Regional Transport Office is planning to extend this system to other areas, for example, in Kumamoto City.
Freight carriers, shippers, road users and residents alike benefit of the joint distribution systems. Ieda et al. (1992) estimated the benefits of Tenjin-District Joint Distribution Programme, based on modelling co-operative freight transport systems as follows: Decrease of number of trucks in the served area by 65%, decrease of total distance travelled (km/day) by 28%, decrease of total distance travelled within Tenjin district (km/day) by 87%, decrease of total frequency of parking (times/day) by 72% and decrease of total parking time (h/day) by 17%. These effects will alleviate traffic congestion and improve the environment in Tenjin district. [Eiichi Taniguchi, Dep. of Civil Engineering, Kyoto University]
MO - 01 Monaco Plate-forme de frêt de Fontvieille In Monaco, the UDC is owned and operated by the government. The platform is in use since 1989. In 2000, the government contracted out the operation of freight distribution to a single carrier (Monaco Logistique, a regional transport company). This sub-contractor was given a monopoly over the municipal depot. Added to this was a partial monopoly on the delivery of goods. All trucks over a GVWR of 8 tons (this limit is discussed to be lowered to 3.5) are banned from the city of Monte Carlo. If they are to deliver goods to clients there, they have first to go to the local freight platform and unload. The municipal service then takes the final distribution in charge, with specific vehicles (6.5 tons GVWR, electric vehicles are foreseen for the future). Food, inseparable consignments, frozen goods, hydrocarbons and construction machines are exempted and can be delivered directly. The costs of the service are shared between the municipality, which gives financial aid and free warehouse space to the carrier ; the carrier which provides driving and handling staff as well as the vehicles ; and finally the retailers who supposedly pay for the amount of goods they receive through the service.
NL – 01 Groningen From city logistics to urban distribution Being the largest city in the north of the Netherlands Groningen is a regional economic centre with 175'000 inhabitants. It is connected to the rest of the country by road, rail and inland shipping and has a connection to the seaport Eemshaven. According to a pre-project study of PSD (Platform Stedelijke Distributie) 45% of inhabitants suffered noise problems and 13% suffered from pollution. Of the inhabitants 41% suffered no problems. Of the shopping public 72% suffered no problems. The problems mentioned by this group are delays and insecurity. The mentioned problems encountered by transport companies are mainly hindrances in certain streets. The still ongoing project was initiated 1996 by city counsel (College in close co-operation with the Commission of Advisory for distribution affairs, consisting of the Municipality of Groningen, the Groninger City Club (lobby group of local entrepreneurs), the Chamber of Commerce, EVO (lobby group of shippers, receivers and transporters, in this case one-man transport companies), TLN (Transport en Logistiek Nederland: lobby group of professional road transport), KNV (employers’ organisation of professional passenger- and goods transport), Department of Public Works Noord-Holland and the Traffic police. The city has a road network with narrow streets. In the city centre certain streets have delivery time frames (between 5 and 11 am and 6 and 8 pm) and some streets have a total car-ban. Busses have dedicated lanes and certain free bus lanes. The basic idea of the project is to give an official urban distributor status to transport operators that comply with certain requirements such as a minimum of 100 deliveries at 20 addresses a day in the inner city (proven by an audit), environmental vehicle conditions (Euro-2), restricted vehicle measures, use of a determined city distribution logo, speed limits, etc. The urban distributor status
BESTUFS II – D 2.3 Best Practice Update 2007 / Part I Annex VI - 21 Annex
Code City/Region Name of concept Short description of concept allows the companies to deliver to the inner city outside the given delivery time-windows and to use dedicated bus lanes. Thus urban distributors have a comparative market advantage. Currently 6 companies, located in the city and in neighbouring cities are accredited as urban distributors (parcel services and fresh products wholesale companies) and three applications are being processed (fresh product wholesale companies). Transport companies without the urban distributor status could deliver their goods to the urban distribution companies, which forward the goods at fixed prices. However, this is seldom the case as the communication between transport companies is rather poor. At the moment the project includes the delivery of parcels and fresh products.
The local government limits its activities to stimulating and facilitating: the municipality awards an urban distributor’s status, informs relevant parties on the project and the legislation and enforces the rules. In 1999, Groningen has won the first price of a national city distribution contest. The success of the project is attributed to a large part to the fact that the project was devised in close co-operation with representatives of the local business. Before the end of the year Groningen intends to evaluate the measures taken and studies done so fare. As result of these evaluations, Groningen intends to present a package of measures to further improve the urban distribution policy. [[email protected]]
NL - 02 Leiden Stadsdistributiecentrum Leiden BV Leiden is a historical city with 117'000 inhabitants. A city with a road infrastructure dating back to the Middle Ages. Leiden's road structure is not geared to today's traffic volume. Congestion, street hazards, air and noise pollution are the negative consequences of this traffic volume. These negative consequences pose a threat to the living environment of the city centre. With a special focus on protecting the quality of the living environment, the Municipality of Leiden has taken several measures to force back the number of cars in the city centre, among other the restriction of the shop supply hours from 6.00 to 11.00 a.m.. Based on the wish to facilitate a constant supply to the city centre, the thought arose that a city distribution centre (who is allowed to deliver outside the time-frame) would be an attractive alternative for transport companies that were unable to deliver within the restricted supply hours or that did not want to drive into the crowded city anymore. Shopkeepers and other entrepreneurs in the city centre would also be able to profit from a city distribution centre by moving their storage elsewhere and having their goods delivered on call. The advantages of a city distribution centre are:
less commercial traffic in the city;
the goods are transported to and from the city in environmentally friendly (electric) vehicles, geared to the size of the city centre streets;
transport companies can deliver their goods on the edge of town, which makes them gain on time.
In February 1994 the Municipality of Leiden decided that there should be a city distribution centre and that further measures should be taken to reduce the traffic volume in the city centre. The city distribution centre opened its doors in 1997. The expectations of the city distribution centre were the following:
a daily reduction of the number commercial vehicles from 24,000 to 5,000;
a sharp reduction in pollution (smell, air, noise) in the city centre;
improved accessibility of the city centre;
BESTUFS II – D 2.3 Best Practice Update 2007 / Part I Annex VI - 22 Annex
Code City/Region Name of concept Short description of concept
improved road safety;
example for other, similar cities in the Netherlands and Europe.
The project started with a public private partnership of the Municipality of Leiden and Hom Consultancy. Later Rien van den Bogerd Beheer BV, the owner of Mosterd Transport Leiden BV and De Zijlbedrijven Holding BV, a municipal organisation providing employment within a re-employment scheme for the disabled and the long-term unemployed joined the partnership. All three parties have an equal share in the partnership. They also issued an interest-free loan to the partnership. The Municipality of Leiden has provided loans to facilitate the actual start and the operation of the CDC. Opposition of citizens' organisations and changes in the zoning plan were the reasons that the original location at the Willem van der Madeweg in the Roomburg area became impossible. The new location was an extension of existing facilities of Van de Bogerd, the company that also operated the CDC. The major working area of the CDC was to be the city centre of Leiden. Since this area did not provide enough customers, the working area was soon expanded to the whole of Leiden and the city's surroundings.
After the CDC had started a traffic measure was announced, which implied that supply hours in the closed area would only be until 10.00 a.m. instead of 11.00 a.m. This measure was widely protested against, not only by the interest groups, but also by shopkeepers and other receivers of goods. The interest groups accused the Municipality of making regulations with the mere objective of keeping the city distribution centre alive. The discussions resulted in the city centre being off-limits for vehicles over 7.5 tons.
The project was a failure and has been stopped. Failure factors include the unwillingness of stakeholders to participate, a wrong location of the distribution centre, insufficient freight volumes, too slow vehicles given the remote location of the distribution centre and bad publicity because the municipality heavily subsidized the project. The project had a negligible effect on traffic volumes. After the service area was expanded to different parts of the city, the vehicles had to mix with faster traffic on high speed roads, which led to hindrance and delays for other traffic. The project had a negligible impact on environmental issues. The vehicles though, are considered to be a good alternative in the city centre because of the low fuel consumption, emissions and noise level. Outside the inner city, the low maximum speed (25 km/h) and limited range (80 km) make it an unsuitable alternative. Because several stakeholders didn’t participate in the development, the actual service offered was unattractive to possible users. The number of shareholders of the city distribution centre remained below expectation. "Stadsdistributiecentrum Leiden BV" had always welcomed other transport companies to become shareholders. During the preliminary research stage there were contacts with Van Gend en Loos, PTT, Van Duuren Nederlandse Pakket Dienst and others. However, none of these organisations were sufficiently interested in becoming a shareholder of the CDC. Their reasons were:
• the necessity did/does not exist yet, as the traffic regulations in Leiden's city centre are still offering sufficient space for supply services;
• the unwillingness to collaborate with the "competitor", for fear of losing their own customers.
The transport sector in the Netherlands is highly competitive and margins are very low. Transhipment increases costs,
BESTUFS II – D 2.3 Best Practice Update 2007 / Part I Annex VI - 23 Annex
Code City/Region Name of concept Short description of concept risks and delays, which in this case do not weigh up to time savings of avoiding the city centre. The project is economically not profitable: day-volume for breakeven point wasn’t even reached in a week’s time span. In addition to this, the breakeven point was kept artificially low by using subsidised labour (Break-even point with subsidised labour: 600 shipments per day. Break-even point with regular labour: 2000 shipments per day) [[email protected]]
SE - 01 Stockholm Stocodist
(Multi-company UDC for consolidation and general synergies)
Multi-company urban distribution centre that is being built by 5 transport companies consulted (incl. evaluation) by the transport research institute TFK. The new platform should serve Stockholm, Sweden’s largest city, starting at the end of 2002. The platform is a completely private initiative that was taken by 3 transport companies (2 others joined in later) in order to create economic benefits from inter-company synergies. The five medium size companies all work in the same local market (transport of fruit and vegetables). The platform which is 35’000m2 of size, is located in the outskirts of Stockholm. From here the flow of goods coming from central Europe on road will be distributed in Stockholm. Distribution will be done by one neutral single transport company on behalf of the other companies who pay a monthly fee for that service. A part from the commonly organised distribution process other synergies include a common IT-network for all the companies. Distribution is not regarded as their core business by the 5 participating companies and hence there is no fear of loosing any competitive advantage by contracting a third party for that service. [[email protected]]
SE - 02 Stockholm Hammarby sjöstad Hammarby sjöstad is Swedens largest housing project in the heart of Stockholm. On the construction site of 200 ha 800 appartments are built per year with 150 additional persons moving in each month. 700 tons of material are delivered to the construction site each day (average of 1.5 tons per delivery). In peak hours there is one delivery each 30 seconds. To solve this logistic challenge a logistic centre has been established where all inbound goods are consolidated and stored. Services are the bundled transportation of material, temporary storage of material and smart traffic control for vehicles entering the construction yard (including SMS-based variable smart traffic signs). The advantages are that the goods are not being damaged (e.g. by weather conditions), or being stolen. Furthermore, the deliveries are being done efficient and effective by means of a central planning tool, where constructors can indicate if a road is blocked. This results in a better living and working environment and saves money. The project is supported by all 10 contractors of the housing project (no free riding), the investors and the City of Stockholm which currently pays about 50% of the costs (yet it is planned that the future operators will pay more after they have seen and experienced the benefits). However, the question whether it is profitable seen from a total costs perspective remains open. Due to its connection with the construction site the logistics centre is a temporary project. [[email protected]; www.hammarbysjostad.stockholm.se]
SE - 03 Malmö Malmö City Logistics - co-ordinated distribution
This demonstration project in the city of Malmö (260’000 inhabitants, Sweden) was originally part of the EU project IDIOMA but is now run by the municipality which has engaged a freight company to manage the logistic central and the diustribution. The Multi-company distribution centre is mainly oriented towards consolidation in order to reduce the environmental impact from transports that deliver goods to the municipal units and to enhance the traffic safety around municipal units, e.g. pre-schools and schools.
From the platform located in the outskirts of Malmö, the goods from 9 different suppliers are distributed to 35 different municipal units in one district of Malmö. All goods are distributed to the units at a special time once a week. Each week
BESTUFS II – D 2.3 Best Practice Update 2007 / Part I Annex VI - 24 Annex
Code City/Region Name of concept Short description of concept about 100 goods are delivered through the system. The goods have no special freight demands as for instance cooling. In September the system will expand to another two districts with approximately another 130 units. New suppliers are gradually connected to the system. The City of Malmö is developing a system for E-business and this will give new possibilities to exchange information in the city logistic project.
When the project started it was financed by the EU, now all costs are covered by the city of Malmö. The project will be evaluated during spring 2003 and then the politicians will make a decision if the system shall be implemented in all units of the municipality and involve all suppliers. [[email protected]]
UK - 01 York Cyclone couriers Cyclone couriers is a private company with contracts with circa 40 parcel carriers. Cyclone couriers fills a commercial gap as York is a congested medieval city with a vehicle ban from 11 to 4. Cyclone couriers operate a next day delivery service on behalf of their contracted parcel carrier customers. They tranship from carrier’s vehicles or collect. They consolidate and deliver the next day. This is only possible for a cycle due to the vehicle bans and even before the ban the cycles are faster, use bike lanes and are cheaper. The cycles are similar to cycle rickshaws but built for freight. The tricycles feature 42 speed transmission, hydraulic disc brakes and aircraft grade steel and accommodate loads up to 250kg. Cargo boxes and passenger seats can be swapped in minutes. They also run collect and deliver courier services both within York and from carriers to York. With this they use normal bikes, thus avoiding loading/unloading restrictions as well as using bike lanes, being faster in congested traffic and cheaper.
Since a bike and rider costs £60 a day as opposed to £250 a day for a van and driver, it is cheaper to use bikes to achieve multiple 9am delivery slots than the equivalent number of vans. Cyclone couriers is financed by the clients (parcel carriers and others ) paying for the delivery service. [www.cyclesmaximus.co.uk; www.cyclonecouriers.co.uk]
UK - 02 London Heathrow Airport Consolidation Centre A consolidation centre was opened by BAA (British Airport Authority) at Heathrow airport in 2001 as part of their environmental strategy to improve air quality and packaging waste management. This 25,000 square feet consolidation centre is run on BAA's behalf by Exel. The purpose of the scheme is to reduce goods vehicle movements, and to improve goods handling systems and waste packaging management in the terminals. In this scheme, goods destined for retailers with premises in terminals 1-4 are now delivered to the consolidation centre (which is located away from the terminal buildings) rather than directly to the shops. Five vehicles are operated by Exel to transport goods from the consolidation centre to the shops in the terminal buildings as the retailers require them. Deliveries to the consolidation centre are faster than to the shops as there is less congestion on approach roads and fewer delays in off-loading goods.
[Full case study available at: http://www.energy-efficiency.gov.uk/document/gpcs/GPCS402.pdf]
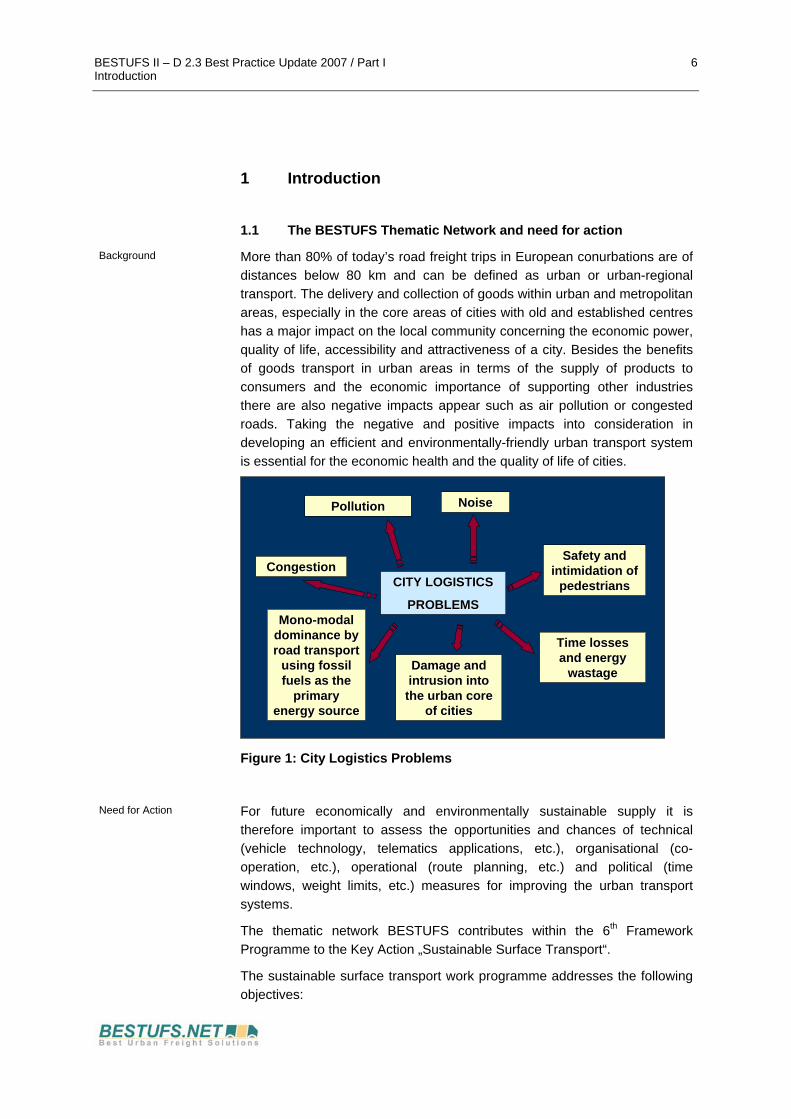
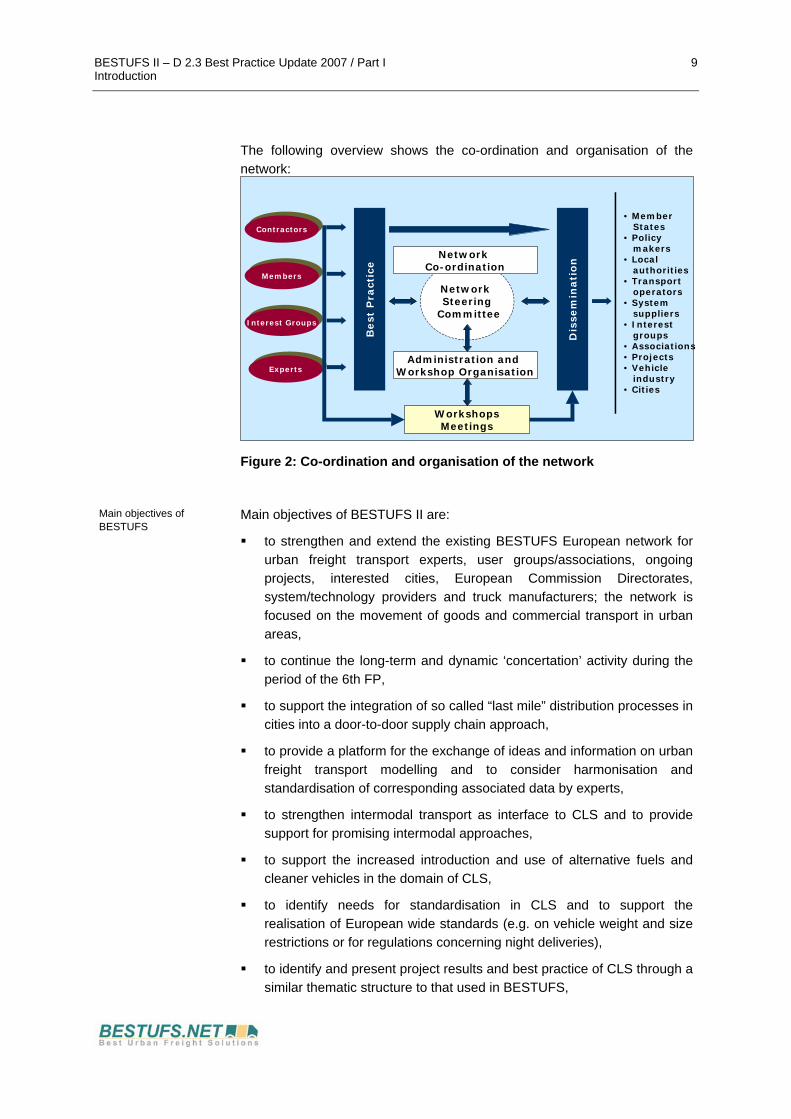
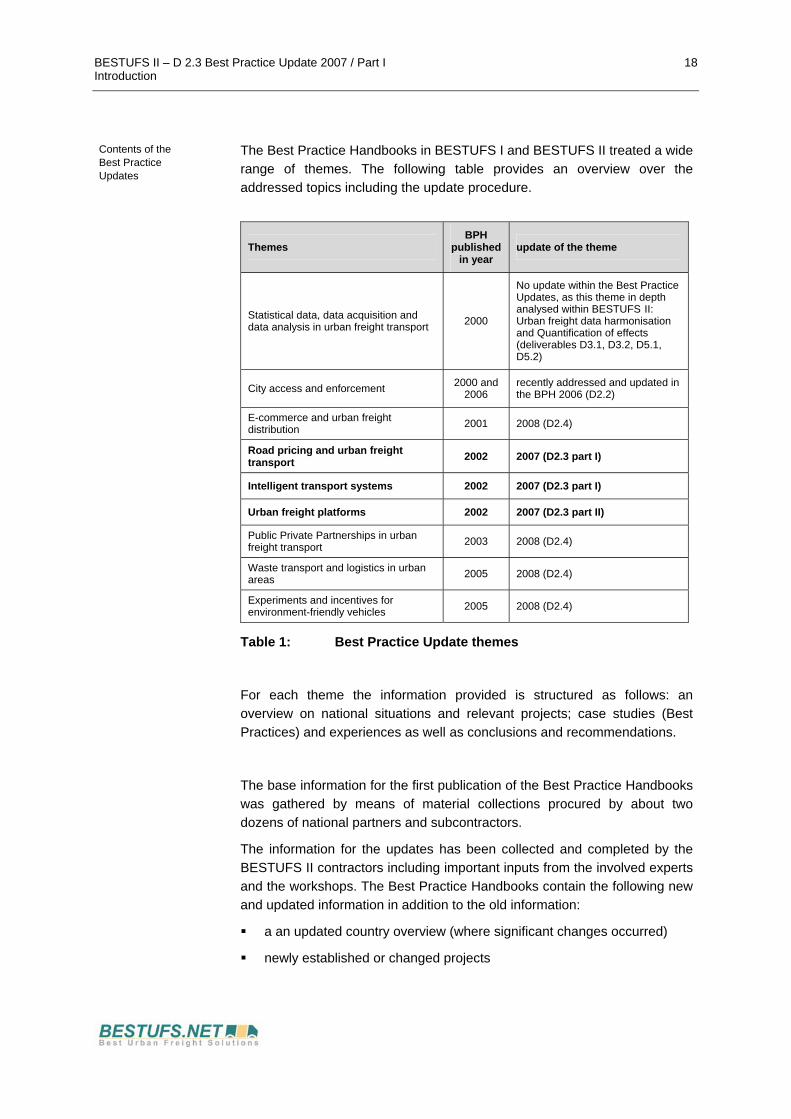
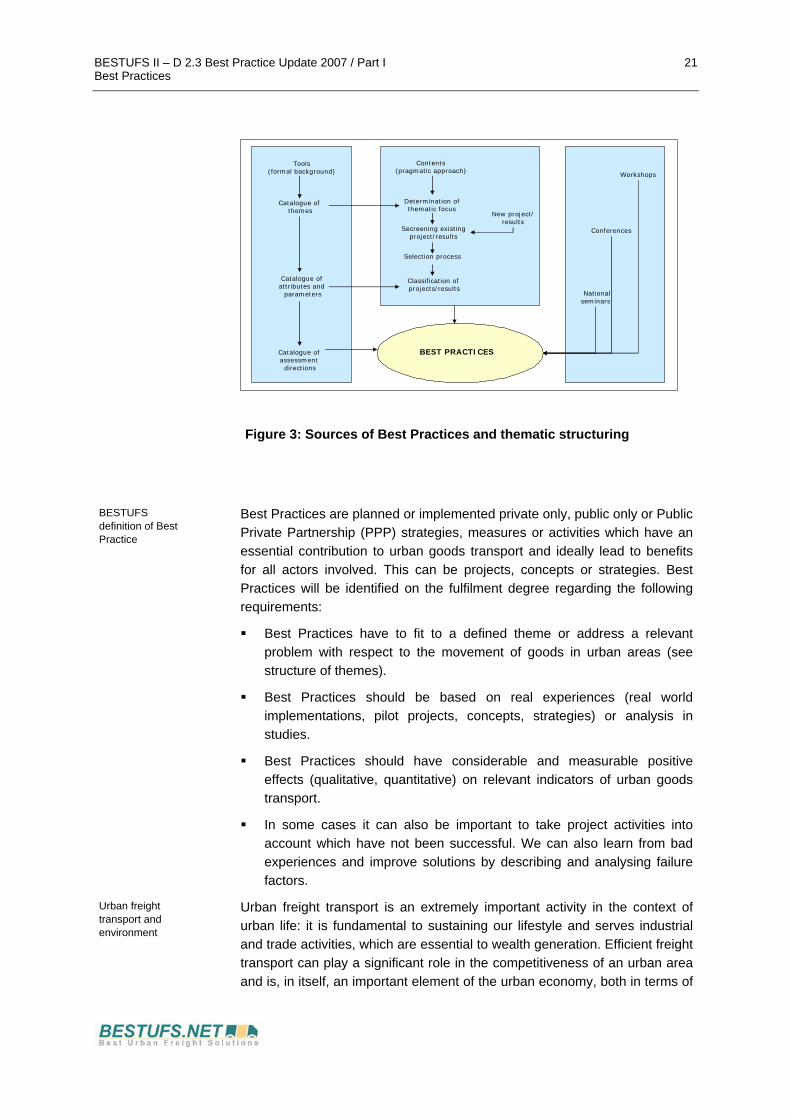
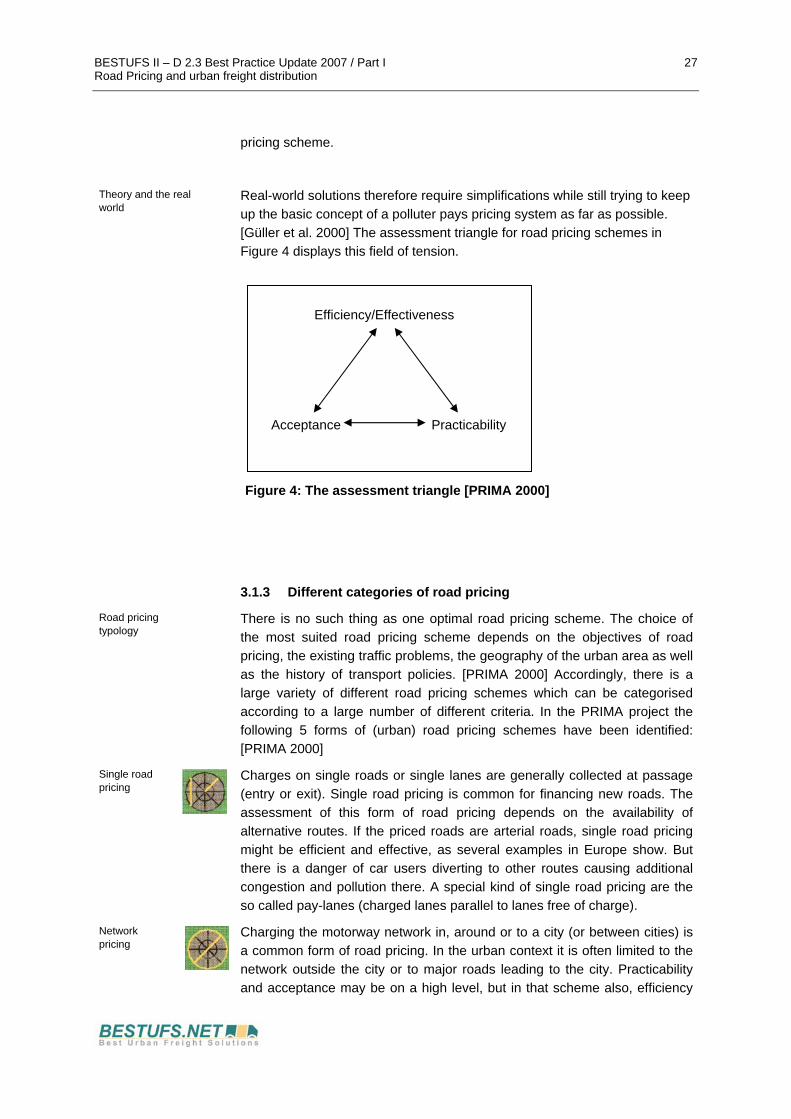
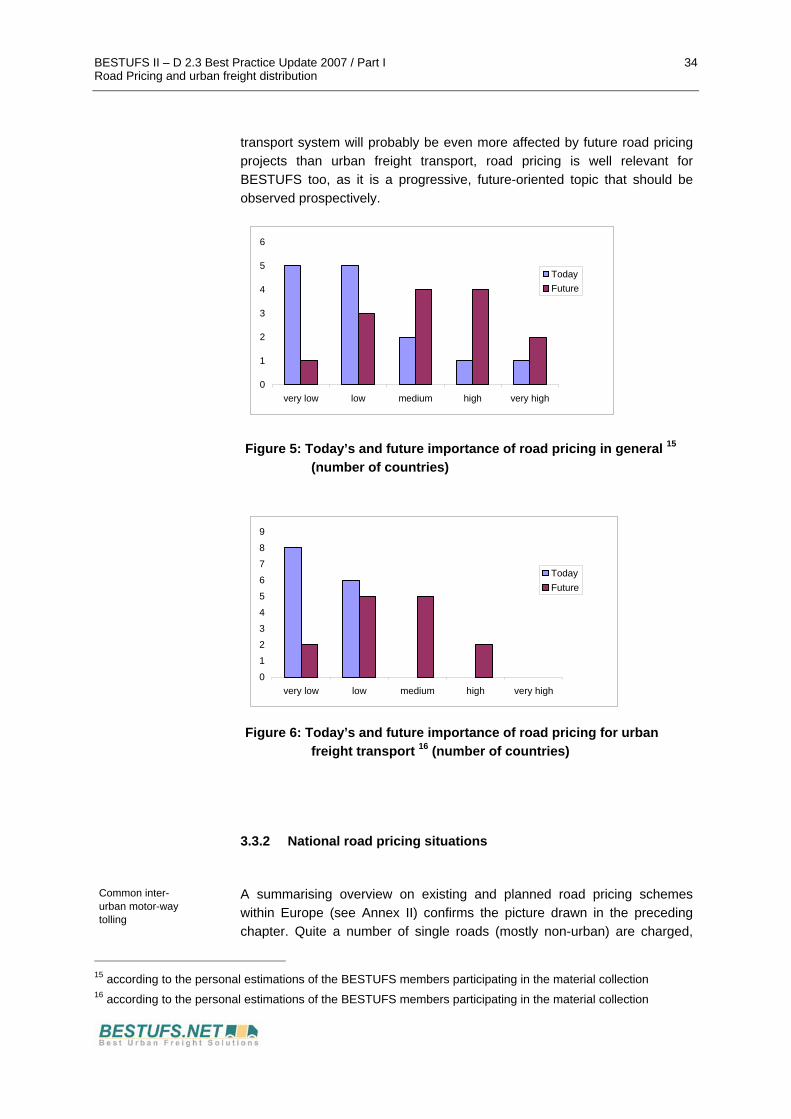
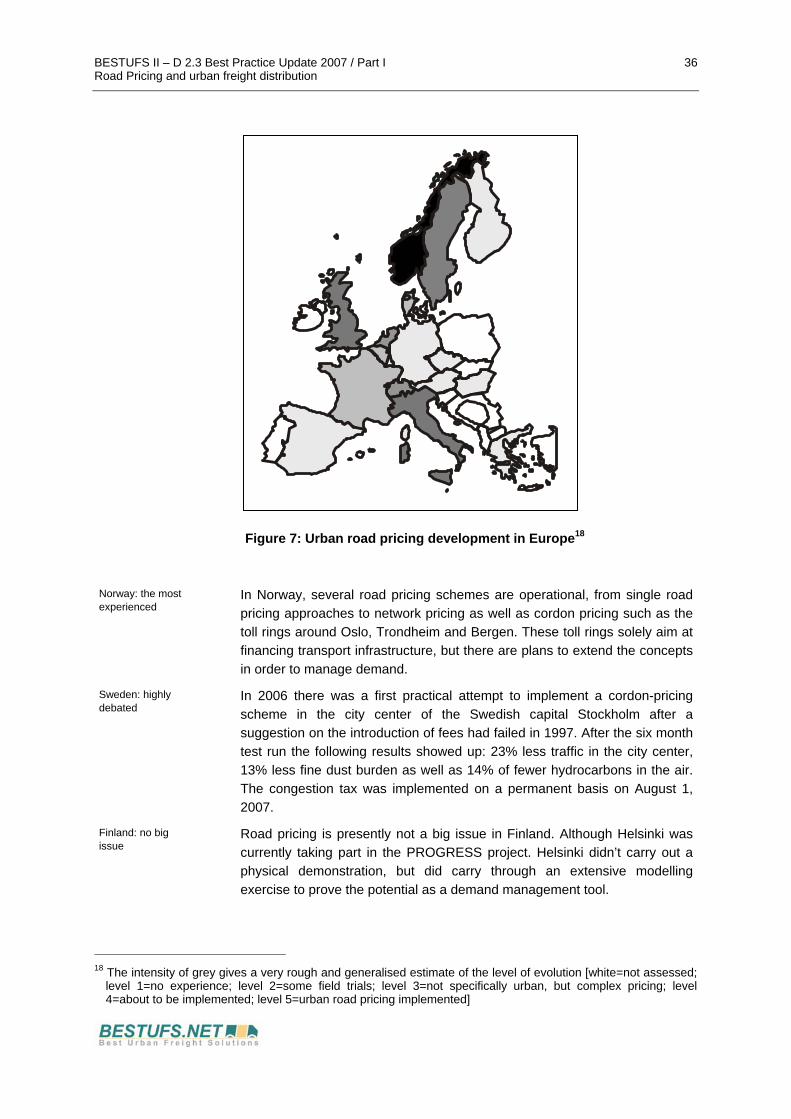
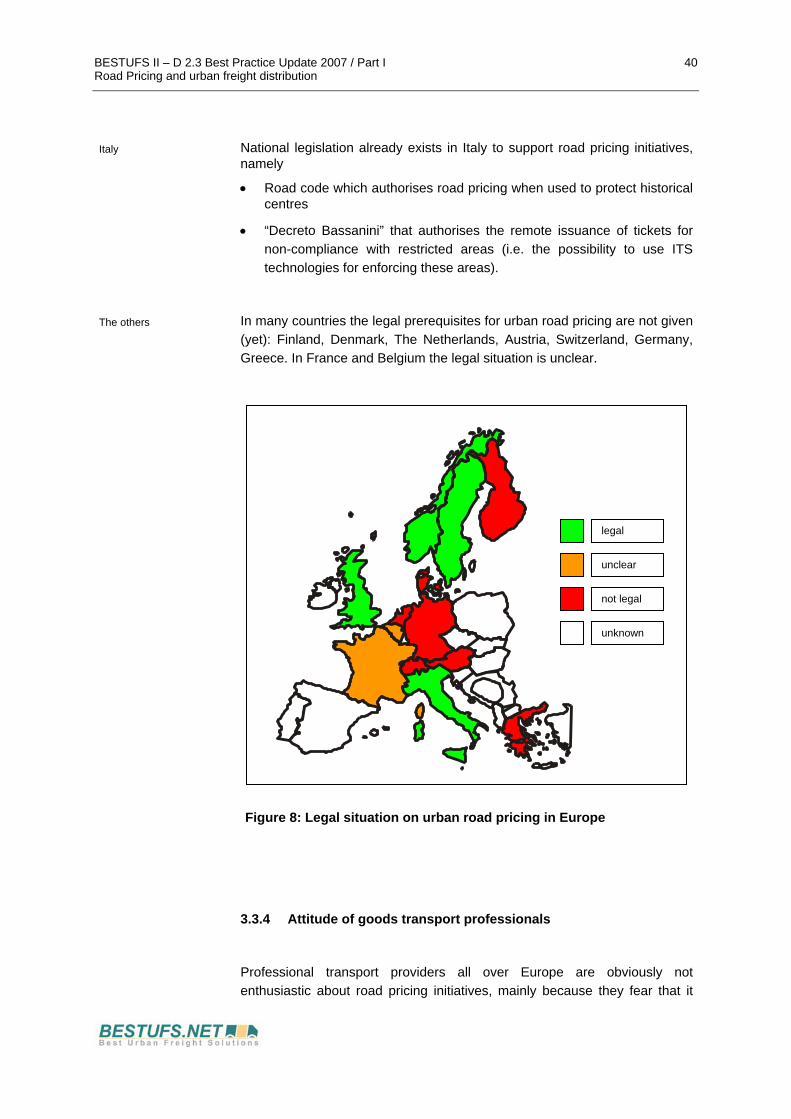
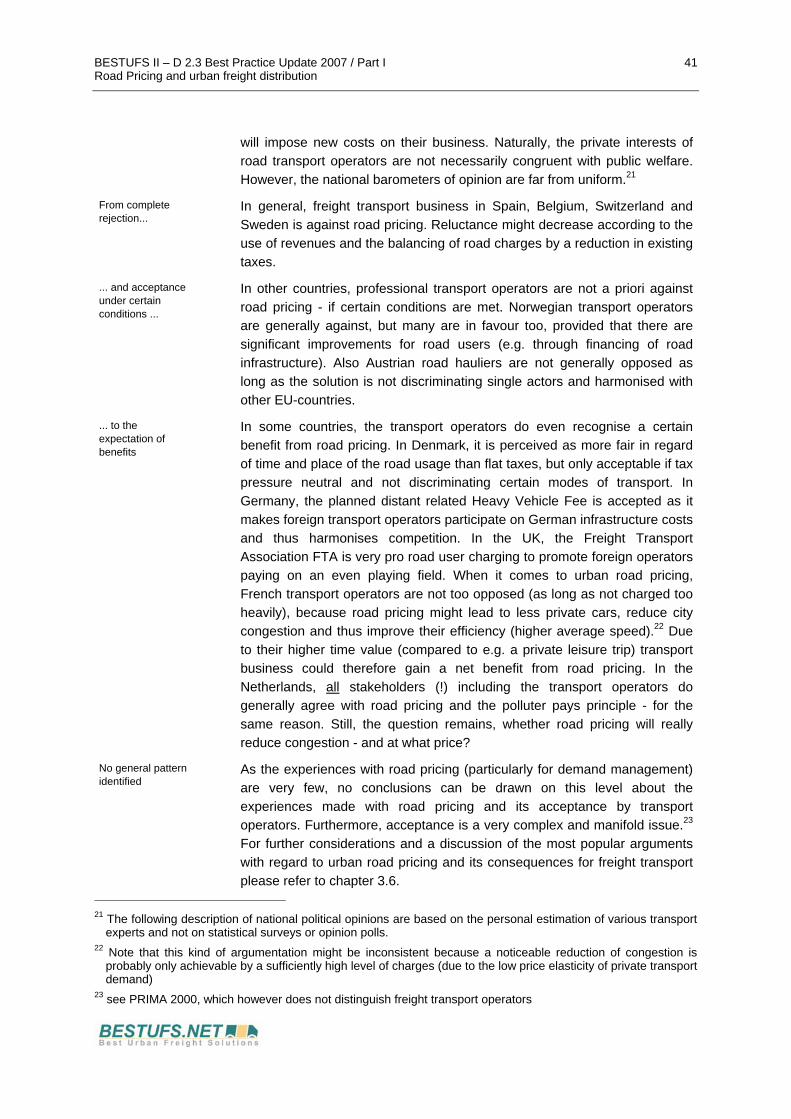
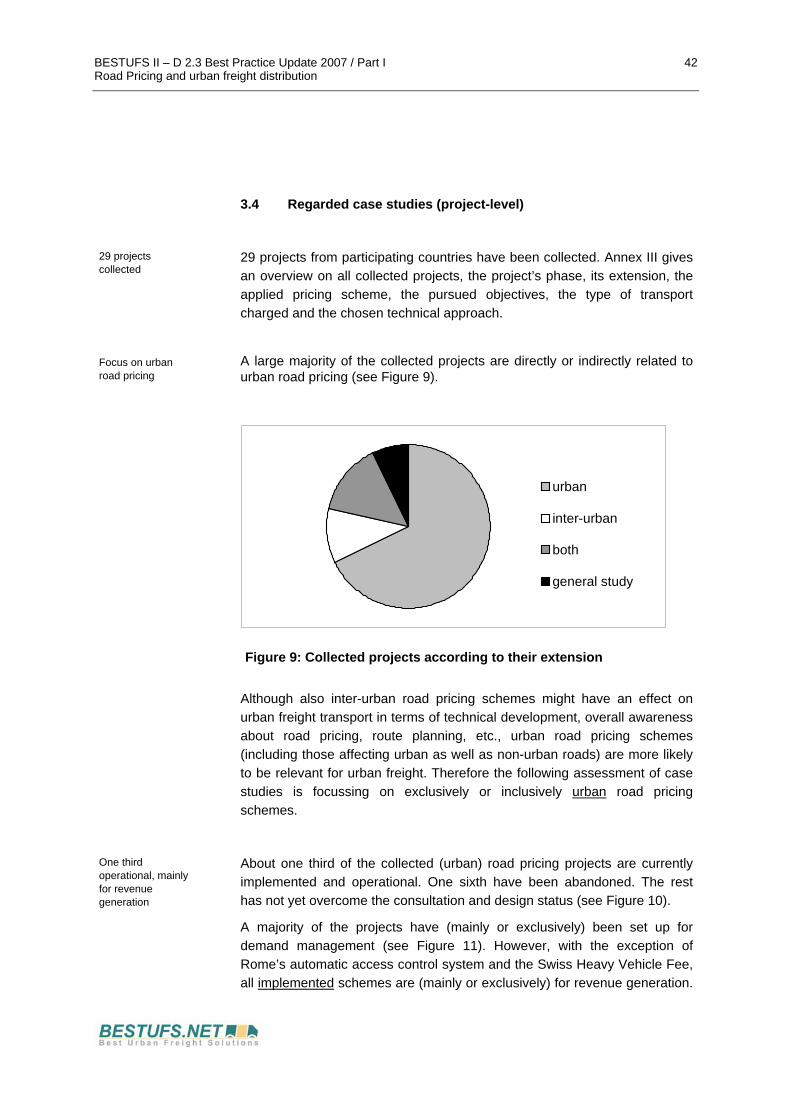
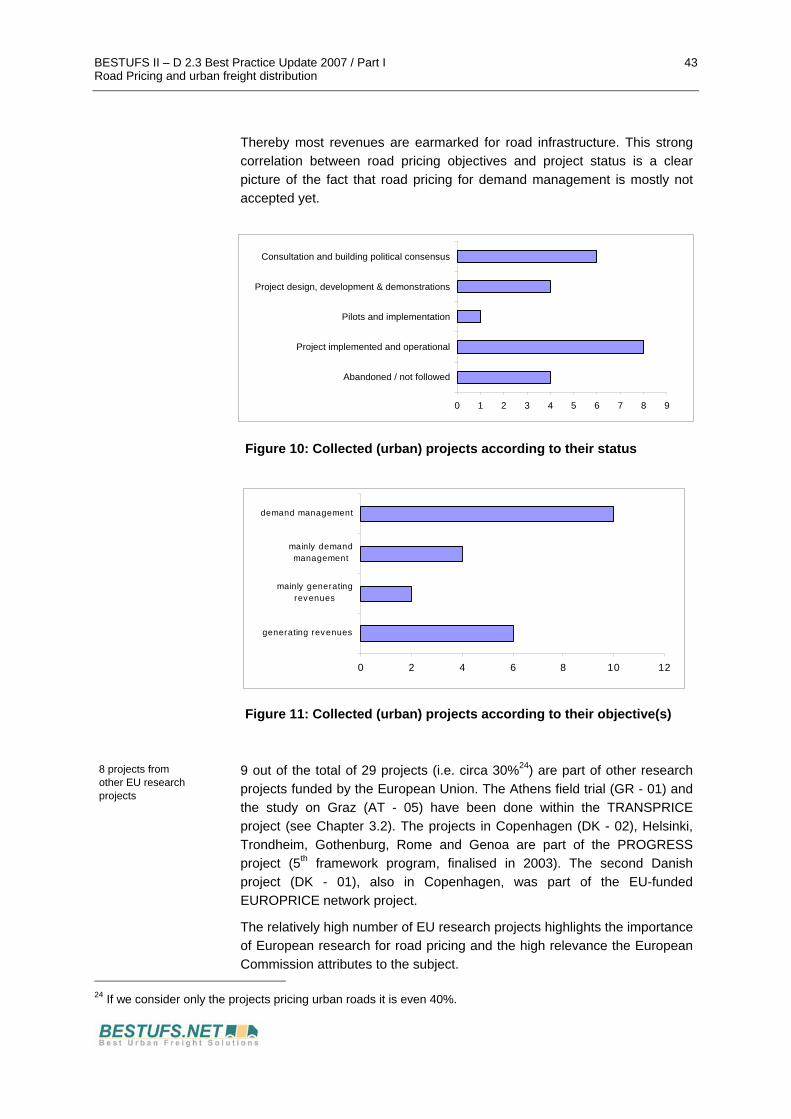

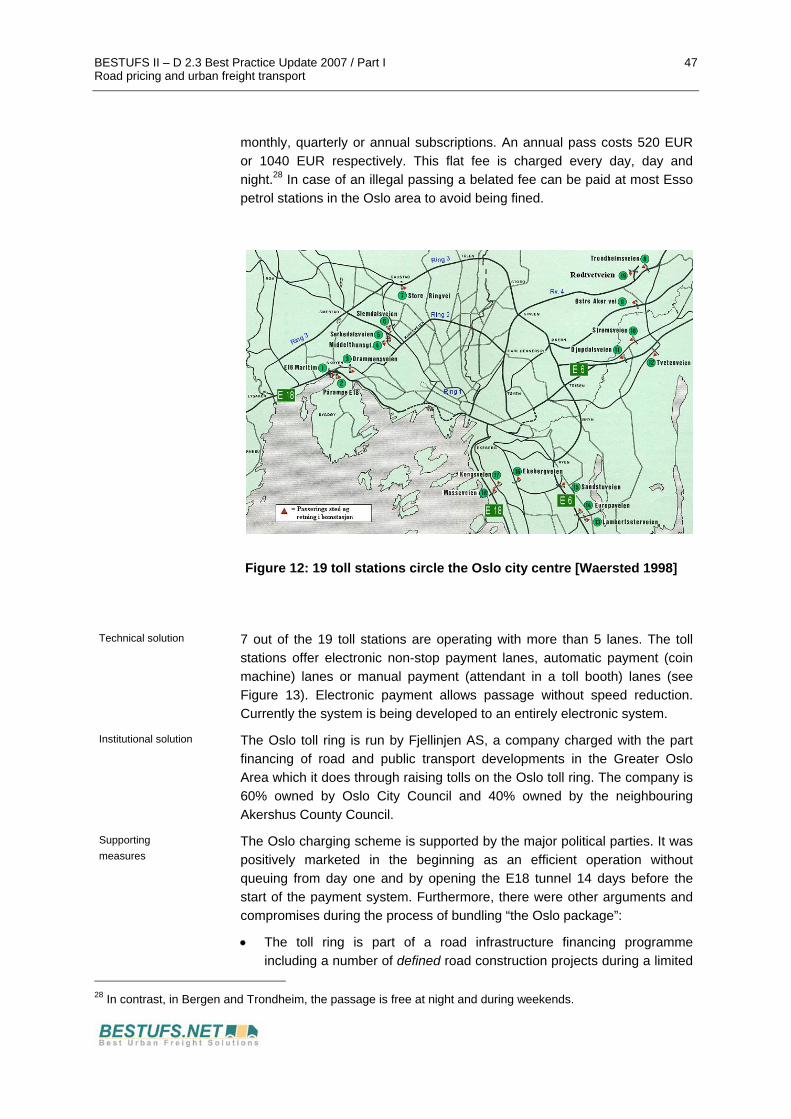
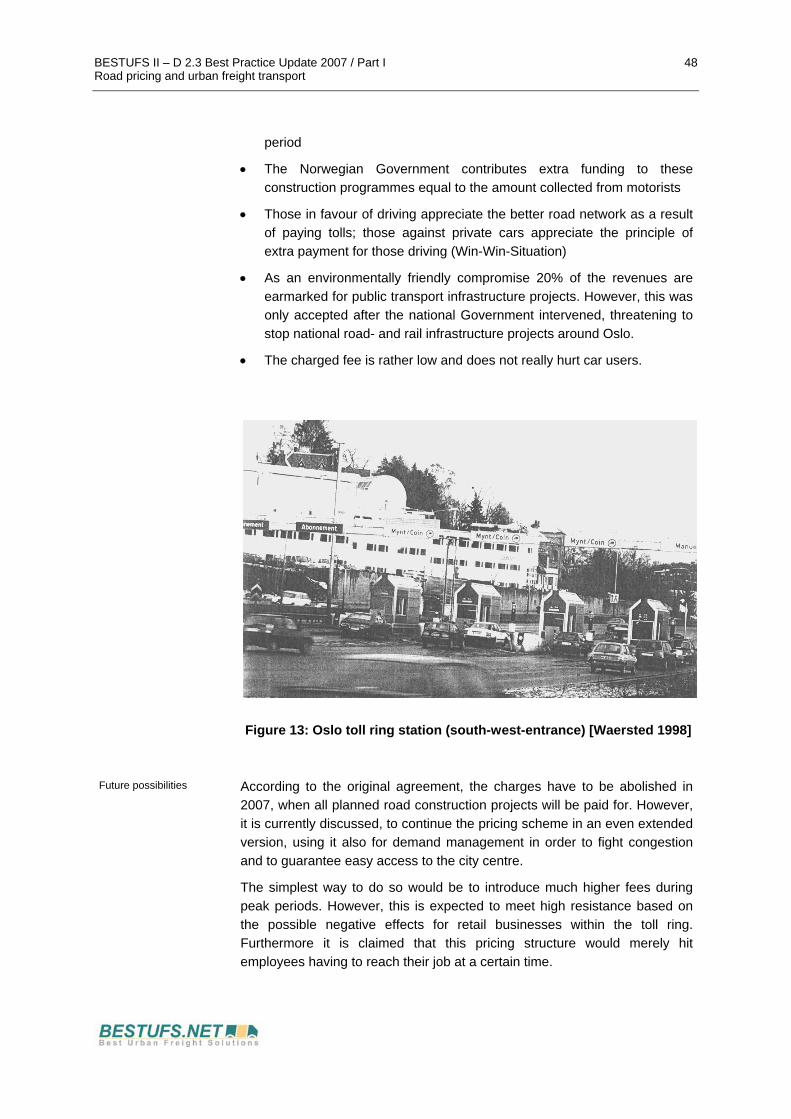
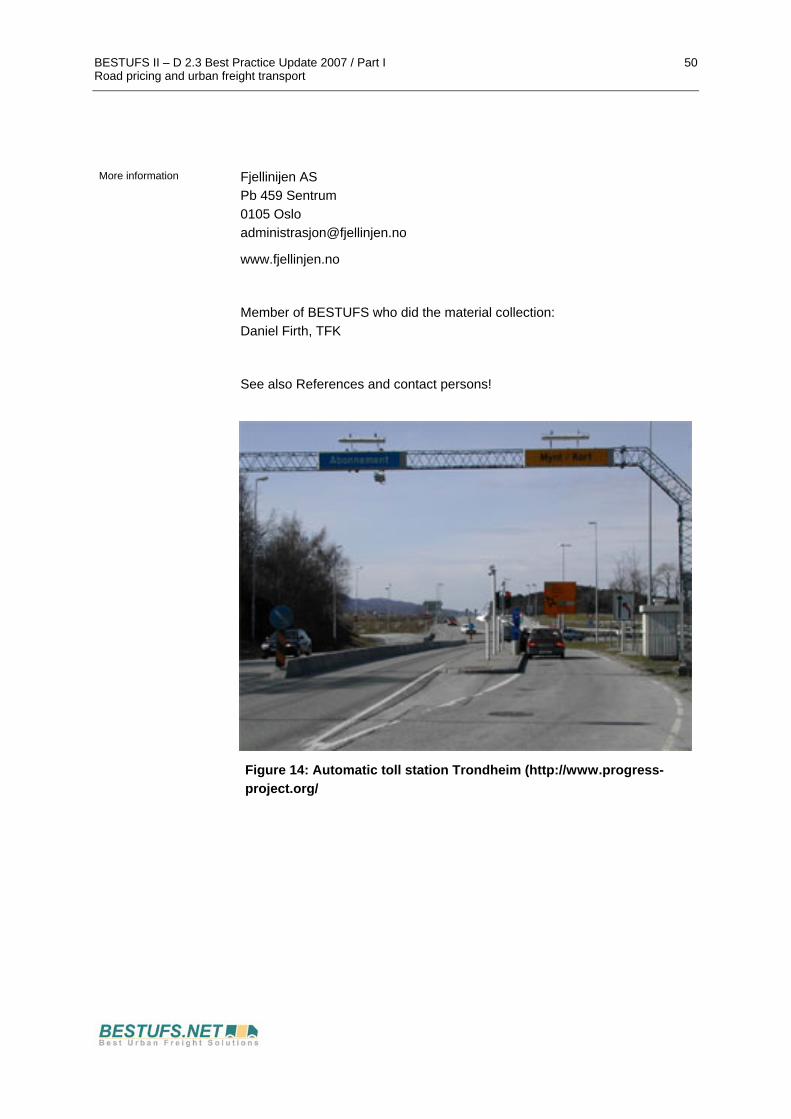
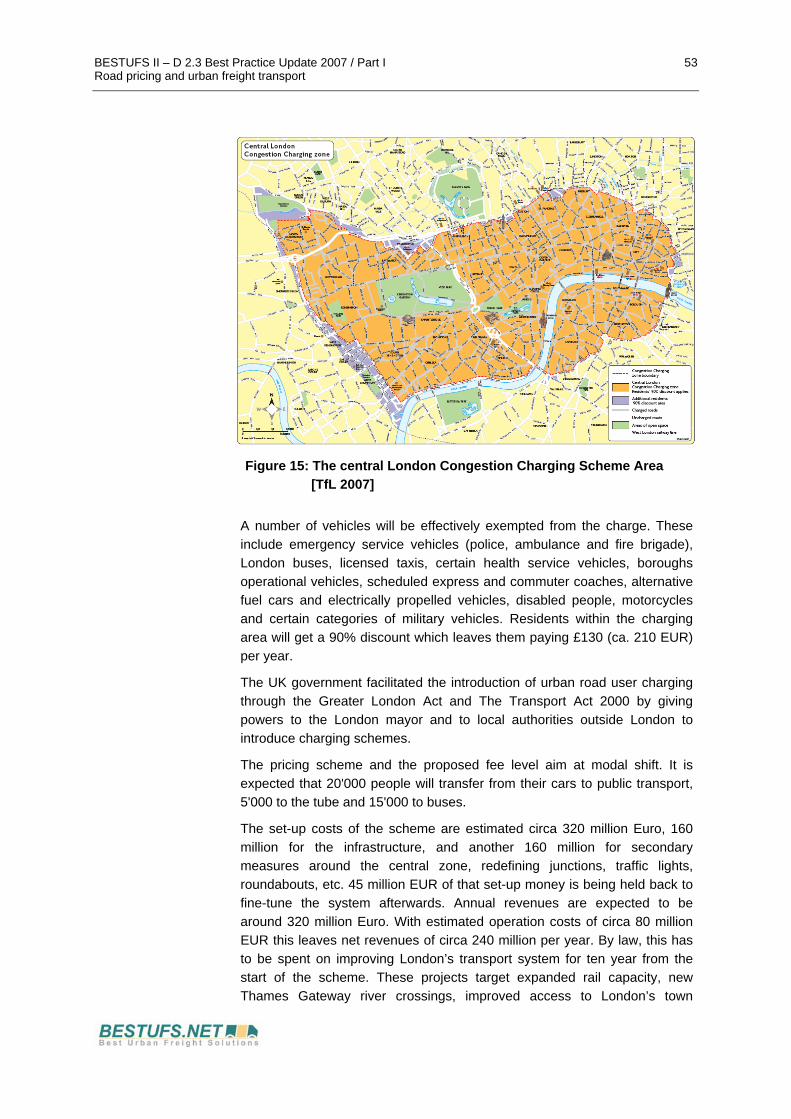
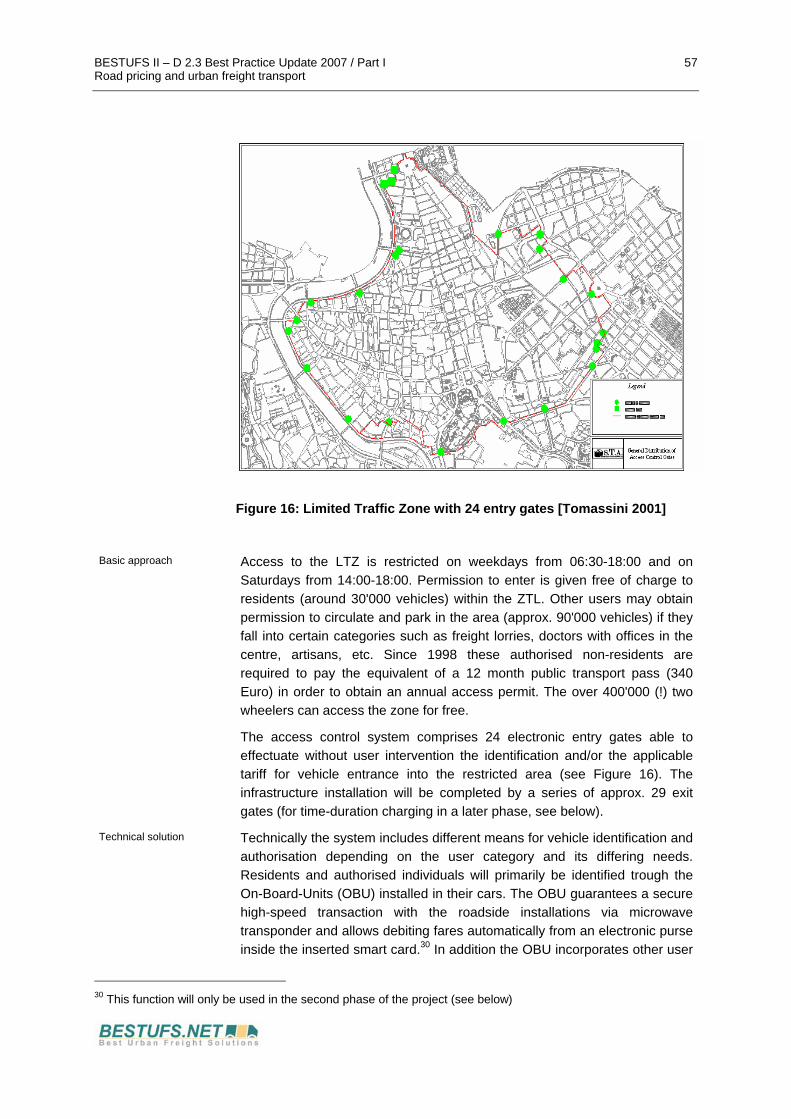
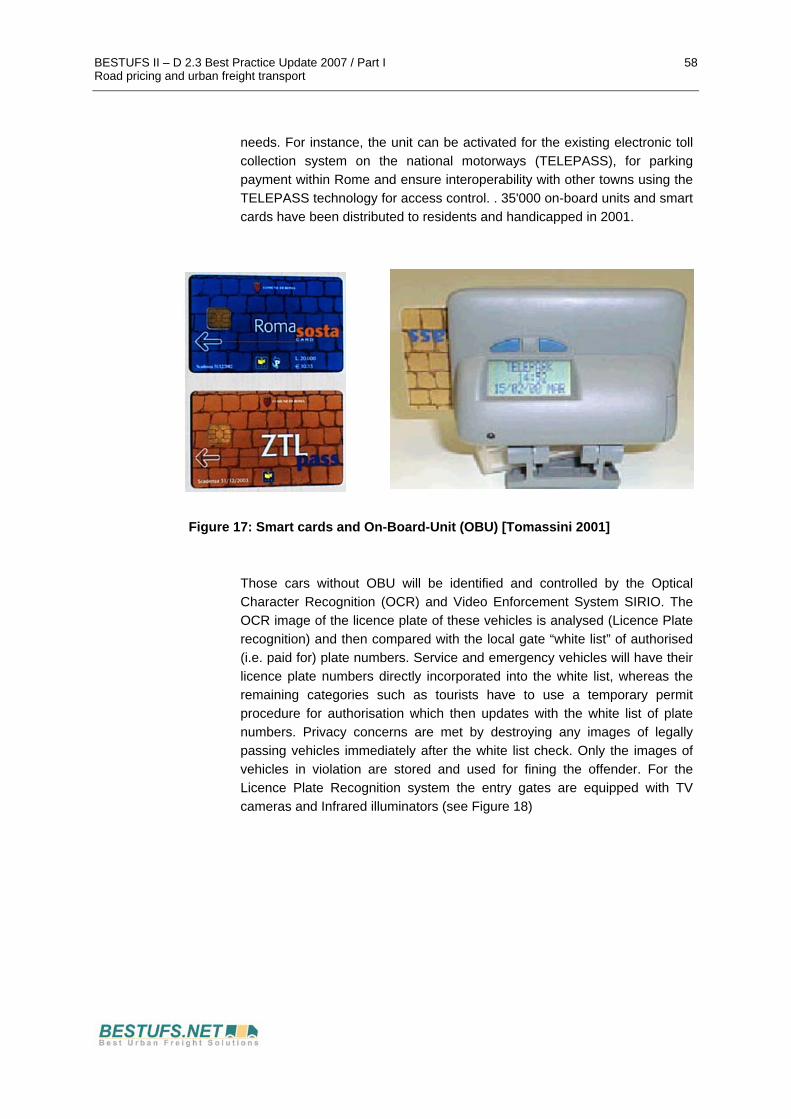
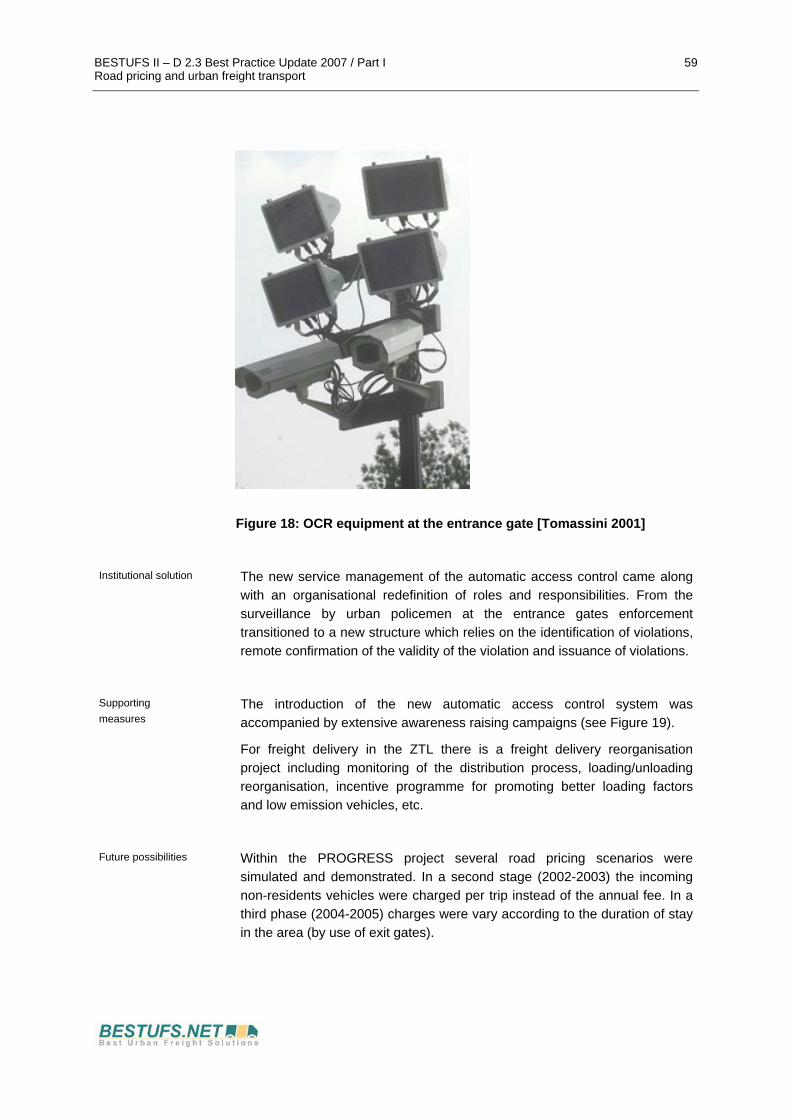
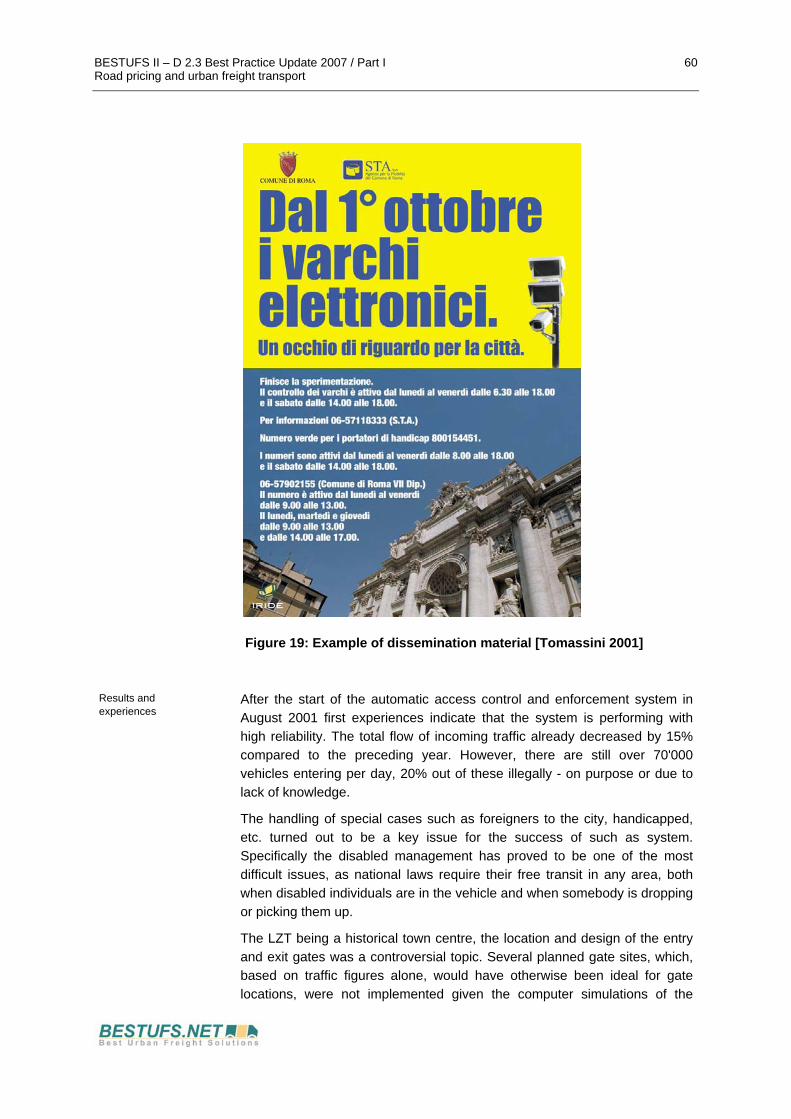
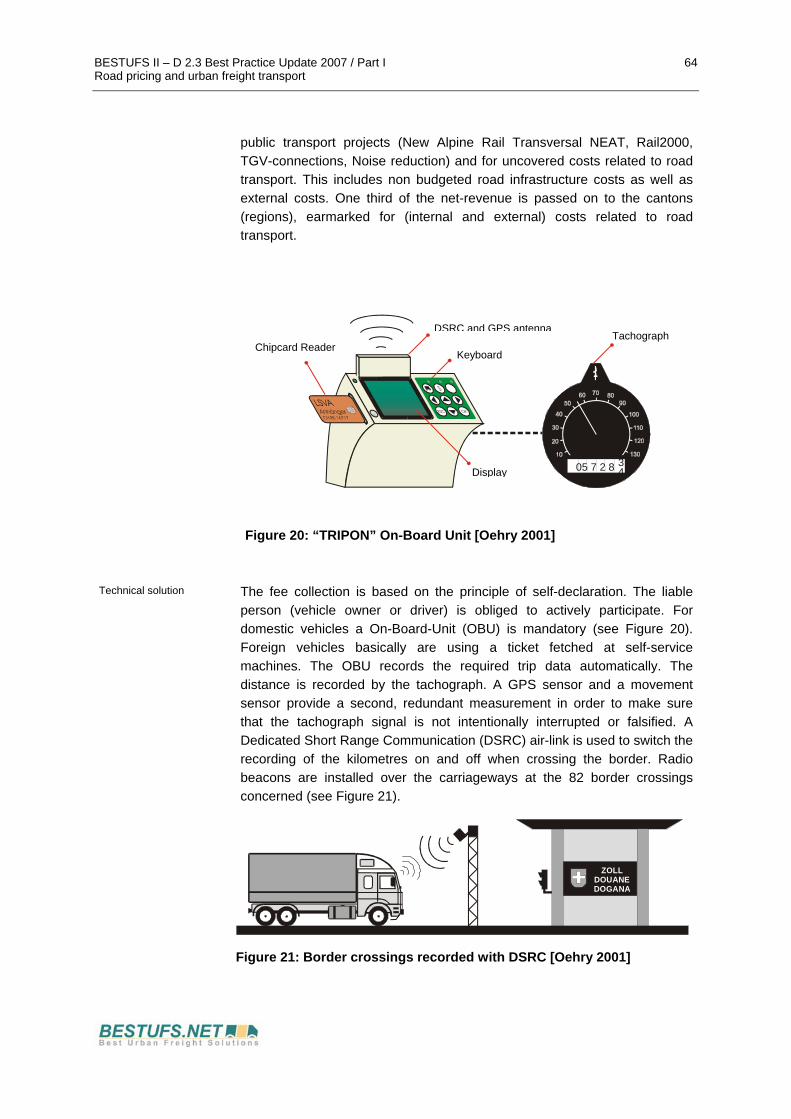
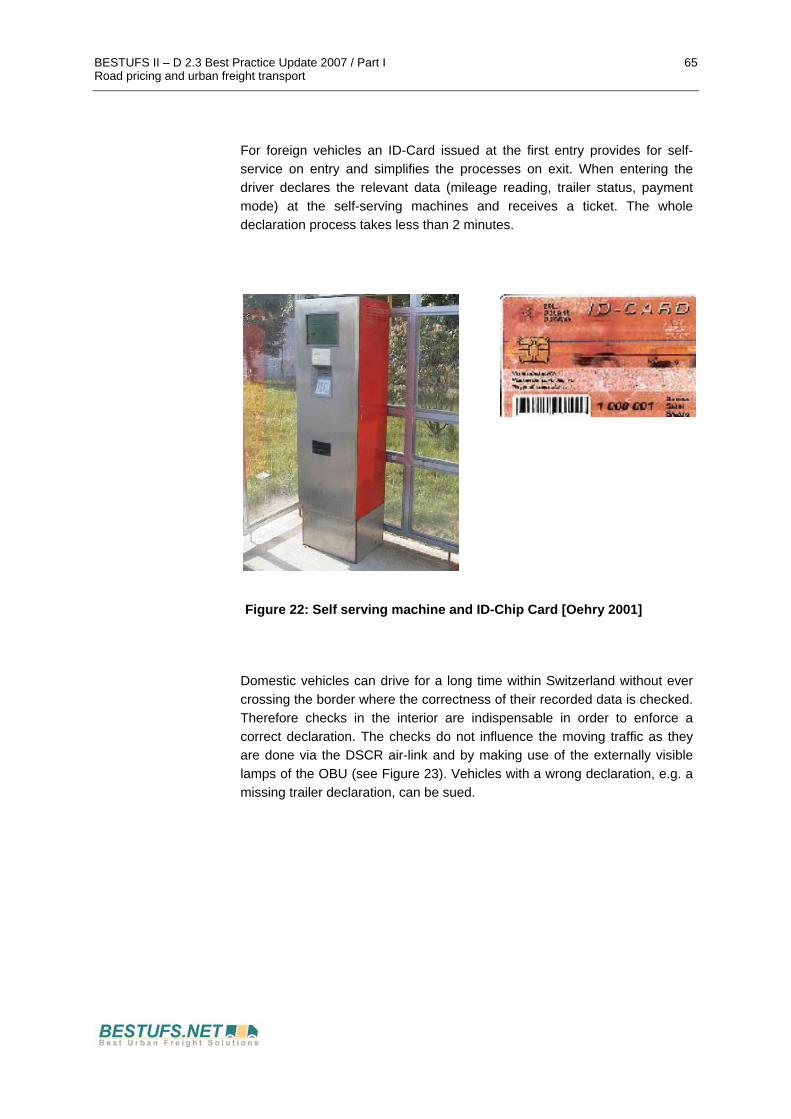
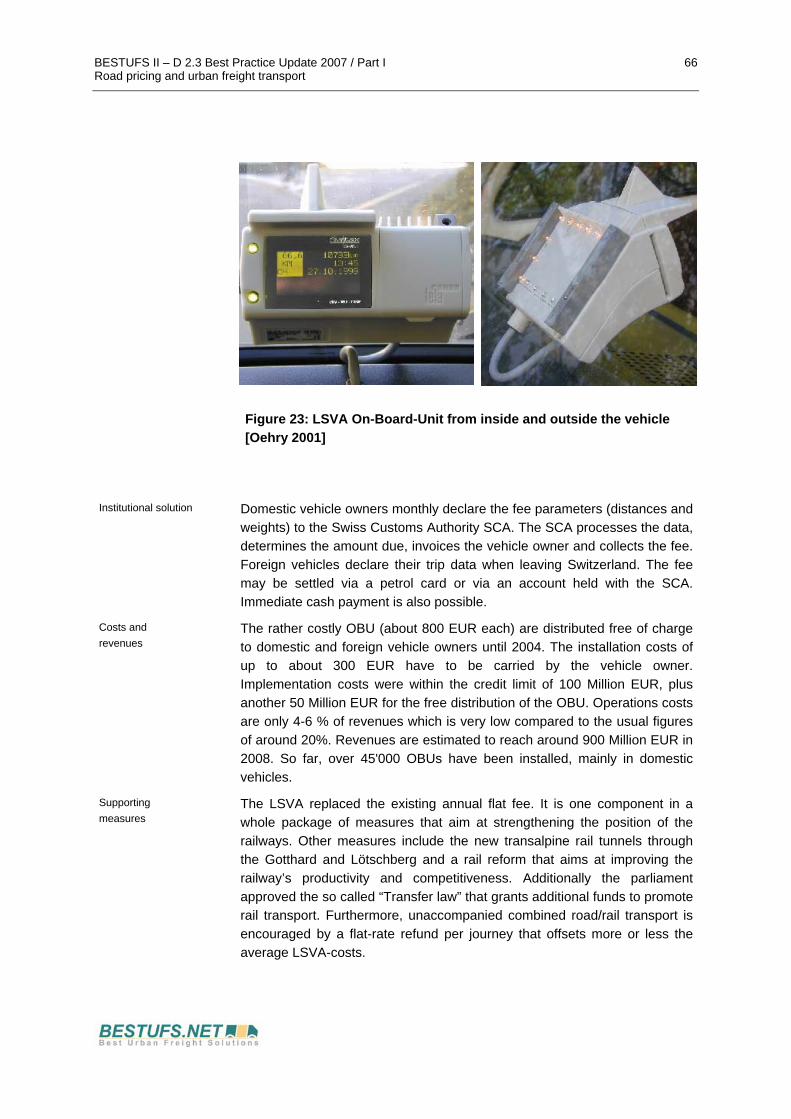
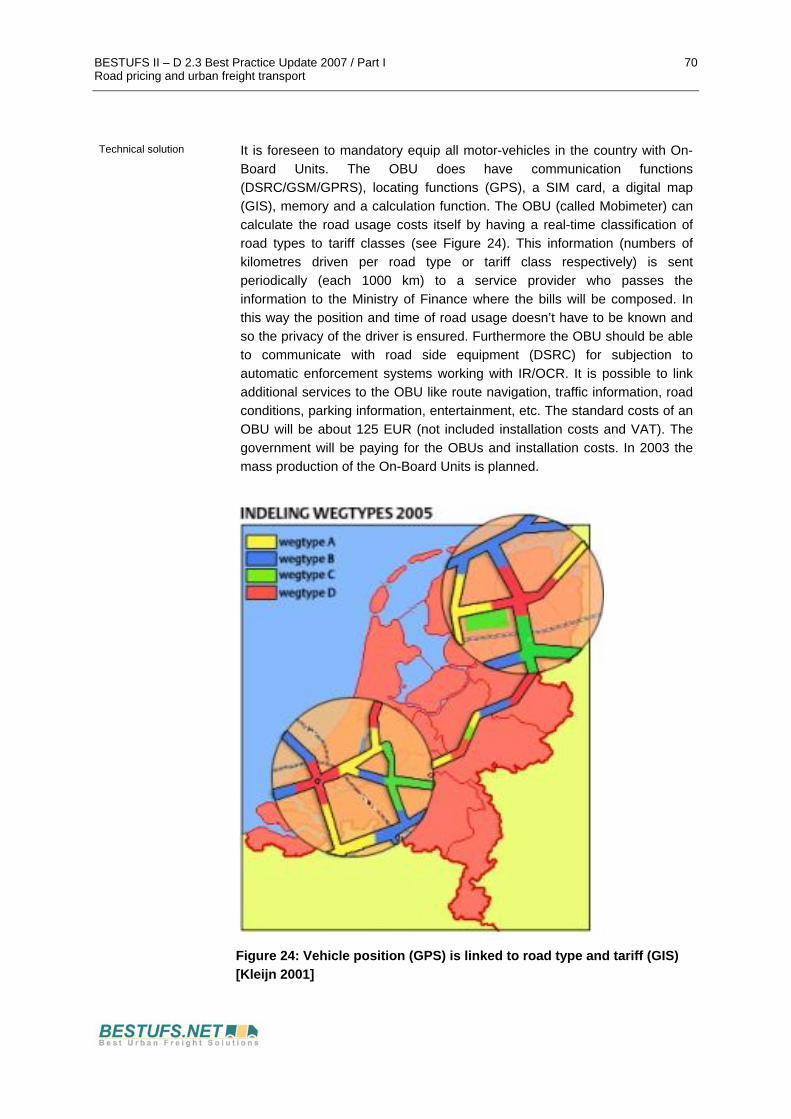
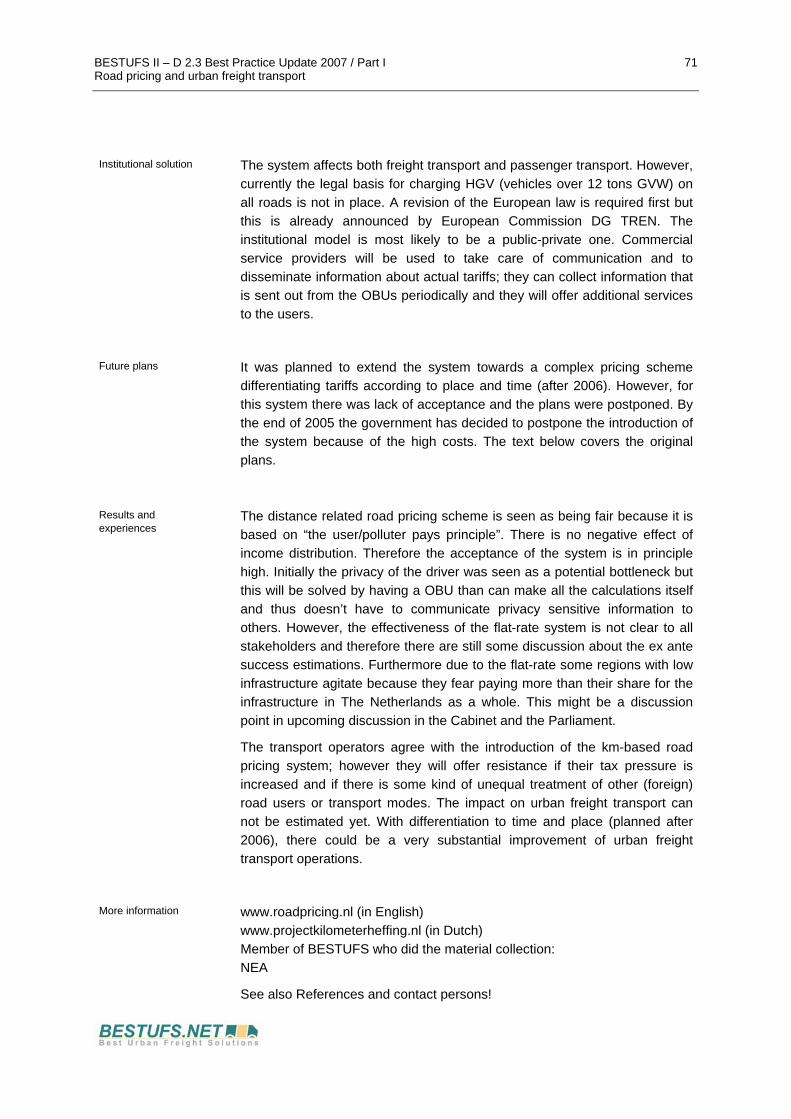
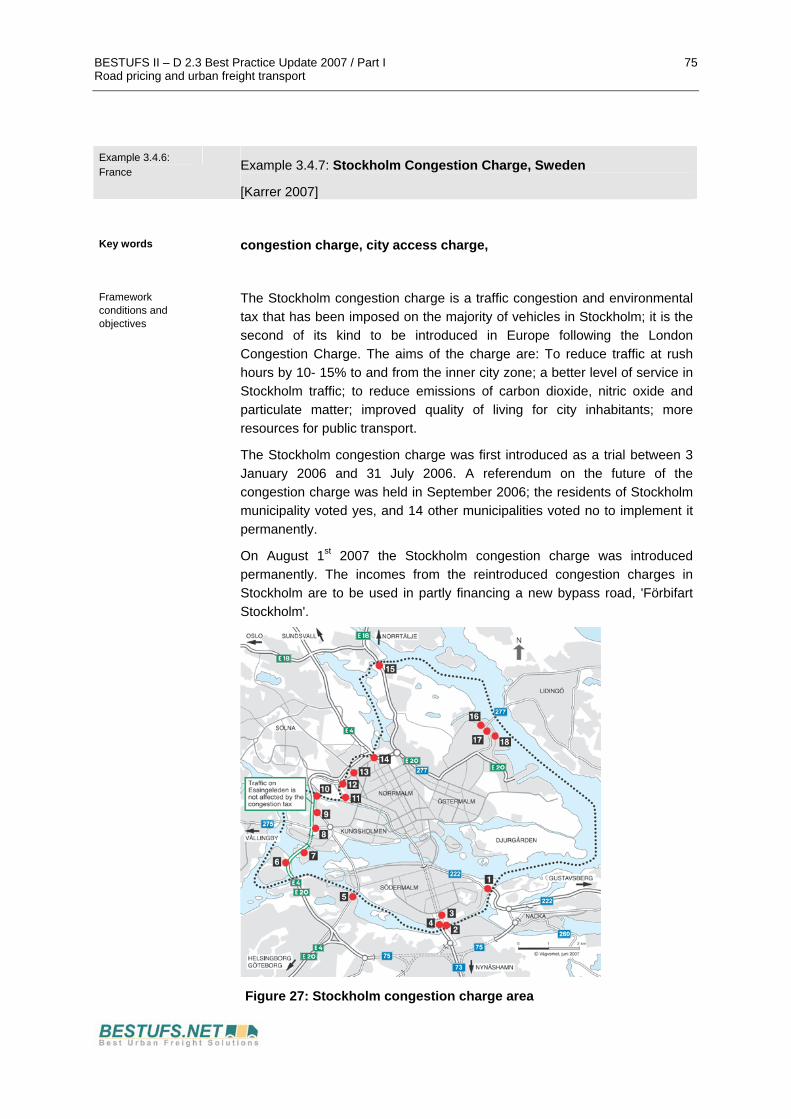
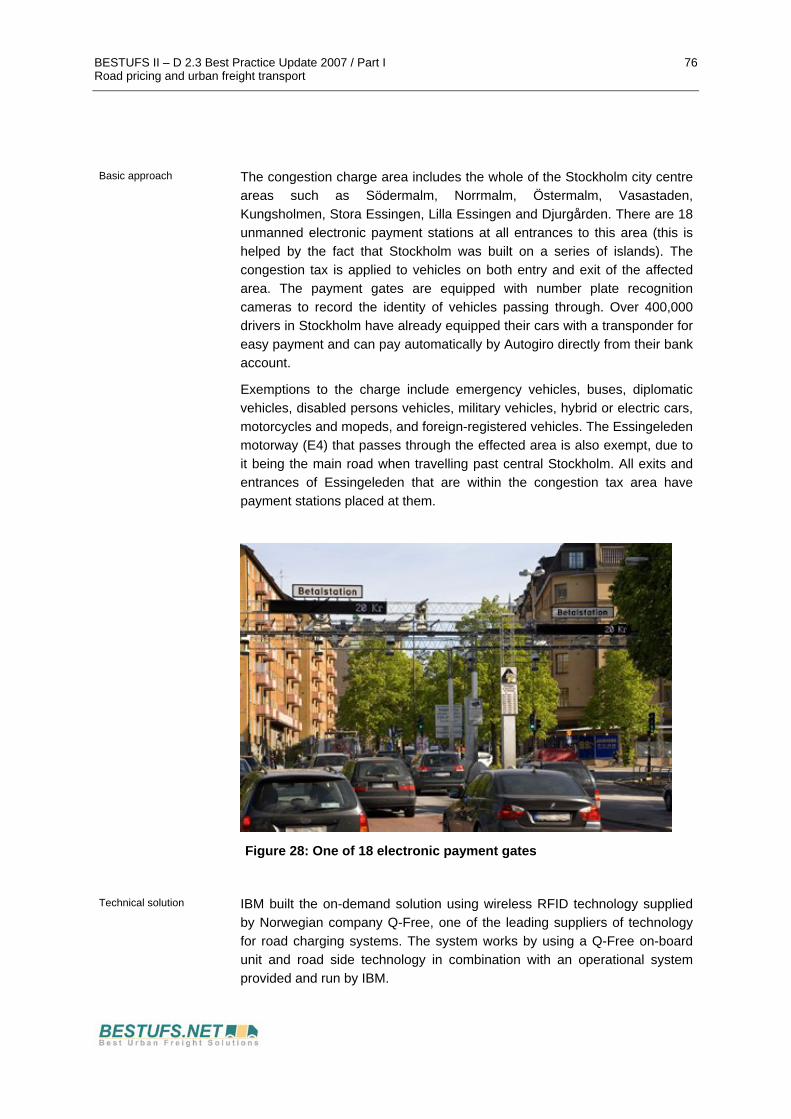
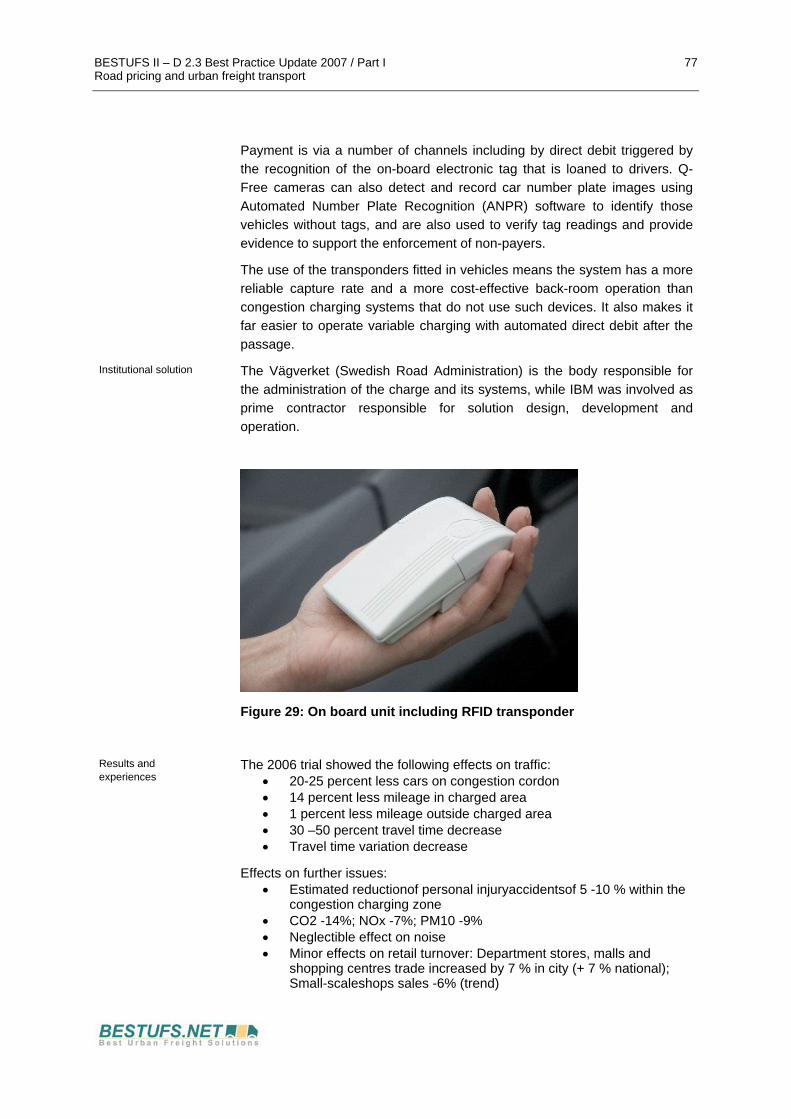
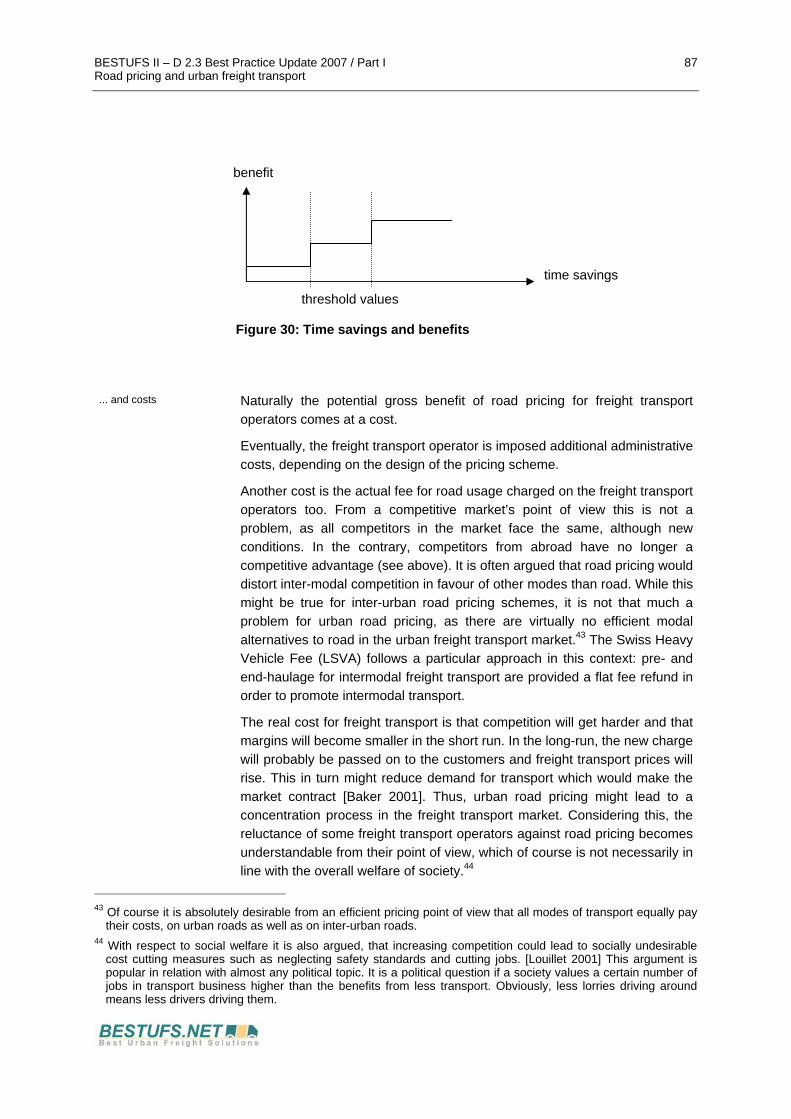
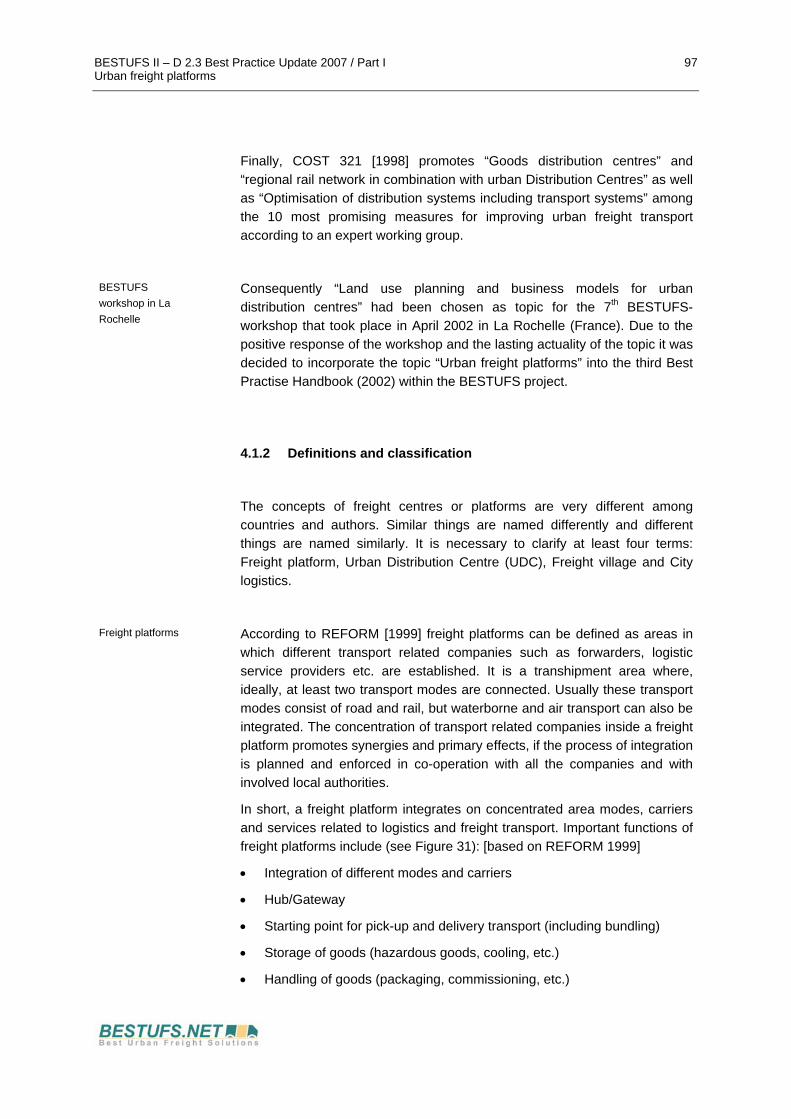
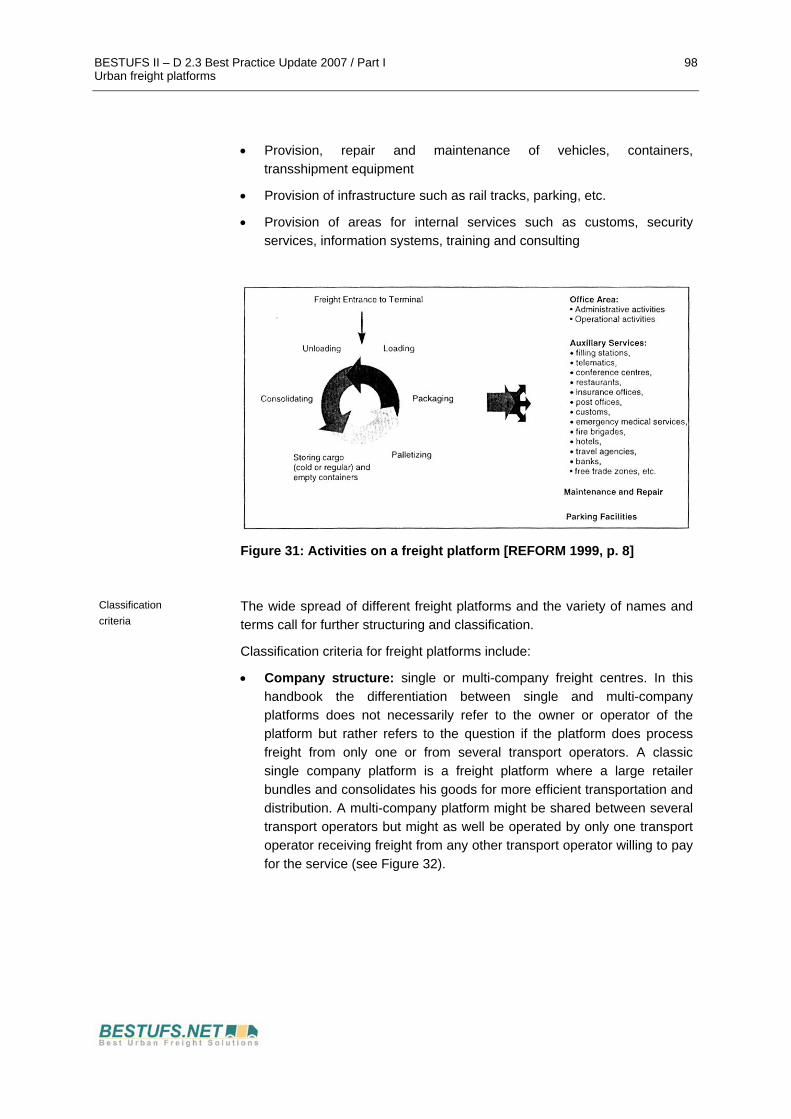
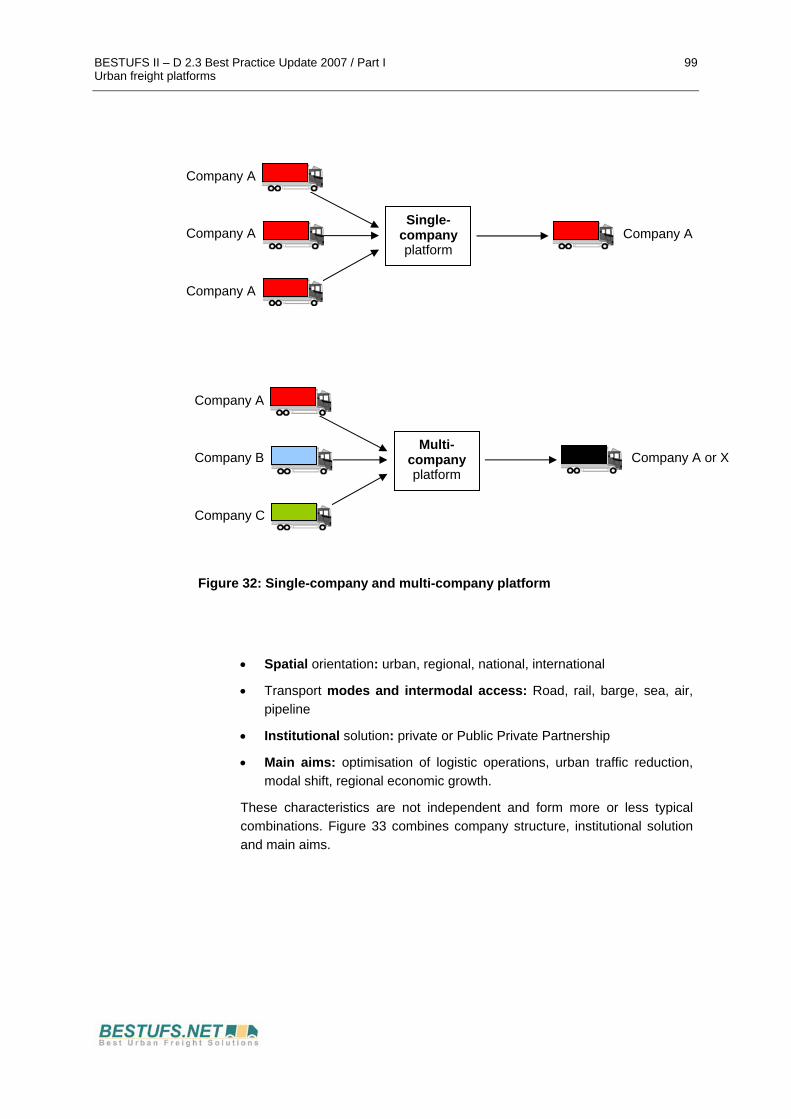
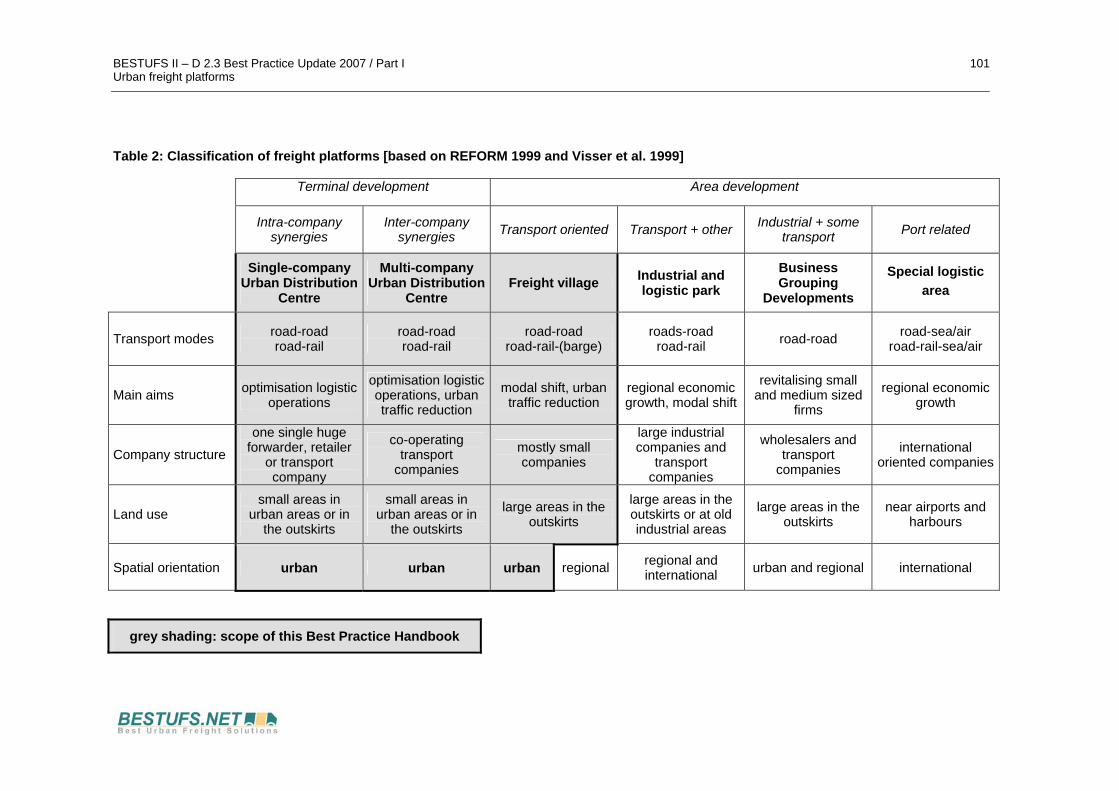
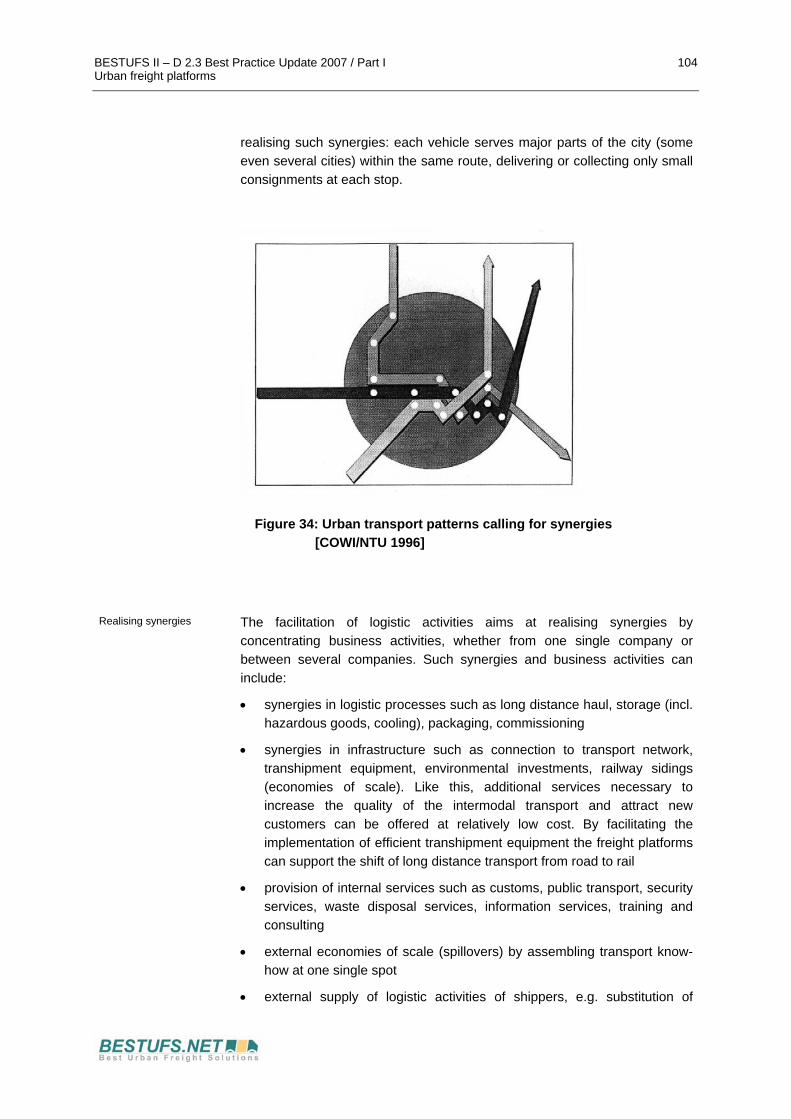
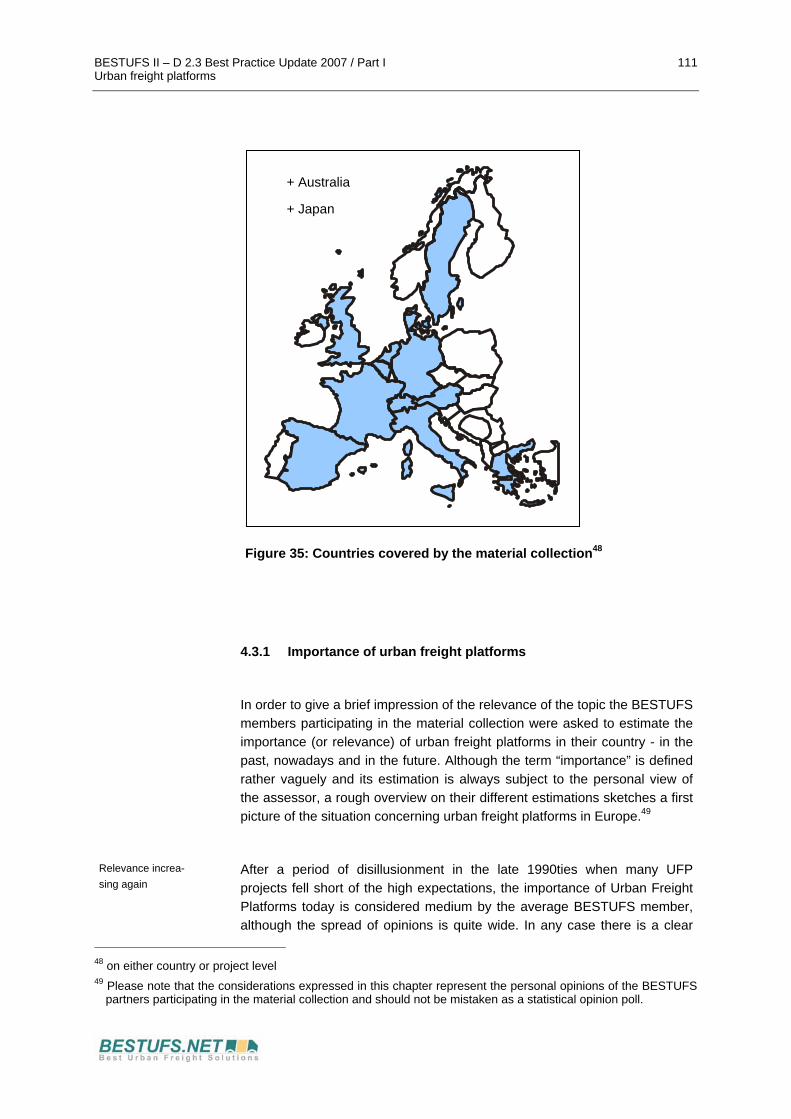
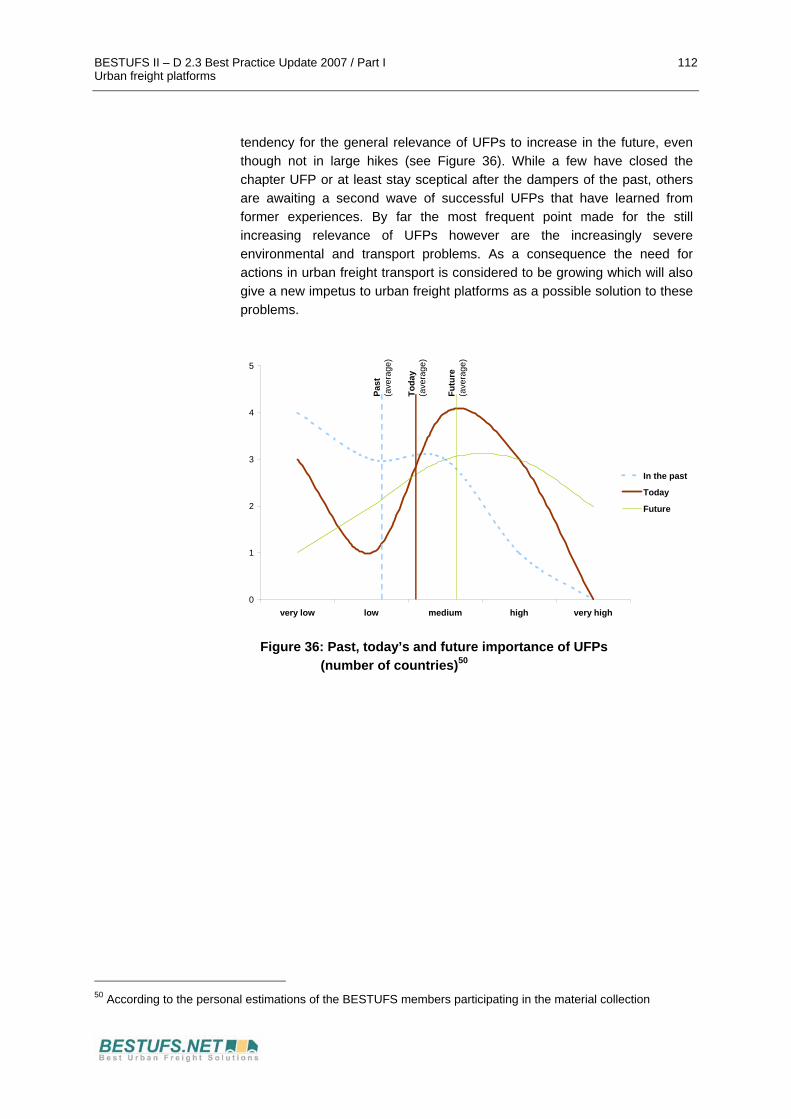
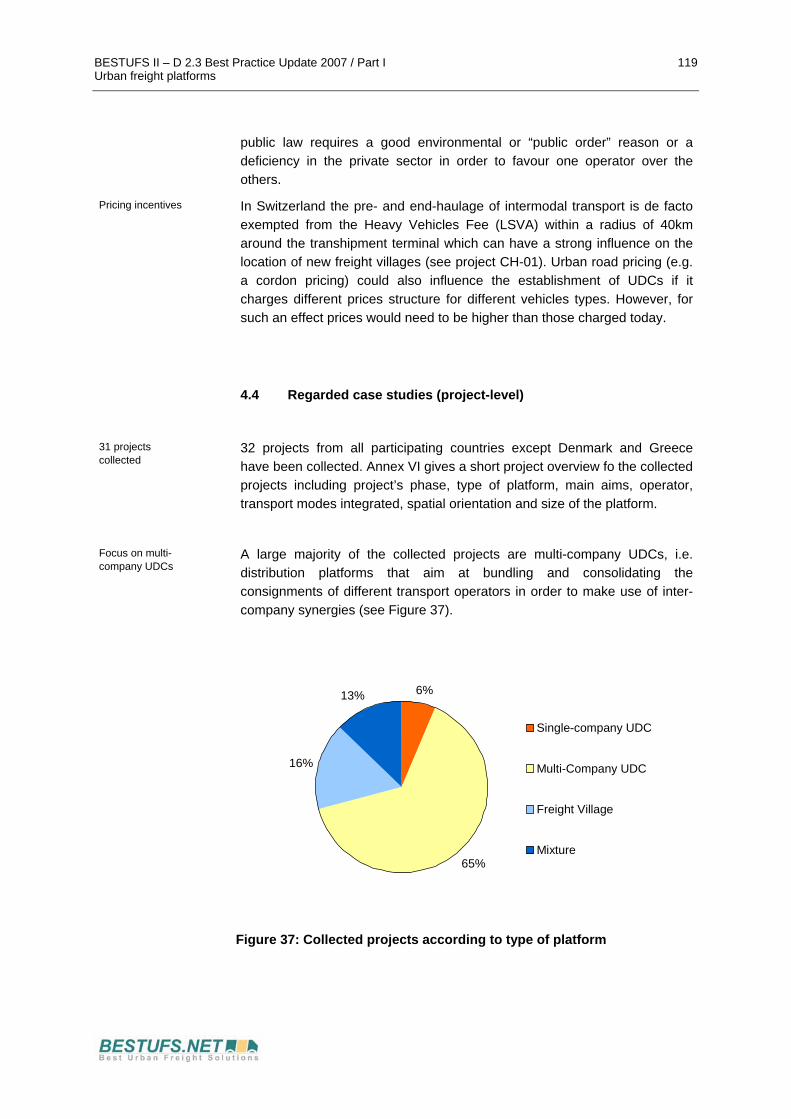
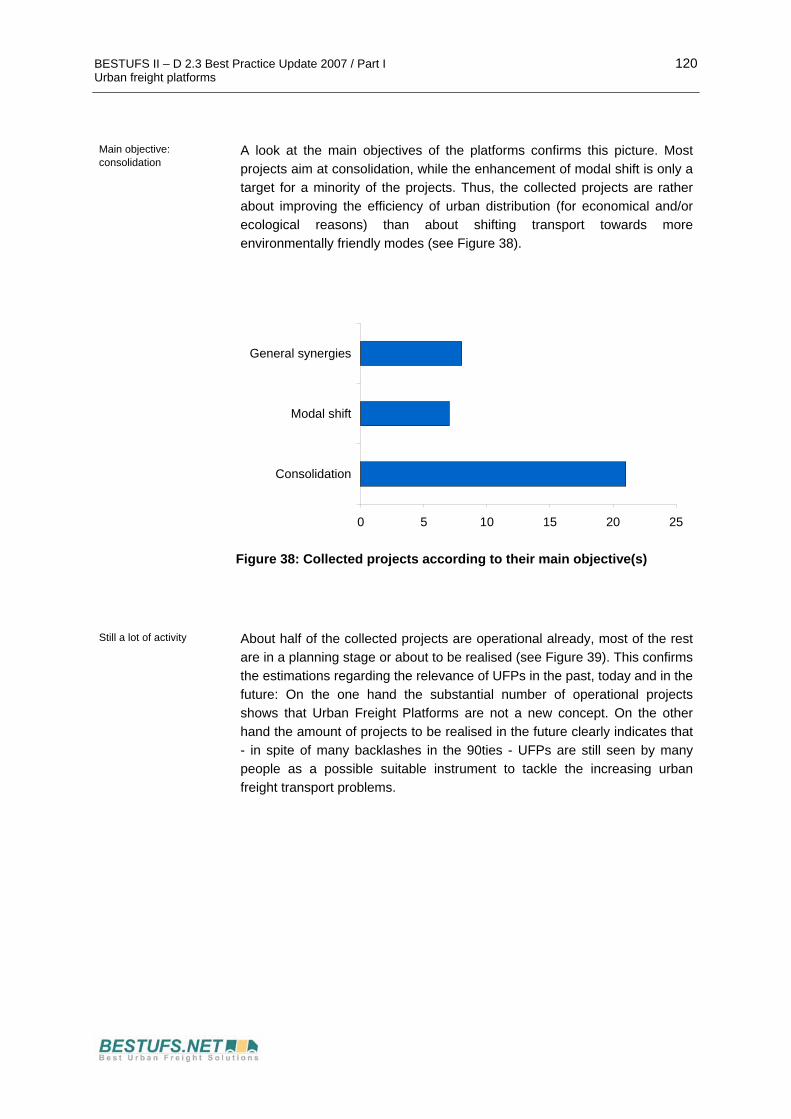
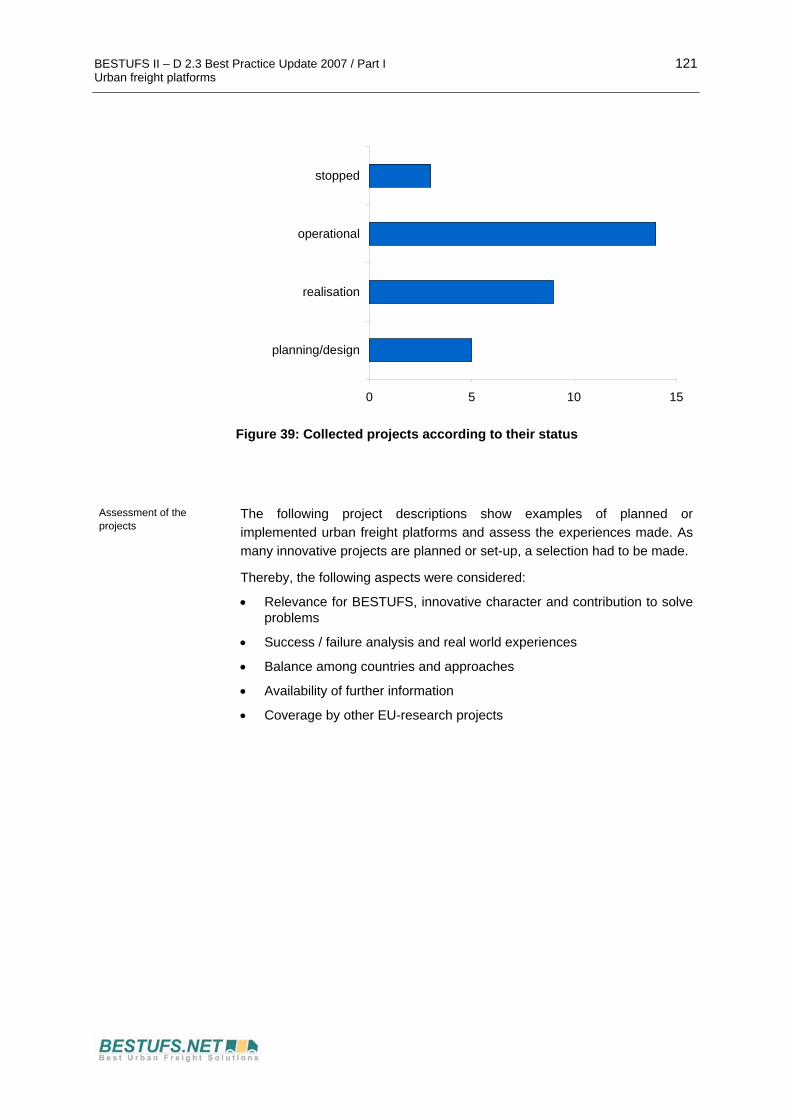
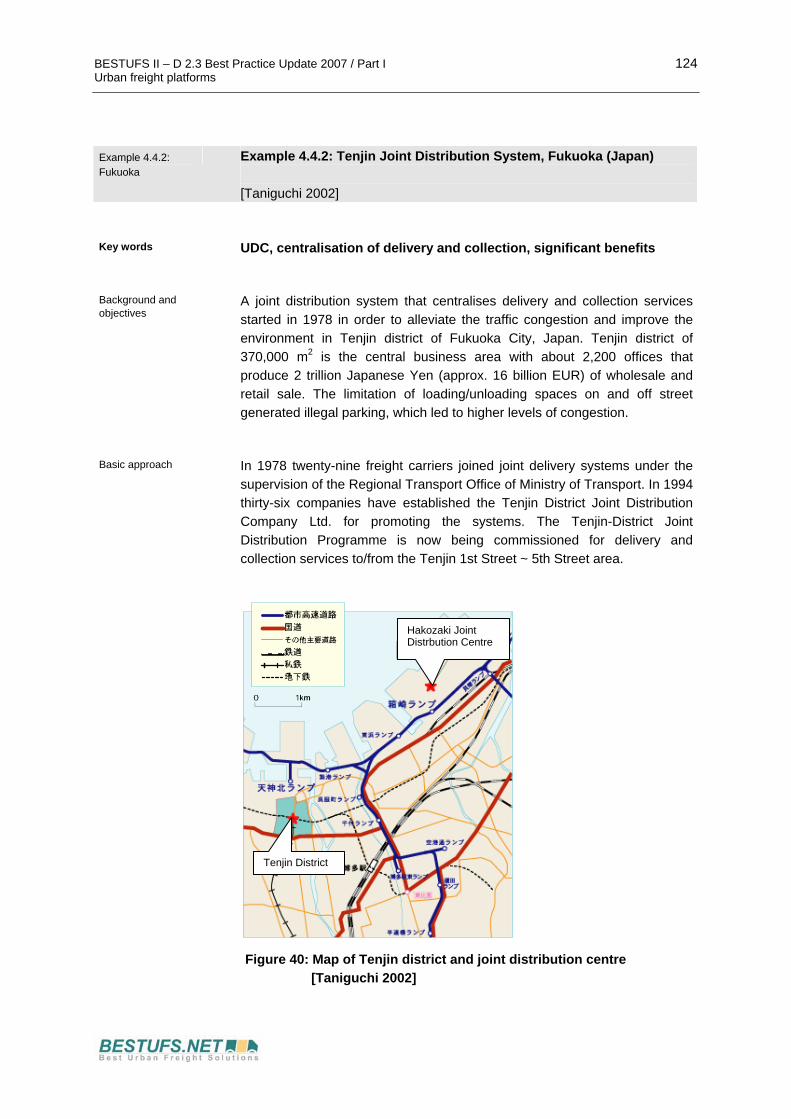
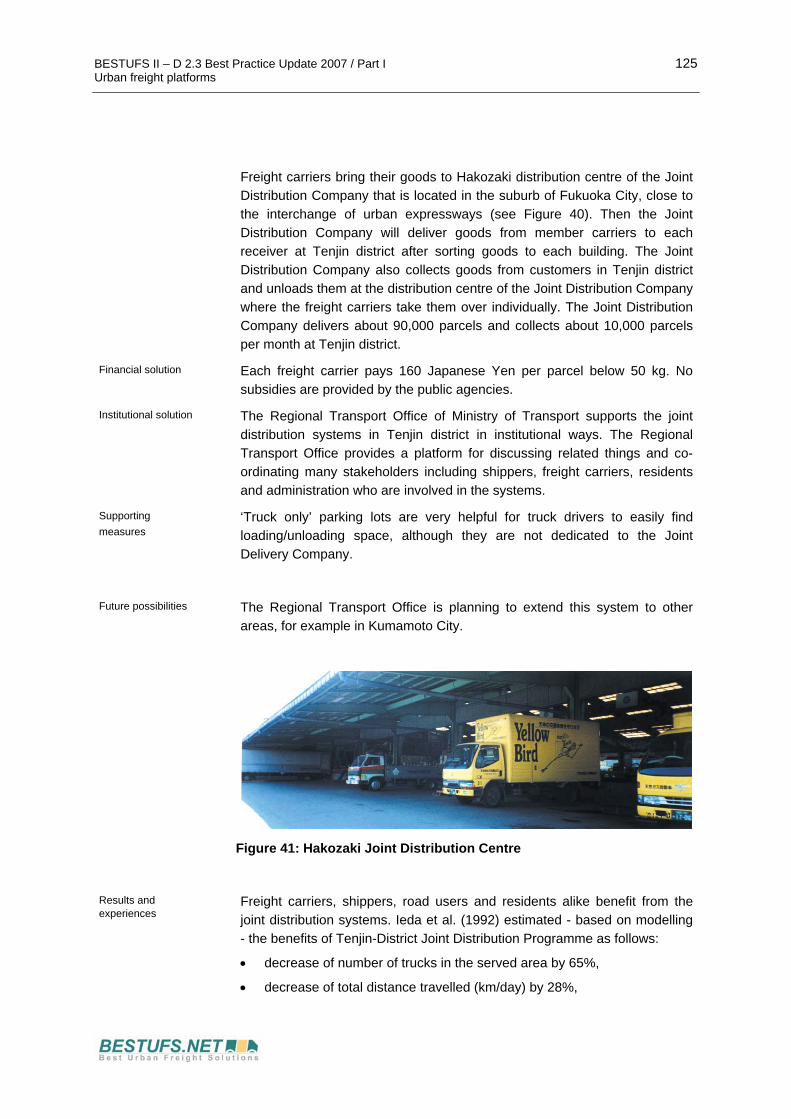
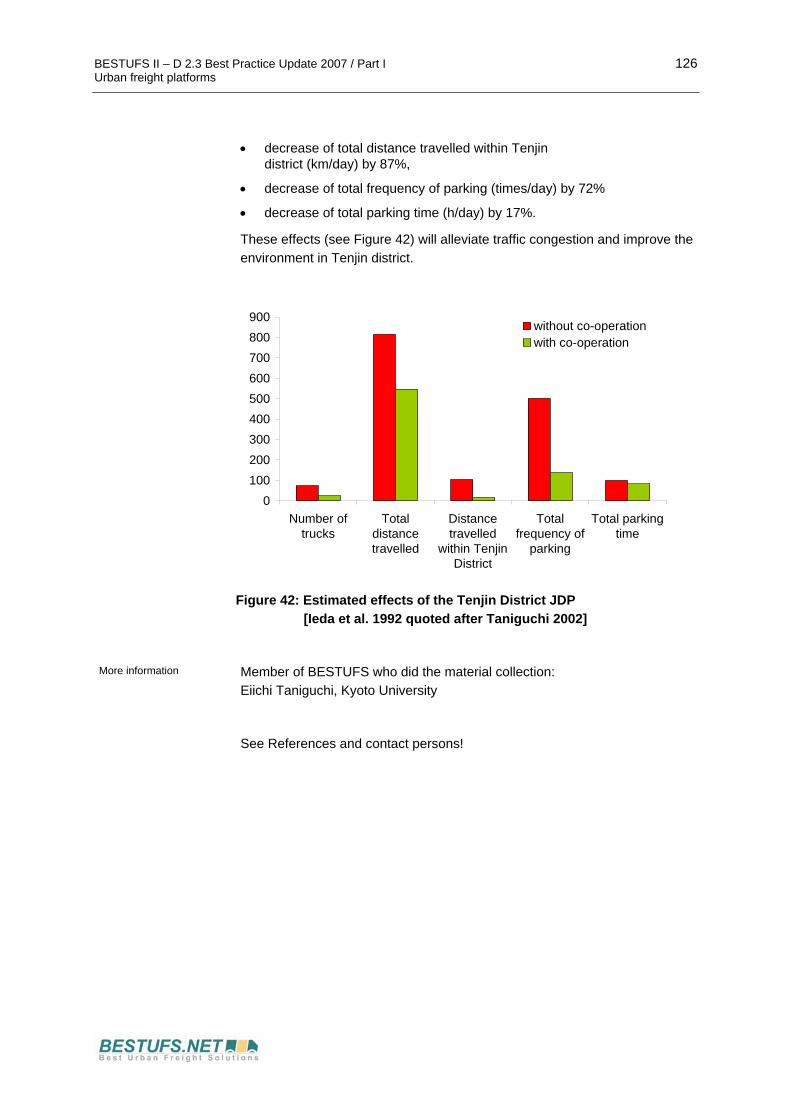
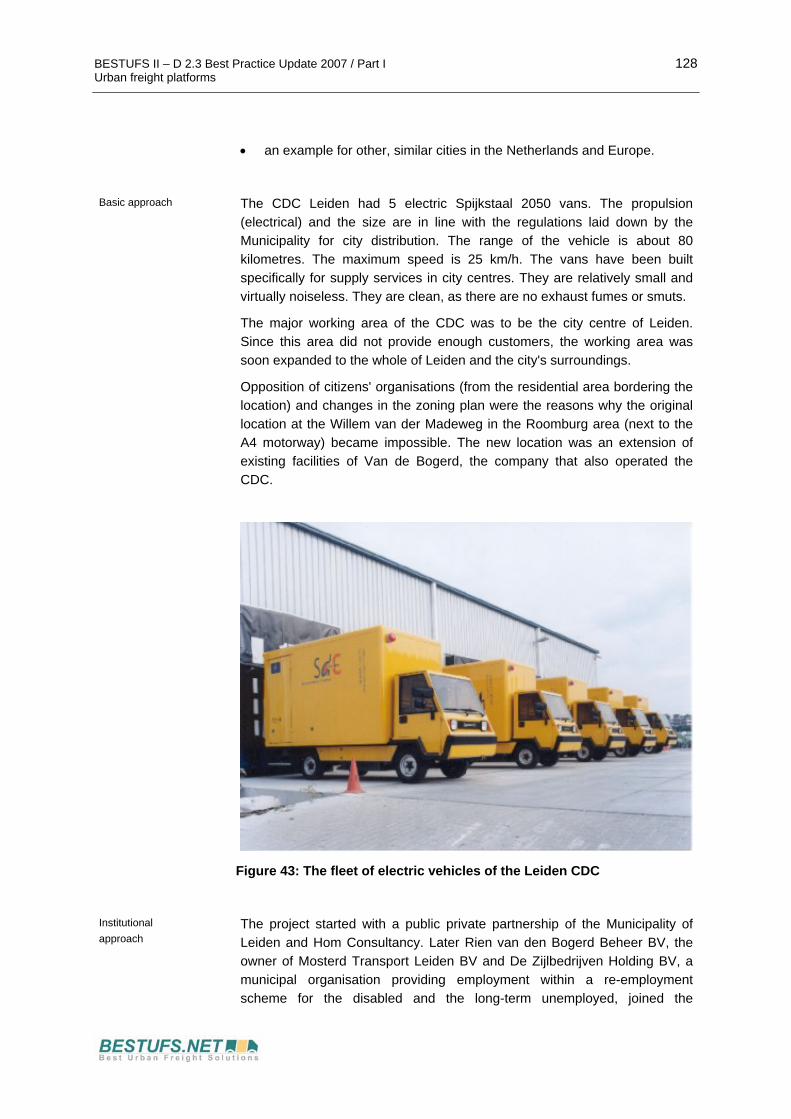
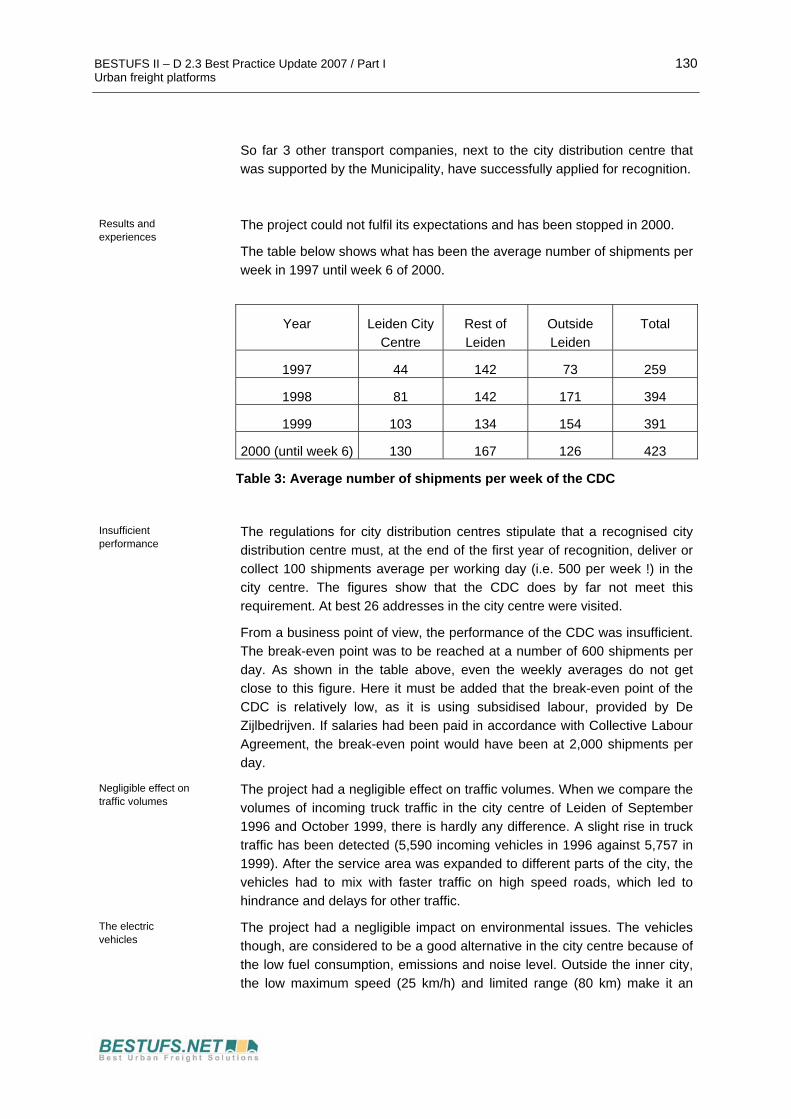
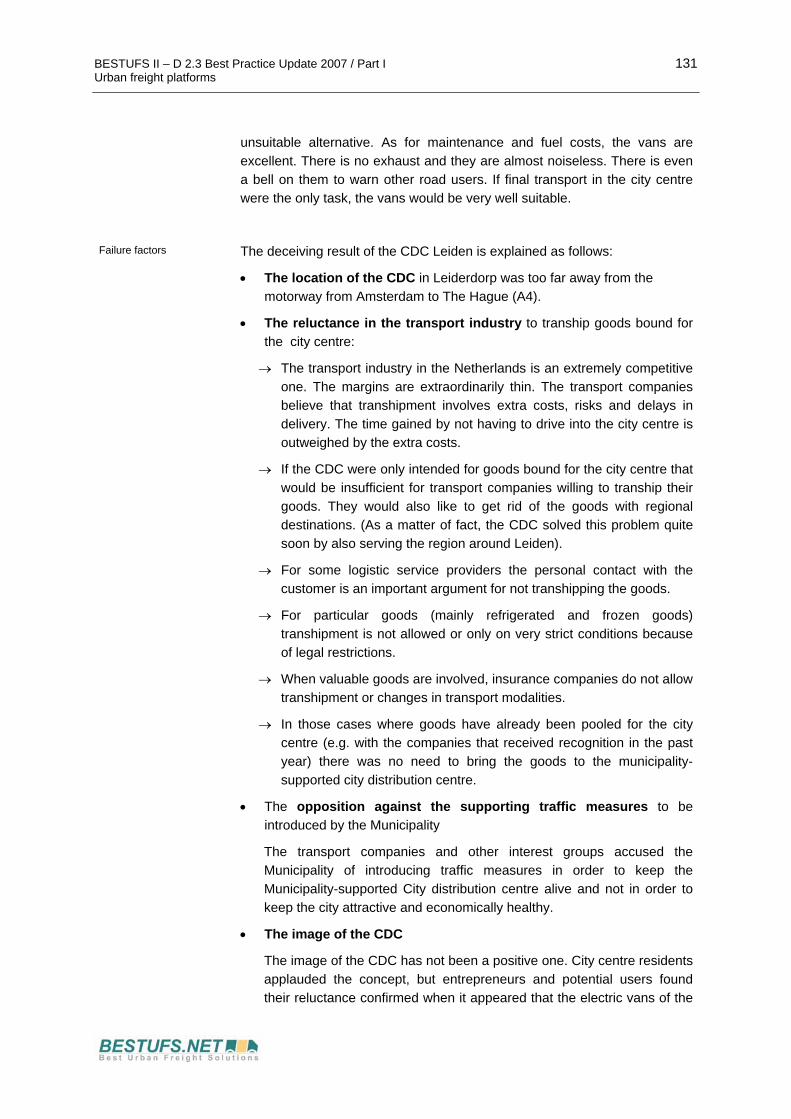
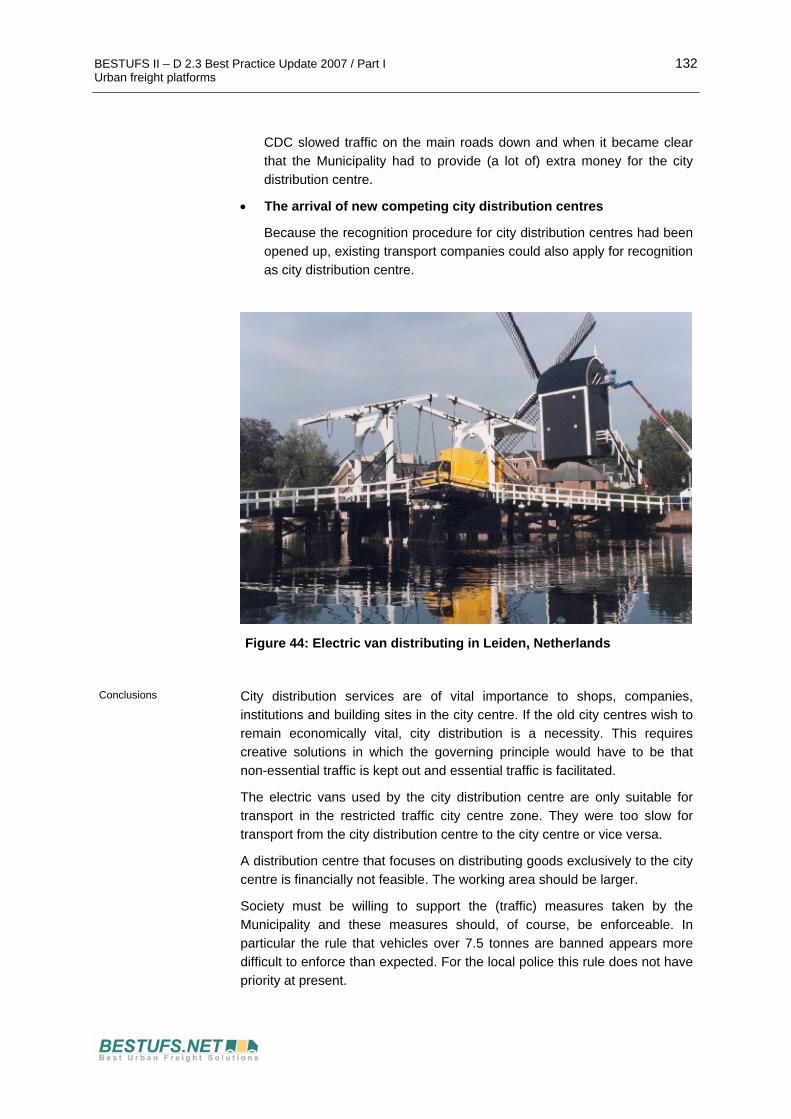
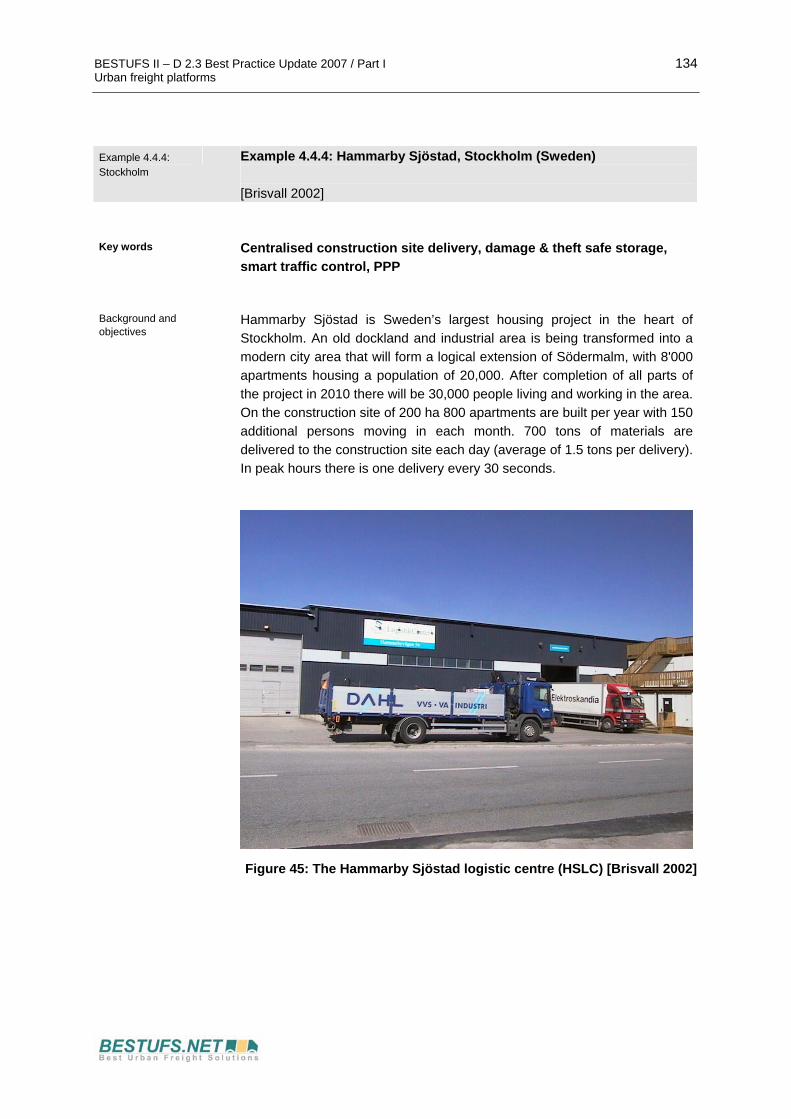
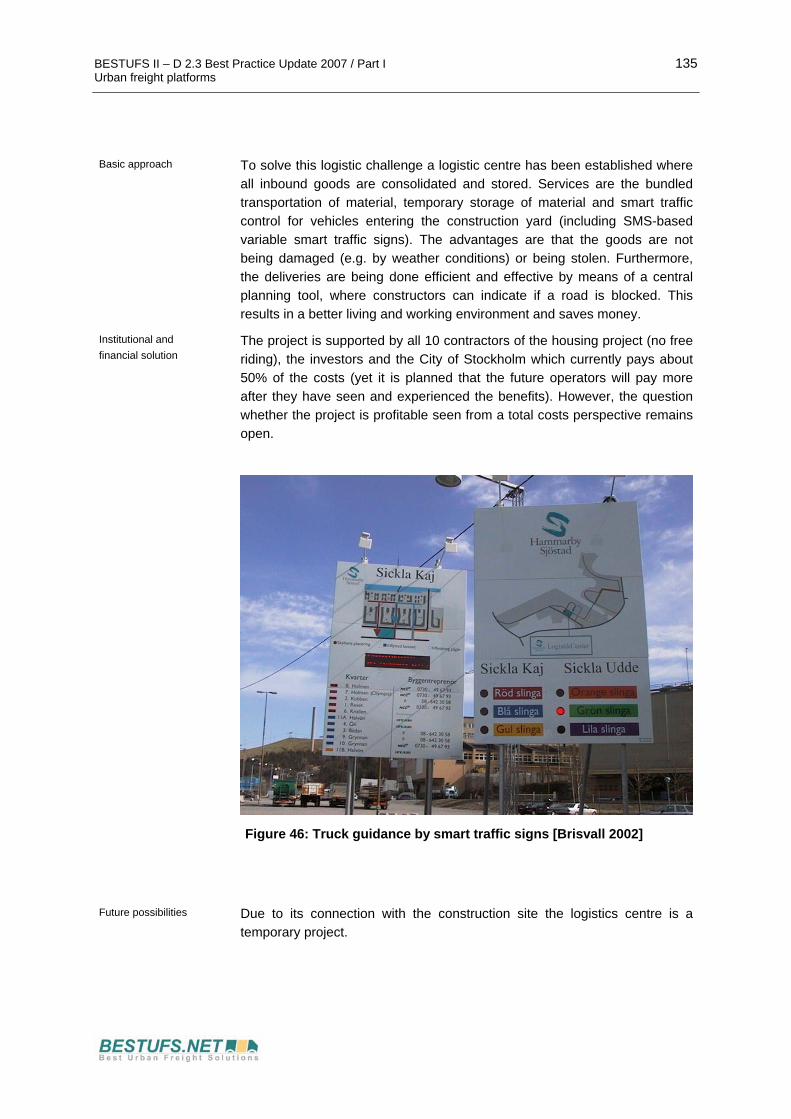
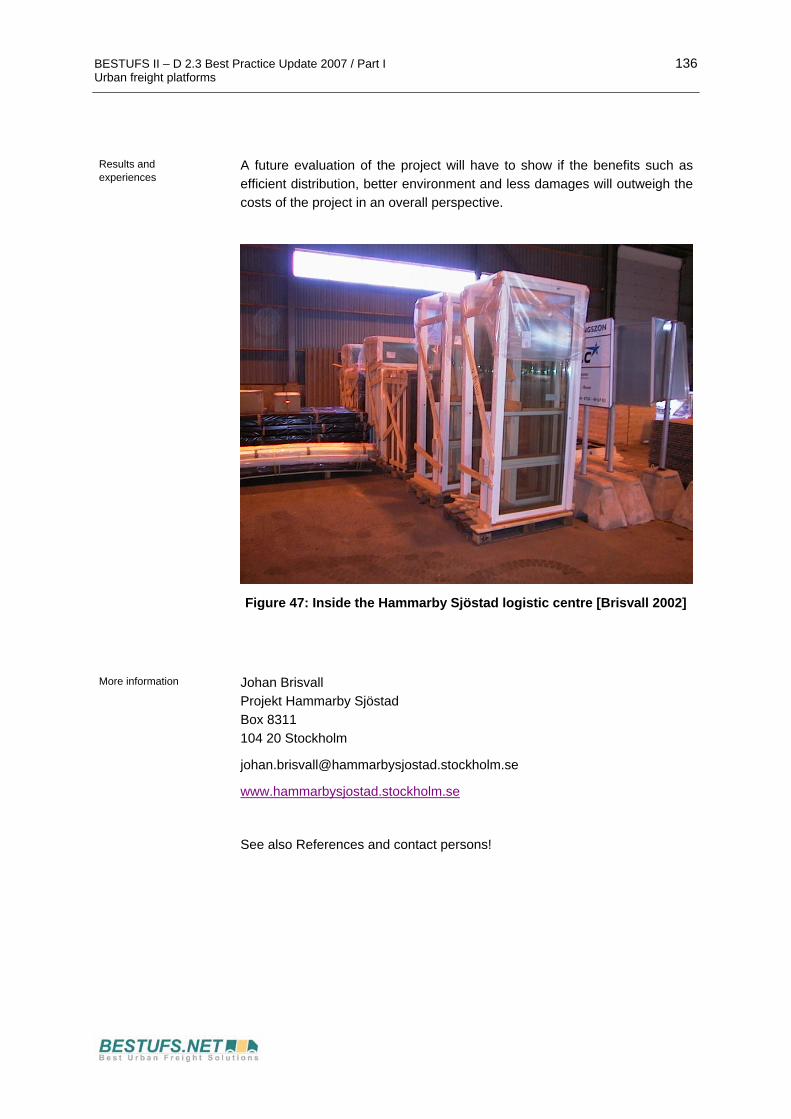
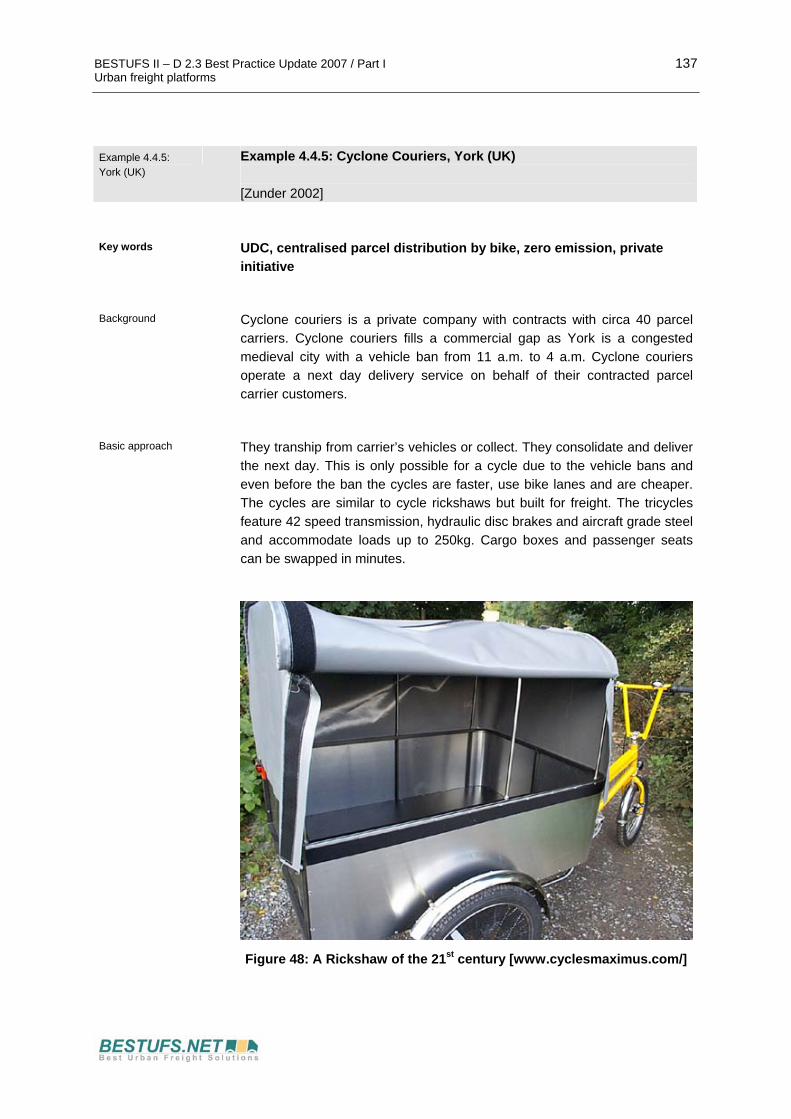
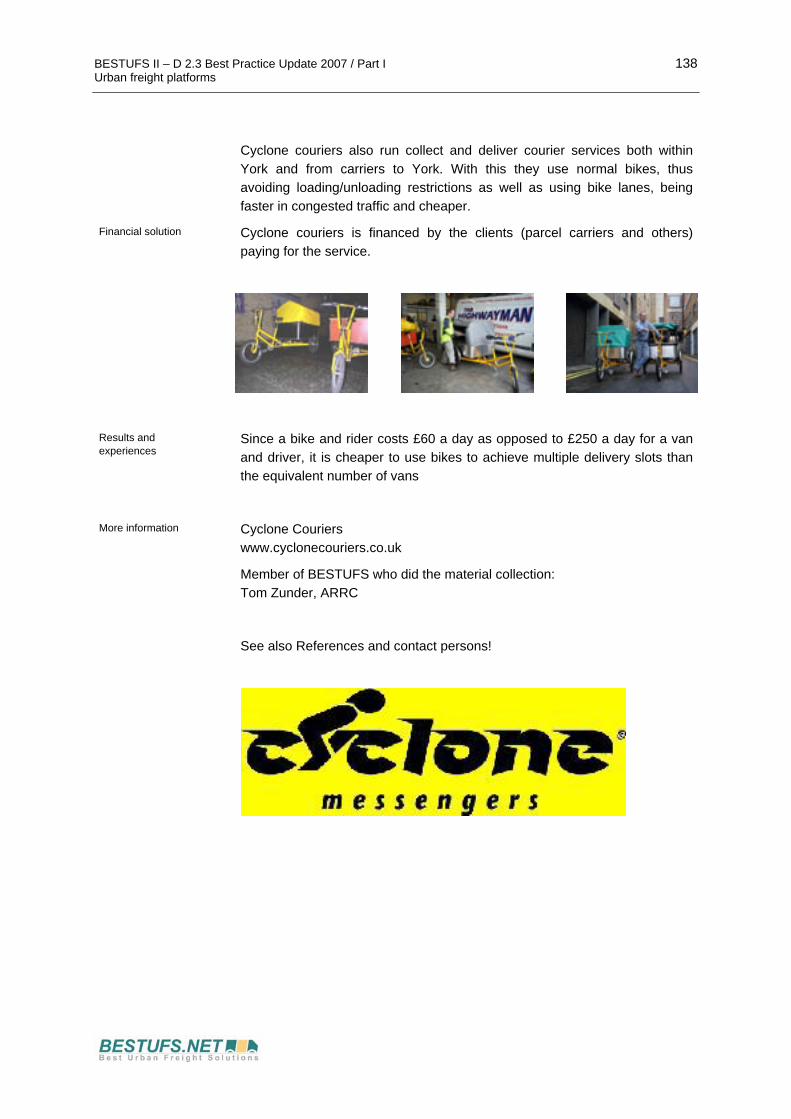
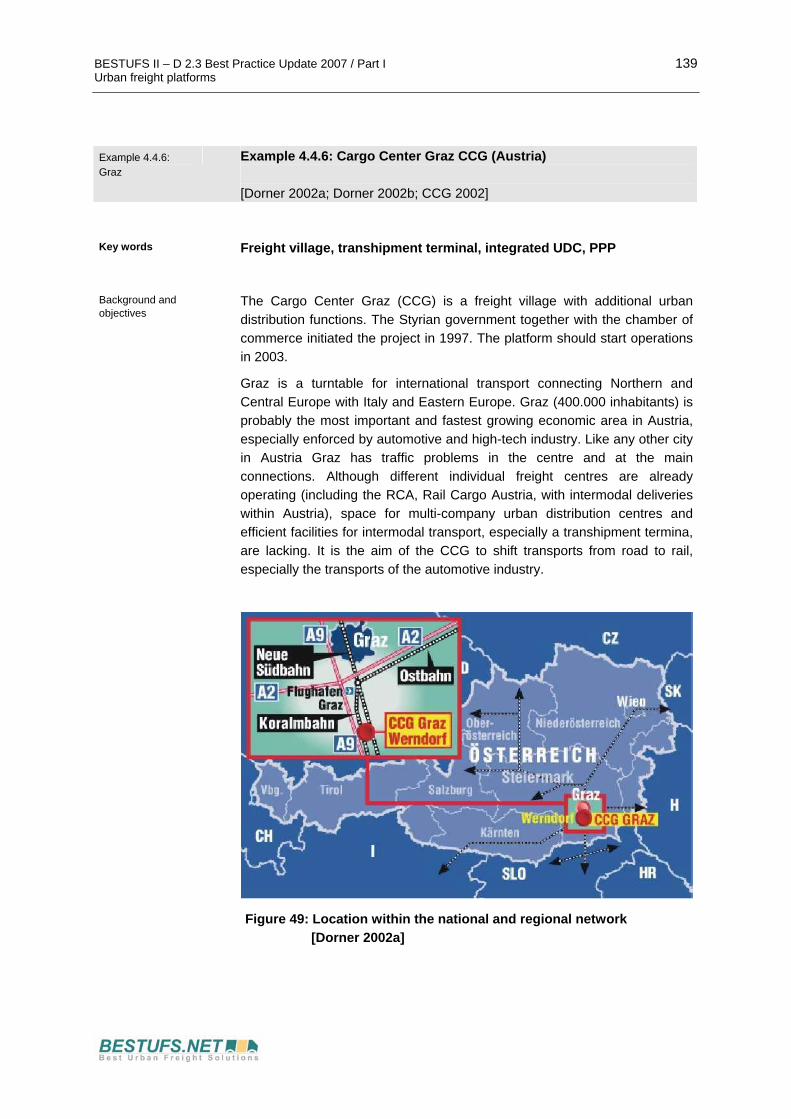
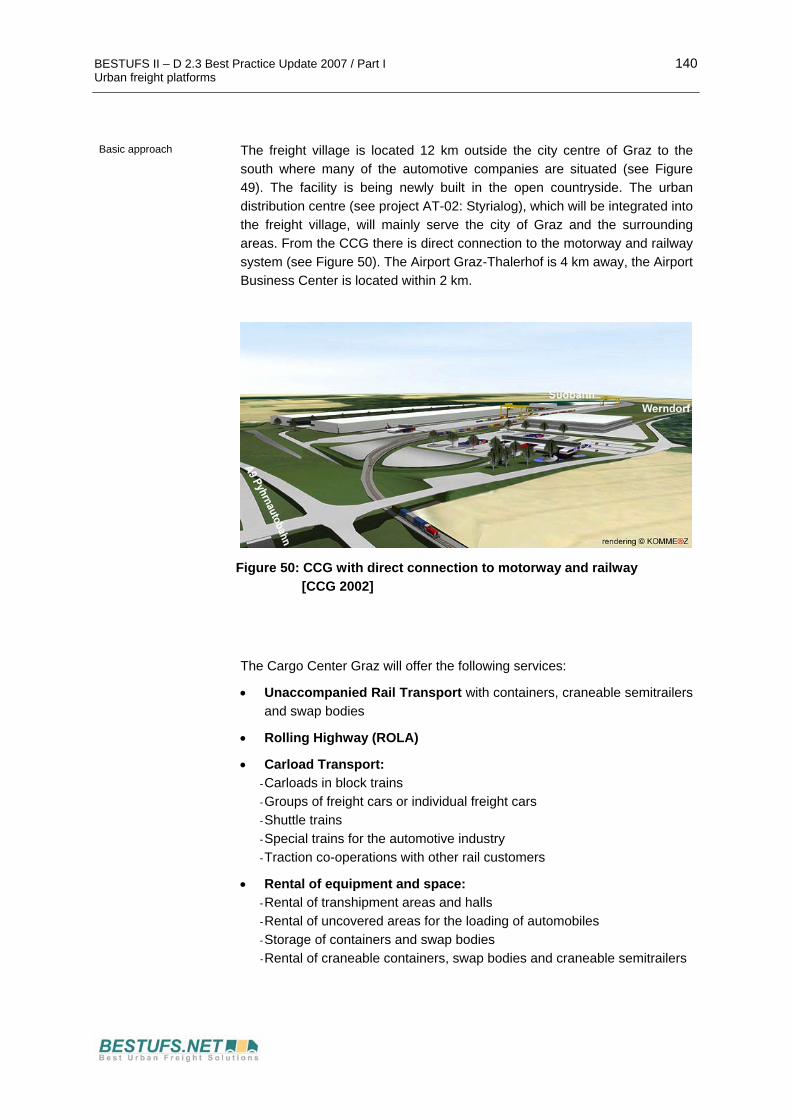
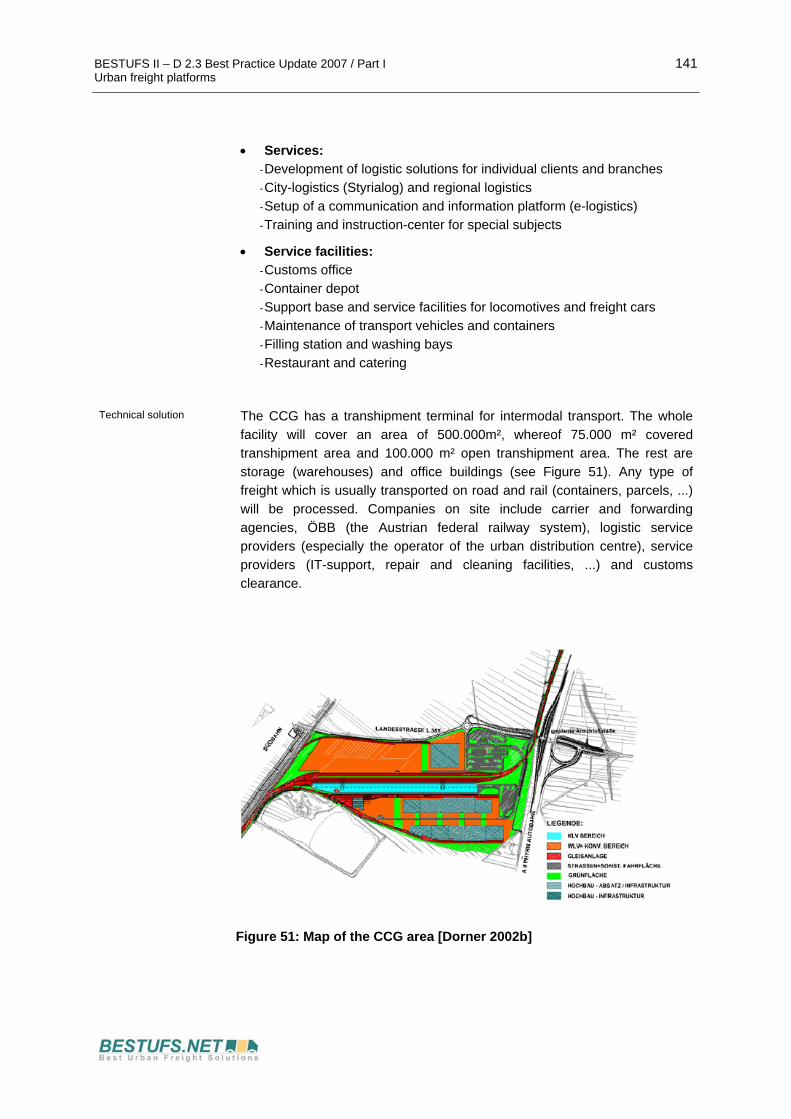
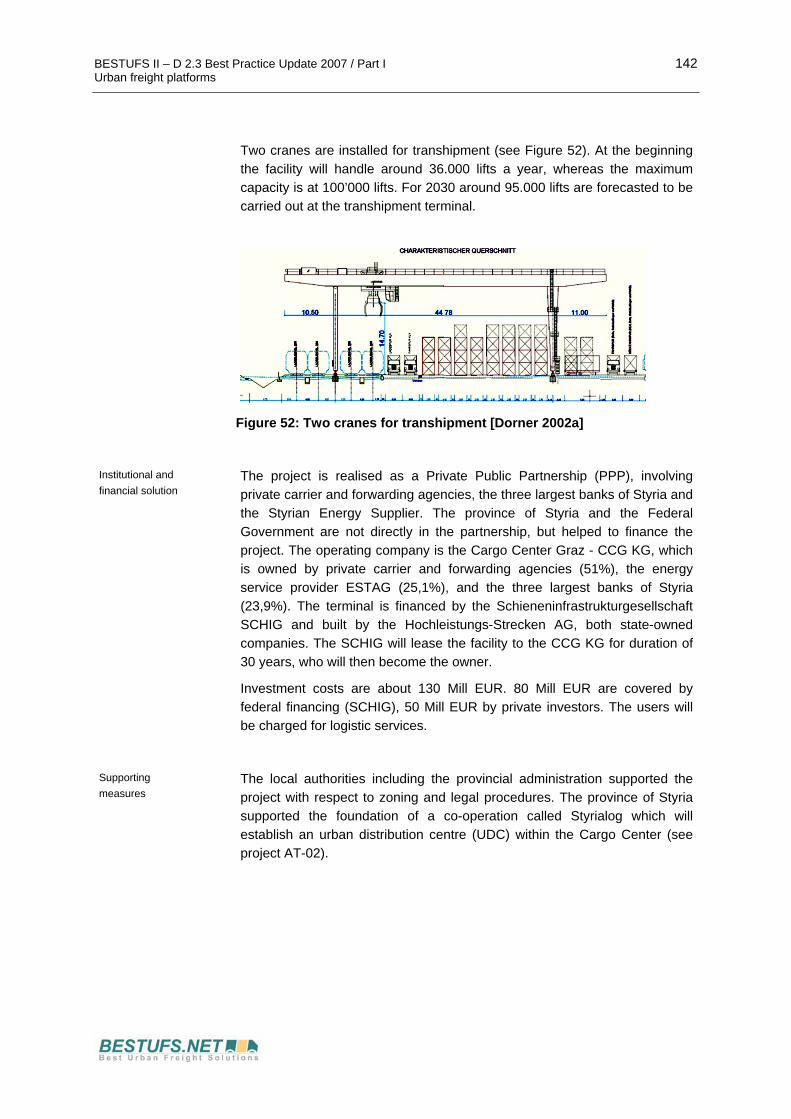
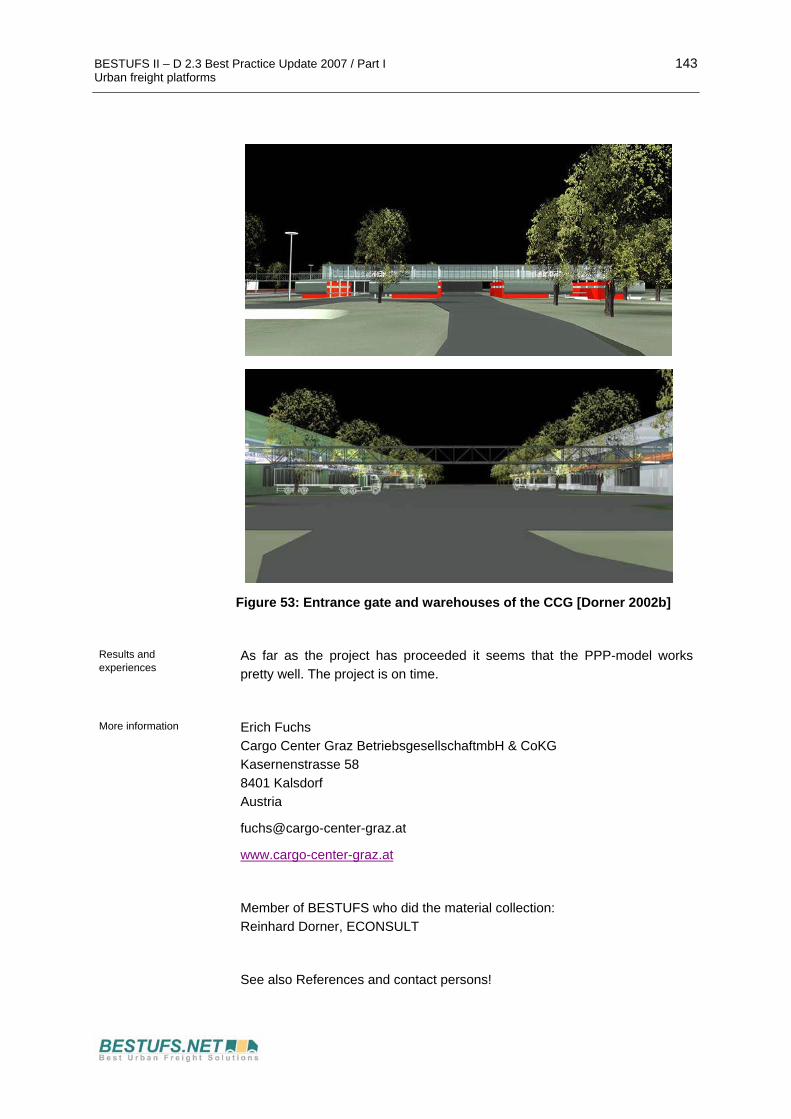
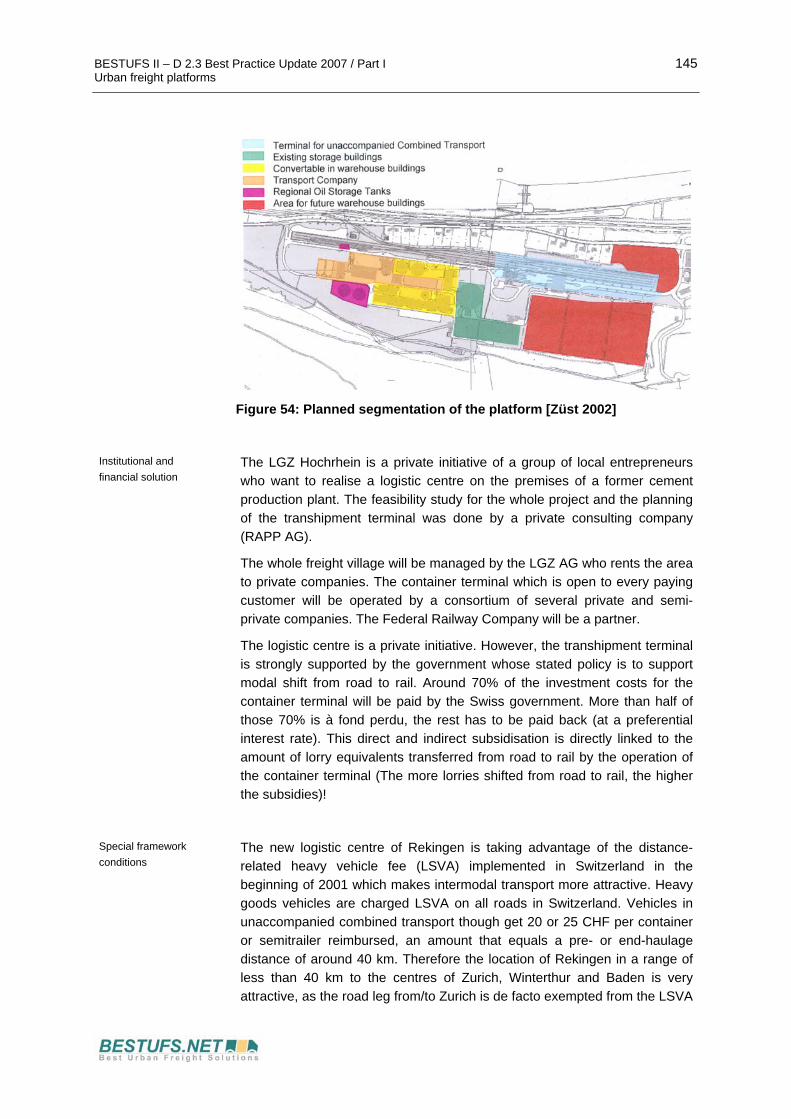
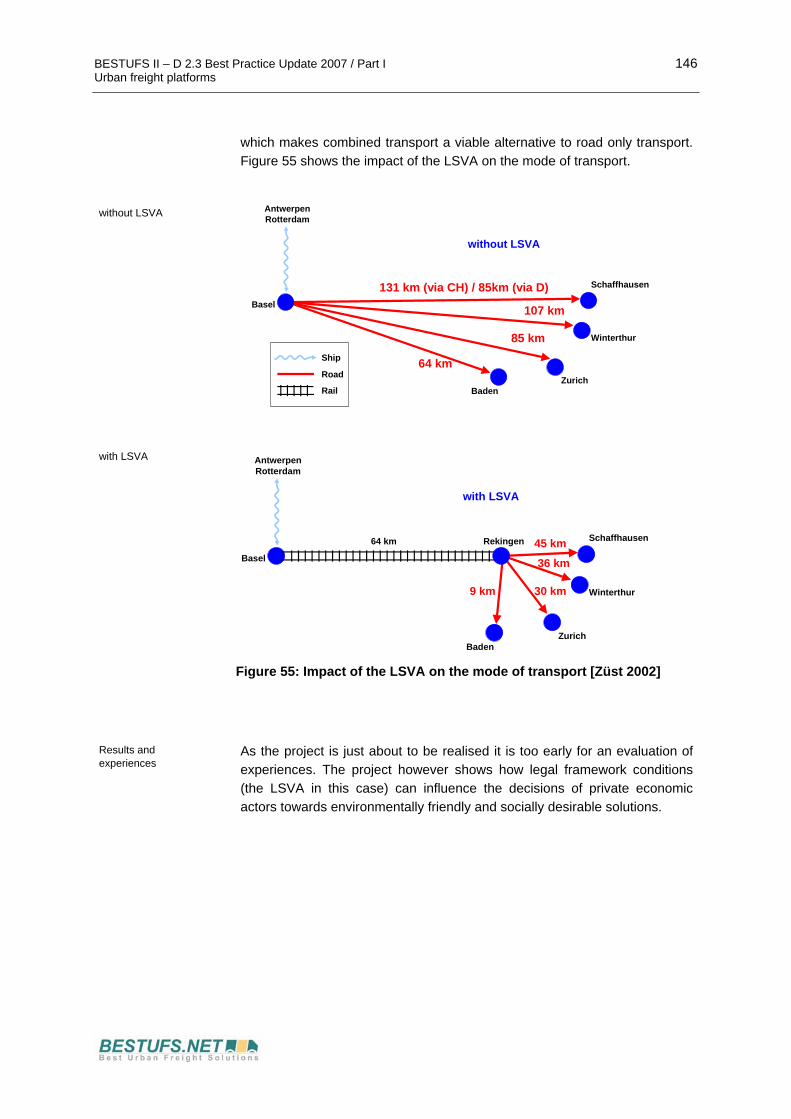
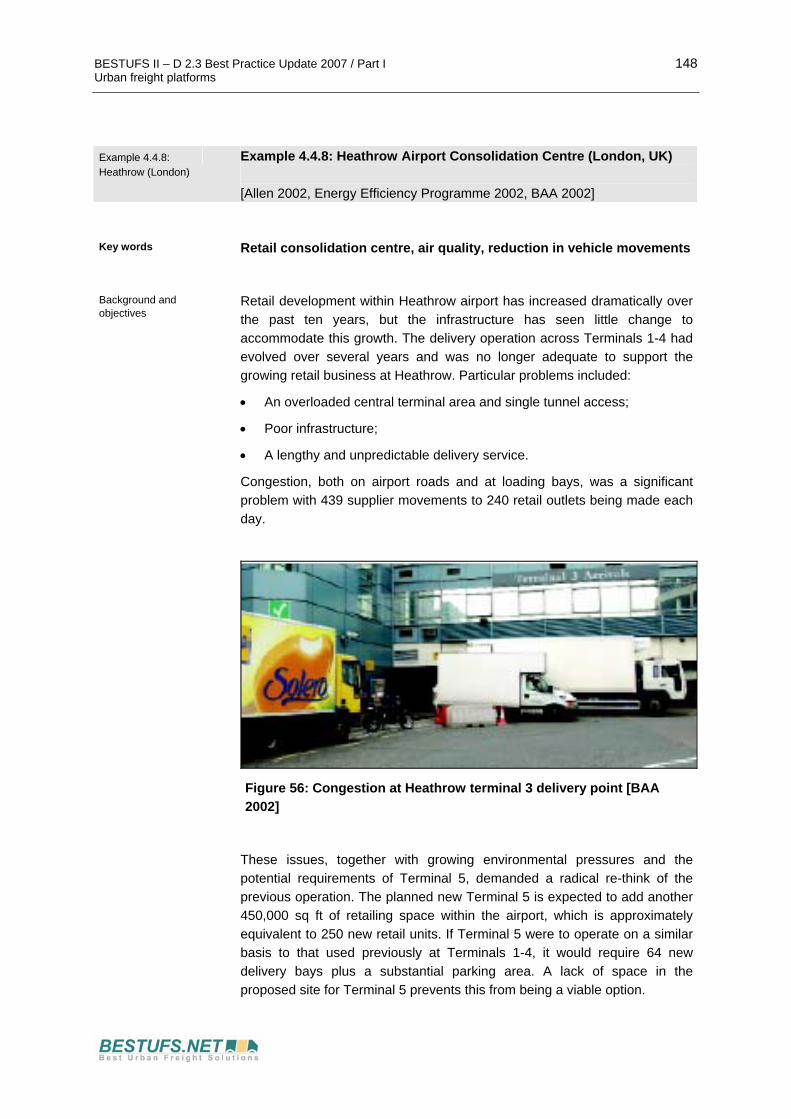
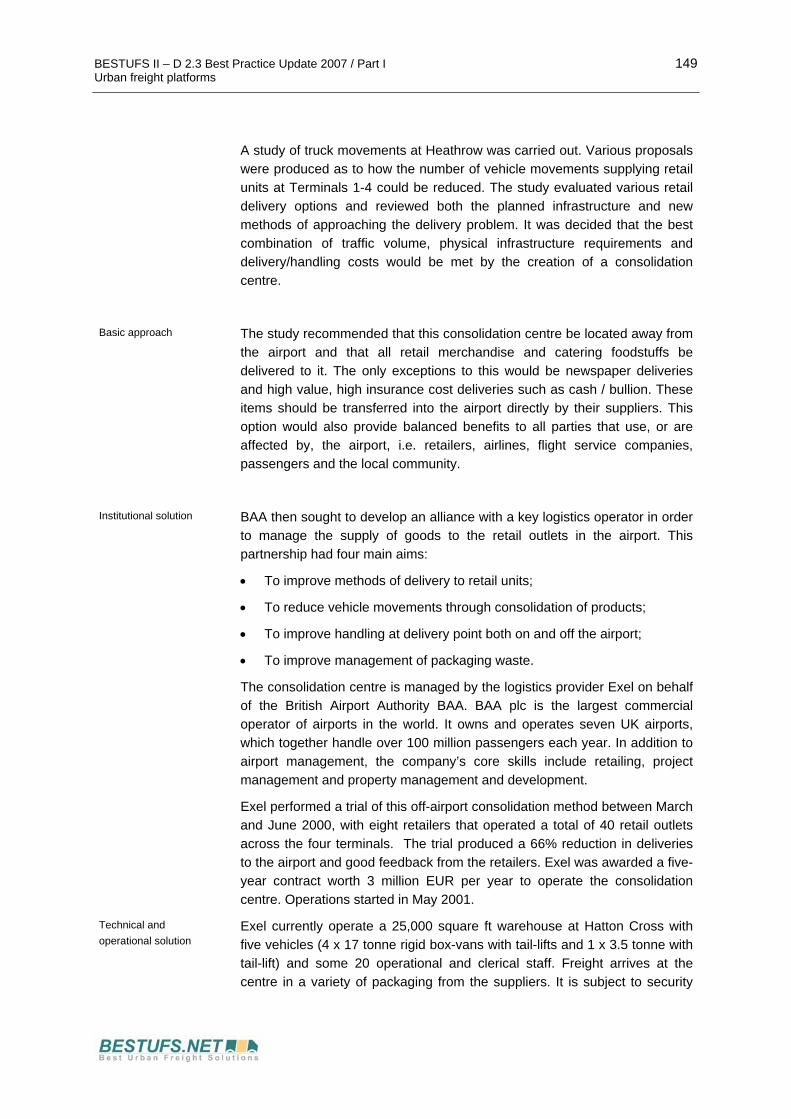
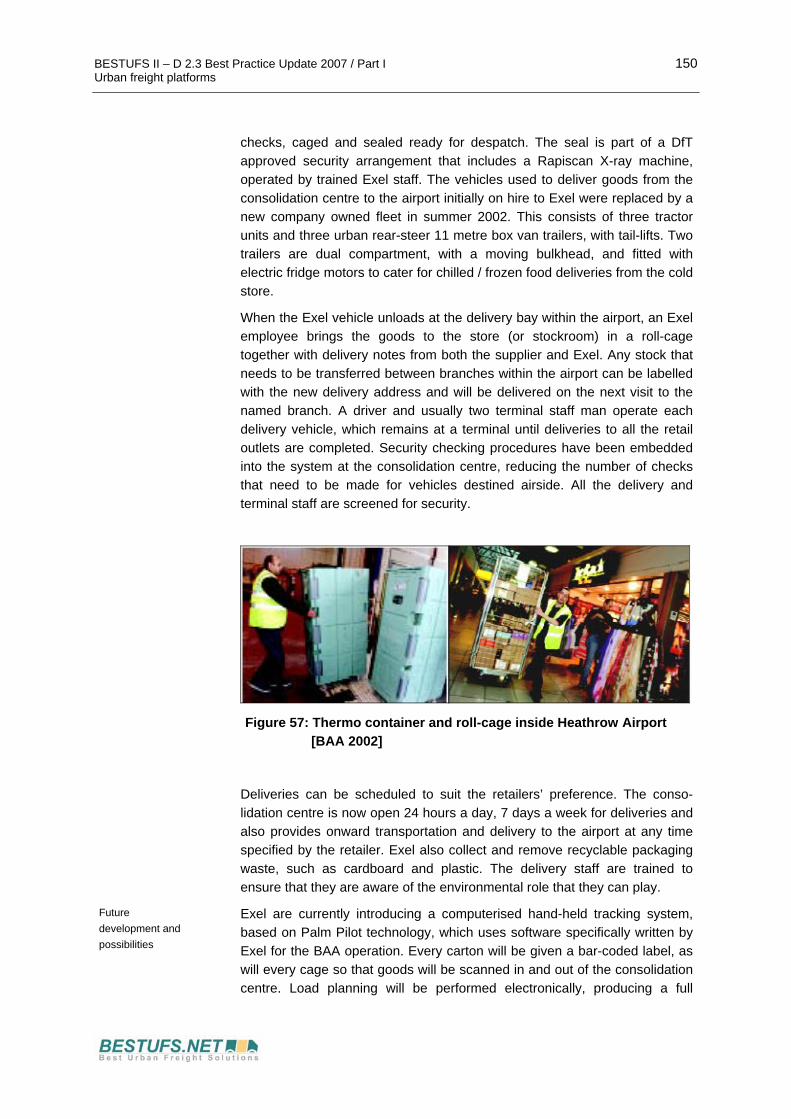
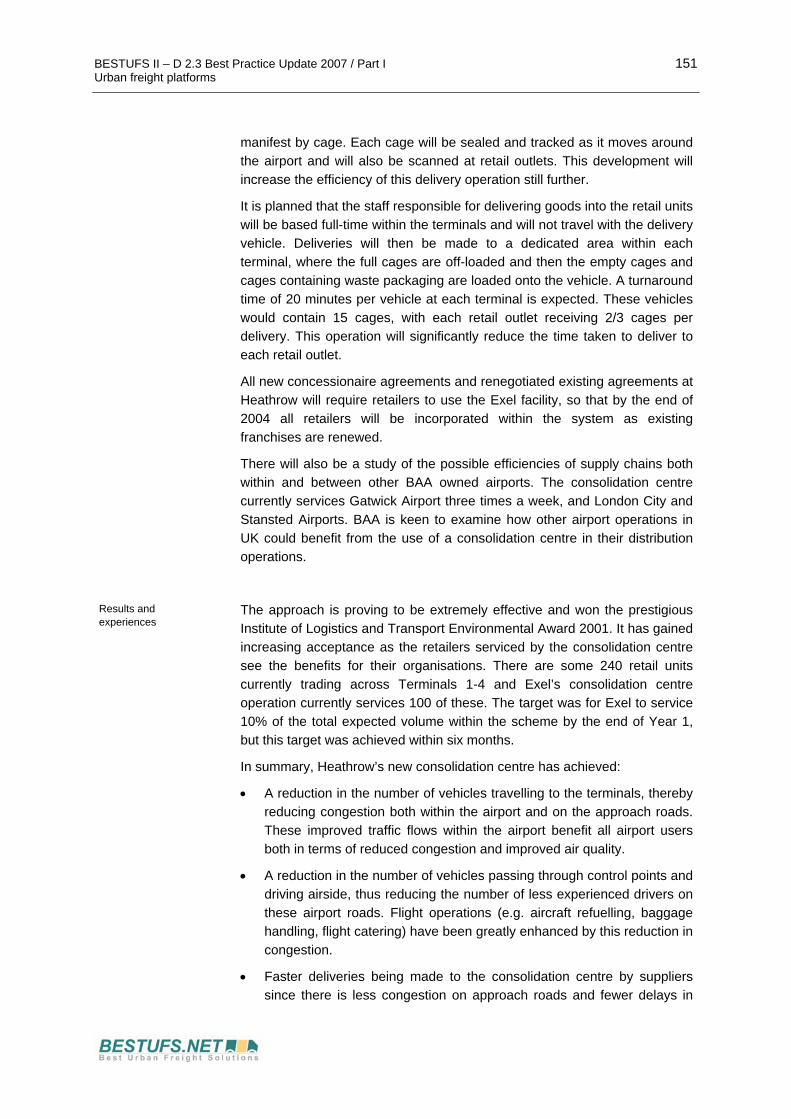
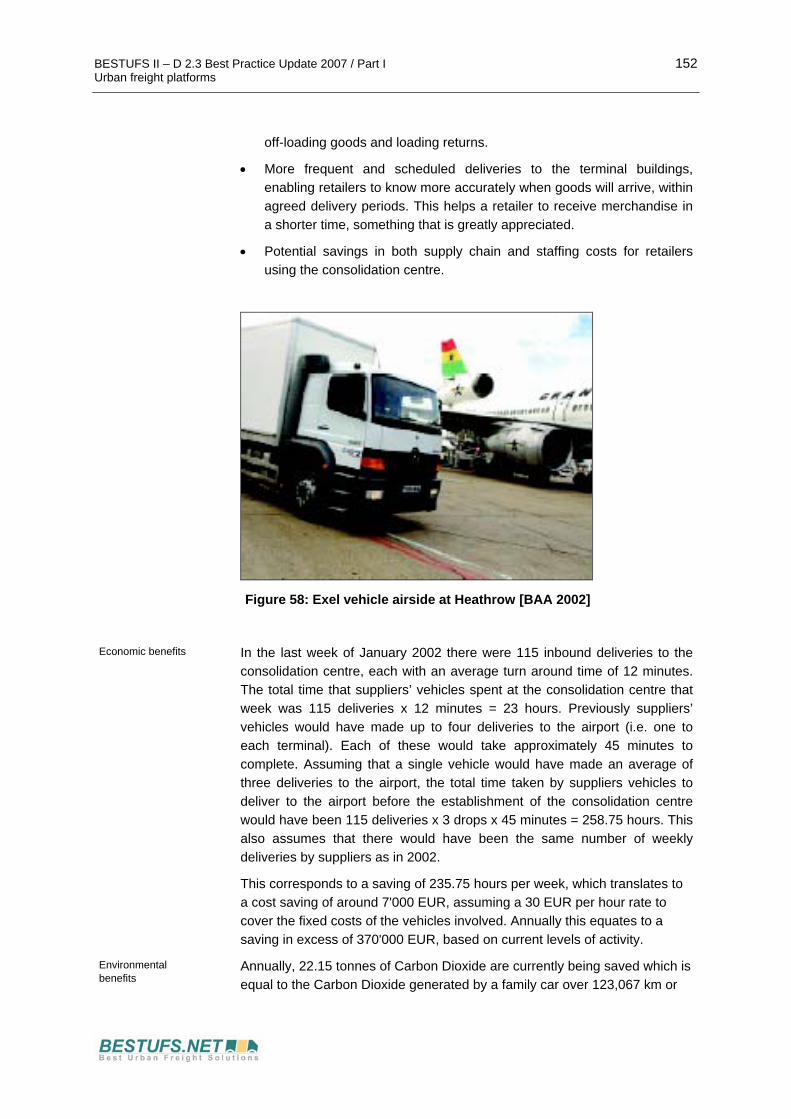
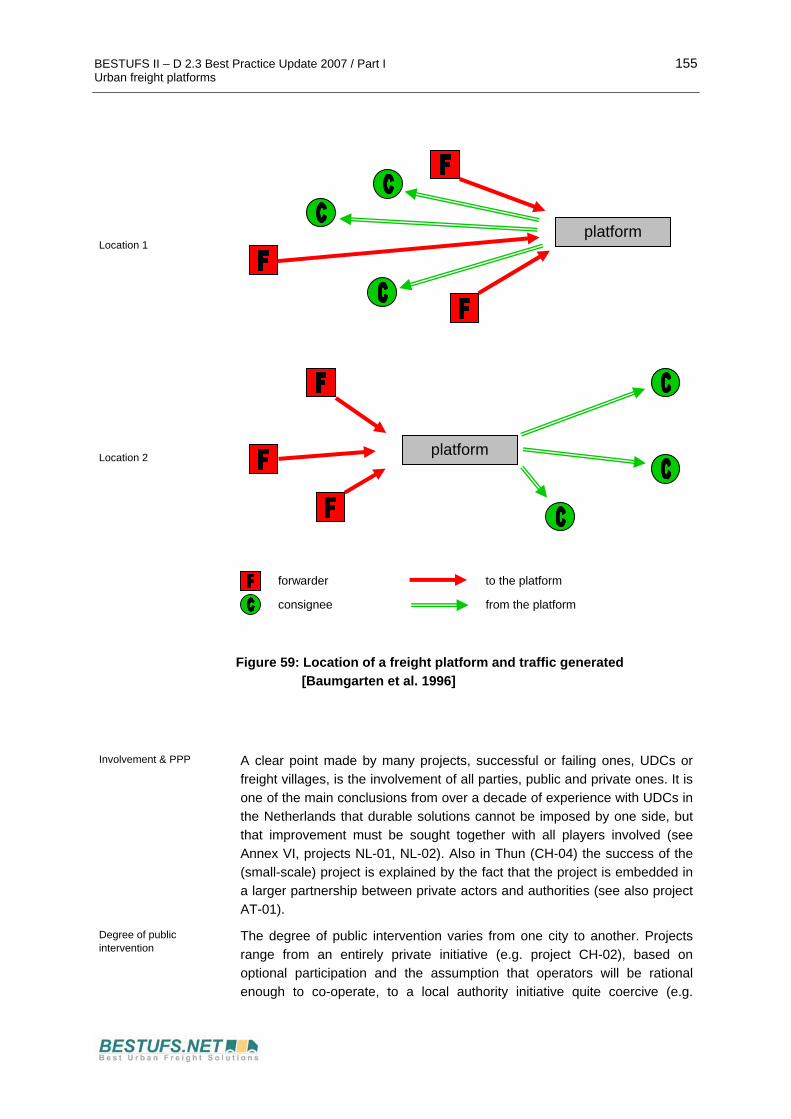
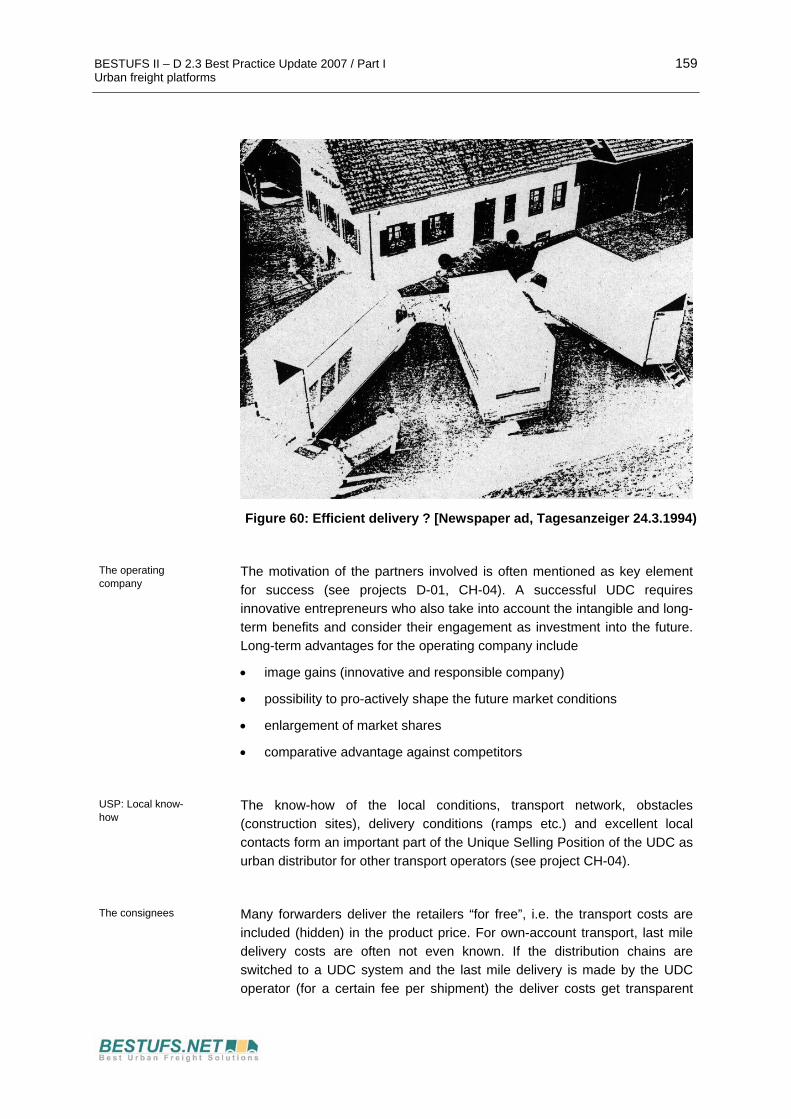
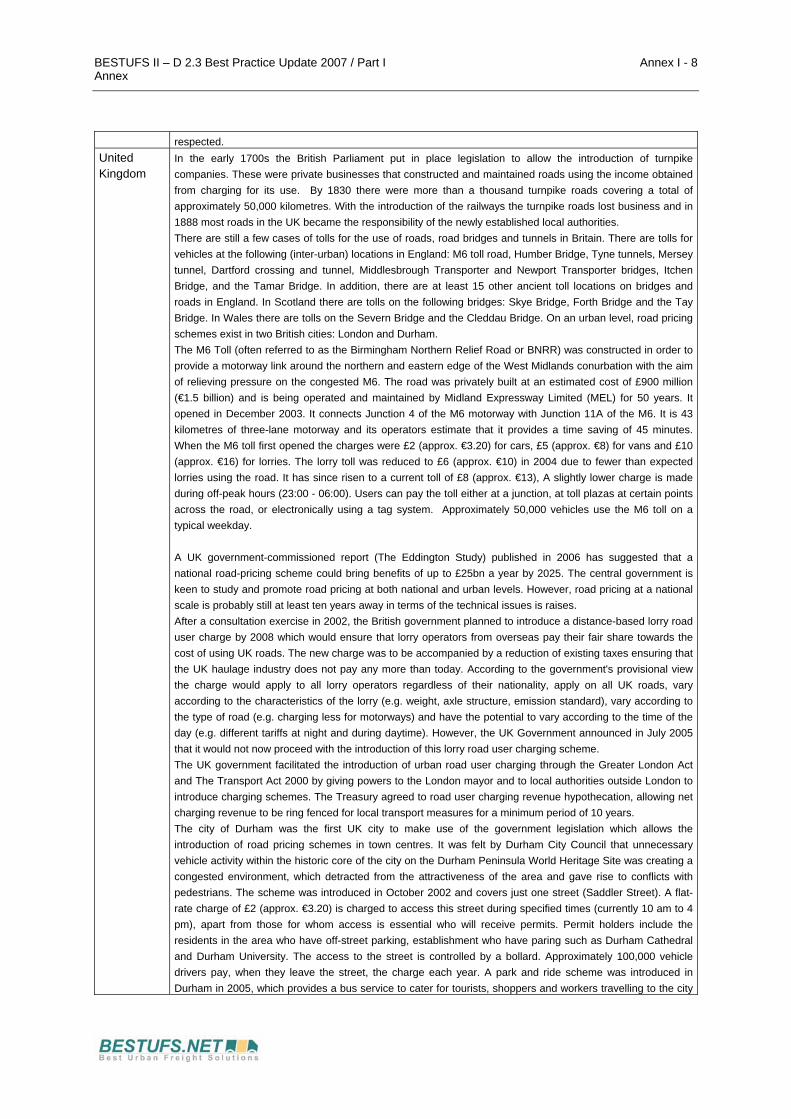
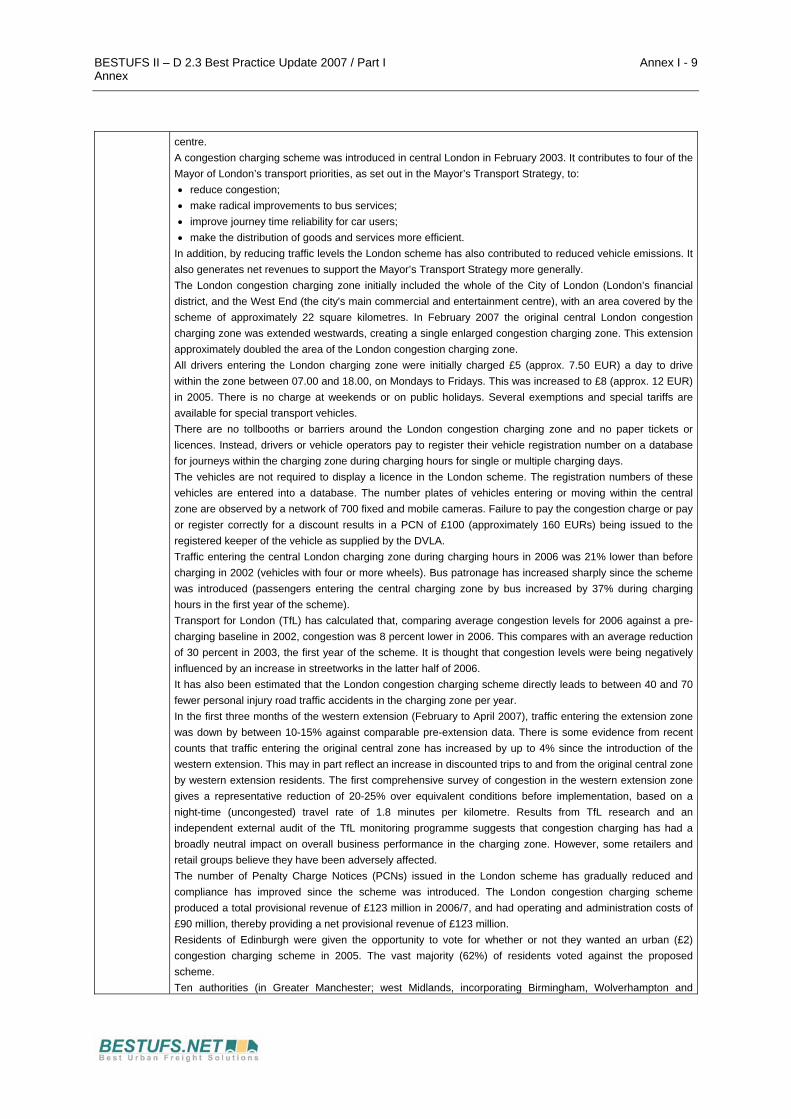
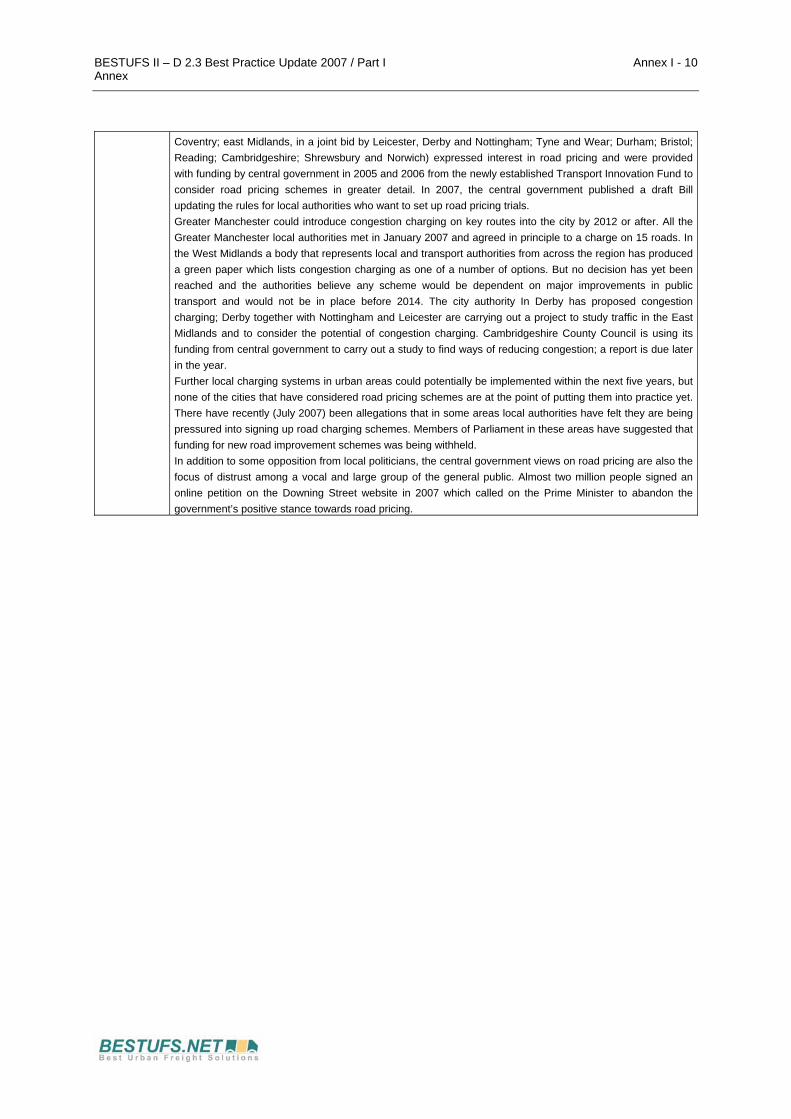
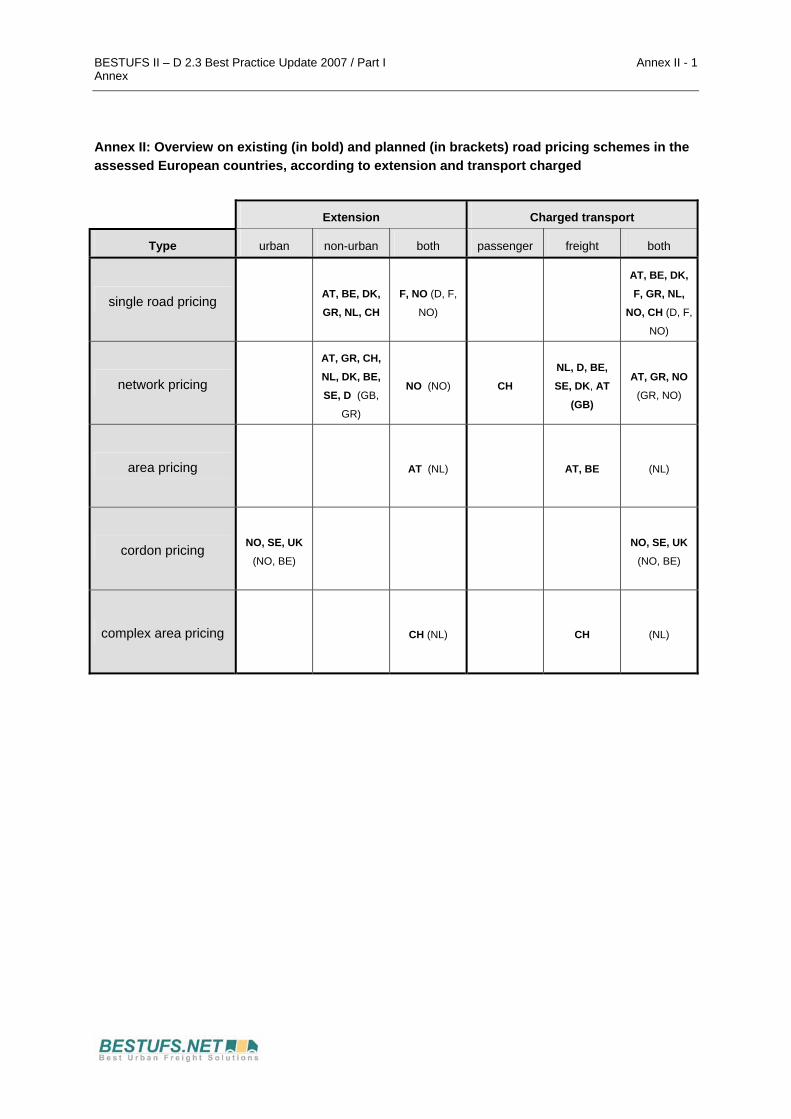

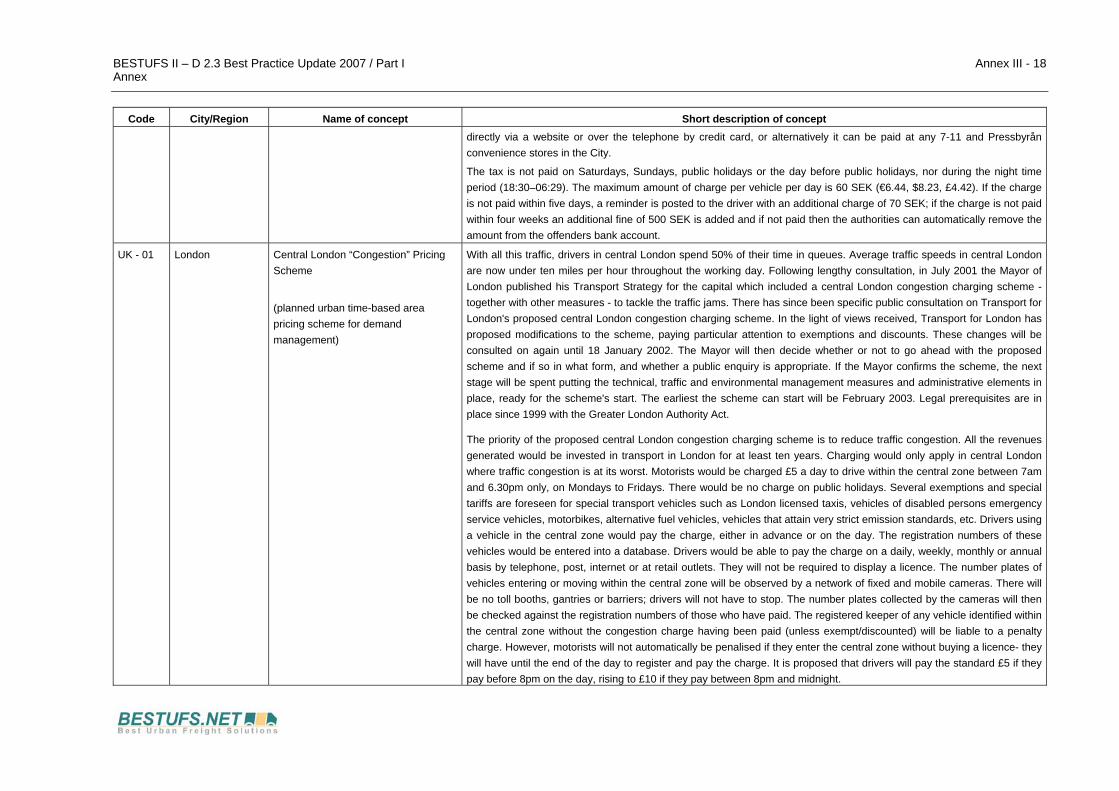
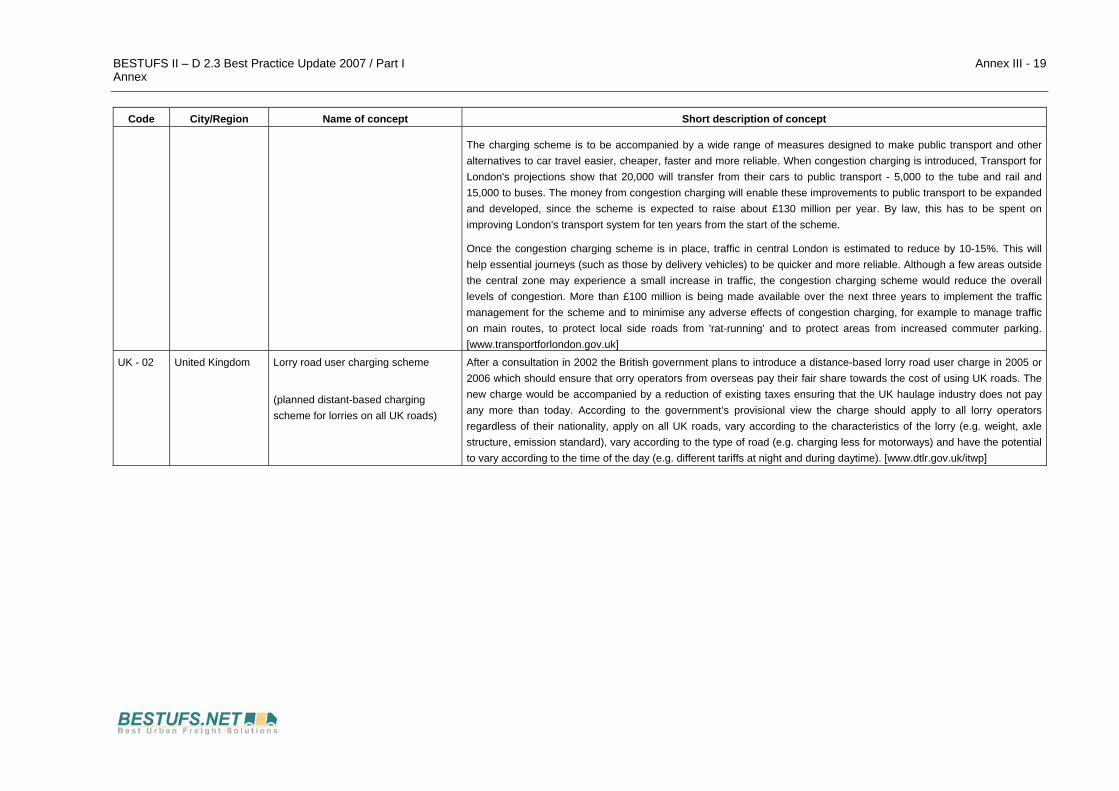
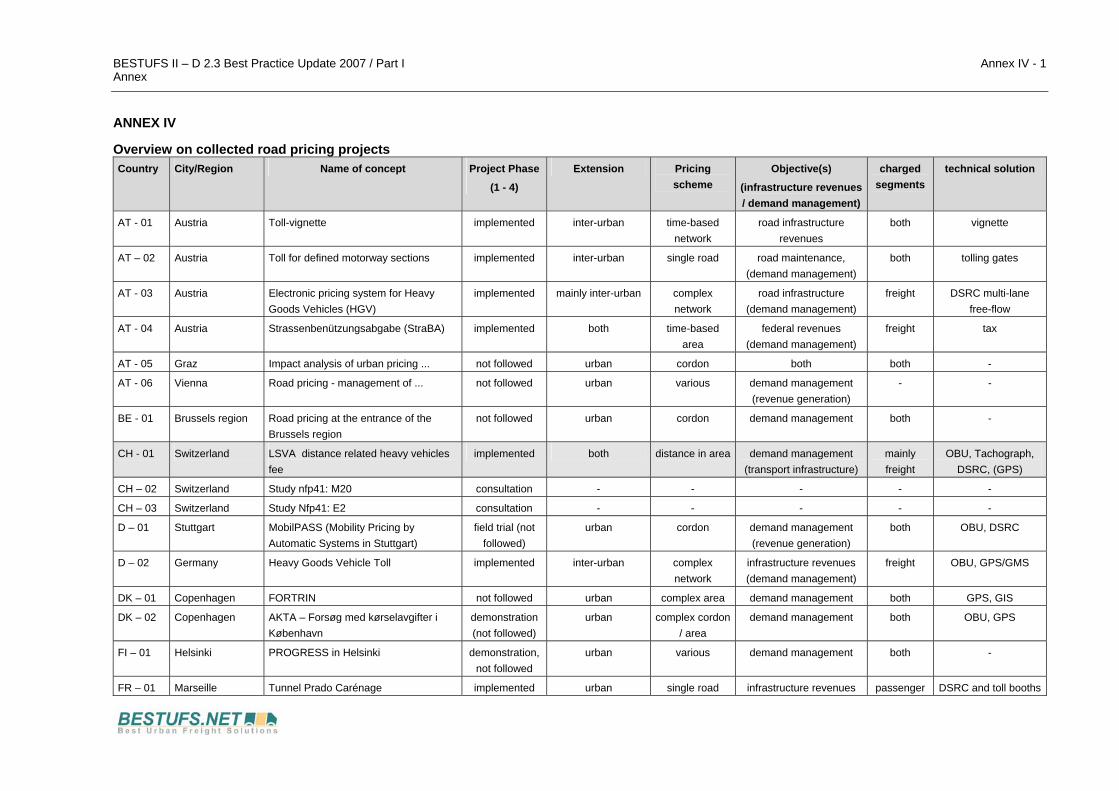
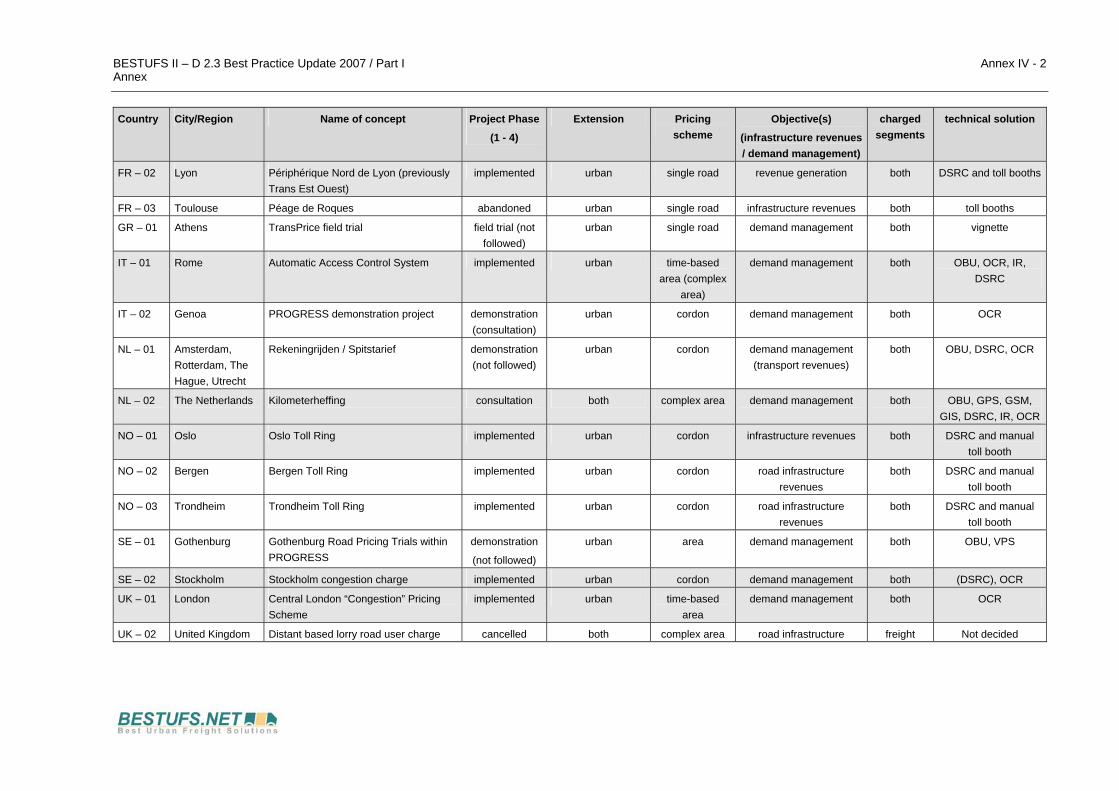


![Amigo Deliverable D4 - CORDIS€¦ · the Amigo Intelligent User Services (Amigo Deliverables D2.1 [3] and D2.3 [4]. Amigo deliverable D2.3 is an introduction to this document. The](https://static.documents.pub/doc/80x56/5f023ae57e708231d40338de/amigo-deliverable-d4-cordis-the-amigo-intelligent-user-services-amigo-deliverables.jpg)


