11 th Annual Demographia International Housing Affordability Survey: 2015 Ratings for Metropolitan Markets Australia Canada China (Hong Kong)Ireland Japan New Zealand Singapore United Kingdom United States With comparisons to External Indexes for China and Korea Introduction by Dr. Shlomo Angel Urban Expansion Project Stern School of Business, New York University Data for 3 rd Quarter 2014
Transcript
11th Annual
Demographia International
Housing Affordability
Survey: 2015 Ratings for Metropolitan Markets
Australia Canada China (Hong Kong) Ireland
Japan New Zealand Singapore
United Kingdom United States
With comparisons to External Indexes for
China and Korea
Introduction by
Dr. Shlomo Angel Urban Expansion Project
Stern School of Business, New York University
Data for 3rd Quarter 2014
11th Annual Demographia International Housing Affordability Survey (2014: 4th Quarter)
11th Annual Demographia International Housing Affordability Survey
THE NYU URBAN EXPANSION PROGRAM: AN INTRODUCTION Dr. Shlomo Angel
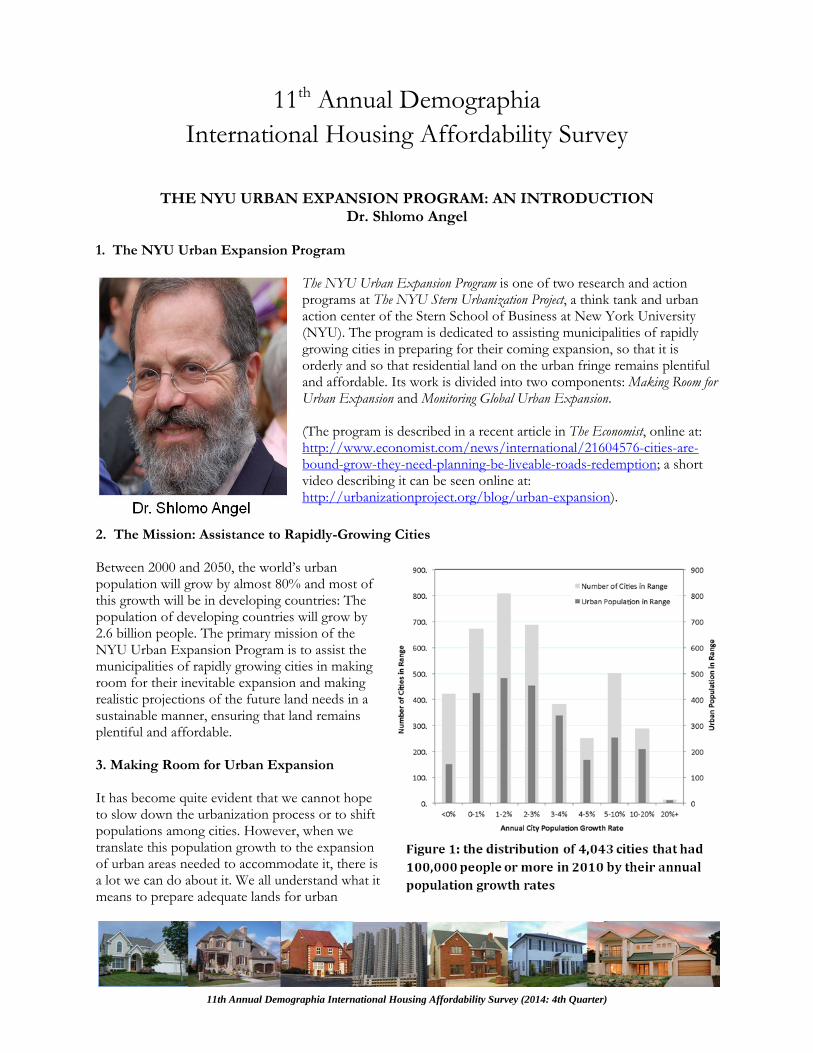
1. The NYU Urban Expansion Program
The NYU Urban Expansion Program is one of two research and action programs at The NYU Stern Urbanization Project, a think tank and urban action center of the Stern School of Business at New York University (NYU). The program is dedicated to assisting municipalities of rapidly growing cities in preparing for their coming expansion, so that it is orderly and so that residential land on the urban fringe remains plentiful and affordable. Its work is divided into two components: Making Room for Urban Expansion and Monitoring Global Urban Expansion. (The program is described in a recent article in The Economist, online at: http://www.economist.com/news/international/21604576-cities-are-bound-grow-they-need-planning-be-liveable-roads-redemption; a short video describing it can be seen online at: http://urbanizationproject.org/blog/urban-expansion).
2. The Mission: Assistance to Rapidly-Growing Cities Between 2000 and 2050, the world’s urban population will grow by almost 80% and most of this growth will be in developing countries: The population of developing countries will grow by 2.6 billion people. The primary mission of the NYU Urban Expansion Program is to assist the municipalities of rapidly growing cities in making room for their inevitable expansion and making realistic projections of the future land needs in a sustainable manner, ensuring that land remains plentiful and affordable. 3. Making Room for Urban Expansion It has become quite evident that we cannot hope to slow down the urbanization process or to shift populations among cities. However, when we translate this population growth to the expansion of urban areas needed to accommodate it, there is a lot we can do about it. We all understand what it means to prepare adequate lands for urban
11th Annual Demographia International Housing Affordability Survey (2014: 4th Quarter)
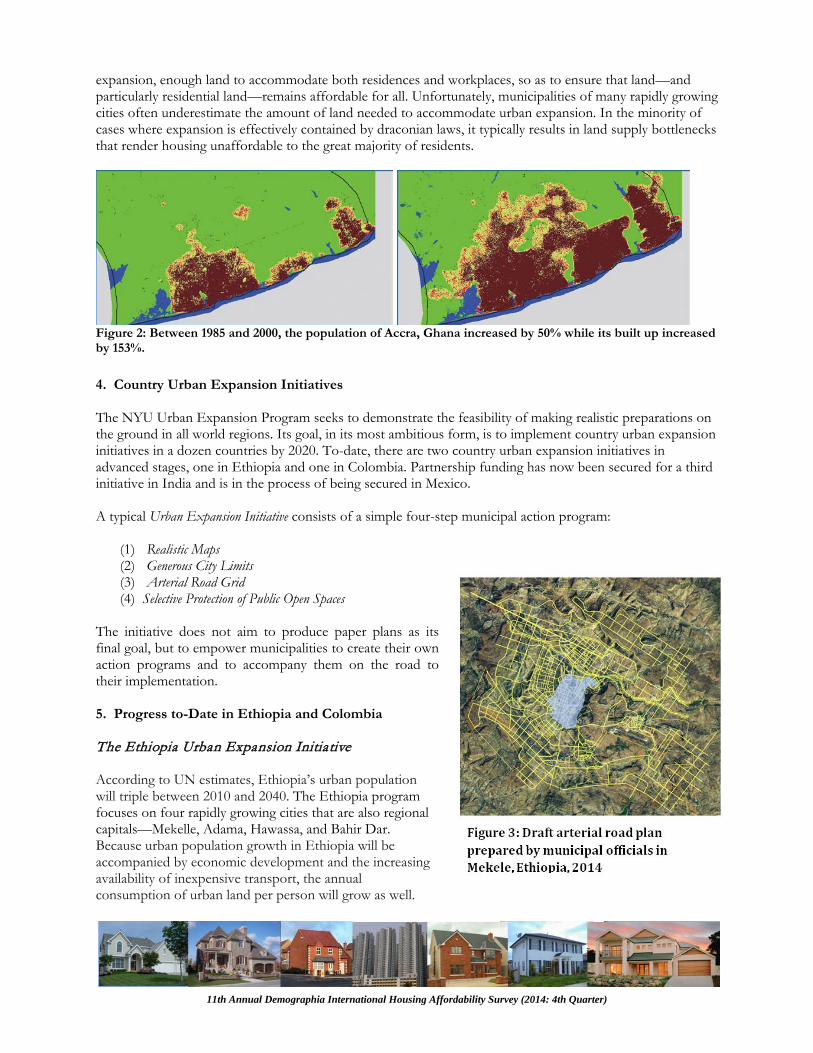
expansion, enough land to accommodate both residences and workplaces, so as to ensure that land—and particularly residential land—remains affordable for all. Unfortunately, municipalities of many rapidly growing cities often underestimate the amount of land needed to accommodate urban expansion. In the minority of cases where expansion is effectively contained by draconian laws, it typically results in land supply bottlenecks that render housing unaffordable to the great majority of residents.
Figure 2: Between 1985 and 2000, the population of Accra, Ghana increased by 50% while its built up increased by 153%. 4. Country Urban Expansion Initiatives The NYU Urban Expansion Program seeks to demonstrate the feasibility of making realistic preparations on the ground in all world regions. Its goal, in its most ambitious form, is to implement country urban expansion initiatives in a dozen countries by 2020. To-date, there are two country urban expansion initiatives in advanced stages, one in Ethiopia and one in Colombia. Partnership funding has now been secured for a third initiative in India and is in the process of being secured in Mexico. A typical Urban Expansion Initiative consists of a simple four-step municipal action program:
(1) Realistic Maps (2) Generous City Limits (3) Arterial Road Grid (4) Selective Protection of Public Open Spaces
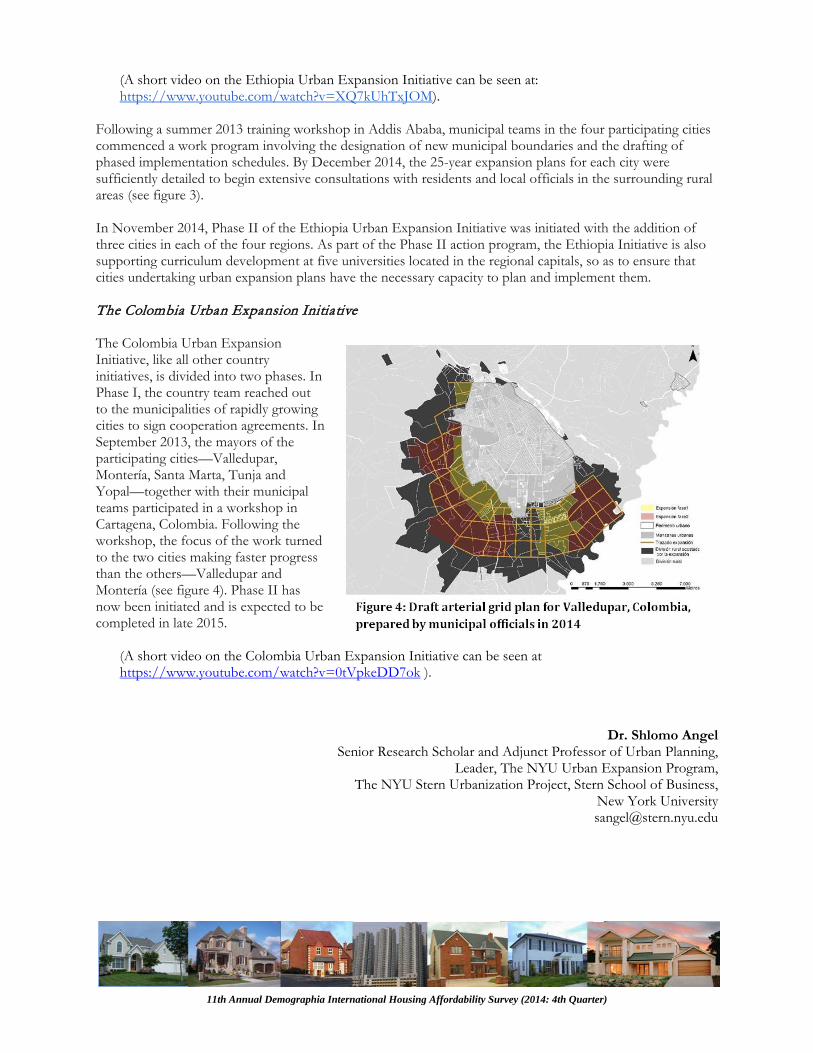
The initiative does not aim to produce paper plans as its final goal, but to empower municipalities to create their own action programs and to accompany them on the road to their implementation. 5. Progress to-Date in Ethiopia and Colombia The Ethiopia Urban Expansion Initiative According to UN estimates, Ethiopia’s urban population will triple between 2010 and 2040. The Ethiopia program focuses on four rapidly growing cities that are also regional capitals—Mekelle, Adama, Hawassa, and Bahir Dar. Because urban population growth in Ethiopia will be accompanied by economic development and the increasing availability of inexpensive transport, the annual consumption of urban land per person will grow as well.
11th Annual Demographia International Housing Affordability Survey (2014: 4th Quarter)
(A short video on the Ethiopia Urban Expansion Initiative can be seen at: https://www.youtube.com/watch?v=XQ7kUhTxJOM).
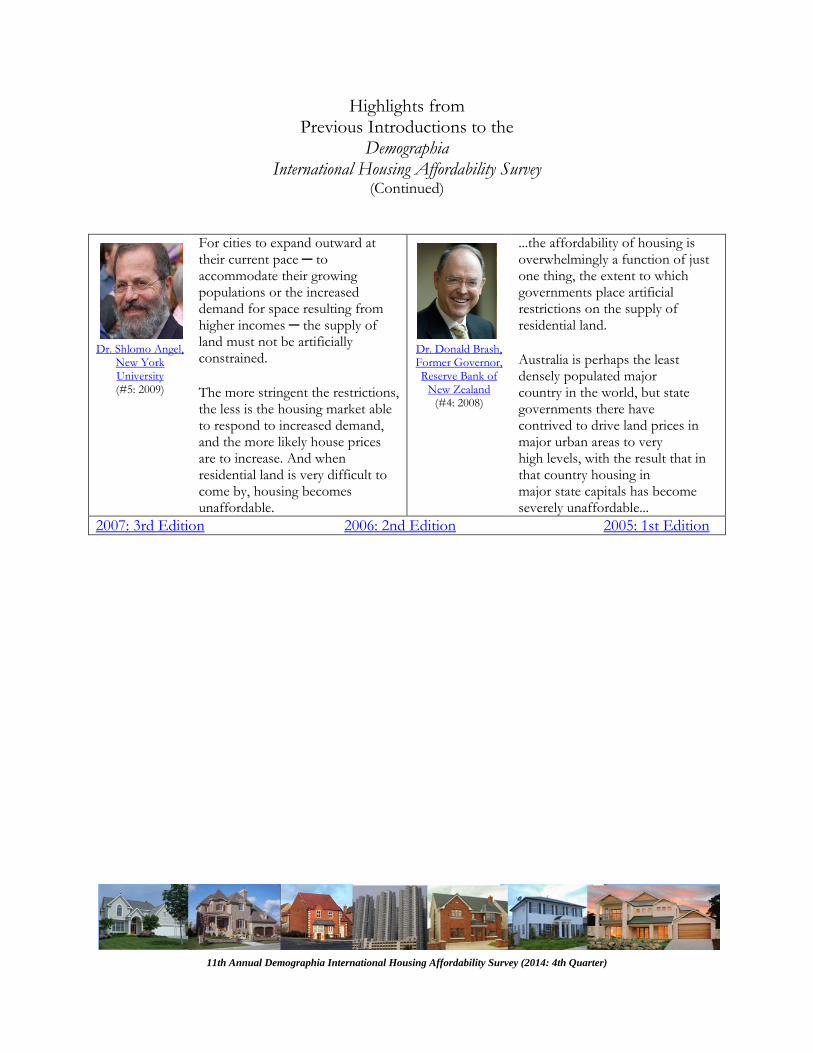
Following a summer 2013 training workshop in Addis Ababa, municipal teams in the four participating cities commenced a work program involving the designation of new municipal boundaries and the drafting of phased implementation schedules. By December 2014, the 25-year expansion plans for each city were sufficiently detailed to begin extensive consultations with residents and local officials in the surrounding rural areas (see figure 3). In November 2014, Phase II of the Ethiopia Urban Expansion Initiative was initiated with the addition of three cities in each of the four regions. As part of the Phase II action program, the Ethiopia Initiative is also supporting curriculum development at five universities located in the regional capitals, so as to ensure that cities undertaking urban expansion plans have the necessary capacity to plan and implement them. The Colombia Urban Expansion Initiative The Colombia Urban Expansion Initiative, like all other country initiatives, is divided into two phases. In Phase I, the country team reached out to the municipalities of rapidly growing cities to sign cooperation agreements. In September 2013, the mayors of the participating cities—Valledupar, Montería, Santa Marta, Tunja and Yopal—together with their municipal teams participated in a workshop in Cartagena, Colombia. Following the workshop, the focus of the work turned to the two cities making faster progress than the others—Valledupar and Montería (see figure 4). Phase II has now been initiated and is expected to be completed in late 2015.
(A short video on the Colombia Urban Expansion Initiative can be seen at https://www.youtube.com/watch?v=0tVpkeDD7ok ).
Dr. Shlomo Angel Senior Research Scholar and Adjunct Professor of Urban Planning,
Leader, The NYU Urban Expansion Program, The NYU Stern Urbanization Project, Stern School of Business,
11th Annual Demographia International Housing Affordability Survey (2014: 4th Quarter)
Highlights from Previous Introductions to the
Demographia International Housing Affordability Survey
Alain Bertaud. New York University
(#10: 2014)
It is time for planners to abandon abstract objectives and to focus their efforts on two measurable outcomes that have always mattered since the growth of large cities during the 19th century’s industrial revolution: workers’ spatial mobility and housing affordability. As a city develops, nothing is more important than maintaining mobility and housing affordability. Mobility takes two forms: first, the ability to travel in less than an hour from one part of a city to another; and second, the ability to trade dwellings easily with low transactions costs. The mobility and affordability objectives are tightly related. A residential location that only allows access to only a small segment of the job market in less than an hour commuting time has not much value to households, even if it is theoretically affordable.
Hon. Bill English, Deputy Prime Minister, New
Zealand (#9: 2013)
Housing affordability is complex in the detail – governments intervene in many ways – but is conceptually simple. It costs too much and takes too long to build a house in New Zealand. Land has been made artificially scarce by regulation that locks up land for development. This regulation has made land supply unresponsive to demand.
#9: 2012: Robert Bruegmann, PhD,
University of Illinois, Chicago
(#8: 2012)
I think it is fair to say that a growing number of people who have looked at the figures have tended to agree that a good many well-meaning policies involving housing may be pushing up prices to such an extent that the negative side-effects are more harmful than the problems the policies were intended to correct.
Joel Kotkin, Chapman University
(#7: 2011)
Although usually thought of as “progressive” in the English speaking world, the addiction to “smart growth” can more readily be seen as socially “regressive”. In contrast to the traditional policies of left of center governments that promoted the expansion of ownership and access to the suburban “dream” for the middle class, today regressive “progressives” actually advocate the closing off of such options for potential homeowners.
Dr. Tony Recsei, Save Our Suburbs,
Sydney (#6: 2010)
During the 18th century, especially after the industrial revolution, rural dwellers desperate to make a living streamed into the cities, converting many areas into overcrowded slums. However, as the new economic order began to generate wealth, standards of living improved, allowing an increase in personal living space. Unless we are vigilant, high-density zealots will do their best to reverse centuries of gains and drive us back towards a Dickensian gloom.
11th Annual Demographia International Housing Affordability Survey (2014: 4th Quarter)
Highlights from Previous Introductions to the
Demographia International Housing Affordability Survey
(Continued)
Dr. Shlomo Angel, New York University (#5: 2009)
For cities to expand outward at their current pace ─ to accommodate their growing populations or the increased demand for space resulting from higher incomes ─ the supply of land must not be artificially constrained. The more stringent the restrictions, the less is the housing market able to respond to increased demand, and the more likely house prices are to increase. And when residential land is very difficult to come by, housing becomes unaffordable.
Dr. Donald Brash, Former Governor, Reserve Bank of
New Zealand (#4: 2008)
...the affordability of housing is overwhelmingly a function of just one thing, the extent to which governments place artificial restrictions on the supply of residential land. Australia is perhaps the least densely populated major country in the world, but state governments there have contrived to drive land prices in major urban areas to very high levels, with the result that in that country housing in major state capitals has become severely unaffordable...
11th Annual Demographia International Housing Affordability Survey (2014: 4th Quarter)
Messages from the Authors Demographia
International Housing Affordability Survey
We are especially pleased to feature an introductory essay by Dr. Shlomo Angel of the New York University Urban Expansion Program in this 11th Annual Demographia International Housing Affordability
Survey. The work of Dr. Angel and the Urban Expansion Program has been the subject of an article in The Economist and was referenced in the recent center feature section just last month. The modern housing affordability problem can be traced to Britain, with the post-World War II "urban containment" policy regime has led to an unconscionable undersupply of housing. Basic economics should have alerted policymakers that substantial house price increases relative to incomes would follow. Indeed they did. Chief Economic Commentator Martin Wolf of the Financial Times has suggested that if these policies "had been in effect in the 19th century, none of the great British cities would now exist." Similarly, if Australia's mimicking policies had been in effect in 1950, Australia might today be a nation of renters, not home owners. The "Great Australian Dream" and an unusually prosperous people might have not emerged. A similar fate could have befallen the United States. The post-war home ownership increase of more than 50 percent and the "American Dream" seem unlikely to have occurred. Aside from most fundamental values like rule of law and personal security, there can be no more basic domestic role of government that facilitating the prosperity of people and minimizing poverty.
The purpose of the Demographia Surveys is to alert the public and policy-makers if housing exceeds 3.0 times annual household incomes, that there is institutional failure at the local level. The political and regulatory
impediments with respect to land supply and infrastructure provision must be dealt with. Indeed – the United Nations within its 2007 World Population Report is very forthright when it states – “Once policymakers and civil society understand and accept the demographic and social composition of urban growth, some basic approaches and initiatives suggest themselves.” “These could have a huge impact on the fate of poor people and the viability of the cities themselves. “ “Throughout the report, the message is clear. Urban and national governments, together with civil society and supported by international organizations, can take steps that make a huge difference for the social, economic and environmental living conditions of a majority of the world’s population.” “Three policy initiatives stand out in this connection.” “First, preparing for an urban future requires at a minimum, respecting the rights of the poor to the city. As Chapter 3 shows, many policymakers continue to try to prevent urban growth by discouraging rural – urban migration…….” “These attempts to prevent migration are futile, counterproductive and wrong – a violation of people’s rights.”
Wendell Cox Hugh Pavletich
11th Annual Demographia International Housing Affordability Survey (2014: 4th Quarter)
TABLE OF CONTENTS The NYU Urban Expansion Program: An Introduction: Dr. Shlomo Angel Highlights from Introductions to Previous Editions Author's Introductions
Executive Summary 1
1. Rating Housing Affordability 6 1.1 The Standard: The Median Multiple 7 1.2 The Median Multiple: Historical International Consistency 7 1.3 Perspective 9 1.4 Housing Affordability Ratings 9
2. Housing Affordability in 2014: International Summary 10
2.1 Major Metropolitan Markets 10 2.2 All Markets 12
3. Housing Affordability in 2014: National Summaries 14 3.1 Australia 14 3.2 Canada 16 3.3 China 17 3.4 Ireland 17 3.5 Japan 18 3.6 New Zealand 18 3.7 Singapore 19 3.8 United Kingdom 20 3.9 United States 21
4. Other Surveys: China and Korea 23 4.1 China 23 4.2 Korea 24 4.3 Comparisons with the Demographia Survey 25
11th Annual Demographia International Housing Affordability Survey (2014: 4th Quarter)
5. Appropriate Public Policies 25 5.1 Universal Principles: Standard of Living & Poverty Reduction 25 5.2 Income, Expenditures and the Standard of Living 26 5.3 Housing Affordability Losses 27 5.4 Comparing Housing Markets: Liberal and Urban Containment 27 5.5 Consequences of Urban Containment Policy 28 5.6 Denying Basic Economics 30 5.7 Putting People First 31
Schedule 1: Major Markets Ranked by Affordability 32 Schedule 2: Major Markets by Geography 34 Schedule 3: All Markets Ranked by Affordability 36 Schedule 4: All Markets Ranked by Geography 44 Annex: Uses, Methods and Sources 54 Biographies 58
FIGURES
1. House Price to Income Ratios 7 2: Housing Affordability: 2004-2014 10 3: Housing Affordability & Land Regulation 12 4: National Housing Affordability 13 5: Housing Affordability Trend: Australia 15 6: Housing Affordability Trend: Canada 16 7: Housing Affordability Trend: New Zealand 18 8. Pre-Bubble & 2014 Housing Affordability (US) 21 9: Housing Affordability Trend: United States 22 10. National Major Market Affordability: 2014 24 11. 3 Survey Housing Affordability: Examples 25
11th Annual Demographia International Housing Affordability Survey (2014: 4th Quarter)
TABLES
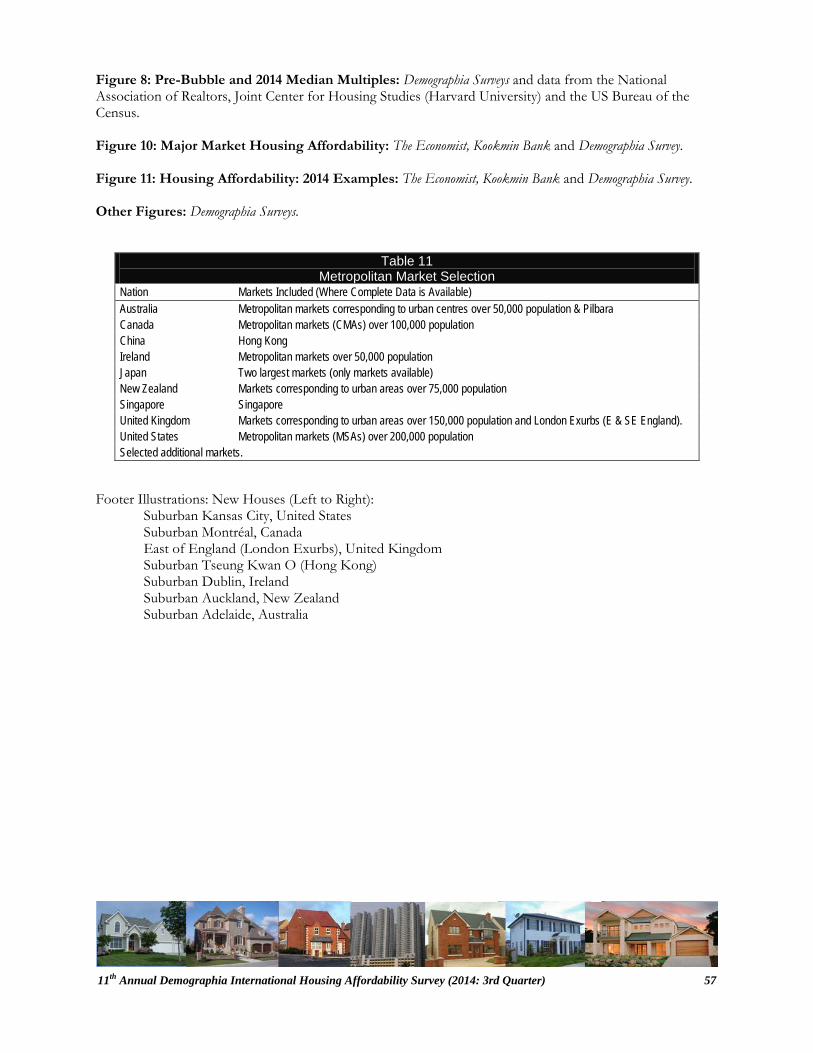
ES-1 Demographia Housing Affordability Rating Categories 2 ES-2: Housing Affordability by Nation: Major Metropolitan Markets 3 ES-3 Housing Affordability by Nation: All Markets 3 1: Land Use Regulation Market Classifications 8 2: Demographia Housing Affordability Rating Categories 9 3: Distribution of Markets by Housing Affordability Rating Category 10 4: Housing Affordability by Nation: Major Markets 11 5: Affordable Major Metropolitan Markets 11 6: 10 Least Affordable Major Metropolitan Markets 12 7: Housing Affordability Ratings by Nation: All Markets 13 8: All 378 Markets: Top 10 Affordable 14 9: All 378 Markets: 10 Least Affordable 14 10: Affordable Housing Markets: Definition 26 11: Metropolitan Market Selection 57
Permission granted to quote with attribution.
Permission granted for links to this report http://www.demographia.com/dhi.pdf
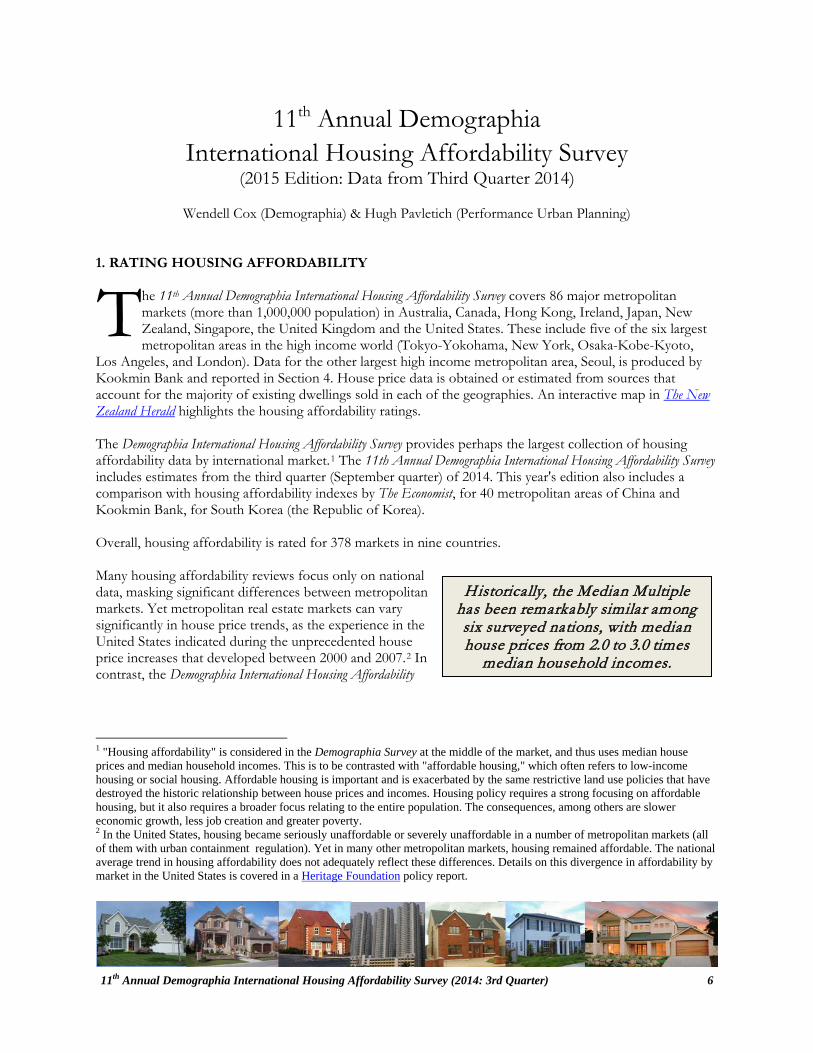
he 11th Annual Demographia International Housing Affordability Survey covers 378 metropolitan markets in nine countries (Australia, Canada, China, Ireland, Japan, New Zealand, Singapore, the United Kingdom and the United States). A total of 86 major metropolitan markets --- with more than 1,000,000 population --- are included, including five of the six largest metropolitan areas in the high
income world (Tokyo-Yokohama, New York, Osaka-Kobe-Kyoto, Los Angeles, and London). An interactive map in The New Zealand Herald highlights the housing affordability ratings. This year's edition includes a comparison with housing affordability indexes by The Economist, for the major metropolitan areas in China (excluding Hong Kong, which is rated in the Demographia Survey) and by Kookmin Bank for South Korea (the Republic of Korea). Rating Housing Affordability The Demographia International Housing Affordability Survey rates housing affordability using the “Median Multiple.” The Median Multiple is widely used for evaluating urban markets, and has been recommended by the World Bank and the United Nations and is used by the Joint Center for Housing Studies, Harvard University. The Median Multiple and other similar price-to-income multiples (housing affordability multiples) are used to compare housing affordability between markets by the Organization for Economic Cooperation and Development, the International Monetary Fund, The Economist, and other organizations. More elaborate indicators, which mix housing affordability and mortgage affordability can mask the structural elements of house pricing are often not well understood outside the financial sector. Moreover, they provide only a "snapshot," because interest rates can vary over the term of a mortgage; however the price paid for the house does not. If house prices double or triple relative to incomes, as has occurred in many severely unaffordable markets, mortgage payments become much higher.
Historically, the Median Multiple has been remarkably similar in Australia, Canada, Ireland, New Zealand, the United Kingdom and the United States, with median house prices from 2.0 to 3.0 times median household incomes. However, in recent decades, house prices have been decoupled from this relationship in a number of markets, such as Vancouver, Sydney, San Francisco, London, Auckland and others. Without exception, these markets have severe land use restrictions (typically "urban containment" policies) that have been associated with higher land prices and in consequence higher house prices (as basic economics would indicate, other things being equal).
Virtually no government administering urban containment policy effectively monitors housing affordability. However, encouraging developments have been implemented at higher levels of government in New Zealand and Florida, and there are signs of potential reform elsewhere. The perspective of the Demographia International Housing Affordability Survey is that domestic public policy should, first and foremost be focused on improving the standard of living and reducing poverty. The Demographia International Housing Affordability Survey is produced to fill the gap left by urban planning policies that have largely failed to meaningfully monitor housing affordability in the areas under their jurisdiction. Virtually all of the geographies covered in the Survey are facing more uncertain economic futures than in the past. As always seems to be the case in economic matters, younger people and lower income people tend to be at greater risk. In this environment, securing a standard of living for younger people that at least equals that of their parents and facilitates upward mobility for all must be a principal policy priority – –certainly one that is of higher and greater importance than urban form, how people travel or miniscule environmental gains. Demographia uses the following housing affordability ratings (Table ES-1).
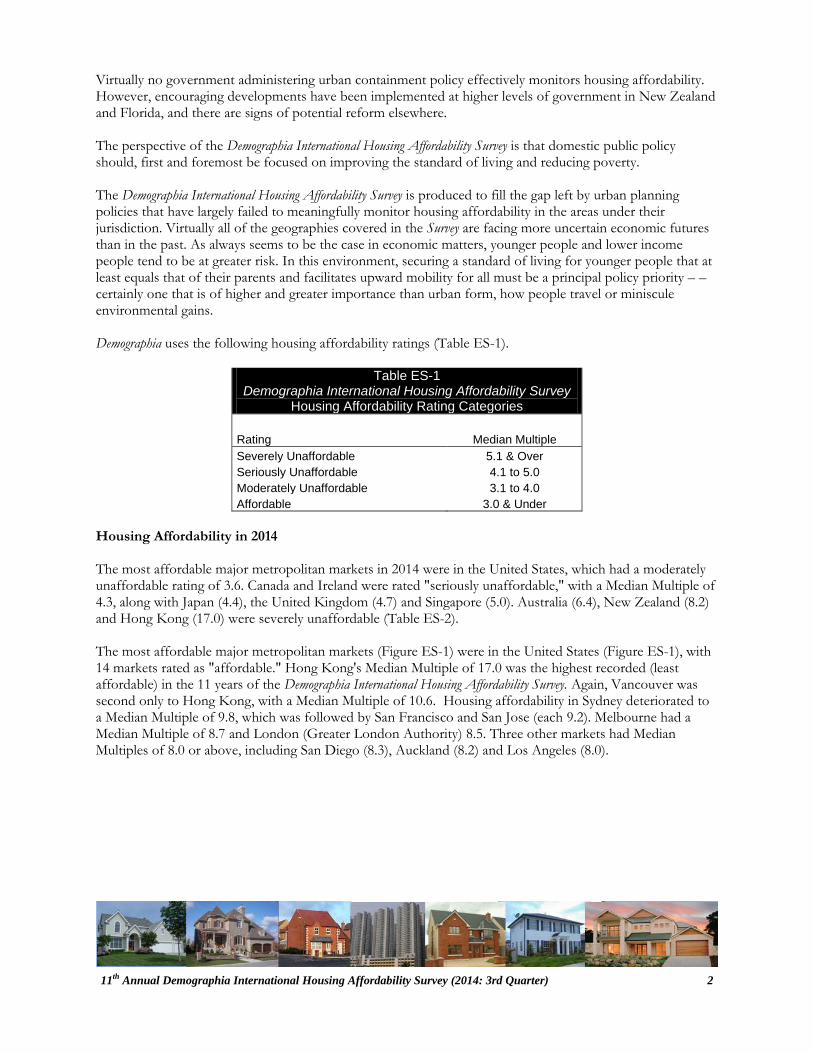
Table ES-1 Demographia International Housing Affordability Survey
Housing Affordability Rating Categories
Rating Median Multiple Severely Unaffordable 5.1 & Over Seriously Unaffordable 4.1 to 5.0 Moderately Unaffordable 3.1 to 4.0 Affordable 3.0 & Under
Housing Affordability in 2014 The most affordable major metropolitan markets in 2014 were in the United States, which had a moderately unaffordable rating of 3.6. Canada and Ireland were rated "seriously unaffordable," with a Median Multiple of 4.3, along with Japan (4.4), the United Kingdom (4.7) and Singapore (5.0). Australia (6.4), New Zealand (8.2) and Hong Kong (17.0) were severely unaffordable (Table ES-2). The most affordable major metropolitan markets (Figure ES-1) were in the United States (Figure ES-1), with 14 markets rated as "affordable." Hong Kong's Median Multiple of 17.0 was the highest recorded (least affordable) in the 11 years of the Demographia International Housing Affordability Survey. Again, Vancouver was second only to Hong Kong, with a Median Multiple of 10.6. Housing affordability in Sydney deteriorated to a Median Multiple of 9.8, which was followed by San Francisco and San Jose (each 9.2). Melbourne had a Median Multiple of 8.7 and London (Greater London Authority) 8.5. Three other markets had Median Multiples of 8.0 or above, including San Diego (8.3), Auckland (8.2) and Los Angeles (8.0).
Table ES-2 Housing Affordability Ratings by Nation: Major Markets (Over 1,000,000 Population)
Nation
Affordable (3.0 &
Under)
Moderately Unaffordable
(3.1-4.0)
Seriously Unaffordable
(4.1-5.0)
Severely Unaffordable (5.1 & Over)
Total
Median Market
Australia 0 0 0 5 5 6.4 Canada 0 2 2 2 6 4.3 China (Hong Kong) 0 0 0 1 1 17.0 Ireland 0 0 1 0 1 4.3 Japan 0 1 1 0 2 4.4 New Zealand 0 0 0 1 1 8.2 Singapore 0 0 1 0 1 5.0 United Kingdom 0 1 10 6 17 4.7 United States 14 23 6 9 52 3.6 TOTAL 14 27 21 24 86 4.2
Among all 378 markets, there were 98 affordable markets, 88 in the United States, five in Canada, three in Ireland and, for the first time, there were affordable markets in Australia (two). There were 119 moderately unaffordable markets, 97 in the United States, 16 in Canada, three in the United Kingdom and one each in Japan, Ireland and Australia. There were 76 seriously unaffordable markets and 85 severely unaffordable markets. Australia had 33 severely unaffordable markets, followed by the United States with 25 and the United Kingdom with 16. New Zealand and Canada each had five severely unaffordable markets, while China's one market (Hong Kong) was also severely unaffordable (Table ES-3).
Table ES-3 Housing Affordability Ratings by Nation: All Markets
Nation
Affordable (3.0 &
Under)
Moderately Unaffordable
(3.1-4.0)
Seriously Unaffordable
(4.1-5.0)
Severely Unaffordable (5.1 & Over)
Total
Median Market
Australia 2 1 15 33 51 5.5 Canada 5 16 9 5 35 3.9 China (Hong Kong) 0 0 0 1 1 17.0 Ireland 3 1 1 0 5 3.0 Japan 0 1 1 0 2 4.4 New Zealand 0 0 3 5 8 5.2 Singapore 0 0 1 0 1 5.0 United Kingdom 0 3 14 16 33 5.0 United States 88 97 32 25 242 3.4 TOTAL 98 119 76 85 378 3.8
Housing Affordability Surveys: China and Korea Other organizations publish surveys using housing affordability multiples similar to the Median Multiple, including China and South Korea. The Economist produces the China Index of Housing Affordability by City, which covers 40 cities of China. The overall housing affordability multiple was 8.6, which is more affordable than Hong Kong (17.0), but slightly
less affordable than New Zealand's major metropolitan market, Auckland (8.2). Shenzhen, bordering Hong Kong, was the least affordable (19.6). Beijing was the second least affordable, at 16.6. The lowest housing affordability multiple was in Hohhot, at 4.9. A number of the least affordable metropolitan markets in the 11th Annual Demographia International Housing Affordability Survey have Median Multiples that would place them in the least affordable half among the major markets of China. These include Vancouver, Sydney, San Francisco, San Jose and Melbourne. Kookmin Bank periodically publishes housing affordability multiples for Korea. The overall housing affordability multiple for 2013 was 3.7. The least affordable market was the Municipality of Seoul, at 7.7. There were two affordable markets, Ulsan and Guanju, both at 2.9. Appropriate Public Policies Governments around the world place a highest priority on improving the standard of living and eradicating poverty. The recent communiqué from the group of 20 (G – 20) reiterated a commitment to these goals. Improving the standard of living and eradicating poverty requires more than attention simply to incomes, but also to household expenditures. Ultimately, the standard of living and extend of poverty is determined by discretionary incomes, the amounts that households have left over after paying taxes and for basic necessities, such as housing, food, clothing and transport. Housing is the largest item of household expenditure. Housing has become severely unaffordable in many of the markets covered by Demographia International Housing Affordability Survey, most notably in Australia, New Zealand, the United Kingdom and some markets in Canada and the United States. As a result, house prices in such markets have been decoupled from their historic relationship to household incomes The house price increases relative to incomes are a matter of basic economics. Other things being equal, the price of a good or service is likely to increase where supply is limited. Former Governor of the Reserve Bank of New Zealand Donald Brash attributes the housing affordability losses to "the extent to which governments place artificial restrictions on the supply of residential land." In every case where severe housing affordability has been identified in the 11 year history of the Demographia International Housing Affordability Survey, there are significant land supply restrictions that have led to an excess in the of housing demand relative to the supply of land for building houses. At the same time, no major metropolitan market without urban containment policy has ever been rated with severely unaffordable housing over the same 11 years. With its larger number of liberally regulated markets, the United States illustrates urban containment related differences in standard of living. Some high income metropolitan areas with urban containment regulation have housing costs so high that average pay is less than in liberally regulated markets with lower incomes. Urban containment policy has been implemented to stop "urban sprawl." Yet cities cover comparatively little land area. Moreover, cities are not expanding at a rate that would threaten agricultural production. The anti-sprawl justification is being challenged by the increasing awareness that strong restrictions on land supply drive up the cost of housing, which reduces the standard of living. Urban containment policy is also justified as a means to reduce greenhouse gas (GHG) emissions. Yet, urban containment policy is not among the most cost effective strategies. In requiring higher expenditures per tonne than necessary, urban containment policy is likely to reduce employment growth and economic growth, other things being equal.
Paul Cheshire of the London School of Economics refers to a "fatal mismatch between the operational concepts of demand and supply in markets and the parallel concepts with which the planning system works." As noted above, younger households are among the most significantly victimized by the housing affordability losses. The lucky ones will inherit homes from their parents --- which is a big step away from legendary urbanologist Sir Peter Hall's "ideal of a property owning democracy." No rational political faction would adopt a manifesto calling for a lower standard of living or greater poverty. Yet in adopting urban containment policies, governments have (perhaps unwittingly) placed a higher priority on secondary issues, such as urban design, urban sprawl and mode of transport. Urban policy should focus on the fundamentals --- improving the standard of living and reducing poverty.
he 11th Annual Demographia International Housing Affordability Survey covers 86 major metropolitan markets (more than 1,000,000 population) in Australia, Canada, Hong Kong, Ireland, Japan, New Zealand, Singapore, the United Kingdom and the United States. These include five of the six largest metropolitan areas in the high income world (Tokyo-Yokohama, New York, Osaka-Kobe-Kyoto,
Los Angeles, and London). Data for the other largest high income metropolitan area, Seoul, is produced by Kookmin Bank and reported in Section 4. House price data is obtained or estimated from sources that account for the majority of existing dwellings sold in each of the geographies. An interactive map in The New Zealand Herald highlights the housing affordability ratings. The Demographia International Housing Affordability Survey provides perhaps the largest collection of housing affordability data by international market.1 The 11th Annual Demographia International Housing Affordability Survey includes estimates from the third quarter (September quarter) of 2014. This year's edition also includes a comparison with housing affordability indexes by The Economist, for 40 metropolitan areas of China and Kookmin Bank, for South Korea (the Republic of Korea). Overall, housing affordability is rated for 378 markets in nine countries. Many housing affordability reviews focus only on national data, masking significant differences between metropolitan markets. Yet metropolitan real estate markets can vary significantly in house price trends, as the experience in the United States indicated during the unprecedented house price increases that developed between 2000 and 2007.2 In contrast, the Demographia International Housing Affordability
1 "Housing affordability" is considered in the Demographia Survey at the middle of the market, and thus uses median house prices and median household incomes. This is to be contrasted with "affordable housing," which often refers to low-income housing or social housing. Affordable housing is important and is exacerbated by the same restrictive land use policies that have destroyed the historic relationship between house prices and incomes. Housing policy requires a strong focusing on affordable housing, but it also requires a broader focus relating to the entire population. The consequences, among others are slower economic growth, less job creation and greater poverty. 2 In the United States, housing became seriously unaffordable or severely unaffordable in a number of metropolitan markets (all of them with urban containment regulation). Yet in many other metropolitan markets, housing remained affordable. The national average trend in housing affordability does not adequately reflect these differences. Details on this divergence in affordability by market in the United States is covered in a Heritage Foundation policy report.
Without exception, severely unaffordable markets have severe
land use restrictions (usually " urban containment policies" )
Survey assesses housing affordability within nations, at the metropolitan market level. This approach not only compares housing affordability within nations, but also permits comparisons between international markets where historical similarities are indicated between housing affordability indices. 1.1 The Standard: The Median Multiple The Demographia International Housing Affordability Survey uses the “Median Multiple”3 (median house price divided by gross annual median household income4) to assess housing affordability. The Median Multiple (a house price to income ratio) is widely used for evaluating urban markets, and has been recommended by the World Bank5 and the United Nations and is used by the Joint Center for Housing Studies, Harvard University.6 Similar house price to income ratios (housing affordability multiples) are used to compare housing affordability between markets by the Organization for Economic Cooperation and Development, the International Monetary Fund, international credit rating services, press outlets (such as The Economist7) and others. More elaborate indicators, which often mix housing affordability and mortgage affordability can mask the structural elements of house pricing, are often not well understood outside the financial sector. The mixed indicators provide only a "snapshot," because interest rates can vary over the term of a mortgage; however the price paid for the house does not. The Median Multiple is a reliable, easily understood and essential structural indicator for measuring the health of residential markets and facilitates meaningful and transparent comparisons of housing affordability. Further to this, the Median Multiple provides a solid foundation for the consideration of structural policy options for restoring and maintaining housing affordability in local metropolitan markets. 1.2 The Median Multiple: Historical International Consistency Historically, the Median Multiple has been remarkably similar among six surveyed nations, with median house prices from 2.0 to 3.0 times median household incomes. This is indicated by Reserve Bank of Australia research covering Australia, Canada, Ireland, New Zealand, the 3 Also called a price-to-income ratio. 4 This is to be contrasted with median "family" income, which is higher and would produce a lower multiple. 5 The Housing Indicators Program, http://siteresources.worldbank.org/INTURBANDEVELOPMENT/Resources/336387-1169578899171/rd-hs7.htm. Also see Shlomo Angel, Housing Policy Matters: A Global Analysis. Oxford University Press, 2000. 6Indicators of Sustainable Development: House Price-to-income Ratio: http://esl.jrc.it/envind/un_meths/UN_ME050.htm. 7 For example, The Economist publishes a housing affordability index for metropolitan areas in China (see Section 4).
United Kingdom and the United States until the late 1980s or late 1990s (Figure 1).8 The Median Multiple of 3.0 continued to be evident in many markets of the United States and Canada.9 The 3.0 standard was also cited in research by Arthur C. Grimes, of Motu Economics and Policy Research, who served as Chair of the Board of the Reserve Bank of New Zealand from 2000 to 2013.
In recent decades, housing affordability has deteriorated materially across Australia, New Zealand10 and the United Kingdom, virtually without regard to market size or demand. Without exception, severely unaffordable markets have severe land use restrictions (usually urban containment regulation) that have been associated with higher land prices and, in consequence, higher house prices (Table 1). This is a consequence consistent with basic economics.
Table 1 LAND USE REGULATION CLASSIFICATIONS
The land use regulation categories used in the Demographia International Housing Affordability Survey are as follows:
Urban Containment (More Restrictive Land Use Regulation) relies on intrusive land use regulation, and includes markets where residential development (new construction) is strongly controlled by comprehensive plans or development limits. Generally, urban containment seeks to outlaw the liberal regulation that has produced middle-income housing affordability.
Urban containment11 may also be characterized by terms such as "densification policy," “compact development”, “urban consolidation”, “growth management” “and "smart growth.” Generally, urban containment regulation is “plan-driven,” as planning departments and governments determine where new housing is allowed to be built. There is a "negative presumption," with new development generally prohibited, except in limited areas where it is permitted by government plans.
By severely limiting or even prohibiting development on the urban fringe, urban containment eliminates the "supply vent" of urban fringe development, by not allowing the supply of housing to keep up with demand, except at prices elevated well above historic norms. In addition to higher costly housing costs relative to incomes, the higher densities in urban containment markets are associated with greater traffic congestion and longer average work trip journey times.
Urban containment policies are normally accompanied by costly development impact fee regimes that disproportionately charge the cost of the necessary infrastructure for growth on new house buyers. There is particular concern about the cost increasing impacts of these fees and levies, especially in Australia, Canada (Canada Mortgage and Housing Corporation), New Zealand (New Zealand Productivity Commission) and California.
Liberal Land Use Policy (Less Restrictive Markets) applies in markets not classified as "urban containment." In these markets, residential development is allowed to occur based upon consumer preferences, subject to basic environmental regulation.12 Generally, liberal land use regulation is “demand-driven” Land is allowed to be developed, except in limited areas, such as parks and environmentally sensitive areas. By allowing development on the urban fringe, liberal land use regulation allows the "supply vent" to operate, which keeps house prices affordable. Less restrictive regulation can also be called traditional or liberal regulation. In addition to lower housing costs relative to incomes, lower population densities in liberal markets are associated with less intense traffic congestion and shorter average work trip journey times.
Classification of Major Markets: The classification of major markets (metropolitan areas with more than 1,000,000 population) is described in the Annex and in Figure 3.
8 Anthony Richards, Some Observations on the Cost of Housing in Australia, Address to 2008 Economic and Social Outlook Conference The Melbourne Institute, 27 March 2008 http://www.rba.gov.au/speeches/2008/sp-so-270308.html. This research included all nations covered in the Demographia International Housing Affordability Survey except for Ireland. The Richards research is also illustrated in the of the National Housing Council of Australia, http://www.fahcsia.gov.au/sa/housing/pubs/housing/national_housing_supply/Documents/default.htm (Figure 1.1). 9 A value below 2.0 is affordable, but may indicate depressed economic conditions. 10 Interest.co.nz also provides housing affordability data using a Median Multiple measure. Interest.co.nz uses a standardized household, rather than the median income household (see: http://www.interest.co.nz/HLA/house_price_to_income_ratio.asp) 11 The term "urban containment" is used throughout the Survey to denote more restrictive land use regulation. 12 Liberal land use policy may vary widely, from the near deregulation in some areas of Texas to the "light-handed" zoning based regulations operating throughout much of the rest of the United States.
The perspective of the Demographia International Housing Affordability Survey is that domestic public policy
should, first and foremost, be focused on improving the standard
of living and reducing poverty
Virtually no government administering urban containment policy effectively monitors housing affordability. Some higher level governments however have recognized the consequences of urban containment policy on the standard of living and have implemented programs intended to restore housing affordability, such as the governments of New Zealand and the state of Florida.
1.3 Perspective
The perspective of the Demographia International Housing Affordability Survey is that domestic public policy should, first and foremost be focused on improving the standard of living and reducing poverty. This requires policies that facilitate both higher household incomes and lower household expenditures (other things being equal). Housing costs are usually the largest component of household expenditure and it is therefore important that land use policy encourage housing affordability. How well people live and less poverty are more important than urban design or the physical layout of cities.
The Demographia International Housing Affordability Survey is produced to fill the gap left by urban planning policies that have largely failed to meaningfully monitor housing affordability in the areas under their jurisdiction. This is important information that should have been routinely made available by implementing governments through the decades of urban containment policy. Virtually all of the geographies covered in the Survey are facing more uncertain economic futures than in the past. As is always the case in such situations, younger people and lower income people tend to be at greater risk. In this environment, a better standard of living for all should be a principal policy priority (Section 5).
1.4 Housing Affordability Ratings
The 11th Annual Demographia International Housing Affordability Survey uses existing house sales transaction data to rate housing affordability. Housing affordability ratings are assigned using the Median Multiple (Table 2).
Rating Median Multiple Severely Unaffordable 5.1 & Over Seriously Unaffordable 4.1 to 5.0 Moderately Unaffordable 3.1 to 4.0 Affordable 3.0 & Under
2. HOUSING AFFORDABILITY IN 2014: INTERNATIONAL SUMMARY
The 11th Annual Demographia International Housing Affordability Survey provides housing affordability ratings on 86 major markets (over 1,000,000 population) and an overall total of 378 markets. Markets in 9 nations are rated. T
2.1 Major Metropolitan Markets Major metropolitan market housing affordability worsened slightly over the last year. Between 2013 and 2014, the major metropolitan Median Multiple13 rose from 4.0 to 4.2. The number of severely unaffordable major metropolitan markets was unchanged at 24, and there was no change in the number of affordable major metropolitan markets. The number of seriously affordable markets increased by three, while the number of moderately unaffordable markets declined by two (Table 3). Data for all metropolitan markets is in Schedules 1 and 2.
Table 3 Distribution of Markets by Housing Affordability Rating Category
Rating Median Multiple Major Markets
(Number) All Markets (Number)
Affordable 3.0 or Less 14 98 Moderately Unaffordable 3.1 to 4.0 27 119 Seriously Unaffordable 4.1 to 5.0 20 75 Severely Unaffordable 5.1 & Over 25 86 TOTAL 86 378
For the second year in a row, the United States had the most affordable housing among major metropolitan markets, with a moderately affordable Median Multiple of 3.6. Canada (4.3) Ireland (4.3), Japan (4.4), the United Kingdom (4.7), and Singapore (5.0) had seriously unaffordable housing. Three national markets were severely unaffordable, with Median Multiples of 5.1 or above. These included China (Hong Kong), with a Median Multiple of 17.0, New Zealand, at 8.2 and Australia at 6.4. Annual major metropolitan area Median Multiples are shown in Figure 2.
13 Median of the Median Multiples.
0
3
6
9
12
15
18
2004 2006 2008 2010 2012 2014
Med
ian
Mul
tiple
: Med
ian
Mar
ket
AustraliaCanadaChina (Hong Kong)IrelandJapanNew ZealandSingaporeUnited KingdomUnited States
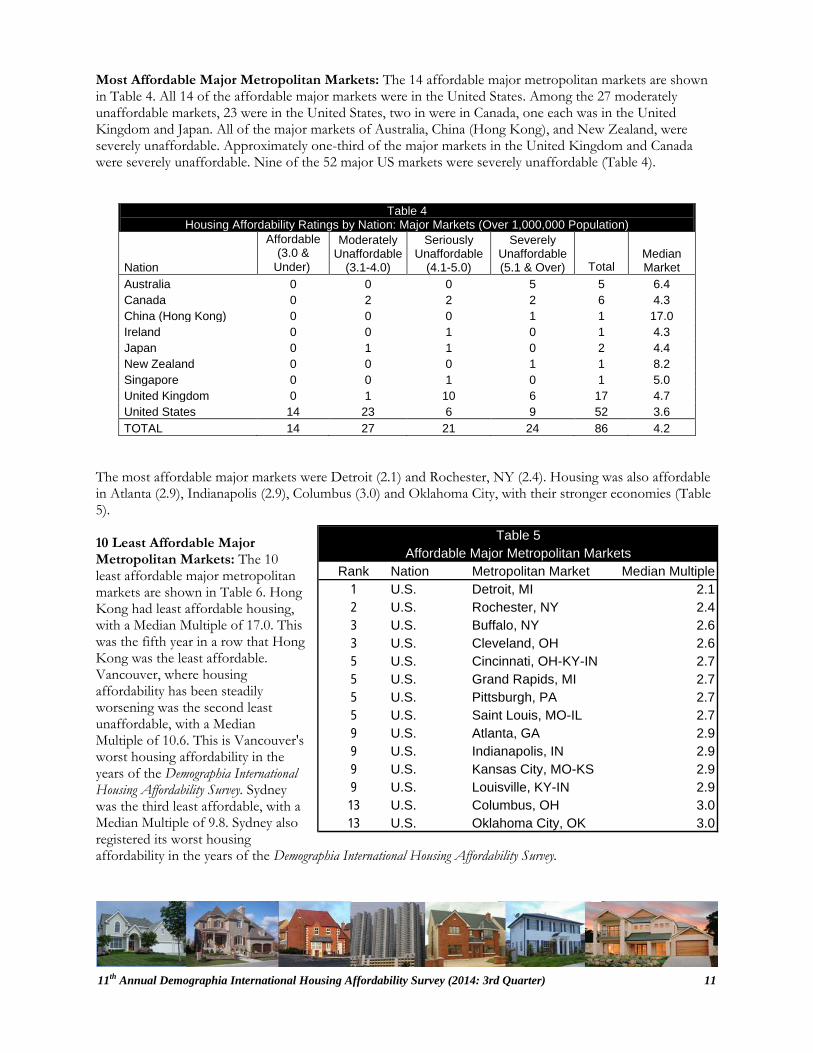
Most Affordable Major Metropolitan Markets: The 14 affordable major metropolitan markets are shown in Table 4. All 14 of the affordable major markets were in the United States. Among the 27 moderately unaffordable markets, 23 were in the United States, two in were in Canada, one each was in the United Kingdom and Japan. All of the major markets of Australia, China (Hong Kong), and New Zealand, were severely unaffordable. Approximately one-third of the major markets in the United Kingdom and Canada were severely unaffordable. Nine of the 52 major US markets were severely unaffordable (Table 4).
Table 4 Housing Affordability Ratings by Nation: Major Markets (Over 1,000,000 Population)
Nation
Affordable (3.0 &
Under)
Moderately Unaffordable
(3.1-4.0)
Seriously Unaffordable
(4.1-5.0)
Severely Unaffordable (5.1 & Over)
Total
Median Market
Australia 0 0 0 5 5 6.4 Canada 0 2 2 2 6 4.3 China (Hong Kong) 0 0 0 1 1 17.0 Ireland 0 0 1 0 1 4.3 Japan 0 1 1 0 2 4.4 New Zealand 0 0 0 1 1 8.2 Singapore 0 0 1 0 1 5.0 United Kingdom 0 1 10 6 17 4.7 United States 14 23 6 9 52 3.6 TOTAL 14 27 21 24 86 4.2
The most affordable major markets were Detroit (2.1) and Rochester, NY (2.4). Housing was also affordable in Atlanta (2.9), Indianapolis (2.9), Columbus (3.0) and Oklahoma City, with their stronger economies (Table 5). 10 Least Affordable Major Metropolitan Markets: The 10 least affordable major metropolitan markets are shown in Table 6. Hong Kong had least affordable housing, with a Median Multiple of 17.0. This was the fifth year in a row that Hong Kong was the least affordable. Vancouver, where housing affordability has been steadily worsening was the second least unaffordable, with a Median Multiple of 10.6. This is Vancouver's worst housing affordability in the years of the Demographia International Housing Affordability Survey. Sydney was the third least affordable, with a Median Multiple of 9.8. Sydney also registered its worst housing affordability in the years of the Demographia International Housing Affordability Survey.
Rank Nation Metropolitan Market Median Multiple1 U.S. Detroit, MI 2.12 U.S. Rochester, NY 2.43 U.S. Buffalo, NY 2.63 U.S. Cleveland, OH 2.65 U.S. Cincinnati, OH-KY-IN 2.75 U.S. Grand Rapids, MI 2.75 U.S. Pittsburgh, PA 2.75 U.S. Saint Louis, MO-IL 2.79 U.S. Atlanta, GA 2.99 U.S. Indianapolis, IN 2.99 U.S. Kansas City, MO-KS 2.99 U.S. Louisville, KY-IN 2.913 U.S. Columbus, OH 3.013 U.S. Oklahoma City, OK 3.0
San Francisco and San Jose tied as the fourth least affordable major metropolitan markets, at a Median Multiple of 9.2. Both metropolitan areas are approaching their historic Median Multiple highs, which were reached during the US housing bubble. Melbourne had the sixth least affordable housing among major metropolitan area markets, with a Median Multiple of 8.7, followed by London (Greater London Authority), at 8.5. San Diego, with a Median Multiple of 8.3 was 8th least affordable, Auckland was 9th least affordable (8.2), and Los Angeles was 10th least affordable. As in the past, each of seriously unaffordable and severely unaffordable markets was characterized by urban containment regulation. At the same time, the affordable markets are generally characterized by liberal land use regulation, which is associated with greater housing affordability (Table 1, above and Figure 3). 2.2 All Markets Among the 378 markets, housing affordability worsened from a Median Multiple of 3.7 in 2013 to 3.8 in 2014. Ireland was the most affordable housing among all 378 metropolitan markets, with a national Median Multiple of 3.0, earning an "affordable" rating. Five national markets were moderately unaffordable. These included the United States, at 3.4, Canada (3.9), Japan (4.4), Singapore (5.0) and the United Kingdom (5.0). The least affordable
Rank: Least
Affordable
Affordability Rank (Out of
86) Nation Metropolitan Market Median Multiple
1 86 China Hong Kong 17.02 85 Canada Vancouver, BC 10.63 84 Australia Sydney, NSW 9.84 82 U.S. San Francisco, CA 9.24 82 U.S. San Jose, CA 9.26 81 Australia Melbourne, VIC 8.77 80 U.K. London (GLA) 8.58 79 U.S. San Diego, CA 8.39 78 N.Z. Auckland 8.2
10 77 U.S. Los Angeles, CA 8.0
Table 610 Least Affordable Major Metropolitan Markets
0 3 6 9 12 15 18Detroit
ClevelandPittsburgh
St. LouisAtlanta
Kansas CityTampa-STP
Minneapolis-STPDallas-FTW
HoustonSan Antonio
ChicagoPhiladelphia
Baltimore, MDOrlandoPhoenix
CharlotteLas VegasOsaka-K-K
LeedsWashington (DC)
MontrealSacramentoManchester
PortlandTokyo
DenverBirmingham (UK)
SingaporeRiverside-SB
SeattleBostonMiami
BrisbaneNew York
TorontoLondon Exurbs
Los AngelesSan Diego
London (GLA)Melbourne
San FranciscoSydney
VancouverHong Kong
Less Restrictive Land Use Regulation (Generally Liberal)
More Restrictive Land Use Regulation (Generally Urban Containment)
Housing Affordability & Regulation: 2014METROPOLITAN AREAS OVER 2,000,000 POPULATION
markets were in China (Hong Kong), at 17.0, Australia (5.5) and New Zealand (5.2), all of which were severely unaffordable (Figure 4).
Table 7 Housing Affordability Ratings by Nation: All Markets
Nation
Affordable (3.0 &
Under)
Moderately Unaffordable
(3.1-4.0)
Seriously Unaffordable
(4.1-5.0)
Severely Unaffordable (5.1 & Over)
Total
Median Market
Australia 2 1 15 33 51 5.5 Canada 5 16 9 5 35 3.9 China (Hong Kong) 0 0 0 1 1 17.0 Ireland 3 1 1 0 5 3.0 Japan 0 1 1 0 2 4.4 New Zealand 0 0 3 5 8 5.2 Singapore 0 0 1 0 1 5.0 United Kingdom 0 3 14 16 33 5.0 United States 88 97 32 25 242 3.4 TOTAL 98 119 76 85 378 3.8
Among all markets, 98 were affordable (Median Multiple of 3.0 or less). There were 119 moderately unaffordable markets (Median Multiple of 3.1 to 4.0) and 76 seriously unaffordable markets (Median Multiple of 4.1 to 5.0). A total of 85 markets were severely unaffordable, with a Median Multiple of 5.1 or higher (Table 7). The 378 markets are ranked by housing affordability in Schedules 3 and 4. All of the 98 affordable markets (having a Median Multiple of 3.0 or below) were in Australia (2), Ireland (3), Canada (5) and the United States (88). This is the first year that Australia has had affordable markets. There were no affordable markets in China (Hong Kong), Japan, New Zealand, Singapore or the United Kingdom. Out of the 13 metropolitan areas ranked 10th or better in affordability (four were tied for 10th), 10 were in the United States, two in Ireland and one in Canada. The most affordable markets were Limerick (Ireland), as well as Rockford, Terre Haute, Utica and Youngstown in the United States, all with a Median Multiple of 2.0 (Table 8).
0
3
6
9
12
15
18
Australia Canada HK Japan Ireland NZ Singapore UK US
Med
ian
Mul
tiple
National Housing Affordability: 2014ALL 378 MARKETS
Median MultipleMedian House PriceDivided by MedianHousehold Income
Among the 86 severely unaffordable markets, 33 were in Australia, 25 in the United States, 17 in the United Kingdom 5 in both Canada and New Zealand. There was one severely unaffordable market in both China (Hong Kong) and Ireland. As among the major metropolitan markets, the five least affordable markets were Hong Kong (17.0), Vancouver (10.6), Sydney (9.8), San Francisco (9.2), and San Jose (9.2). Smaller markets Tweed Heads (Australia), Honolulu (US), and Bournemouth & Dorsett (UK) ranked as the 6th to 8th least affordable. Melbourne was 9th least affordable and 10th least affordable was Santa Cruz, in the United States (Table 9).
Rank: Least
Affordable
Affordability Rank (Out of
378) Nation Metropolitan Market Median Multiple
1 378 China Hong Kong 17.02 377 Canada Vancouver, BC 10.63 376 Australia Sydney, NSW 9.84 374 U.S. San Francisco, CA 9.24 374 U.S. San Jose, CA 9.26 373 Australia Tweed Heads, NSW 9.17 371 U.K. Bournemouth & Dorsett 9.08 371 U.S. Honolulu, HI 9.09 370 Australia Melbourne, VIC 8.7
10 369 U.S. Santa Cruz, CA 8.6
Table 9All 378 Markets: 10 Least Affordable
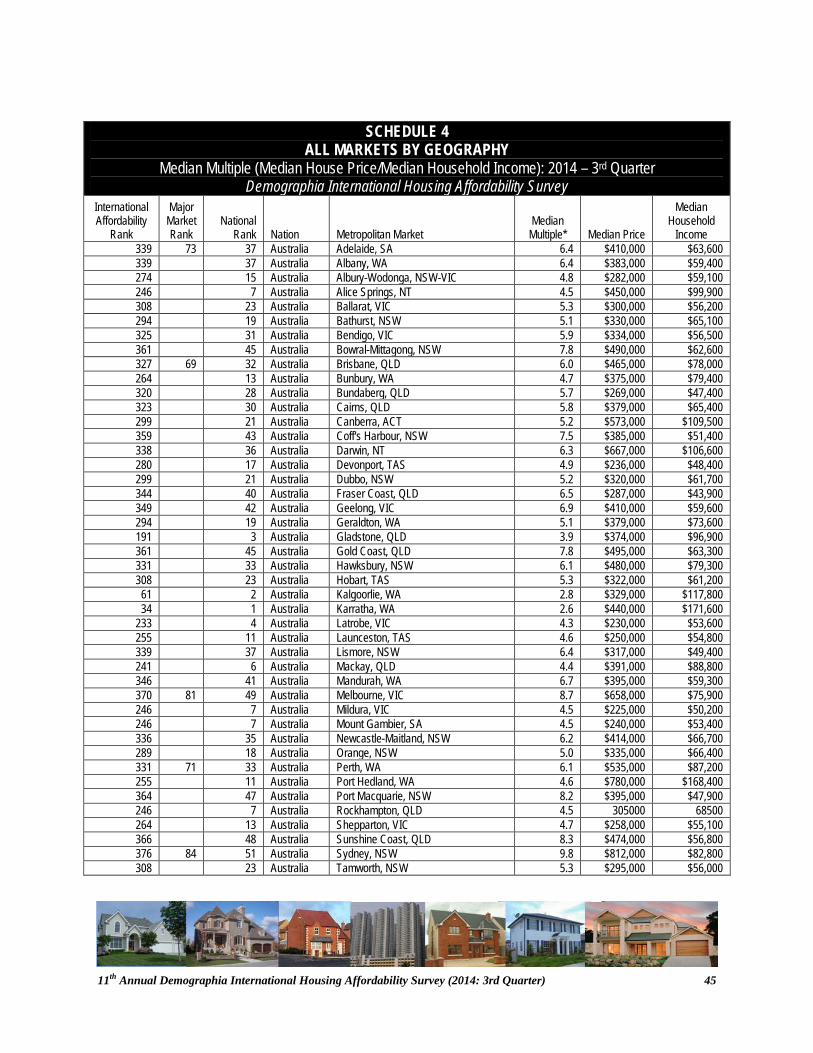
3. HOUSING AFFORDABILITY IN 2014: NATIONAL SUMMARIES The housing affordability situation is summarized by nation below. 3.1 Australia Australia had a severely unaffordable major market Median Multiple of 6.4 in 2014 and a severely unaffordable Median Multiple of 5.5 overall.
Rank Nation Metropolitan Market Median Multiple1 Ireland Limerick 2.01 U.S. Rockford, IL 2.01 U.S. Terre Haute, IN 2.01 U.S. Utica, NY 2.01 U.S. Youngstown, OH-PA 2.06 U.S. Detroit, MI 2.16 U.S. Rochester, MN 2.16 U.S. Sioux City, IA, NE, SD 2.16 U.S. Warner Robbins, GA 2.110 Canada Moncton, NB 2.210 Ireland Waterford 2.210 U.S. Decatur, IL 2.210 U.S. Topeka, KS 2.2
For the 11th year in a row ... all of Australia' s five major metropolitan areas were severely unaffordable
Major Markets: For the 11th year in a row --- each of the years the Demographia International Housing Affordability Survey has been published -- all of Australia's five major metropolitan areas were severely unaffordable (Figure 5)14 This is in significant contrast to broad housing affordability that existed before implementation of urban containment (urban consolidation) policies. Before urban consolidation was adopted, each of Australia's major markets had housing that was affordable. Among the major metropolitan area markets the overall Median Multiple was 6.5. The least affordable market was Sydney, with a Median Multiple of 9.8. This is a substantial increase from last year's 9.0. This makes Sydney the third least affordable out of the 86 major markets rated in this Survey. Housing affordability also deteriorated in Melbourne, rising to a Median Multiple of 8.7 in 2014 from 8.3 in 2013. Melbourne ranked 6th least affordable of the 86 major markets. Housing affordability deteriorated slightly in Adelaide (from 6.3 to 6.4), Perth (from 6.0 to 6.1) and Brisbane (from 5.8 to 6.0). All Markets: Among all markets, Australia's Median Multiple remained severely unaffordable, at 5.5. After major market Sydney (9.8), Tweed Heads (Queensland) was the least affordable, with a Median Multiple of 9.1. Queensland's Sunshine Coast ranked third least affordable with a median multiple of 8.3 (following Melbourne, which ranked fourth among all markets in Australia). The fifth least affordable market in Australia was Port Macquarie, with a median multiple of 8.2.
14 House price data for Australia is from multiple sources, the most important being the Real Estate Industry Association of Queensland (Queensland Market Monitor), the Real Estate Institute of Victoria, the Real Estate Institute of South Australia, the Real Estate Institute of Western Australia, Australian Property Monitors, the Real Estate Institute of Australia and various real estate internet web sites. House price data for some smaller markets is year to date data.
Vancouver retained its longstanding record among the
worst markets for housing affordability.
The deterioration of housing affordability continued in
Toronto
There were signs of considerable improvement, however, among the smaller markets of Australia. Gladstone (QLD) achieved a moderately unaffordable rating, with a median multiple of 3.9. Townsville (QLD) and Latrobe (VIC) tied for fourth most affordable market, with a seriously unaffordable Median Multiple of 4.3. For the first time in the 11 years of the Demographia International Housing Affordability Survey, Australia had markets that were rated as affordable. The most affordable market was Karratha, in Western Australia's Pilbara, with a median multiple of 2.6. Kalgoorlie, also in Western Australia was the second most affordable market, with a median multiple of 2.8. These improvements appear related to resource industry related demand decreases. 3.2 Canada Canada had a seriously unaffordable major market Median Multiple of 4.3 in 2014 and a moderately unaffordable Median Multiple of 3.9 overall. Major Markets: Canada's major metropolitan area housing affordability was seriously unaffordable, with a Median Multiple of 4.3. Vancouver retained its longstanding record among the worst markets for housing affordability. Vancouver's Median Multiple increased from 10.3 in 2013 to 10.6 in 2014. This represents a doubling from the 1st Annual Demographia International Housing Affordability Survey. The deterioration of housing affordability continued in Toronto under the province of Ontario's urban containment policy, now reaching 6.5. This is an increase of more than 65 percent in the 11 years of the Demographia International Housing Affordability Survey (Figure 6). All Markets: Among all markets, housing in Canada is remained moderately unaffordable with a Median Multiple of 3.9. Housing had been affordable overall in Canada as late as 2000. Canada's most affordable market again was Moncton (NB), with a Median Multiple of 2.2. Both Saint John (NB) and Fredericton (NB) had Median Multiples of 2.5. Other affordable markets included Windsor (ON), at 2.8 and Charlottetown (PEI), at 2.9.
0
1
2
3
4
5
6
7
8
9
10
11
2004
2006
2008
2010
2012
2014
TorontoMontrealVancouverOttawaCalgaryEdmonton
Figure 6
Housing Affordability Trend: Canada MEDIAN MULTIPLE: MAJOR MARKETS: 2004-2014
Hong Kong, had the least affordable housing for the fifth straight year, with a Median Multiple of 17.0,
the highest ever recorded.
Dublin' s affordability loss could indicate a trend toward
" Housing Bubble II"
Four of the five least affordable metropolitan markets were in British Columbia. Vancouver was the least affordable. Victoria ranked second least affordable (6.9), Kelowna ranked fourth least affordable (6.4) and the Fraser Valley ranked fifth least affordable (6.1). Toronto ranked third least affordable out of all markets in Canada. 3.3 China Hong Kong is China's only market in the Demographia International Housing Affordability Survey. The Economist now publishes housing affordability for 40 additional metropolitan areas in China, which is summarized in Section 4. Hong Kong's housing affordability appears to be on a par with the least affordable markets in the Economist Survey. Hong Kong had the least affordable housing for the fifth straight year, with a Median Multiple of 17.0, the highest ever recorded. Housing affordability deteriorated markedly in Hong Kong. In the third quarter of 2014, approximately 48 percent of residential transactions were more than HK$5 million. This compares to only 30 percent for the same period in 2013. At the same time, there was little change in household median income. The 2014 Median Multiple of 17.0, was up significantly from last year's 14.9. Hong Kong's housing affordability was far better in the early 2000's. According to The Chinese University of Hong Kong's' Quality of Life Index, housing costs relative to median incomes rose approximately 220 percent between 2003 and 2013. Academic research has indicated that house prices have been driven considerably higher by land-use restrictions in Hong Kong.15 3.4 Ireland Ireland had a seriously unaffordable major market Median Multiple of 4.3 in 2014 and a seriously unaffordable Median Multiple of 4.4 overall. Major Market: Dublin, Ireland's only major metropolitan market experienced a substantial deterioration in its housing affordability from a moderately unaffordable 3.7 in 2013 to a seriously unaffordable 4.4 in 2014. Dublin's Median Multiple is climbing strongly (from a low of 3.3). Dublin's affordability loss could indicate a trend toward "Housing Bubble II, which University College, Dublin Economist Colm McCarthy suggested could occur if its urban containment land use policies are not liberalized. All Markets: Overall, Ireland was the most affordable geography in the Survey, with an affordable Median Multiple of 3.0, a worsening from 2013, when the Median Multiple was 2.8.16 With the exception of Cork (3.2), all of the other markets were rated affordable, with Median Multiples of 3.0 or less (Galway, Limerick and Waterford).
15 Hui, C. M. & F. K. Wong (n.d.), "Dynamic Impact of Land Supply on Population Mobility with Evidence from Hong Kong," http://www.prres.net/Papers/Hui_Dynamic_impact_of_land_supply_on_population_mobility.pdf. 16 House prices calculated from the Residential Property Price Register of the Property Services Regulatory Authority.
Tokyo and Osaka-Kobe-Kyoto have the most favorable
affordability multiple of any megacities (over 10 million
residents) in the Demographia Survey.
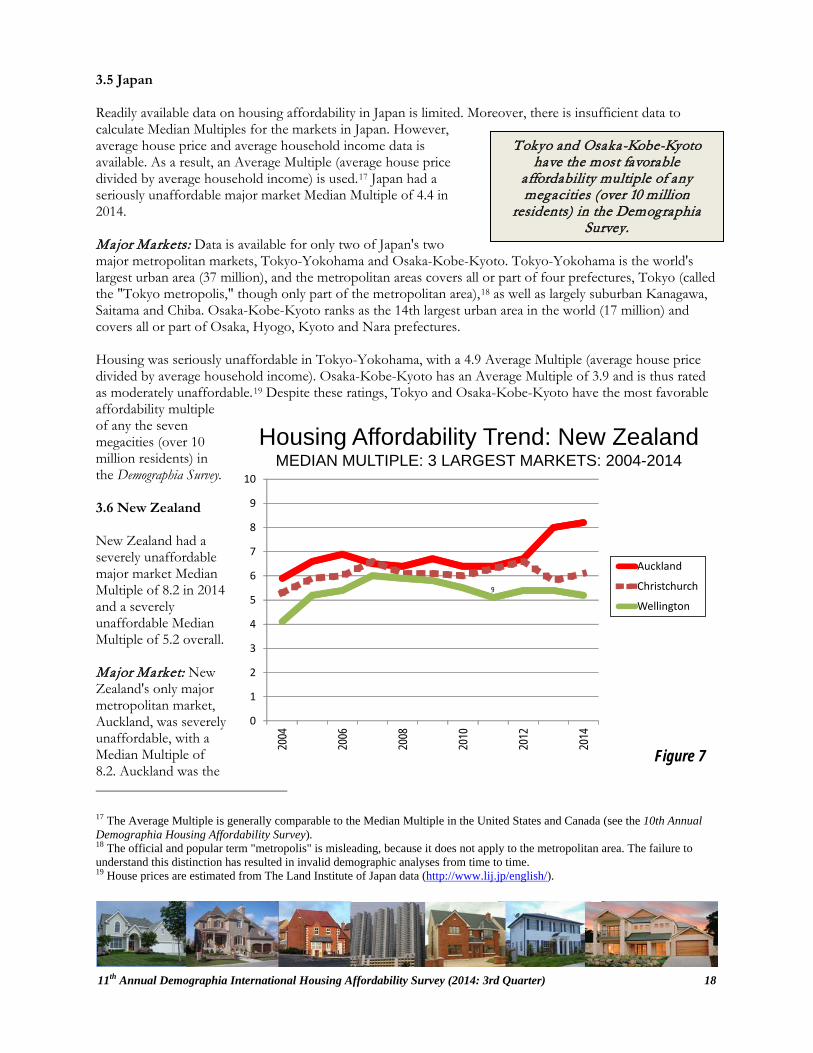
3.5 Japan Readily available data on housing affordability in Japan is limited. Moreover, there is insufficient data to calculate Median Multiples for the markets in Japan. However, average house price and average household income data is available. As a result, an Average Multiple (average house price divided by average household income) is used.17 Japan had a seriously unaffordable major market Median Multiple of 4.4 in 2014. Major Markets: Data is available for only two of Japan's two major metropolitan markets, Tokyo-Yokohama and Osaka-Kobe-Kyoto. Tokyo-Yokohama is the world's largest urban area (37 million), and the metropolitan areas covers all or part of four prefectures, Tokyo (called the "Tokyo metropolis," though only part of the metropolitan area),18 as well as largely suburban Kanagawa, Saitama and Chiba. Osaka-Kobe-Kyoto ranks as the 14th largest urban area in the world (17 million) and covers all or part of Osaka, Hyogo, Kyoto and Nara prefectures. Housing was seriously unaffordable in Tokyo-Yokohama, with a 4.9 Average Multiple (average house price divided by average household income). Osaka-Kobe-Kyoto has an Average Multiple of 3.9 and is thus rated as moderately unaffordable.19 Despite these ratings, Tokyo and Osaka-Kobe-Kyoto have the most favorable affordability multiple of any the seven megacities (over 10 million residents) in the Demographia Survey. 3.6 New Zealand New Zealand had a severely unaffordable major market Median Multiple of 8.2 in 2014 and a severely unaffordable Median Multiple of 5.2 overall. Major Market: New Zealand's only major metropolitan market, Auckland, was severely unaffordable, with a Median Multiple of 8.2. Auckland was the
17 The Average Multiple is generally comparable to the Median Multiple in the United States and Canada (see the 10th Annual Demographia Housing Affordability Survey). 18 The official and popular term "metropolis" is misleading, because it does not apply to the metropolitan area. The failure to understand this distinction has resulted in invalid demographic analyses from time to time. 19 House prices are estimated from The Land Institute of Japan data (http://www.lij.jp/english/).
0
1
2
3
4
5
6
7
8
9
10
2004
2006
2008
2010
2012
2014
Auckland
Christchurch
Wellington
Figure 7
Housing Affordability Trend: New ZealandMEDIAN MULTIPLE: 3 LARGEST MARKETS: 2004-2014
Auckland has been rated severely unaffordable in all
11 Surveys
Singapore has been far more successful in controlling housing affordability than in
markets that have followed the British urban
containment model.
9th least affordable among the 86 major markets. Auckland has been rated severely unaffordable in all 11 Demographia International Housing Affordability Surveys.20
All Markets: Overall, housing in New Zealand was severely unaffordable, with a Median Multiple of 5.2. Christchurch had severe housing affordability, with a Median Multiple of 6.1, while Wellington was also severely unaffordable, at 5.3. The least affordable market other than Auckland was Tauranga-Western Bay of Plenty, with a severely unaffordable 6.8 Median Multiple. Palmerston North Manawatu, (4.5) and Hamilton-Waikato (4.8) were seriously unaffordable. There were no moderately affordable or affordable markets in New Zealand. Housing affordability has declined materially in New Zealand's three largest markets over the last decade (Figure 7).
3.7 Singapore: The Median Multiple in Singapore was 5.0, for a moderately unaffordable rating.21 Singapore has perhaps the most land constrained geography of any major metropolitan area in the world, in being confined to an island and having no mainland periphery. As a result, there is virtually no potential for greenfield development and it is difficult to maintain a competitive supply of land.22
These unique circumstances led the Singapore government to establish a publicly sponsored housing construction program, which sells houses to consumers. The result of this public program is a vibrant private housing market. This program, under the aegis of the Housing and Development Board (HDB) represents nearly 90 percent of the owned market. Further, Singapore has an overall 88 percent rate of home ownership, the highest of any country in the Survey. Buyers are free to sell their own houses, without any further intervention by HDB. Further, there are restrictions on foreign ownership, which may have shielded Singapore from the heightened cost escalation occurring from globalization of the real estate markets with significant land use supply restrictions (such as urban containment policy).
Though housing was seriously unaffordable, Singapore has been far more successful in controlling housing affordability than in markets that have followed the British urban containment model. Housing affordability has virtually spiraled out of control in places like Hong Kong, Vancouver, San Francisco, San Jose, Sydney, Melbourne, Auckland and London, reaching levels of from 8.0 to 17.0. Further, as is typical in urban containment markets, governments have failed to bring the housing cost escalation under control by liberalizing land use regulations.
In contrast to these experiences, the Housing and Development Board had a strong mandate to ensure housing affordability: As HDB transitioned from a program principally aimed at rented social housing to one of home ownership, the 1964 HDB Annual Report, stated its intention to
...encourage a property-owning democracy in Singapore and to enable Singapore citizens in the lower middle income group to own their own homes23
In the intervening years, Singapore has succeeded in this objective. The contrast is great between the present situation and that of 50 years ago, when there were large squatter settlements.
20 House prices are from the Real Estate Institute of New Zealand. 21 Median house price is from the Singapore Real Estate Exchange. 22 Faced with a similar situation, treaties between Switzerland, France and Germany effectively create international metropolitan areas (labor markets) by the use of cross border commuting permits in the Basel and Geneva areas. 23 Quoted in http://www.globalurban.org/GUDMag07Vol3Iss1/Yuen.htm
The United Kingdom had a seriously unaffordable major market Median Multiple of 4.7 in 2014 and a severely unaffordable Median Multiple of 5.8 overall.
Major Markets: Among the major markets, housing was seriously unaffordable in the major markets, with a Median Multiple of 4.7. London (the Greater London Authority) was the least affordable market, with a median multiple of 8.5. Five other major markets were rated as severely unaffordable, including Plymouth & Devon, at 7.3, the London Exurbs (East and Southeast England, virtually all outside the London greenbelt) at 6.9, Bristol-Bath (6.0) as well as Stoke on Trent & Staffordshire and Liverpool & Merseyside (both 5.2). Only Leeds-West Yorkshire was rated as moderately unaffordable, at 4.0.24 There were no affordable housing markets in the United Kingdom.
All Markets: Among all markets, the United Kingdom has a Median Multiple of 5.0. There were no affordable housing markets in the United Kingdom. The most affordable markets were moderately unaffordable, including Belfast (3.9), Falkirk (4.0) and Leeds-West Yorkshire (4.0). Bournemouth & Dorsett was the least affordable of all UK markets, with a Median Multiple of 9.0. Through the years, there have been many analyses documenting the association between UK's urban containment policies and its excessively high house prices. For example, the Blair government commissioned reports by Kate Barker (2004 and 2006), and then a member of the Monetary Policy Committee of the Bank of England, which attributed much of the nation’s housing affordability loss to its urban containment policies (which have evolved from the Town and Country Planning Act of 1947). Sir Peter Hall, et al, expressed concerns about the housing affordability impacts of urban containment in the early 1970s.25 The Organization for Economic Cooperation and Development has raised similar concerns:26
In the United Kingdom, complex and inefficient local zoning regulations and a slow authorisation process are among the reasons for the rigidity of housing supply, underlying both the trend rise of house prices and their high variability.
Most recently, a country report by the International Monetary Fund27 reiterated the problems:
In contrast to other OECD countries, housing cycles in the UK are marked by sharp movements in prices and an inelastic response of residential investment, owing notably to supply constraints. Housing cycles in the UK also tend to have a large impact on economic activity, with booms generally associated with a worsening of household balance sheets and a rise in relatively high-risk mortgages. Alleviating supply-side constraints, notably pertaining to planning restrictions, is imperative for a moderation of housing cycles in the UK, while risks to financial stability in the context of the current house price inflation could be addressed by pursuing targeted macroprudential measures.
In an article entitled "Britain's Self Perpetuating Property Racket," Financial Times Chief Financial Commentator Martin Wolf evaluated Britain's urban containment policies:"
24 Median house prices are calculated from the Land Registry of England and Wales, the Registers of Scotland and Northern Ireland Residential Property Price Index. 25 Hall, P. (1973). The Containment of Urban England. London: Allen and Unwin 26 http://www.oecd.org/officialdocuments/publicdisplaydocumentpdf/?doclanguage=en&cote=ECO/WKP(2006)3 27 International Monetary Fund, Country Report: United Kingdom: Selected Issues, http://www.imf.org/external/pubs/ft/scr/2014/cr14234.pdf, 2014.
Collapsing supply and soaring prices: nothing could better indicate severe constraints on supply. Those who do not know better will say that supply is constrained because building land is limited in a small and densely populated island. This is true, but not for physical reasons The restrictions on land availability are man-made. They are due to a control system of baroque complexity that has not only constrained supply, but, far worse, has created a set of powerful vested interests in its continuation. Among those interests are local residents, homeowners in general and the banks that finance them. In a genteel British way, this is a corrupt arrangement whose result is to benefit the haves at the expense of have-nots.
Wolf also notes the connection between overly high house prices and rents. This is not just about obstacles to becoming an owner occupier. High house prices will also raise rents. They will ultimately force people to live in more cramped conditions than would occur without limits on supply.
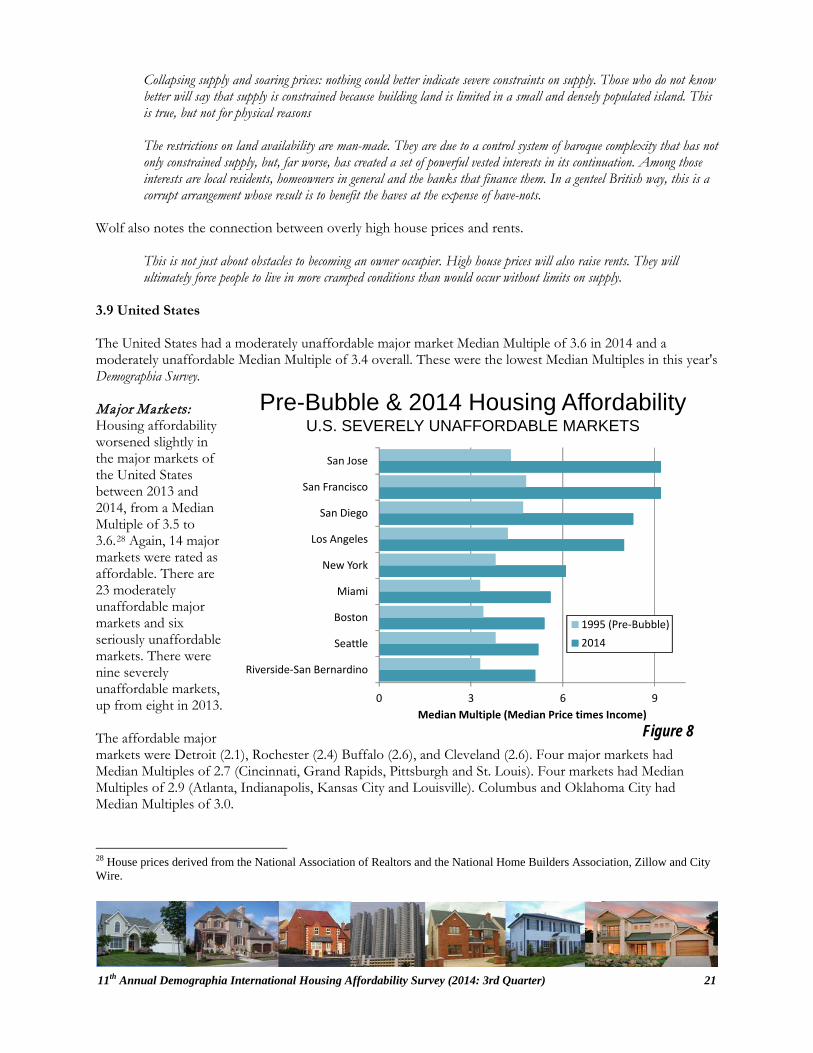
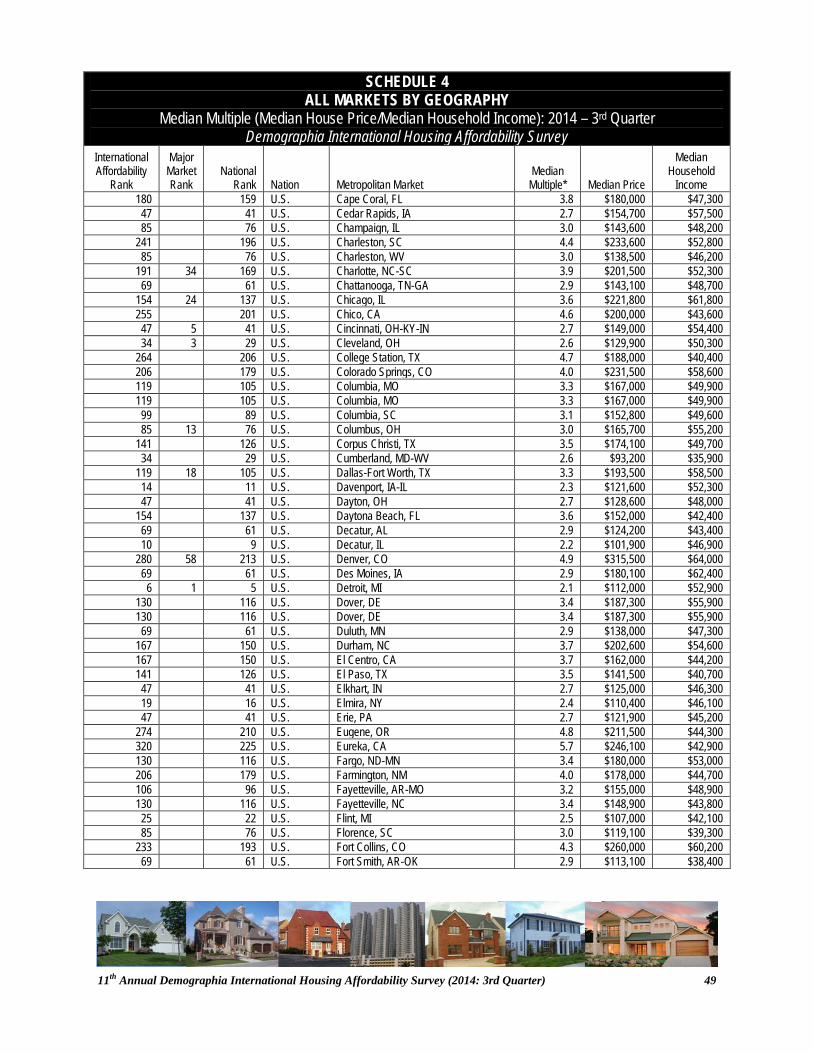
3.9 United States The United States had a moderately unaffordable major market Median Multiple of 3.6 in 2014 and a moderately unaffordable Median Multiple of 3.4 overall. These were the lowest Median Multiples in this year's Demographia Survey. Major Markets: Housing affordability worsened slightly in the major markets of the United States between 2013 and 2014, from a Median Multiple of 3.5 to 3.6.28 Again, 14 major markets were rated as affordable. There are 23 moderately unaffordable major markets and six seriously unaffordable markets. There were nine severely unaffordable markets, up from eight in 2013. The affordable major markets were Detroit (2.1), Rochester (2.4) Buffalo (2.6), and Cleveland (2.6). Four major markets had Median Multiples of 2.7 (Cincinnati, Grand Rapids, Pittsburgh and St. Louis). Four markets had Median Multiples of 2.9 (Atlanta, Indianapolis, Kansas City and Louisville). Columbus and Oklahoma City had Median Multiples of 3.0.
28 House prices derived from the National Association of Realtors and the National Home Builders Association, Zillow and City Wire.
Housing affordability is considerably worse in each
of the severely unaffordable markets than
before the start of the housing bubble
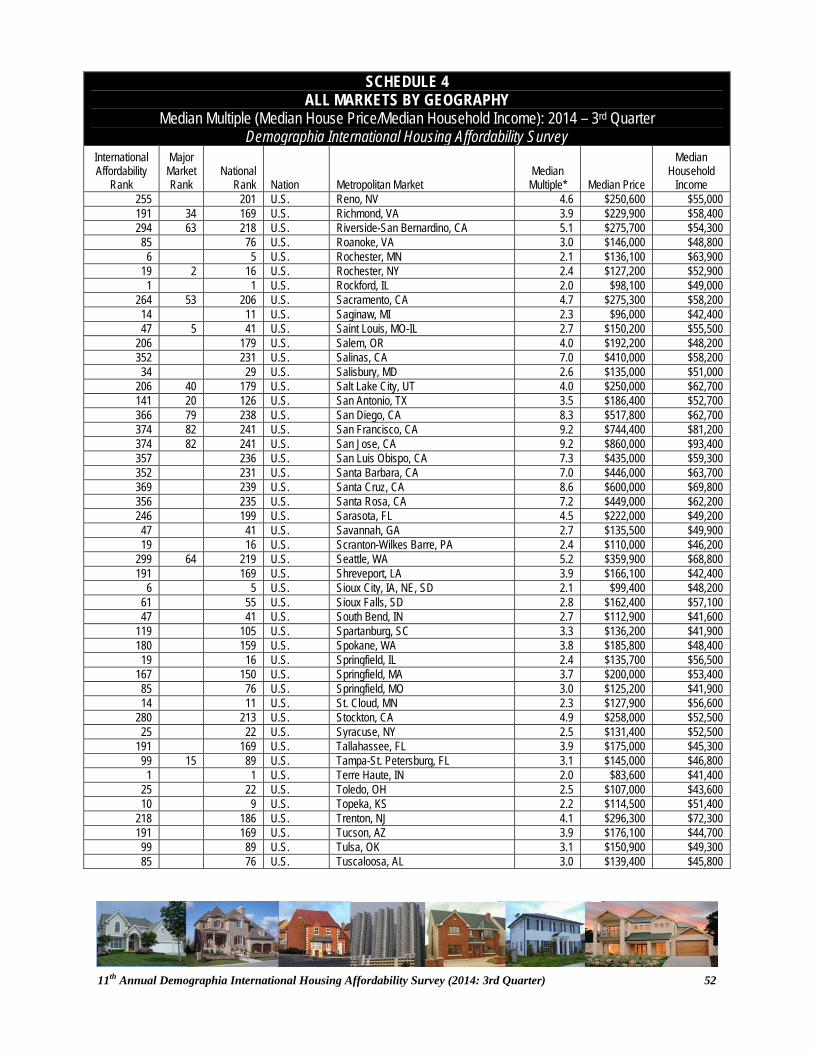
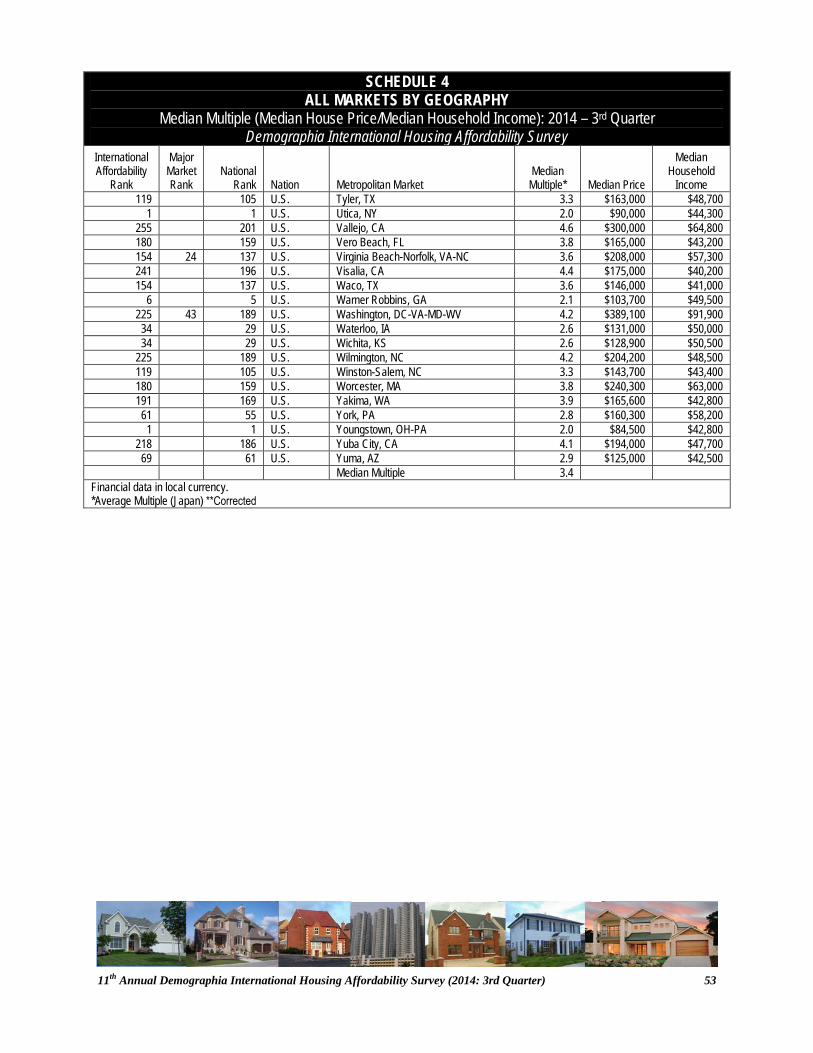
Among the nine severely unaffordable markets, the least affordable were San Francisco (9.2), San Jose (9.2), San Diego (8.3) and Los Angeles (8.0). New York (6.1), Miami (5.6), Boston (5.4), Seattle (5.2) and Riverside-San Bernardino (5.1) were also severely unaffordable. Eight of these markets were severely unaffordable in 2013. Housing affordability deteriorated sufficiently in Riverside-San Bernardino to be reclassified as severely unaffordable in 2014. Each of the severely unaffordable markets has restrictive land use regulation, principally urban containment policy. Housing affordability is considerably worse in each of the severely unaffordable markets than before the start of the housing bubble. In San Jose, the Median Multiple was up from 4.2 in 1995 to 9.2 in 2014, an increase of 113 percent. In San Francisco, the Median Multiple was up from 4.8 in 1995 to 9.2, an increase of 92 percent. In Los Angeles, Median Multiple was up from 4.2 in 1995 to 8.0, an increase of 92 percent. Overall, among the nine severely unaffordable markets, the Median Multiple increase averages 73 percent (Figure 8). The continuing elevation of Median Multiples, even beyond the already high pre-bubble levels further indicates the impacts of urban containment policy. The return of more normal demand conditions should have restored housing affordability at least to its pre-bubble levels, or even to historical norms (Section 1.2). Among the ten largest metropolitan markets in the United States (ranging in size from five million to 20 million residents), one was affordable (Atlanta) four are moderately unaffordable (Dallas-Fort Worth, Houston, Philadelphia and Chicago). One major metropolitan market seriously unaffordable (Washington) and four are severely unaffordable (Los Angeles, New York, Miami and Boston). The Median Multiple trends from 2004 through 2014 are indicated in Figure 9. All Markets: Among all US markets, the most affordable markets were Rockford (IL), Terre Haute (IN), Utica (NY), and Youngstown (OH-PA), all at 1.7. Four metropolitan areas had a Median Multiple of 2.1, including Rochester (MN), home of the Mayo Clinic, Sioux City (IA-NE-SD), Warner Robbins (GA) and major market Detroit Outside of major markets San Francisco and San Jose, Honolulu was the least affordable market in the US, which at 9.0. Honolulu also ranked 371st in international housing affordability. Other least affordable markets in the US were in California, Santa Cruz
0
1
2
3
4
5
6
7
8
9
10
11
12
2004
2006
2008
2010
2012
2014
New YorkLos AngelesChicagoDallas-Fort WorthHoustonPhiladelphiaWashingtonMiamiAtlantaBoston
Figure 9
Housing Affordability Trend: United StatesMEDIAN MULTIPLE: 10 LARGEST MARKETS: 2004-2014
The least affordable market ... was Shenzhen ... bordering Hong Kong, with an Average Multiple of
19.6. This is somewhat higher than Hong Kong's 17.0 Median Multiple though larger houses in
Shenzhen may be a cause.
Chinas' overall housing affordability multiple was 8.6,
higher than the other countries in the Demographia Survey.
(8.6), San Luis Obispo (7.3), Santa Rosa (7.2), Napa (7.1), Salinas (7.0), and Santa Barbara (7.0). They were joined by Kahului (Maui), in Hawaii, at 7.0. Overall, the US Median Multiple was 3.4 (moderately unaffordable), the same as in 2013. The United States had 88 affordable markets, 97 and moderately unaffordable markets, 32 seriously unaffordable markets and 25 severely unaffordable markets. 4. OTHER SURVEYS: CHINA AND KOREA Other organizations publish surveys using housing affordability multiples similar to the Median Multiple, including The Economist in China and Kookmin Bank in Korea (South Korea). 4.1 China The Economist produces the China Index Housing Affordability by City, which rates housing affordability in 40 major metropolitan areas of China, though excludes Hong Kong. The Economist index uses an Average Multiple, a ratio between average house prices and average household incomes. The Average Multiple is used by the Demographia International Housing Affordability survey for markets in Japan because median income data is not readily available. The Economist reports its index based on a standard house size of 100 square meters (1,076 square feet). The Economist data indicates that Chinas' overall housing affordability multiple was 8.6, higher than the other countries in the Demographia Survey. Nonetheless, The Economist reports that it s China's 40 city housing affordability multiple has fallen from 11.7 in 2010, which is the result of declining house prices and increasing household incomes. For years, there have been press reports of high housing affordability multiples in China. The Economist data indicates that this has been true in some cities. Shenzhen had reached an average multiple of nearly 25 in 2010. An even higher average multiple of 27 was recorded in Beijing in 2010. The least affordable market in the current (August 2014) report was Shenzhen, the megacity bordering Hong Kong, with an Average Multiple of 19.6. This is somewhat higher than Hong Kong's 17.0 Median Multiple, though larger houses in Shenzhen may be a cause. However, the house size (100 square meters) used by the Economist is more than double the size of the average house in Hong Kong (45 square meters),29 which could indicate that overall average or median house prices are lower in Shenzhen than Hong Kong. Beijing had an Average Multiple of 15.6 and was the second least affordable major market in China. China's other megacities (over 10 million population) had lower housing affordability multiples. Shanghai had a housing affordability multiple of 12.8 and Guangzhou has an Average Multiple of 11.4. Tianjin, approximately 150 kilometers (90miles) from Beijing has a housing affordability multiple of 11.2.
29See the 10th Annual Demographia International Housing Affordability Survey.
Korea' s overall major market housing affordability multiple was 3.7 in 2013, which is competitive with the 3.6 of
the United States ...
... some metropolitan areas rated in the ... Demographia Survey would rank in the less
affordable half of the Chinese market ... such as Vancouver, Sydney, San Francisco, San
Jose, Honolulu and Melbourne.
Generally, housing affordability is less severe in the interior cities than on the East Coast. For example, Changsha (capital of Hunan) had an Average Multiple of 5.9, and Kunming (capital of Yunnan) 6.6. The two leading metropolitan areas of China's Red Basin, Chengdu (7.4), capital of Sichuan and Chongqing (7.1) were somewhat higher. Hohhot, the capital of Inner Mongolia (Nei Mongol) had the lowest housing affordability multiple in China, at 4.9. Despite its costly housing, some metropolitan areas rated in the 11th Annual Demographia International Housing Affordability Survey would rank in the less affordable half of the Chinese market. These include Hong Kong, Vancouver, Sydney, San Francisco, San Jose, Honolulu (which will soon achieve major metropolitan area status) and Melbourne. 4.2 Korea Kookmin Bank periodically produces a housing affordability multiples for major markets in South Korea (the Republic of Korea). The Kookmin Bank Survey uses disposable household income, rather than gross household income. The Kookmin Bank housing affordability multiples were developed by adjusting the September of 2013 data to account for the national gross income to disposable income ratio. The least affordable market was the municipality of Seoul, with an Average Multiple of 7.7. Shlomo Angel describes how Seoul's urban containment policy (greenbelt) transformed an affordable housing market into one that was severely unaffordable (as it remains today between1970 and 1990. Angel also cites the "particularly deleterious effect on low-income populations." 30 Housing affordability in the Seoul suburban and exurban markets was less severe. Gyeonggi had a multiple of 5.4 and Incheon had a multiple of 5.1. Guanju and Ulsan were the most affordable markets, with an Average Multiple of 2.9.
30 Angel, Shlomo. Planet of Cities. Cambridge, Mass.: Lincoln Institute of Land Policy, 2012. Pp. 42-45.
0 3 6 9 12 15 18
United States
Korea
Ireland
Japan
Canada
United Kingdom
Singapore
Australia
New Zealand
China: 40 Other Cities
China: Hong Kong
Housing Affordability Multiple
DemographiaThe EconomistKookmin Bank (2013)
Figure 10
National Major Market Affordability: 2014RESULTS: ECONOMIST, KOOKMIN & DEMOGRAPHIA
Korea's overall major market housing affordability multiple was 3.7 in 2013, which is competitive with the 3.6 of the United States, which has the most favorable housing affordability multiple in the 2014 Survey. 4.3 Comparisons with the Demographia Survey The housing affordability multiples of The Economist in China and Kookmin Bank in Korea are compared with the national in the 11th Annual Demographia International Housing Affordability Survey in Figure 10. Figure 11 compares housing affordability multiples from selected major metropolitan areas. These data do not account for differences in house sizes (This issue is discussed in the s10th Annual Demographia International Housing Affordability Survey). 5. APPROPRIATE PUBLIC POLICIES In recent decades, urban policy has been sidetracked from the principal priorities of the standard of living and poverty reduction to secondary issues, such as urban form, mode of transport and urban expansion (urban sprawl). 5.1 Universal Principles Virtually all governments consider household economic issues as a top priority, especially increasing the standard of living and reducing or eradicating poverty. This was illustrated in the recent "Group of 20" (G20) summit in Brisbane, Australia when governments from countries as diverse as China, Russia, France, Japan, Canada, Australia and the United States and 14 others adopted a communiqué declaring "better living standards" as a highest priority and a commitment to poverty eradication. The communiqué also indicated an objective of increasing the "G20’s GDP by at least an additional two per cent by 2018." This is an imperative in view of the laggard economic recovery and high unemployment that characterizes so many of the world's larger economies.
0 5 10 15 20
AtlantaGuanju
UlsanChicago
DublinTokyo
HohhotSingapore
Gyeonggi (Seoul Suburbs)Changsha
London ExurbsChongqing
ChengduSeoul (Municipality)
AucklandNanjing
London (GLA)Melbourne
San FranciscoSydney
VancouverShanghai
BeijingHong KongShenzhen
Housing Affordability Multiple
DemographiaThe EconomistKookmin Bank (2013)
Figure 11
3 Survey Housing Affordability: ExamplesDEMOGRAPHIA, THE ECONOMIST, KOOKMIN BANK
5.2 Income, Expenditures and the Standard of Living Yet, increasing income (such as the GDP) does not necessarily result in a corresponding increase in the standard of living. If, for example, household expenditures are forced up at a greater rate than incomes, the standard of living will increase more slowly, or may even decline. The standard of living is not determined by gross income, but rather by discretionary income – the amount of money the household has left after taxes and paying for basic necessities, such as housing, transportation, food and clothing. To improve the standard of living and reduce poverty rates, governments need to seek not only higher incomes but also lower household expenditures. Housing is generally the most expensive element in household budgets. Housing costs have been rising relative to incomes in many metropolitan areas, as the Demographia Survey indicates. As a result, there has been a decoupling of house prices in such markets from their historic relationship to household incomes (Section 1.2). This relationship is described in Table 10. After decades of price to income multiples (such as the Median Multiple) at or below 3.0, the market relationship has been replaced in some markets by far higher prices. For example, the cost of owned housing has doubled or even tripled relative to incomes in Vancouver, Sydney, San Francisco, Melbourne, London, Auckland and Hong Kong. In each of these places, and others, households are paying a larger share of their income on housing. Every metropolitan area with severe housing affordability in the 11 year history of the Demographia International Housing Affordability Survey has had significant land supply restrictions (virtually always urban containment policy). This includes even some of the most distressed urban economies, such as Liverpool. Moreover, all of these markets experienced substantial housing cost escalation relative to household incomes following the implementation of urban containment policy.
Table 10 AFFORDABLE HOUSING MARKETS: DEFINITION
For metropolitan areas to rate as 'affordable' and ensure that housing bubbles are not triggered, housing prices should not exceed three times gross annual household earnings. To allow this to occur, new starter housing of an acceptable quality to the purchasers, with associated commercial and industrial development, must be allowed to be provided on the urban fringes at 2.5 times the gross annual median household income of that urban market. The critically important Development Ratios31 for this new fringe starter housing should be 17 - 23% serviced lot / section cost - the balance the actual housing construction. Ideally through a normal building cycle, the Median Multiple should move from a Floor Multiple of 2.3, through a Swing Multiple of 2.5 to a Ceiling Multiple of 2.7 - to ensure maximum stability and optimal medium and long term performance of the residential construction sector.
-Hugh Pavletich Performance Urban Planning
31 The development ratio is the cost of the finished land (underlying infrastructure complete) divided by the house construction cost plus the finished land. This issue is extensively discussed with respect to the United States market in the Demographia Residential Land & Regulation Cost Index.
Higher housing costs can more than offset higher incomes in urban containment markets.
The higher house prices have retarded discretionary incomes, resulting in a lower standard of living. This is despite the impressive real income gains that occurred in some metropolitan markets. Further, housing affordability is likely to worsen even more in the future, with the expectation that mortgage interest rates will rise toward historical levels. At the same time, no major metropolitan market without urban containment policy has ever been rated with severely unaffordable housing over the same 11 years. This includes markets that have had among the strongest demand in the high income world, such as Dallas-Fort Worth, Houston, Atlanta and Austin.32 5.3 Housing Affordability Losses The decoupling of house prices from their historic relationship to household incomes has been missed by many analysts. However, the relative house price increases are a matter of basic economics. Other things being equal, the price of a good or service is likely to increase where supply is limited. In housing, the problem is restrictions on land supply33 which reduces the land available for development, destroying the competitive market for land (referenced as the "competitive land supply" by economist Anthony Downs). This drives up house prices. The same principle can be observed in other sectors of the economy. Most recently, the Organization of Petroleum Exporting Countries (OPEC) has eased its restrictions on supply (production) and the price of oil has fallen 50 percent in just six months.34 Long-time Governor of the Reserve Bank of New Zealand Donald Brash characterized the relationship between house prices and excessive regulation:
...the affordability of housing is overwhelmingly a function of just one thing, the extent to which governments place artificial restrictions on the supply of residential land.
5.4 Comparing Housing Markets: Liberal and Urban Containment Some of the nations included in the Demographia Survey have adopted urban containment policy in virtually all major markets. The United States is unique in having a number of both urban containment markets and liberal markets, where urban containment policy has not been implemented. Huge differences in housing affordability have developed between these two categories of markets in the United States. This has led to unprecedented differences in the cost of living between metropolitan markets, because housing costs vary to a greater degree than those of other expenditure categories in the United States. For example, the least affordable major markets in the United States have Median Multiples of 8.0 or more, while the most affordable major markets have Median Multiples of 3.0 or less.
32 As measured by net domestic migration. http://www.demographia.com/db-bubblehaff.pdf. 33 Urban containment policies can also drive land and house prices up through unnecessarily high development fees and levies. Texas has pioneered an innovative means for shielding local governments from these costs (municipal utility districts). 34June 19 to December 19, 2014 for Brent Crude (from $115.19 to $58.87 per barrel). http://www.eia.gov/dnav/pet/pet_pri_spt_s1_d.htm.
Higher housing costs can more than offset higher incomes in urban containment markets. One analysis found that cost of living adjusted average employee pay in Houston was higher than that of San Jose, despite San Jose's more than one-half greater unadjusted average pay rates.35 The analysis also identified additional examples. These differences are relatively new. As late as the 1970s, house price to income ratios in California were approximately as in the rest of the United States,36 Cost of living differences were much less between US metropolitan areas than before adoption of urban containment policies. The poverty impacts can also be significant. For example, California, which is often thought of as unusually affluent, has the highest poverty rate in the United States, adjusted for housing costs. California's poverty rate is even higher than states with reputations for high poverty rates, such as Mississippi and West Virginia.37 5.5 Consequences of Urban Containment Policy Urban containment policy has been driven by two principal justifications, to prohibit "urban sprawl," and to reduce greenhouse gas (GHG) emissions. "Urban Sprawl:" Since at least 1947, with the adoption of the British Town and Country Planning Act, urban containment policy has been justified by the interest in limiting or even prohibiting urban development on urban fringes and greenfield sites. The principal purpose was to stop "urban sprawl" (expansion of urban development). Cities cover little land area. In the United States, with the world's least dense cities, urbanization accounts for only three percent of the land area.38 In Canada, urbanization covers only three percent of the land in the agricultural belt.39 In Australia, urbanization accounts for only 0.2 percent of the land area.40 Even in England and Wales, built up urban areas cover only 9.6 percent of the land area.41 Further as world population growth slows, there will be limits to the future extent of urbanization. The reductions in agricultural land from improved farm productivity dwarf the land used by cities. One of the frequently cited justifications for urban containment policy is a concern that urbanization will consume enough land to compromise the agricultural production. In fact, nations are routinely producing more with less land. For example, in the United States, agricultural land has been reduced by an area larger than the states of Texas and Oklahoma since 1950, yet production has increased 160 percent.42 In Canada, agricultural land has been reduced by a land area that exceeds the area of the Maritime provinces (New Brunswick, Nova Scotia and Prince Edward Island), and production has increased.43 In Australia, farmland declined by an area
35 http://www.newgeography.com/content/002950-the-cities-where-a-paycheck-stretches-the-furthest 36 William Fischel (1995), Regulatory Takings, Law, Economics and Politics, Cambridge, MA:Harvard University Press, 1995. 37US Census Bureau data. 38 Data from 2010 US Census 39 Calculated from Statistics Canada data. 40 Australian Collaborative Land Use Mapping Project (n.d.), Australia Land Use---At a Glance, adl.brs.gov.au/mapserv/landuse/pdf.../Web_LandUseataGlance.pdf 41 Calculated from 2011 census. 42 http://www.newgeography.com/content/001615-the-declining-human-footprint. Based on data from the US Department of Agriculture. 43 Wendell Cox, Urban Policy: A Time for a Paradigm Shift, Frontier Centre for Public Policy, https://www.fcpp.org/files/1/PS151_UrbanPolicy_JL03F2.pdf and Wendell Cox, Housing Affordability and the Standard of Living in Toronto, Frontier Centre for Public Policy, https://www.fcpp.org/sites/default/files/toronto-housing.pdf. Based on Statistics Canada data.
The reductions in agricultural land from improved farm
productivity dwarf the land used by cities.
In a finding that casts further doubt on urban containment policies, the
Berkeley researchers wrote: " Generally ... no evidence for net GHG benefits of
population density in urban cores or suburbs when considering effects on
entire metropolitan areas."
larger than that of New South Wales between 1981 and 2011,44 while production increased. Indeed, it is likely that the agricultural subsidies in nations such as the United States and Canada artificially increase the amount of agricultural land. New York University professor Shlomo Angel has shown that worldwide there are adequate reserves of cultivatable land sufficient to feed the planet in perpetuity.45 Another rationale for urban containment policy has been to improve housing for less affluent households. Urban containment's failure in this objective was identified early by Sir Peter Hall and his colleagues. In 1973, they found that unprecedented house price increases had occurred in England from its more than two decades of urban containment policy. This, they said had created almost the "reverse effect" of another policy goal, to benefit less affluent households.46 As a recent feature article in The Economist (see PLACES APART: The world is becoming ever more suburban, and the better for it) noted that the only reliable way to stop urban expansion was to stop them forcefully (such as through urban containment policy). Yet, The Economist continued, "But the consequences of doing that are severe" and cites the higher property prices that have been the result:" It has also forced many people into undignified homes, widened the wealth gap between property owners and everyone else..."47 GHG Emissions Reduction: In more recent years, urban containment policy has been justified based on the need to reduce greenhouse gas emissions. Some urban containment plans seek reconfiguring the already built urban form and modifying human behavior. The means of implementation would be substantially higher population densities and transferring travel demand from personal vehicles (principally automobiles) to mass transit. Fortunately, GHG emissions reductions do not need to be costly. A report associated with Britain’s former Prime Minister Tony Blair to the July 2008 G-8 conference stated that the cost of GHG emission reduction could be low and that “the challenge could be met without damaging the economy.”48 Nor do GHG emissions reductions require significant behavioral change. A McKinsey-Conference Board report found sufficient cost-effective GHG reduction strategies to make less driving or higher densities unnecessary. Yet these are two fundamental (and thus unnecessary) two principles of urban containment policy.49 Another McKinsey & Company report has estimated GHG emissions sufficient to achieve IPCC recommended
44Based on Australian Bureau of Statistics data. 45 Angel, Shlomo (2012), Planet of Cities, Lincoln Institute of Land Policies. Available online at http://www.lincolninst.edu/pubs/2094_Planet-of-Cities. 46 Hall, P. (1973). The Containment of Urban England. London: Allen and Unwin, pp. 407-409. 47 Emphasis added 48 Office of Tony Blair and The Climate Group (2008), Breaking the Climate Deadlock A Global Deal for Our Low-Carbon Future: Executive Summary. 49 McKinsey & Company and The Conference Board, “Reducing U.S. Greenhouse Gas Emissions: How Much at What Cost?” 2007. http://www.mckinsey.com/client_service/sustainability/latest_thinking/reducing_us_greenhouse_gas_emissions.
The virtual inevitability of urban containment' s impacts on the standard
of living and poverty renders it both unnecessary and destructive.
reduction rates to 2030 can be achieved at an average cost of minus $9 per ton, with a range of from minus $250 to plus $116.50 McKinsey & Company estimated that 35 percent of the reductions were possible for less than zero.51 For example, there are few if any densification or transportation strategies that can reduce GHG emissions at an average cost of less than zero (as indicated in the more recent McKinsey report). For example, no blue-print has been offered for how to materially replace automobile travel with mass transit while reducing costs, not least because it would be impossible. The higher housing costs that are associated with urban containment policy are an even more significant example. Regretfully, GHG emissions reduction policies are rarely if ever tested against an economic metric, such as is indicated in the McKinsey and Conference Board research. Densification policies, a staple of urban containment policy, have been dismissed as ineffective in a comprehensive policy review by University of California Berkeley Researchers Christopher Jones and Daniel Kammen in an examination of postal code level US data: In a finding that casts further doubt on urban containment policies, the Berkeley researchers wrote: "Generally ... no evidence for net GHG benefits of population density in urban cores or suburbs when considering effects on entire metropolitan areas." They suggest "an entirely new approach of highly tailored community strategies." GHG emissions reductions need to be achieved through cost effective measures. Yet GHG emissions reductions plans have often been costly. A prime example is the recently adopted San Francisco "Plan Bay Area," which achieves virtually all of its GHG emissions reductions through state and federal strategies that were independent from urban containment policy. Urban containment policy has little potential to reduce GHG emissions and its costs are prohibitive. 5.6 Denying Basic Economics Paul Cheshire of the London School of Economics refers to a "fatal mismatch between the operational concepts of demand and supply in markets and the parallel concepts with which the planning system works," in his Urban Containment, Housing Affordability and Price Stability - Irreconcilable Goals.52 Yet, urban containment policy has virtually always been adopted without serious or comprehensive consideration of the predictable housing cost increases and their negative impact on the standard of living.
50 The original figures are stated in 2006 Euros and converted here to 2013$. See: McKinsey and Company (2010), The Impact of the Financial Crisis on Carbon Economics: Version 2.1 of the Global Greenhouse Gas Abatement Cost Curve, http://www.mckinsey.com/~/media/McKinsey/dotcom/client_service/Sustainability/cost%20curve%20PDFs/ImpactFinancialCrisisCarbonEconomicsGHGcostcurveV21.ashx 51The United Nations Intergovernmental Panel on Climate Change (IPCC) indicated that there is a high level of confidence that a cost range of $20 to $50 annually per GHG ton “reached globally in 2020–2030 and sustained or increased thereafter would deliver deep emission reductions by midcentury. Terry Barker, Igor Bashmakov, et al, “Mitigation from a cross-sectoral perspective,” Intergovernmental Panel on Climate Change, 2008, www.ipcc.ch/pdf/assessment-report/ar4/wg3/ar4-wg3-chapter11.pdf p. 660 52 http://www.spatialeconomics.ac.uk/textonly/SERC/publications/download/sercpp004.pdf
No rational political faction would advance a manifesto for lowering the
standard of living or increasing poverty. Yet this is the predictable outcome of
urban containment policy.
However, there is a growing recognition that urban containment policy leads to materially higher house prices. Some governments are leading the way to improve urban policies, such as in New Zealand (see New Zealand Seeks to Avoid "Generation Rent") and Florida (see Florida Repeals Smart Growth Law).
The virtual inevitability of urban containment's impacts on the standard of living and poverty renders it both unnecessary and destructive. The consequences fall most on younger households and low income households. It is these groups that experience the greatest impact of housing cost increase. Older households, many of whom purchased housing when prices were more in line with historical norms, have been largely shielded from the consequences. For those in poverty, the higher house prices make it harder to achieve home ownership. Many younger households face insurmountable financial barriers to home ownership. The lucky ones will inherit homes from their parents --- which is a big step away from legendary urbanologist Sir Peter Hall's "ideal of a property owning democracy."53
5.7 Putting People First
In an editorial leader on urban land use policy, The Economist suggests: A wiser policy would be to plan for huge expansion. Acquire strips of land for roads and railways, and chunks for parks, before the city sprawls into them. The Economist adds: This is not the dirigisme (government planning) of the new-town planner—that confident soul who believes he knows where people will want to live and work, and how they will get from one to the other.
These proposals echo those of the New York University Urban Expansion Program (described by Dr. Shlomo Angel in the introduction to this year's edition of the Demographia International Housing Affordability Survey).
No rational political faction would advance a manifesto for a lower standard of living or greater poverty. Yet this is the predictable outcome of urban containment policy. Governments have (perhaps unwittingly) placed a higher priority on less important issues, such as urban design, urban form, higher densities and mode of transport. To paraphrase economist Martin Wolf (Section 3.8), it is not legitimate for land use policy "to benefit the haves at the expense of have-nots."
Urban policy should focus on the fundamentals --- putting people first.54
53 Hall, P. (1973). The Containment of Urban England. London: Allen and Unwin, pp. 413. 54 Also see: Wendell Cox, Toward more prosperous cities: A framing essay on urban areas, planning, transport and the dimensions of sustainability, http://demographia.com/towardmoreprosperous.pdf.
SCHEDULE 2 MAJOR MARKETS BY GEOGRAPHY (Over 1,000,000 Population)
Median Multiple (Median House Price/Median Household Income): 2014 – 3rd Quarter Demographia International Housing Affordability Survey
International Affordability
Rank
Major Market Rank
National Rank Nation Metropolitan Market
Median Multiple* Median Price
Median Household
Income 85 13 76 U.S. Columbus, OH 3.0 $165,700 $55,200
119 18 105 U.S. Dallas-Fort Worth, TX 3.3 $193,500 $58,500 280 58 213 U.S. Denver, CO 4.9 $315,500 $64,000
6 1 5 U.S. Detroit, MI 2.1 $112,000 $52,900 47 5 41 U.S. Grand Rapids, MI 2.7 $145,500 $53,500
141 20 126 U.S. Hartford, CT 3.5 $233,800 $67,700 141 20 126 U.S. Houston, TX 3.5 $202,500 $58,500 69 9 61 U.S. Indianapolis, IN 2.9 $149,800 $52,100
154 24 137 U.S. Jacksonville, FL 3.6 $186,500 $52,500 69 9 61 U.S. Kansas City, MO-KS 2.9 $165,400 $57,400
191 34 169 U.S. Las Vegas, NV 3.9 $203,000 $52,100 363 77 237 U.S. Los Angeles, CA 8.0 $481,900 $60,000 69 9 61 U.S. Louisville, KY-IN 2.9 $151,200 $51,900 99 15 89 U.S. Memphis, TN-MS-AR 3.1 $148,100 $47,900
316 68 223 U.S. Miami, FL 5.6 $270,000 $47,900 218 42 186 U.S. Milwaukee, WI 4.1 $219,500 $53,000 106 17 96 U.S. Minneapolis-St. Paul, MN-WI 3.2 $219,100 $68,500 154 24 137 U.S. Nashville, TN 3.6 $191,800 $53,000 154 24 137 U.S. New Orleans, LA 3.6 $167,100 $46,900 331 71 228 U.S. New York, NY-NJ-PA 6.1 $410,800 $67,100 85 13 76 U.S. Oklahoma City, OK 3.0 $151,200 $51,100
180 32 159 U.S. Orlando, FL 3.8 $180,000 $47,900 167 29 150 U.S. Philadelphia, PA-NJ-DE-MD 3.7 $231,300 $61,700 180 32 159 U.S. Phoenix, AZ 3.8 $200,500 $52,900 47 5 41 U.S. Pittsburgh, PA 2.7 $140,000 $52,300
274 57 210 U.S. Portland, OR-WA 4.8 $291,300 $60,300 233 45 193 U.S. Providence, RI-MA 4.3 $243,300 $56,200 130 19 116 U.S. Raleigh, NC 3.4 $212,500 $62,900 191 34 169 U.S. Richmond, VA 3.9 $229,900 $58,400 294 63 218 U.S. Riverside-San Bernardino, CA 5.1 $275,700 $54,300 19 2 16 U.S. Rochester, NY 2.4 $127,200 $52,900
264 53 206 U.S. Sacramento, CA 4.7 $275,300 $58,200 47 5 41 U.S. Saint Louis, MO-IL 2.7 $150,200 $55,500
206 40 179 U.S. Salt Lake City, UT 4.0 $250,000 $62,700 141 20 126 U.S. San Antonio, TX 3.5 $186,400 $52,700 366 79 238 U.S. San Diego, CA 8.3 $517,800 $62,700 374 82 241 U.S. San Francisco, CA 9.2 $744,400 $81,200 374 82 241 U.S. San Jose, CA 9.2 $860,000 $93,400 299 64 219 U.S. Seattle, WA 5.2 $359,900 $68,800 99 15 89 U.S. Tampa-St. Petersburg, FL 3.1 $145,000 $46,800
154 24 137 U.S. Virginia Beach-Norfolk, VA-NC 3.6 $208,000 $57,300 225 43 189 U.S. Washington, DC-VA-MD-WV 4.2 $389,100 $91,900
Financial data in local currency. *Average Multiple (Japan)
ALL MARKETS RANKED BY AFFORDABILITY: Most Affordable to Least Affordable Median Multiple (Median House Price/Median Household Income): 2014 – 3rd Quarter
Demographia International Housing Affordability Survey International Affordability
Rank
Major Market Rank
National Rank Nation Metropolitan Market
Median Multiple* Median Price
Median Household
Income 1
1 Ireland Limerick 2.0 € 100,000 € 49,700
1
1 U.S. Rockford, IL 2.0 $98,100 $49,000 1
1 U.S. Terre Haute, IN 2.0 $83,600 $41,400
1
1 U.S. Utica, NY 2.0 $90,000 $44,300 1
1 U.S. Youngstown, OH-PA 2.0 $84,500 $42,800
6 1 5 U.S. Detroit, MI 2.1 $112,000 $52,900 6
5 U.S. Rochester, MN 2.1 $136,100 $63,900
6
5 U.S. Sioux City, IA, NE, SD 2.1 $99,400 $48,200 6
5 U.S. Warner Robbins, GA 2.1 $103,700 $49,500
10
1 Canada Moncton, NB 2.2 $140,600 $63,600 10
2 Ireland Waterford 2.2 € 103,000 € 46,600
10
9 U.S. Decatur, IL 2.2 $101,900 $46,900 10
9 U.S. Topeka, KS 2.2 $114,500 $51,400
14
11 U.S. Davenport, IA-IL 2.3 $121,600 $52,300 14
11 U.S. Kankakee, IL 2.3 $115,900 $50,800
14
11 U.S. Peoria, IL 2.3 $125,400 $53,700 14
11 U.S. Saginaw, MI 2.3 $96,000 $42,400
14
11 U.S. St. Cloud, MN 2.3 $127,900 $56,600 19
16 U.S. Binghamton, NY 2.4 $116,800 $47,800
19
16 U.S. Elmira, NY 2.4 $110,400 $46,100 19
16 U.S. Racine, WI 2.4 $133,300 $55,300
19 2 16 U.S. Rochester, NY 2.4 $127,200 $52,900 19
16 U.S. Scranton-Wilkes Barre, PA 2.4 $110,000 $46,200
19
16 U.S. Springfield, IL 2.4 $135,700 $56,500 25
2 Canada Fredericton, NB 2.5 $167,000 $65,800
25
2 Canada Saint John, NB 2.5 $155,900 $63,400 25
22 U.S. Akron, OH 2.5 $126,000 $51,000
25
22 U.S. Flint, MI 2.5 $107,000 $42,100 25
22 U.S. Ft. Wayne, IN 2.5 $116,600 $46,900
25
22 U.S. Lansing, MI 2.5 $126,000 $50,400 25
22 U.S. Lansing, MI 2.5 $126,000 $50,400
25
22 U.S. Syracuse, NY 2.5 $131,400 $52,500 25
22 U.S. Toledo, OH 2.5 $107,000 $43,600
34
1 Australia Karratha, WA 2.6 $440,000 $171,600 34
29 U.S. Appleton, WI 2.6 $156,500 $59,600
34
29 U.S. Bloomington, IL 2.6 $160,000 $62,600 34 3 29 U.S. Buffalo, NY 2.6 $134,900 $51,600 34
29 U.S. Canton, OH 2.6 $122,000 $46,100
34 3 29 U.S. Cleveland, OH 2.6 $129,900 $50,300 34
SCHEDULE 3 ALL MARKETS RANKED BY AFFORDABILITY: Most Affordable to Least Affordable
Median Multiple (Median House Price/Median Household Income): 2014 – 3rd Quarter Demographia International Housing Affordability Survey
International Affordability
Rank
Major Market Rank
National Rank Nation Metropolitan Market
Median Multiple* Median Price
Median Household
Income 371 240 U.S. Honolulu, HI 9.0 $677,600 $74,900 373 50 Australia Tweed Heads, NSW 9.1 $430,000 $47,400 374 82 241 U.S. San Francisco, CA 9.2 $744,400 $81,200 374 82 241 U.S. San Jose, CA 9.2 $860,000 $93,400 376 84 51 Australia Sydney, NSW 9.8 $812,000 $82,800 377 85 35 Canada Vancouver, BC 10.6 $704,800 $66,400 378 86 1 China Hong Kong 17.0 $4,892,000 $287,000
Financial data in local currency. *Average Multiple (Japan) **Corrected
Median Multiple (Median House Price/Median Household Income): 2014 – 3rd Quarter Demographia International Housing Affordability Survey
International Affordability
Rank
Major Market Rank
National Rank Nation Metropolitan Market
Median Multiple* Median Price
Median Household
Income 180 159 U.S. Cape Coral, FL 3.8 $180,000 $47,300 47 41 U.S. Cedar Rapids, IA 2.7 $154,700 $57,500 85 76 U.S. Champaign, IL 3.0 $143,600 $48,200
241 196 U.S. Charleston, SC 4.4 $233,600 $52,800 85 76 U.S. Charleston, WV 3.0 $138,500 $46,200
191 34 169 U.S. Charlotte, NC-SC 3.9 $201,500 $52,300 69 61 U.S. Chattanooga, TN-GA 2.9 $143,100 $48,700
154 24 137 U.S. Chicago, IL 3.6 $221,800 $61,800 255 201 U.S. Chico, CA 4.6 $200,000 $43,600 47 5 41 U.S. Cincinnati, OH-KY-IN 2.7 $149,000 $54,400 34 3 29 U.S. Cleveland, OH 2.6 $129,900 $50,300
264 206 U.S. College Station, TX 4.7 $188,000 $40,400 206 179 U.S. Colorado Springs, CO 4.0 $231,500 $58,600 119 105 U.S. Columbia, MO 3.3 $167,000 $49,900 119 105 U.S. Columbia, MO 3.3 $167,000 $49,900 99 89 U.S. Columbia, SC 3.1 $152,800 $49,600 85 13 76 U.S. Columbus, OH 3.0 $165,700 $55,200
141 126 U.S. Corpus Christi, TX 3.5 $174,100 $49,700 34 29 U.S. Cumberland, MD-WV 2.6 $93,200 $35,900
119 18 105 U.S. Dallas-Fort Worth, TX 3.3 $193,500 $58,500 14 11 U.S. Davenport, IA-IL 2.3 $121,600 $52,300 47 41 U.S. Dayton, OH 2.7 $128,600 $48,000
154 137 U.S. Daytona Beach, FL 3.6 $152,000 $42,400 69 61 U.S. Decatur, AL 2.9 $124,200 $43,400 10 9 U.S. Decatur, IL 2.2 $101,900 $46,900
280 58 213 U.S. Denver, CO 4.9 $315,500 $64,000 69 61 U.S. Des Moines, IA 2.9 $180,100 $62,400
6 1 5 U.S. Detroit, MI 2.1 $112,000 $52,900 130 116 U.S. Dover, DE 3.4 $187,300 $55,900 130 116 U.S. Dover, DE 3.4 $187,300 $55,900 69 61 U.S. Duluth, MN 2.9 $138,000 $47,300
167 150 U.S. Durham, NC 3.7 $202,600 $54,600 167 150 U.S. El Centro, CA 3.7 $162,000 $44,200 141 126 U.S. El Paso, TX 3.5 $141,500 $40,700 47 41 U.S. Elkhart, IN 2.7 $125,000 $46,300 19 16 U.S. Elmira, NY 2.4 $110,400 $46,100 47 41 U.S. Erie, PA 2.7 $121,900 $45,200
274 210 U.S. Eugene, OR 4.8 $211,500 $44,300 320 225 U.S. Eureka, CA 5.7 $246,100 $42,900 130 116 U.S. Fargo, ND-MN 3.4 $180,000 $53,000 206 179 U.S. Farmington, NM 4.0 $178,000 $44,700 106 96 U.S. Fayetteville, AR-MO 3.2 $155,000 $48,900 130 116 U.S. Fayetteville, NC 3.4 $148,900 $43,800 25 22 U.S. Flint, MI 2.5 $107,000 $42,100 85 76 U.S. Florence, SC 3.0 $119,100 $39,300
233 193 U.S. Fort Collins, CO 4.3 $260,000 $60,200 69 61 U.S. Fort Smith, AR-OK 2.9 $113,100 $38,400
Median Multiple (Median House Price/Median Household Income): 2014 – 3rd Quarter Demographia International Housing Affordability Survey
International Affordability
Rank
Major Market Rank
National Rank Nation Metropolitan Market
Median Multiple* Median Price
Median Household
Income 154 137 U.S. Fort Walton Beach, FL 3.6 $192,500 $54,100 264 206 U.S. Fresno, CA 4.7 $212,000 $44,800 25 22 U.S. Ft. Wayne, IN 2.5 $116,600 $46,900
255 201 U.S. Gainesville, FL 4.6 $181,000 $39,400 154 137 U.S. Gainesville, GA 3.6 $165,000 $45,900 99 89 U.S. Glens Falls, NY 3.1 $171,100 $54,600 47 5 41 U.S. Grand Rapids, MI 2.7 $145,500 $53,500
180 159 U.S. Greeley, CO 3.8 $227,000 $59,800 69 61 U.S. Green Bay, WI 2.9 $153,100 $52,200
106 96 U.S. Greensboro, NC 3.2 $142,500 $44,700 167 150 U.S. Greenville, SC 3.7 $169,800 $45,700 61 55 U.S. Gulfport, MS 2.8 $126,700 $45,800 47 41 U.S. Hagerstown, MD-WV 2.7 $156,900 $57,500
167 150 U.S. Hanford, CA 3.7 $172,000 $46,700 34 29 U.S. Harrisburg, PA 2.6 $150,000 $57,600
141 20 126 U.S. Hartford, CT 3.5 $233,800 $67,700 339 230 U.S. Hilo, HI 6.4 $314,900 $49,400 371 240 U.S. Honolulu, HI 9.0 $677,600 $74,900 141 20 126 U.S. Houston, TX 3.5 $202,500 $58,500 85 76 U.S. Huntsville, AL 3.0 $171,600 $57,000 69 9 61 U.S. Indianapolis, IN 2.9 $149,800 $52,100
154 137 U.S. Jackson, MS 3.6 $161,800 $44,500 154 24 137 U.S. Jacksonville, FL 3.6 $186,500 $52,500 352 231 U.S. Kahului (Maui), HI 7.0 $469,700 $66,800 69 61 U.S. Kalamazoo, MI 2.9 $137,000 $46,600 14 11 U.S. Kankakee, IL 2.3 $115,900 $50,800 69 9 61 U.S. Kansas City, MO-KS 2.9 $165,400 $57,400
106 96 U.S. Kennewick, WA 3.2 $192,900 $59,700 69 61 U.S. Killeen , TX 2.9 $149,000 $51,500
141 126 U.S. Kingston, NY 3.5 $205,900 $59,600 141 126 U.S. Kingston, NY 3.5 $205,900 $59,600 130 116 U.S. Knoxville, TN 3.4 $155,600 $45,900 119 105 U.S. Lake Havasu City, AZ 3.3 $130,000 $39,800 106 96 U.S. Lakeland, FL 3.2 $140,200 $43,300 85 76 U.S. Lancaster, PA 3.0 $173,000 $58,100 25 22 U.S. Lansing, MI 2.5 $126,000 $50,400 25 22 U.S. Lansing, MI 2.5 $126,000 $50,400
154 137 U.S. Laredo, TX 3.6 $147,000 $40,800 191 34 169 U.S. Las Vegas, NV 3.9 $203,000 $52,100 69 61 U.S. Lexington, KY 2.9 $147,300 $51,300 47 41 U.S. Lincoln, NE 2.7 $145,700 $53,300 61 55 U.S. Little Rock, AR 2.8 $135,600 $49,300
363 77 237 U.S. Los Angeles, CA 8.0 $481,900 $60,000 69 9 61 U.S. Louisville, KY-IN 2.9 $151,200 $51,900
264 206 U.S. Madera, CA 4.7 $189,000 $40,600 191 169 U.S. Madison, WI 3.9 $239,400 $60,700 141 126 U.S. Manchester, NH 3.5 $240,300 $68,900
Median Multiple (Median House Price/Median Household Income): 2014 – 3rd Quarter Demographia International Housing Affordability Survey
International Affordability
Rank
Major Market Rank
National Rank Nation Metropolitan Market
Median Multiple* Median Price
Median Household
Income 106 96 U.S. McAllen, TX 3.2 $114,000 $35,800 280 213 U.S. Medford, OR 4.9 $216,000 $44,200 99 15 89 U.S. Memphis, TN-MS-AR 3.1 $148,100 $47,900
225 189 U.S. Merced, CA 4.2 $174,000 $41,500 316 68 223 U.S. Miami, FL 5.6 $270,000 $47,900 218 42 186 U.S. Milwaukee, WI 4.1 $219,500 $53,000 106 17 96 U.S. Minneapolis-St. Paul, MN-WI 3.2 $219,100 $68,500 47 41 U.S. Mobile, AL 2.7 $119,600 $43,800
246 199 U.S. Modesto, CA 4.5 $220,000 $48,900 99 89 U.S. Montgomery, AL 3.1 $142,900 $46,800 34 29 U.S. Muskegon, MI 2.6 $110,000 $42,500
206 179 U.S. Myrtle Beach, SC 4.0 $178,900 $44,400 355 234 U.S. Napa, CA 7.1 $510,000 $72,300 336 229 U.S. Naples, FL 6.2 $342,500 $55,500 154 24 137 U.S. Nashville, TN 3.6 $191,800 $53,000 233 193 U.S. New Haven, CT 4.3 $255,000 $59,700 85 76 U.S. New London, CT 3.0 $191,200 $64,100
154 24 137 U.S. New Orleans, LA 3.6 $167,100 $46,900 331 71 228 U.S. New York, NY-NJ-PA 6.1 $410,800 $67,100 47 41 U.S. Ocala, FL 2.7 $108,000 $39,500
119 105 U.S. Ogden, UT 3.3 $208,000 $64,000 85 13 76 U.S. Oklahoma City, OK 3.0 $151,200 $51,100
180 159 U.S. Olympia, WA 3.8 $230,000 $61,000 61 55 U.S. Omaha, NE-IA 2.8 $155,400 $56,500
180 32 159 U.S. Orlando, FL 3.8 $180,000 $47,900 34 29 U.S. Oshkosh, WI 2.6 $131,500 $50,800
325 226 U.S. Oxnard, CA 5.9 $468,000 $78,900 99 89 U.S. Palm Bay, FL 3.1 $145,000 $47,400
180 159 U.S. Panama City, FL 3.8 $178,500 $46,500 106 96 U.S. Pensacola, FL 3.2 $155,000 $48,300 14 11 U.S. Peoria, IL 2.3 $125,400 $53,700
167 29 150 U.S. Philadelphia, PA-NJ-DE-MD 3.7 $231,300 $61,700 180 32 159 U.S. Phoenix, AZ 3.8 $200,500 $52,900 47 5 41 U.S. Pittsburgh, PA 2.7 $140,000 $52,300
130 116 U.S. Pittsfield, MA 3.4 $184,000 $53,600 141 126 U.S. Port St. Lucie, FL 3.5 $160,000 $46,200 225 189 U.S. Portland, ME 4.2 $233,700 $55,900 274 57 210 U.S. Portland, OR-WA 4.8 $291,300 $60,300 119 105 U.S. Poughkeepsie, NY 3.3 $230,000 $69,300 274 210 U.S. Prescott, AZ 4.8 $195,000 $40,700 233 45 193 U.S. Providence, RI-MA 4.3 $243,300 $56,200 206 179 U.S. Provo, UT 4.0 $242,000 $61,200 106 96 U.S. Punta Gorda, FL 3.2 $142,000 $44,600 19 16 U.S. Racine, WI 2.4 $133,300 $55,300
130 19 116 U.S. Raleigh, NC 3.4 $212,500 $62,900 61 55 U.S. Reading, PA 2.8 $159,000 $57,200
Median Multiple (Median House Price/Median Household Income): 2014 – 3rd Quarter Demographia International Housing Affordability Survey
International Affordability
Rank
Major Market Rank
National Rank Nation Metropolitan Market
Median Multiple* Median Price
Median Household
Income 255 201 U.S. Reno, NV 4.6 $250,600 $55,000 191 34 169 U.S. Richmond, VA 3.9 $229,900 $58,400 294 63 218 U.S. Riverside-San Bernardino, CA 5.1 $275,700 $54,300 85 76 U.S. Roanoke, VA 3.0 $146,000 $48,800
6 5 U.S. Rochester, MN 2.1 $136,100 $63,900 19 2 16 U.S. Rochester, NY 2.4 $127,200 $52,900
1 1 U.S. Rockford, IL 2.0 $98,100 $49,000 264 53 206 U.S. Sacramento, CA 4.7 $275,300 $58,200 14 11 U.S. Saginaw, MI 2.3 $96,000 $42,400 47 5 41 U.S. Saint Louis, MO-IL 2.7 $150,200 $55,500
206 179 U.S. Salem, OR 4.0 $192,200 $48,200 352 231 U.S. Salinas, CA 7.0 $410,000 $58,200 34 29 U.S. Salisbury, MD 2.6 $135,000 $51,000
206 40 179 U.S. Salt Lake City, UT 4.0 $250,000 $62,700 141 20 126 U.S. San Antonio, TX 3.5 $186,400 $52,700 366 79 238 U.S. San Diego, CA 8.3 $517,800 $62,700 374 82 241 U.S. San Francisco, CA 9.2 $744,400 $81,200 374 82 241 U.S. San Jose, CA 9.2 $860,000 $93,400 357 236 U.S. San Luis Obispo, CA 7.3 $435,000 $59,300 352 231 U.S. Santa Barbara, CA 7.0 $446,000 $63,700 369 239 U.S. Santa Cruz, CA 8.6 $600,000 $69,800 356 235 U.S. Santa Rosa, CA 7.2 $449,000 $62,200 246 199 U.S. Sarasota, FL 4.5 $222,000 $49,200 47 41 U.S. Savannah, GA 2.7 $135,500 $49,900 19 16 U.S. Scranton-Wilkes Barre, PA 2.4 $110,000 $46,200
299 64 219 U.S. Seattle, WA 5.2 $359,900 $68,800 191 169 U.S. Shreveport, LA 3.9 $166,100 $42,400
6 5 U.S. Sioux City, IA, NE, SD 2.1 $99,400 $48,200 61 55 U.S. Sioux Falls, SD 2.8 $162,400 $57,100 47 41 U.S. South Bend, IN 2.7 $112,900 $41,600
119 105 U.S. Spartanburg, SC 3.3 $136,200 $41,900 180 159 U.S. Spokane, WA 3.8 $185,800 $48,400 19 16 U.S. Springfield, IL 2.4 $135,700 $56,500
167 150 U.S. Springfield, MA 3.7 $200,000 $53,400 85 76 U.S. Springfield, MO 3.0 $125,200 $41,900 14 11 U.S. St. Cloud, MN 2.3 $127,900 $56,600
280 213 U.S. Stockton, CA 4.9 $258,000 $52,500 25 22 U.S. Syracuse, NY 2.5 $131,400 $52,500
191 169 U.S. Tallahassee, FL 3.9 $175,000 $45,300 99 15 89 U.S. Tampa-St. Petersburg, FL 3.1 $145,000 $46,800
1 1 U.S. Terre Haute, IN 2.0 $83,600 $41,400 25 22 U.S. Toledo, OH 2.5 $107,000 $43,600 10 9 U.S. Topeka, KS 2.2 $114,500 $51,400
218 186 U.S. Trenton, NJ 4.1 $296,300 $72,300 191 169 U.S. Tucson, AZ 3.9 $176,100 $44,700 99 89 U.S. Tulsa, OK 3.1 $150,900 $49,300 85 76 U.S. Tuscaloosa, AL 3.0 $139,400 $45,800
Median Multiple (Median House Price/Median Household Income): 2014 – 3rd Quarter Demographia International Housing Affordability Survey
International Affordability
Rank
Major Market Rank
National Rank Nation Metropolitan Market
Median Multiple* Median Price
Median Household
Income 119 105 U.S. Tyler, TX 3.3 $163,000 $48,700
1 1 U.S. Utica, NY 2.0 $90,000 $44,300 255 201 U.S. Vallejo, CA 4.6 $300,000 $64,800 180 159 U.S. Vero Beach, FL 3.8 $165,000 $43,200 154 24 137 U.S. Virginia Beach-Norfolk, VA-NC 3.6 $208,000 $57,300 241 196 U.S. Visalia, CA 4.4 $175,000 $40,200 154 137 U.S. Waco, TX 3.6 $146,000 $41,000
6 5 U.S. Warner Robbins, GA 2.1 $103,700 $49,500 225 43 189 U.S. Washington, DC-VA-MD-WV 4.2 $389,100 $91,900 34 29 U.S. Waterloo, IA 2.6 $131,000 $50,000 34 29 U.S. Wichita, KS 2.6 $128,900 $50,500
225 189 U.S. Wilmington, NC 4.2 $204,200 $48,500 119 105 U.S. Winston-Salem, NC 3.3 $143,700 $43,400 180 159 U.S. Worcester, MA 3.8 $240,300 $63,000 191 169 U.S. Yakima, WA 3.9 $165,600 $42,800 61 55 U.S. York, PA 2.8 $160,300 $58,200
1 1 U.S. Youngstown, OH-PA 2.0 $84,500 $42,800 218 186 U.S. Yuba City, CA 4.1 $194,000 $47,700 69 61 U.S. Yuma, AZ 2.9 $125,000 $42,500
Median Multiple 3.4
Financial data in local currency. *Average Multiple (Japan) **Corrected
ANNEX: USES, METHODS AND SOURCES Most international housing affordability sources and "city" rating sources focus on higher end housing that would be demanded by executives who might be transferred from one nation to another (expatriates). The Demographia International Housing Affordability Survey is unique in focusing on the middle of the market --- housing affordability for average households. Further, the focus is on metropolitan markets, rather than higher-cost inner areas or expensive neighborhoods. This is an important distinction. The data in the Demographia International Housing Affordability Survey does not relate, for example to Belgravia in London, New York's Upper East Side or Beverly Hills in Los Angeles. It rather encompasses entire metropolitan markets, which for example, in the New York metropolitan area includes more than 20 counties in the states of New York, New Jersey and Pennsylvania55 (where included housing can be 75 miles [120 kilometers] or more from the upscale areas of the urban core, where prices are the highest).
Price-to-income Ratios: Uses and Misuses: The use of house price-to-income multiples (housing affordability multiples) has become more popular in recent years. While the Median Multiple has been most frequently used, other housing affordability multiples have been developed. This is appropriate, so long as parallel and consistently calculated indices are provided. This has not always been the case.
In Australia, housing affordability multiples have been published that compare average household incomes and median house prices. To make valid comparisons between international markets, it would be necessary to also calculate these "average/median" multiples for the markets outside Australia to which comparisons are made (and to provide historical data). However, "average/median" multiples have been inappropriately compared to Median Multiples. This treatment portrays Australian housing affordability, which is among the worst in the high-income world, more favorably than the reality.
Coverage: The nine nations and corresponding metropolitan markets that are included in the 11th Annual Demographia International Housing Affordability Survey have sufficient current sources of house prices and household income data to estimate housing affordability using the Median Multiple (the similar "Average Multiple is used in Japan). Demographia receives periodic requests to expand its coverage to other nations. The addition of continental European nations, mainland China and India has been most frequently requested. Demographia would be pleased to add other nations and will do so wherever consistent data of sufficient quality can be identified. Readers are encouraged to contact the authors with any such information. House Characteristics: The indexes and data on which the Survey is based reflect the overwhelming majority of existing housing in the markets. At the same time, there are differences in house types, housing characteristics and lot size between the geographies covered. The Demographia International Housing Affordability Survey does not adjust the Median Multiples to reflect these differences. For example, the average size of housing, particularly new housing, is abnormally small by New World standards, the United Kingdom and Hong Kong.56
55 As defined by the United States Bureau of Management and the Budget. 56 See 2nd Annual Demographia International Housing Affordability Survey, Pages 16-18.
Methods: Median house price information is obtained from the leading national reporting agencies and includes the housing stock as reported upon. Where only average house prices are available, median house prices are estimated from historic conversion factors, except in Japan. The principal sources are generally real estate industry time series that have become established as authoritative, national sales transaction registries and other government sources. Median household income data is estimated using national census data or surveys for each metropolitan market, where such data is available (such as the 2011 census in Australia, the 2011 National Household Survey in Canada , the 2013 New Zealand census, the annual American Community Survey in the United States and the annual Census and Statistics Department data in Hong Kong). Alternative government data is used to estimate incomes in Ireland and the United Kingdom, where comparable census data has not been identified. The income base is then adjusted to account for changes to produce an up-to-date estimate, using the best available indicators of income changes. Caution is urged in time-series comparisons in individual markets. Changes in data sources, base year income information, housing data sources and geographical definitions can make precise year to year comparisons less reliable. Comparisons should be generally limited to the housing affordability rating categories of "affordable," moderately unaffordable," "seriously unaffordable" and "severely unaffordable."57 Sources: The following principal sources have been consulted:
Australian Bureau of Statistics Australian Property Monitors Bank of Canada Bank of England Bank of Ireland Calgary Real Estate Board Canada Mortgage and Housing Corporation Canadian Home Builders Association Canadian Real Estate Association Census and Statistical Office: Government of Hong Kong Central Statistics Office, Ireland Chambre immobilière du Grand Montréal City Wire (Arkansas) Communities and Local Government (Ministry), United Kingdom Department of the Environment, Heritage and Local Government (Ireland) Edmonton Real Estate Board Federal Reserve (United States) Fédération des chambres immobilières du Québec Harvard University Joint Center on Housing Hawaii Information Service Housing Industry Association (Australia) Ireland Environment, Heritage and Local Government Japan Statistics Bureau John Burns Real Estate Consulting The Land Institute of Japan
57 Demographia attempts to use the most reliable available data at the time of report preparation. This necessitates adopting more representative sources as they become available, including new sources and updates.
Land Registry of England and Wales The Land Registry (Hong Kong) National Association of Home Builders (USA) National Association of Realtors (USA) National Statistics (United Kingdom) Northern Ireland Research and Statistics Agency Real Estate Institute of Australia Real Estate Institute of New South Wales Real Estate Institute of New Zealand Real Estate Institute of Northern Territory Real Estate Institute of Queensland Real Estate Institute of Tasmania Real Estate Institute of Victoria Real Estate Institute of Western Australia Registers of Scotland Reserve Bank of Australia Reserve Bank of New Zealand Residential Property Price Register of the Property Services Regulatory Authority (Ireland) RP Data (realestate.com.au) Singapore Department of Statistics Singapore Real Estate Exchange (SRX) Statistics Canada Statistics New Zealand Toronto Real Estate Board United Kingdom Department of Communities and Local Government United States Department of Commerce: Bureau of Economic Analysis United States Department of Commerce: Bureau of the Census United States Department of Housing and Urban Development Urban Development Institute of Australia Zillow.com
Notes on Figures: Figure 1: House Price-to-income Ratios: Reserve Bank of Australia data. Figure courtesy of Frontier Centre for Public Policy (https://www.fcpp.org/posts/housing-affordability-and-the-standard-of-living-in-toronto) Figure 3: Housing Affordability & Land Regulation: In the United States, more restrictive regulation markets (Table 1) include those classified as “growth management,” “growth control,” “containment” and “contain-lite” in From Traditional to Reformed A Review of the Land Use Regulations in the Nation’s 50 largest Metropolitan Areas (Brookings Institution, 2006) as well as markets Demographia has determined to have significant land rationing (urban containment) and rural zoning (large lot zoning) restrictions (New York, Chicago, Minneapolis-St. Paul, and Washington). Outside the United States, urban containment metropolitan markets are identified based upon the extent of their use of urban containment strategies. This includes all of the United Kingdom (under the Town and Country Planning Act), Ireland (under the National Spatial Strategy), Hong Kong and all of the markets of Australia and New Zealand. In Canada, urban containment policy has been adopted in Toronto, Montréal, Vancouver, Ottawa and Calgary. Markets not classified as “urban containment” are classified as liberal (see Table 1).
Figure 8: Pre-Bubble and 2014 Median Multiples: Demographia Surveys and data from the National Association of Realtors, Joint Center for Housing Studies (Harvard University) and the US Bureau of the Census. Figure 10: Major Market Housing Affordability: The Economist, Kookmin Bank and Demographia Survey. Figure 11: Housing Affordability: 2014 Examples: The Economist, Kookmin Bank and Demographia Survey. Other Figures: Demographia Surveys.
Table 11 Metropolitan Market Selection
Nation Markets Included (Where Complete Data is Available) Australia Metropolitan markets corresponding to urban centres over 50,000 population & Pilbara Canada Metropolitan markets (CMAs) over 100,000 population China Hong Kong Ireland Metropolitan markets over 50,000 population Japan Two largest markets (only markets available) New Zealand Markets corresponding to urban areas over 75,000 population Singapore Singapore United Kingdom Markets corresponding to urban areas over 150,000 population and London Exurbs (E & SE England). United States Metropolitan markets (MSAs) over 200,000 population Selected additional markets.
Footer Illustrations: New Houses (Left to Right): Suburban Kansas City, United States
Suburban Montréal, Canada East of England (London Exurbs), United Kingdom Suburban Tseung Kwan O (Hong Kong) Suburban Dublin, Ireland Suburban Auckland, New Zealand Suburban Adelaide, Australia
BIOGRAPHIES Wendell Cox Wendell Cox is co-author of the Demographia International Housing Affordability Survey. He is a public policy consultant and principal of Demographia, an international public policy firm. He has also served as a visiting professor at the Conservatoire National des Arts et Metiers in Paris (a national university). He is vice-president of CODATU, a Lyon (France) based international research organization dedicated to improving transport in developing world urban areas. He is a contributing editor at newgeography.com and author of the Evolving Urban Form series, which provides development profiles of individual world urban areas. Among his most recent policy reports were Improving the Competitiveness of Metropolitan Areas and Evaluation of Plan Bay Area and a "framing essay" entitled Toward More Prosperous Cities. He is also associated with various public policy organizations. He is a fellow with the Center for Opportunity Urbanism and on the Board of Advisors of the Center for Demographics and Policy at Chapman University. He also holds appointments with the Heritage Foundation (Washington), the Frontier Centre (Winnipeg), the Pacific Research Institute (San Francisco), the Texas Public Policy Foundation, the Independence Institute (Denver), Institut économique de Montréal, the National Center for Policy Analysis (Dallas), the Georgia Public Policy Foundation, the Virginia Institute for Public Policy, the Maryland Public Policy Institute and others. Wendell Cox has lectured widely, including a month long tour to all Australian state and territory capitals and university lectures in the United Kingdom, France, China, Egypt and Australia. He has completed projects in the United States, Western Europe, Canada, Australia and New Zealand in urban policy, demographics and transport. He was appointed to three terms on the Los Angeles County Transportation Commission by Mayor Tom Bradley and to the Amtrak Reform Council by Speaker of the U. S. House of Representatives Newt Gingrich. Demographia annually publishes Demographia World Urban Areas, the only annual list of world urban areas (agglomerations) over 500,000 population with coordinate urban land area, population and population density estimates. Demographia sponsors three internet web sites, including demographia.com, www.publicpurpose.com and www.rentalcartours.net. The www.publicpurpose.com website has been twice honored by the National Journal as one of the nation’s top internet transport sites. He is also author of the Demographia Residential Land and Regulation Cost Index. In 2004 he teamed with Hugh Pavletich of Performance Urban Planning to develop the Demographia International Housing Affordability Survey. Hugh Pavletich Hugh Pavletich, the co-author of the Demographia International Housing Affordability Survey, resides in “severely unaffordable” (6.1 Median Multiple) Christchurch, New Zealand, which since 4 September 2010 has experienced in excess of 13,000 earthquakes. He has written extensively on these issues. He operates the archival website Performance Urban Planning and is the Managing Director of Pavletich Properties Ltd, a commercial property development and investment company.
He commenced his working life as a farm worker and wool classer (wool classifier) in 1967 and moved to Christchurch in 1980, where he started developing small factory units and has developed commercial and industrial property on freehold and Maori leasehold land in other centers of the South Island as well. His industry involvement commenced when elected President of the South Island Division of the Property Council of New Zealand (then the Building Owners & Managers Association – BOMA) soon after its inception in 1991, which he led for four years. He has had extensive involvement with public policy issues of local authority financial management, land use regulation and heritage. In 2004, he was elected a fellow of the Urban Development Institute of Australia (UDIA) for services to the industry. He felt there was a need for an international measure of housing affordability and teamed up with Wendell Cox in 2004, to develop the annual Demographia International Housing Affordability Survey.
Demographia (Wendell Cox Consultancy)
P.O. Box 841 Belleville, Illinois 62269 USA
(St. Louis Metropolitan Region) www.demographia.com