Demographic Transition in Muslim Countries Mohammad Jalal Abbasi-Shavazi Professor of Demography, University of Tehran; Director, National Institute of Population Research, Visiting Fellow, Australian National University Asian Population Forum 2016 Future Directions in Asian Population Research Shanghai, 9-12 October 2016
Transcript
Demographic Transition in Muslim Countries
Mohammad Jalal Abbasi-Shavazi
Professor of Demography, University of Tehran;
Director, National Institute of Population Research,
Visiting Fellow, Australian National University
Asian Population Forum 2016
Future Directions in Asian Population Research
Shanghai, 9-12 October 2016
Take-home Messages …
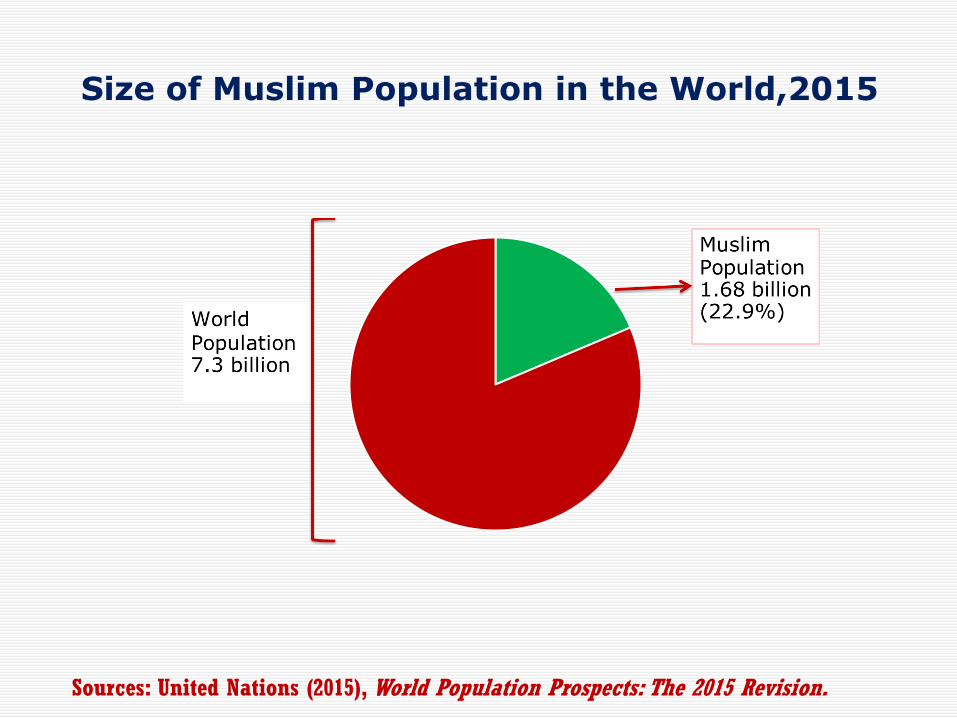
Muslims constitute around 23 % of the world Population, and their population is still growing
Muslim high population growth has lead to young age structure and demographic dividend
Major social and demographic change including educational advancement have been made in Muslim countries though there exists diversity
Take-home Messages
Demographic dividend, despite being an exciting opportunity, is a profound challenge for these countries.
Investment in women’s human capital (education and health) has important implications for maximizing the benefits of the dividend
Outline
Take home messages
Size and Distribution of Muslim Population
Fertility and mortality transitions
Social, economic and political changes
Population composition and demographic dividend
Conclusions: The way forward
Size of Muslim Population in the World,2015
Sources: United Nations (2015), World Population Prospects: The 2015 Revision.
[CATEGORY NAME], [VA
LUE]
m, [PERCENTAGE]
[CATEGORY NAME], [VA
LUE]m, [PERCEN
TAGE]
[CATEGORY NAME], [VALU
E]m, [PERCENT
AGE]
[CATEGORY NAME], [VALU
E]m, [PERCENT
AGE]
[CATEGORY NAME], [VA
LUE]m, [PERCEN
TAGE]
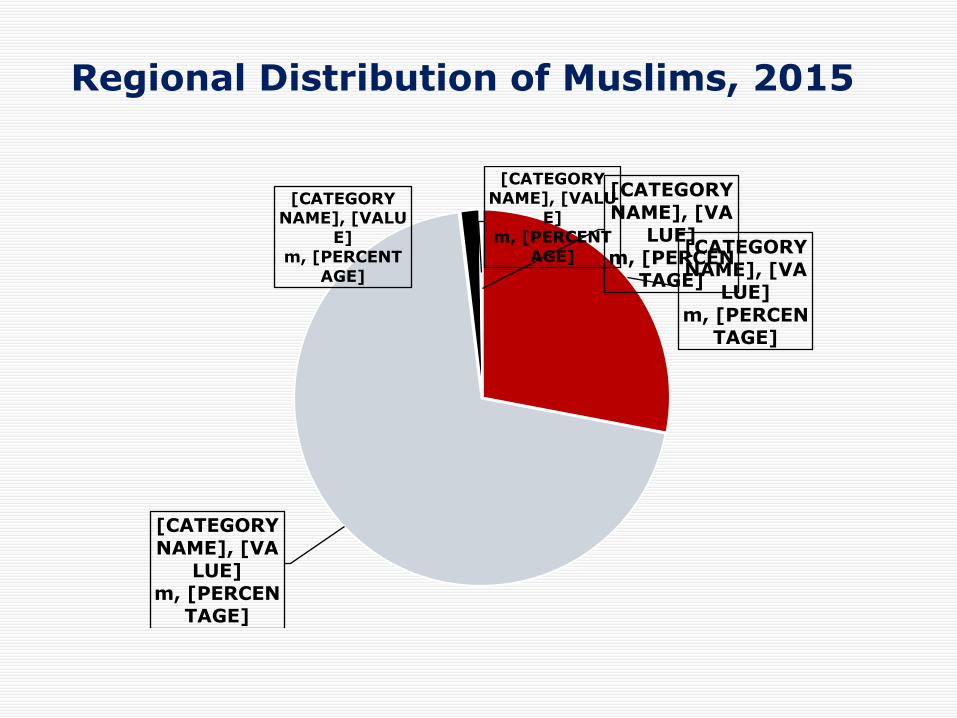
Regional Distribution of Muslims, 2015
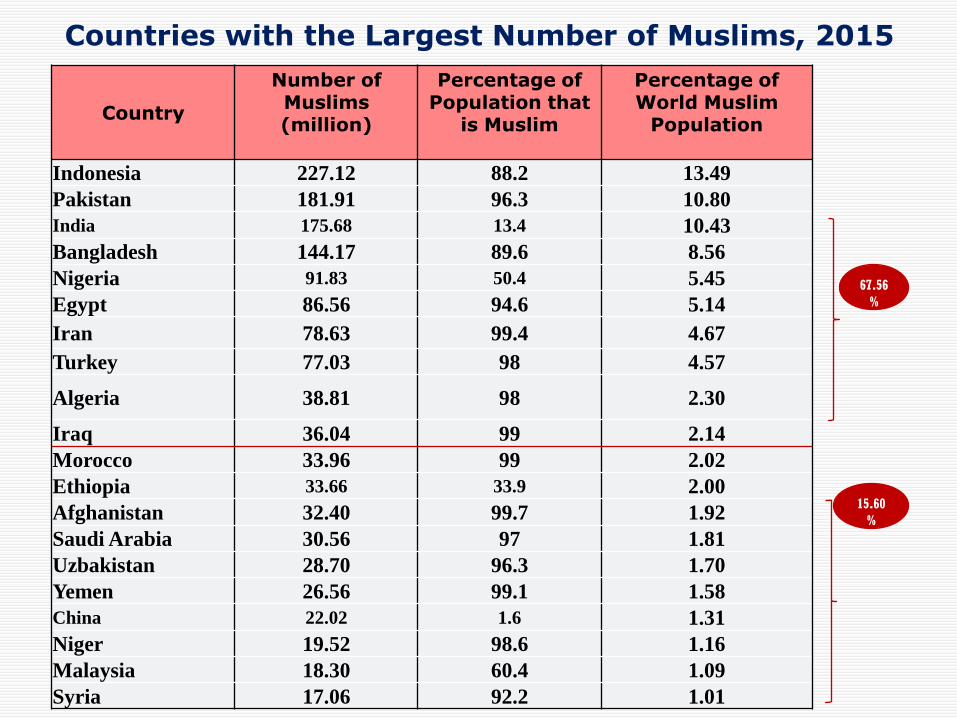
Countries with the Largest Number of Muslims, 2015
67.56 %
15.60 %
Country
Number of Muslims(million)
Percentage of Population that
is Muslim
Percentage of World Muslim
Population
Indonesia 227.12 88.2 13.49
Pakistan 181.91 96.3 10.80
India 175.68 13.4 10.43
Bangladesh 144.17 89.6 8.56
Nigeria 91.83 50.4 5.45
Egypt 86.56 94.6 5.14
Iran 78.63 99.4 4.67
Turkey 77.03 98 4.57
Algeria 38.81 98 2.30
Iraq 36.04 99 2.14
Morocco 33.96 99 2.02
Ethiopia 33.66 33.9 2.00
Afghanistan 32.40 99.7 1.92
Saudi Arabia 30.56 97 1.81
Uzbakistan 28.70 96.3 1.70
Yemen 26.56 99.1 1.58
China 22.02 1.6 1.31
Niger 19.52 98.6 1.16
Malaysia 18.30 60.4 1.09
Syria 17.06 92.2 1.01
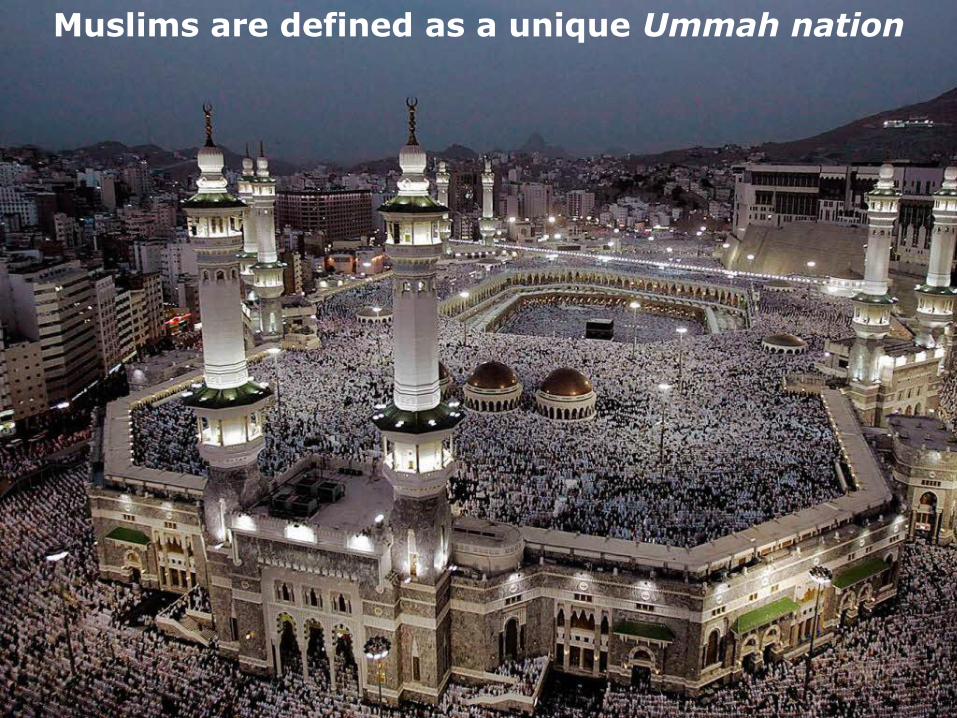
Muslims are defined as a unique Ummah nation
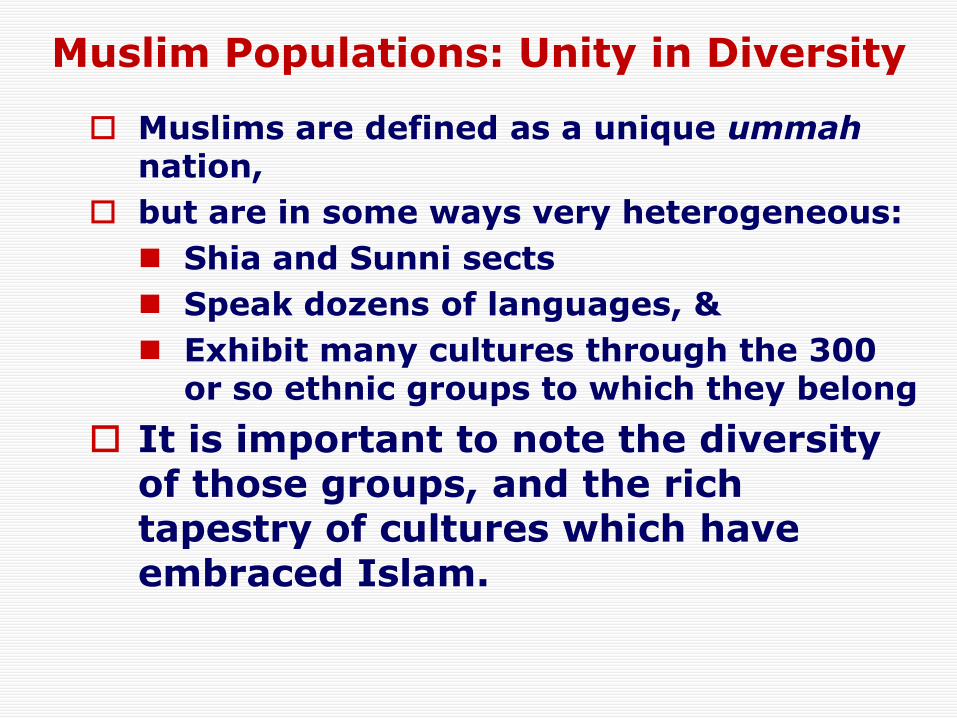
Muslim Populations: Unity in Diversity
Muslims are defined as a unique ummahnation,
but are in some ways very heterogeneous:
Shia and Sunni sects
Speak dozens of languages, &
Exhibit many cultures through the 300 or so ethnic groups to which they belong
It is important to note the diversity of those groups, and the rich tapestry of cultures which have embraced Islam.
Population Dynamics in Muslim countries
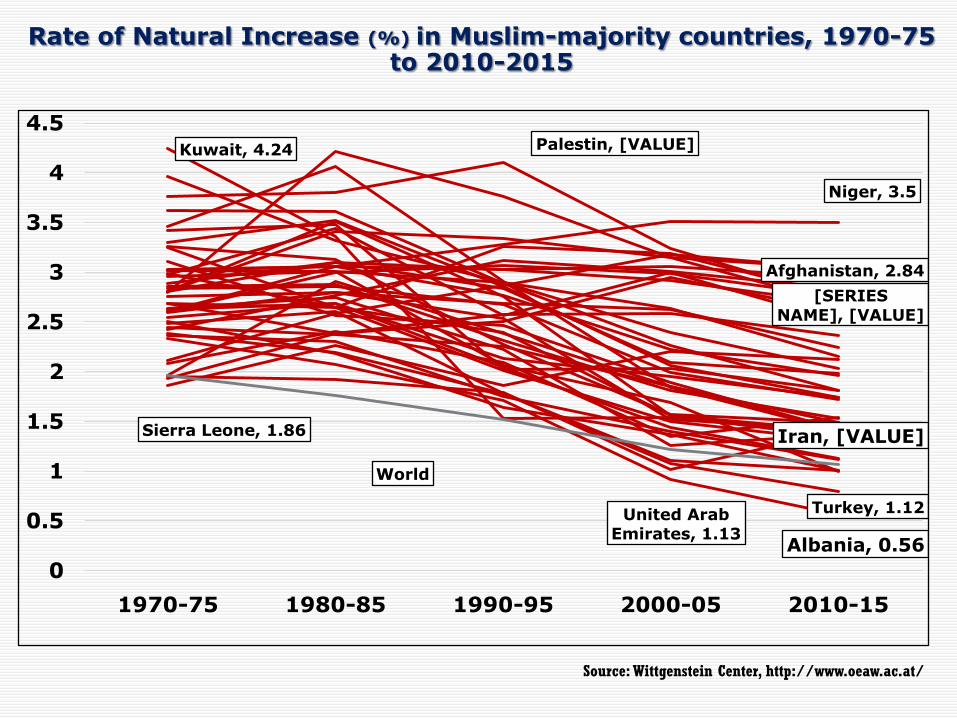
Afghanistan, 2.84
Albania, 0.56
[SERIES NAME], [VALUE]
Palestin, [VALUE]
Iran, [VALUE]
Kuwait, 4.24
Niger, 3.5
Sierra Leone, 1.86
United Arab Emirates, 1.13
Turkey, 1.12
World
0
0.5
1
1.5
2
2.5
3
3.5
4
4.5
1970-75 1980-85 1990-95 2000-05 2010-15
Rate of Natural Increase (%) in Muslim-majority countries, 1970-75 to 2010-2015
Source: Wittgenstein Center, http://www.oeaw.ac.at/
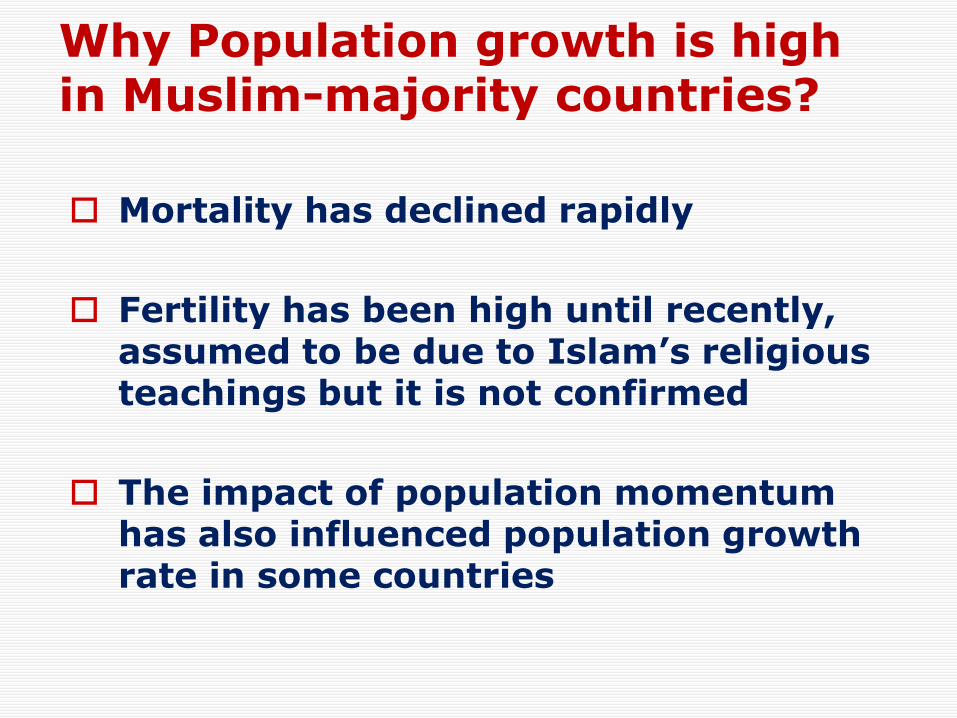
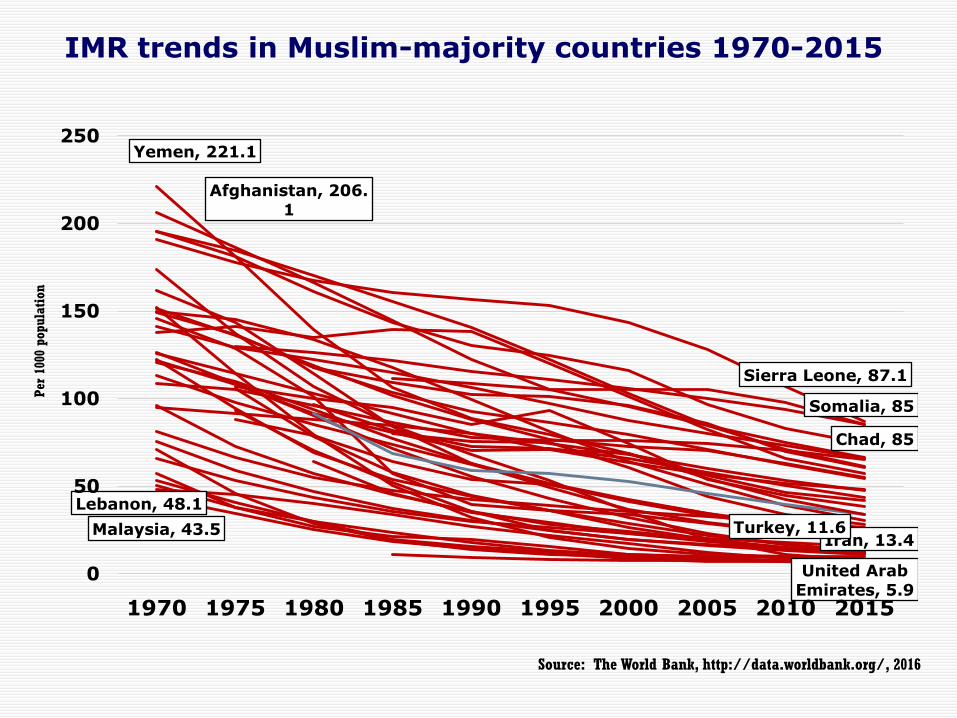
Why Population growth is high in Muslim-majority countries?
Mortality has declined rapidly
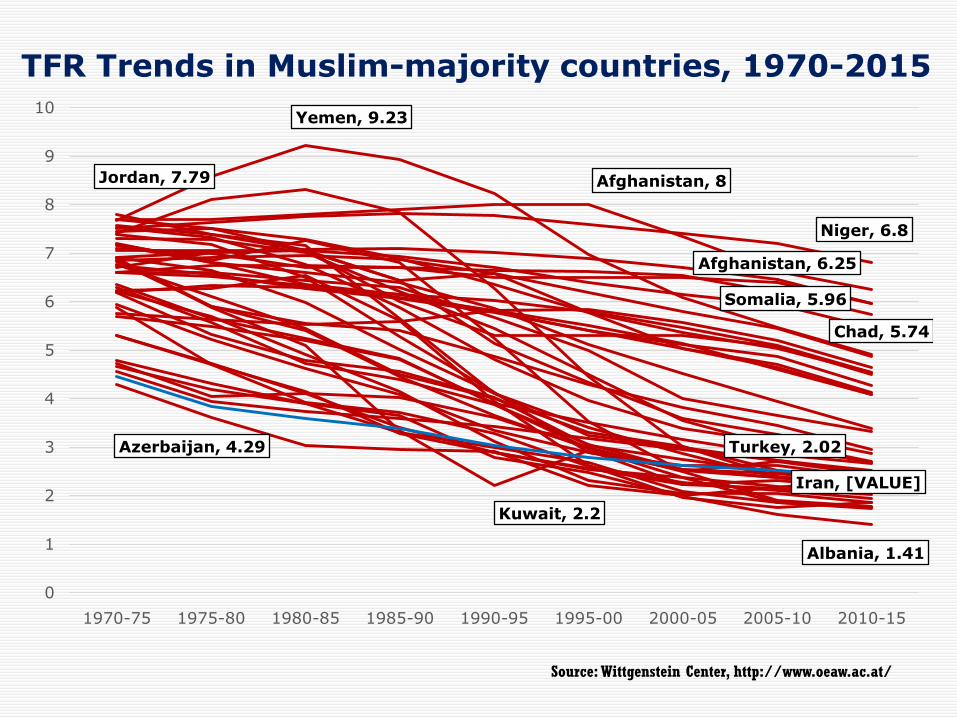
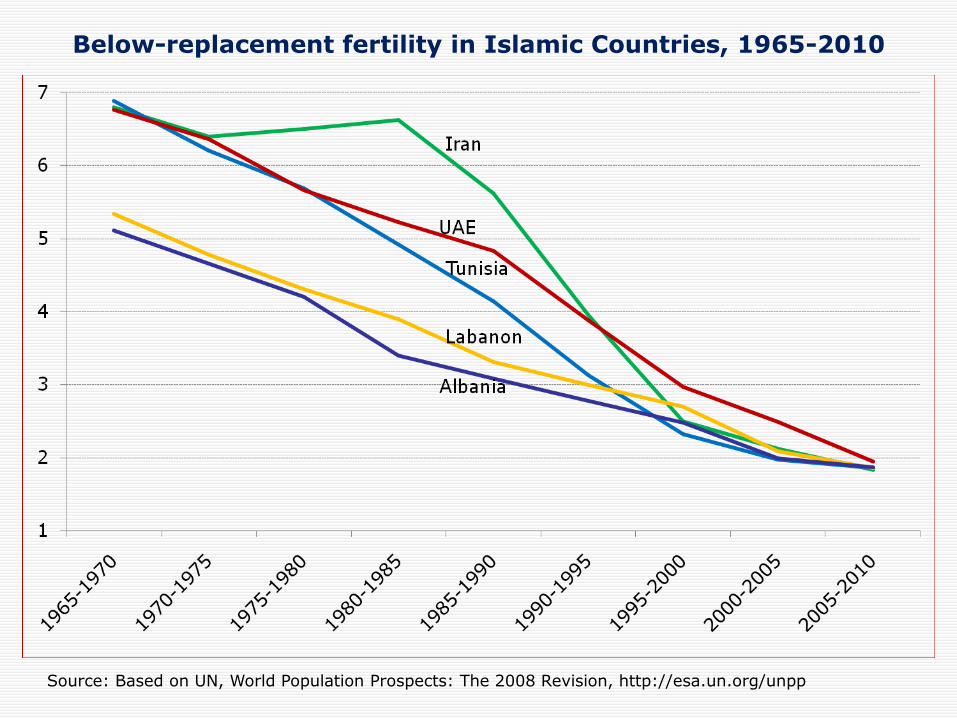
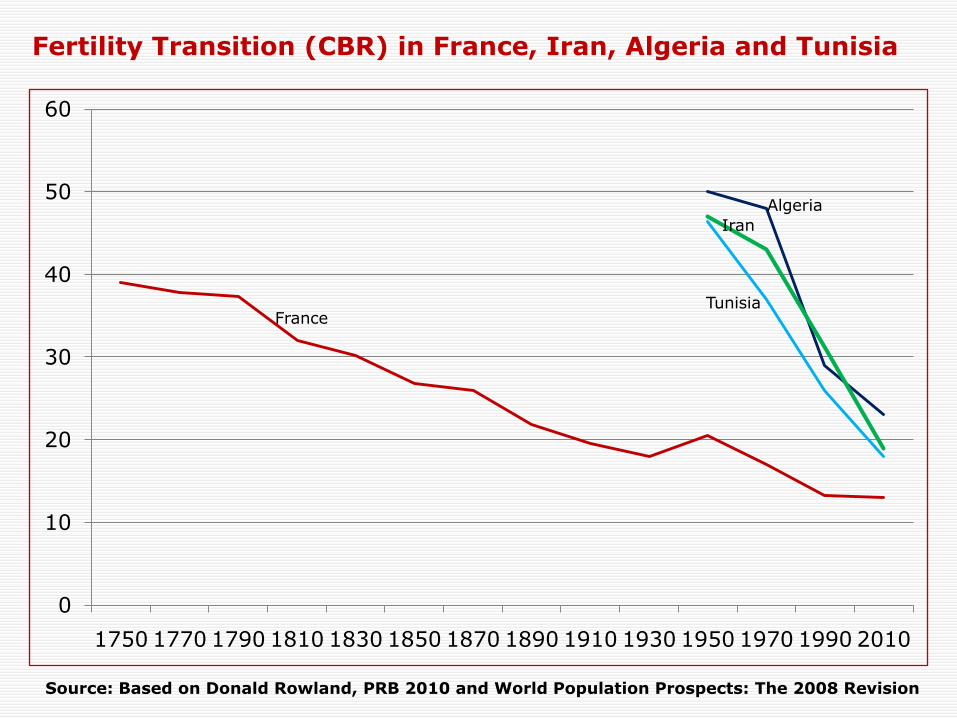
Fertility has been high until recently, assumed to be due to Islam’s religious teachings but it is not confirmed
The impact of population momentum has also influenced population growth rate in some countries
Afghanistan, 206.1
Chad, 85
Iran, 13.4
Lebanon, 48.1
Malaysia, 43.5
Sierra Leone, 87.1
Somalia, 85
Turkey, 11.6
United Arab Emirates, 5.9
Yemen, 221.1
0
50
100
150
200
250
1970 1975 1980 1985 1990 1995 2000 2005 2010 2015
IMR trends in Muslim-majority countries 1970-2015Per
100
0 po
pula
tion
Source: The World Bank, http://data.worldbank.org/, 2016
0
10
20
30
40
50
60
70
80
90
100S
ierra L
eon
e
Ch
ad
Som
ali
a
Mali
Afg
han
ista
n
Pakis
tan
Mau
rit
an
ia
Gu
inea
Bu
rkin
a F
aso
Nig
er
Com
oros
Dji
bou
ti
Gam
bia
Su
dan
Tu
rkm
en
ista
n
Sen
eg
al
Taji
kis
tan
Uzb
ekis
tan
Yem
en
Ban
gla
desh
Azerb
aij
an
Iraq
Morocco
In
don
esia
Alg
eria
Eg
yp
t
Kyrg
yzesta
n
Jord
an
Iran
Alb
an
ia
Sau
di A
rab
ia
Tu
nis
ia
Tu
rkey
Lib
ya
Syria
Om
an
Bru
nei
Mald
ives
Ku
wait
Leb
an
on
Qata
r
Mala
ysia
Un
ited
Arab
Em
irate
s
Bah
rain
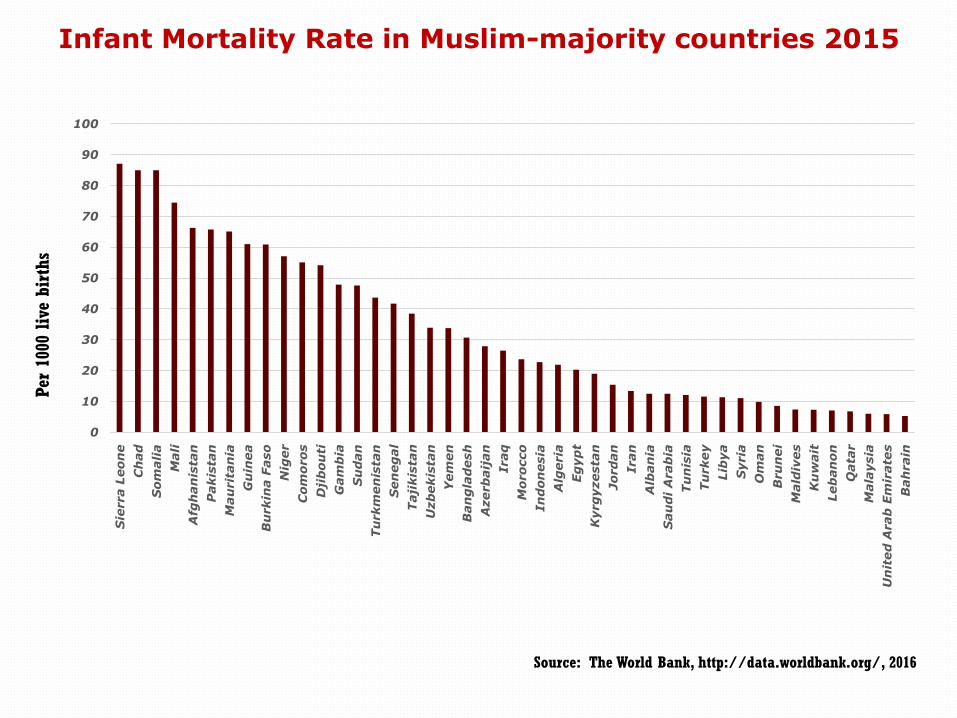
Infant Mortality Rate in Muslim-majority countries 2015
Source: The World Bank, http://data.worldbank.org/, 2016
Per
100
0 live
birth
s
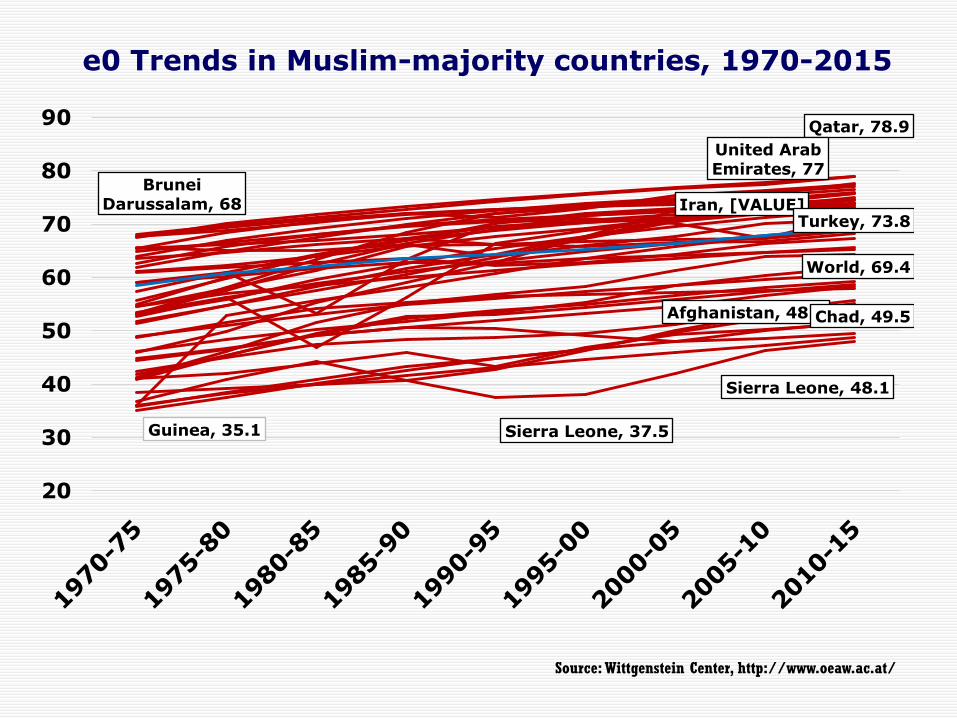
Afghanistan, 48.7
Brunei Darussalam, 68
Chad, 49.5
Guinea, 35.1
Iran, [VALUE]
Qatar, 78.9
Sierra Leone, 37.5
Sierra Leone, 48.1
United Arab Emirates, 77
Turkey, 73.8
World, 69.4
20
30
40
50
60
70
80
90
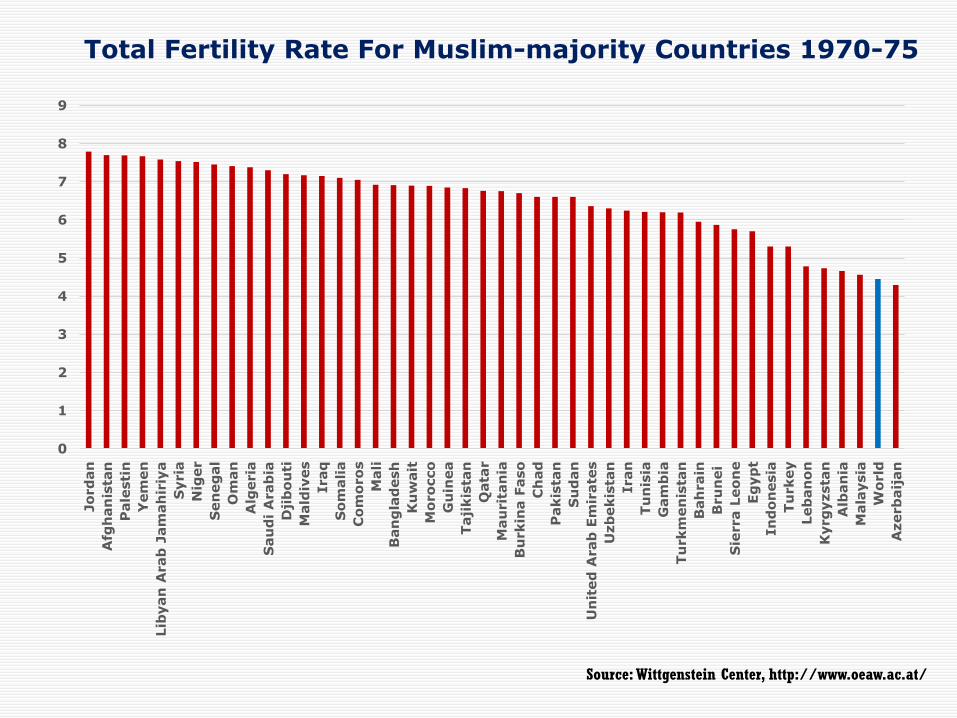
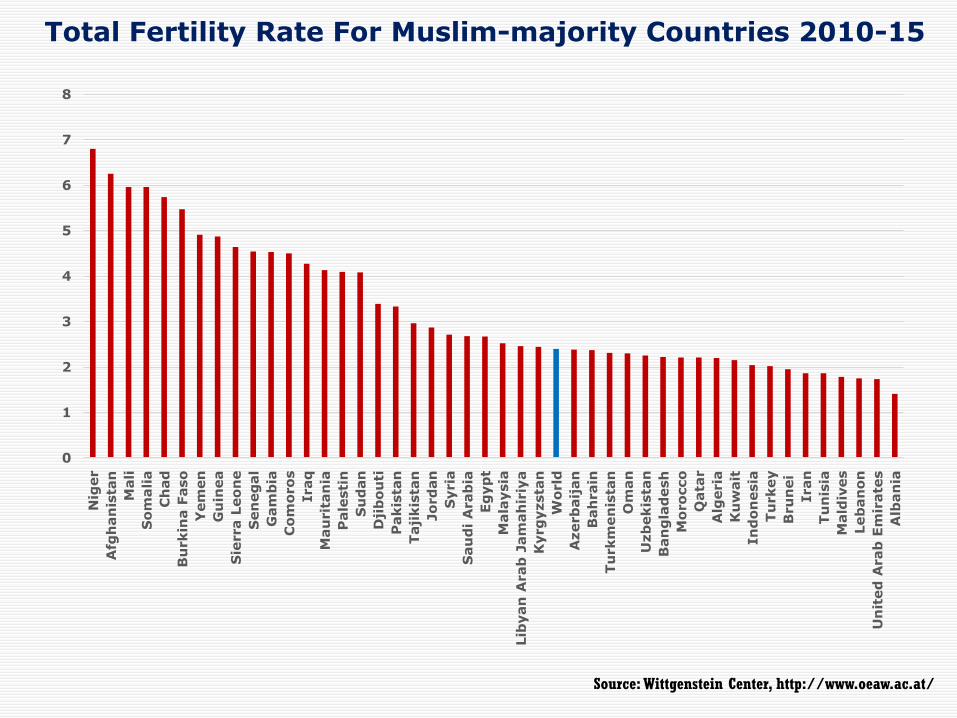
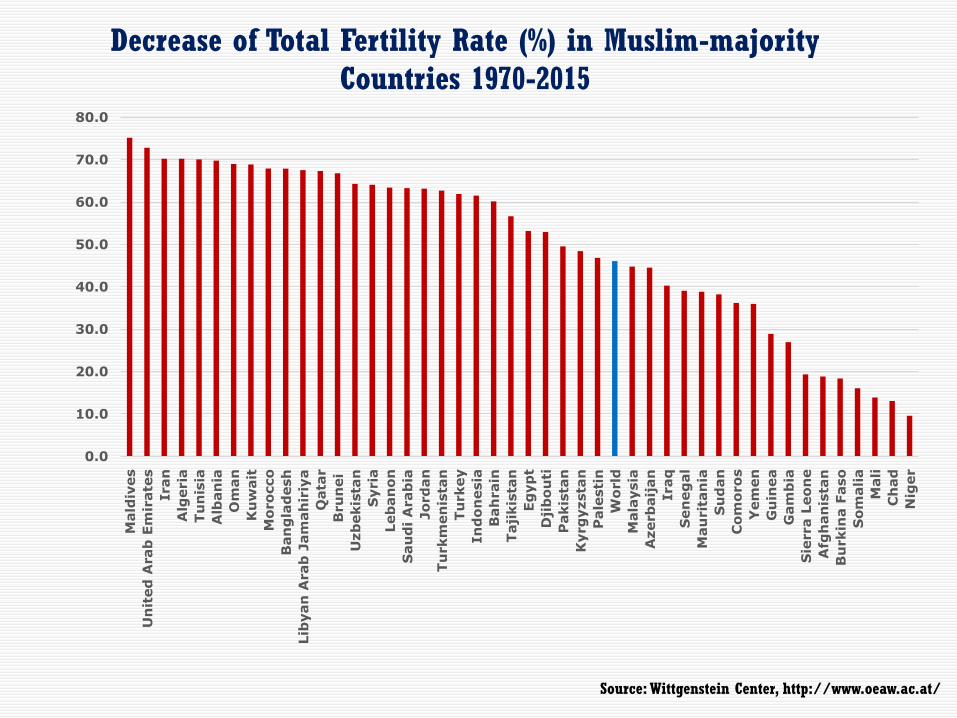
e0 Trends in Muslim-majority countries, 1970-2015
Source: Wittgenstein Center, http://www.oeaw.ac.at/
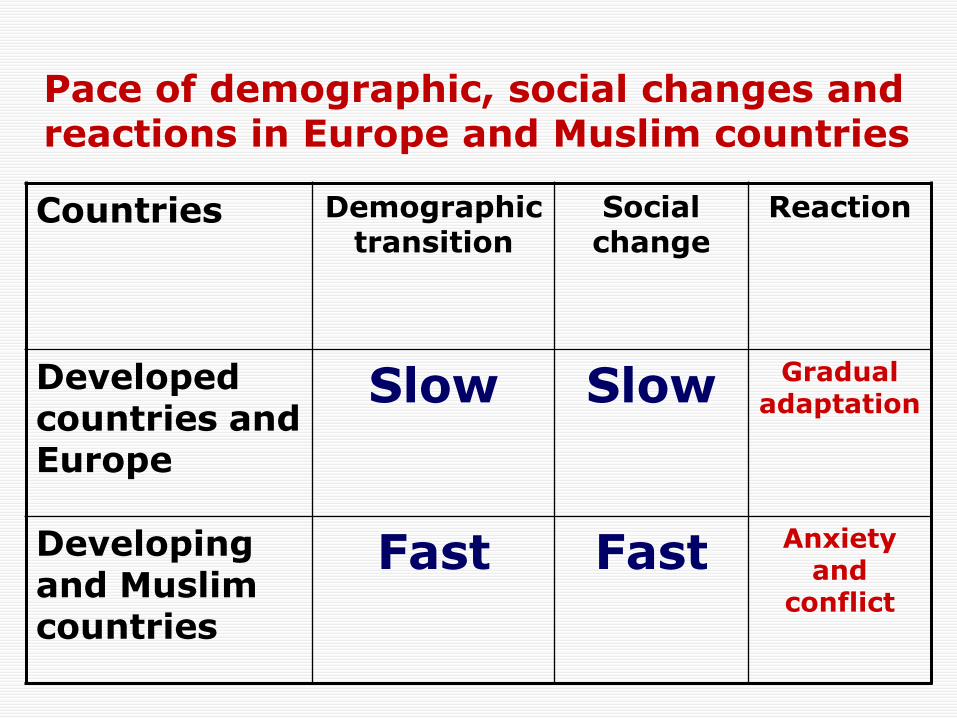
Pace of demographic, social changes and reactions in Europe and Muslim countries
Countries Demographic transition
Social change
Reaction
Developed countries and Europe
Slow Slow Gradual adaptation
Developing and Muslim countries
Fast Fast Anxiety and
conflict
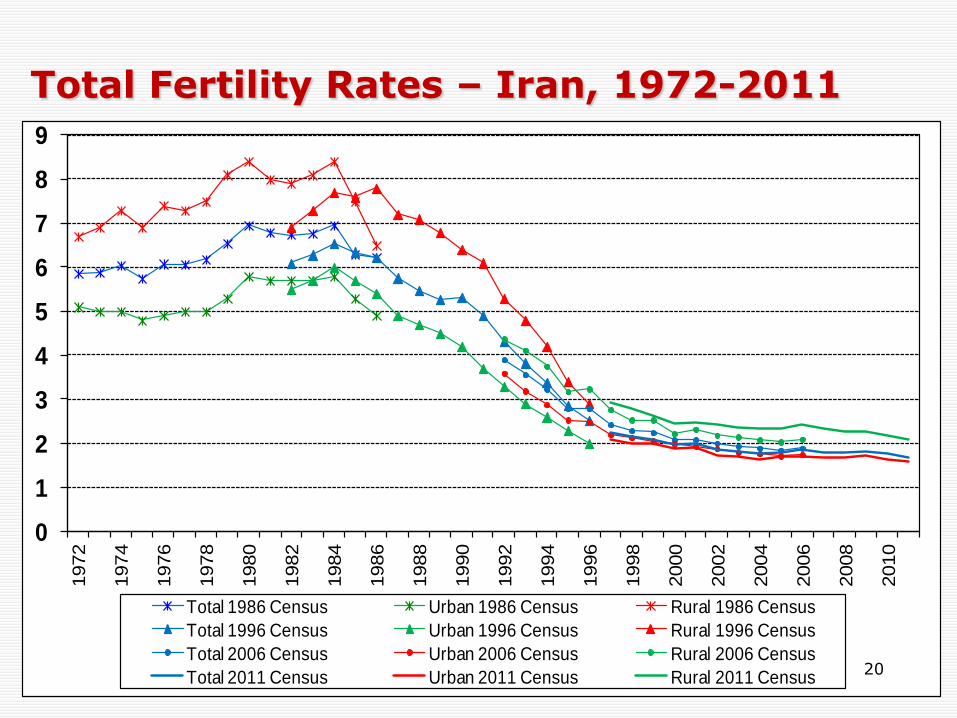
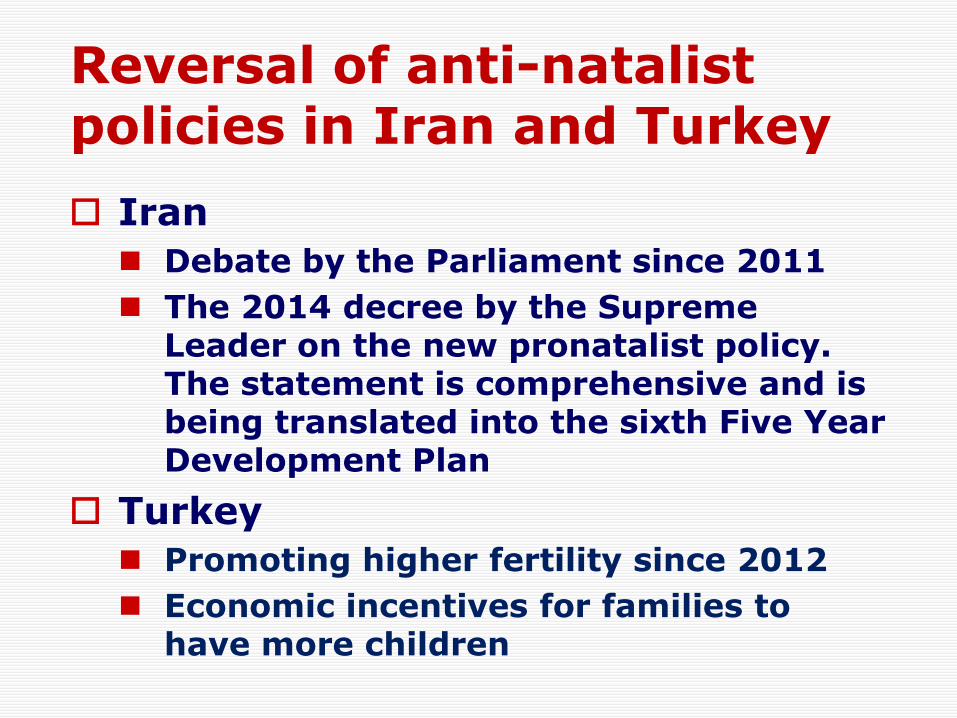
Reversal of anti-natalist policies in Iran and Turkey
Iran
Debate by the Parliament since 2011
The 2014 decree by the Supreme Leader on the new pronatalist policy. The statement is comprehensive and is being translated into the sixth Five Year Development Plan
Turkey
Promoting higher fertility since 2012
Economic incentives for families to have more children
SOCIAL AND ECONOMIC CHANGE IN MUSLIM COUNTRIES
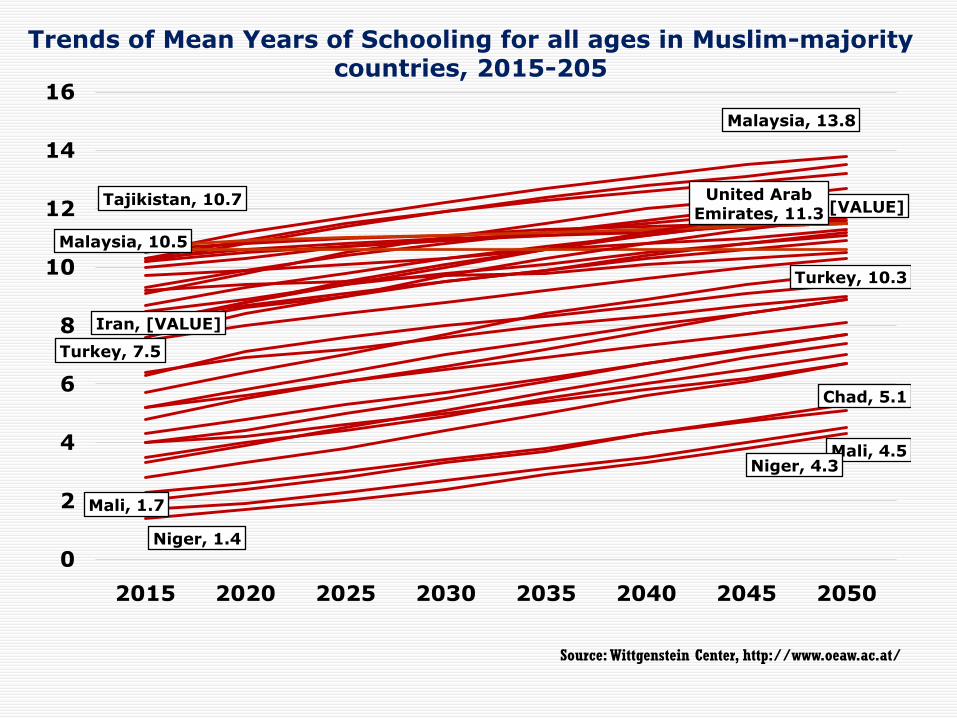
Chad, 5.1
Iran, [VALUE]
Iran, [VALUE]
Malaysia, 10.5
Malaysia, 13.8
Mali, 1.7
Mali, 4.5
Niger, 1.4
Niger, 4.3
Tajikistan, 10.7 United Arab Emirates, 11.3
Turkey, 7.5
Turkey, 10.3
0
2
4
6
8
10
12
14
16
2015 2020 2025 2030 2035 2040 2045 2050
Trends of Mean Years of Schooling for all ages in Muslim-majority countries, 2015-205
Source: Wittgenstein Center, http://www.oeaw.ac.at/
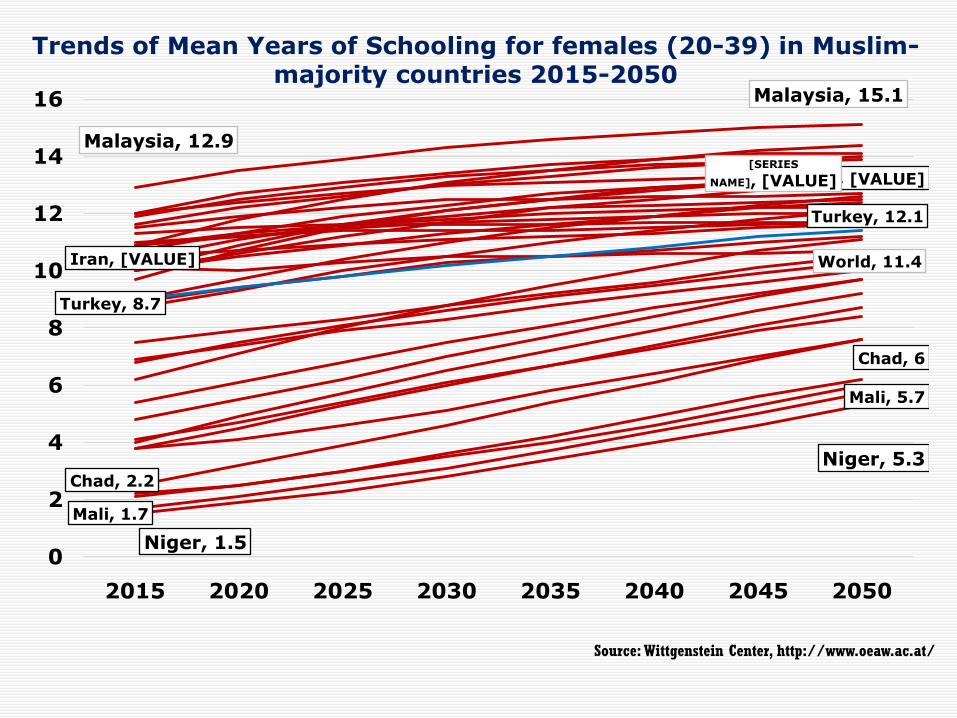
Source: Wittgenstein Center, http://www.oeaw.ac.at/
Trends of Mean Years of Schooling for females (20-39) in Muslim-majority countries 2015-2050
Chad, 2.2
Chad, 6
Iran, [VALUE]
Iran, [VALUE]
Malaysia, 12.9
Malaysia, 15.1
Mali, 1.7
Mali, 5.7
Niger, 1.5
Niger, 5.3
[SERIES
NAME], [VALUE]
Turkey, 8.7
Turkey, 12.1
World, 11.4
0
2
4
6
8
10
12
14
16
2015 2020 2025 2030 2035 2040 2045 2050
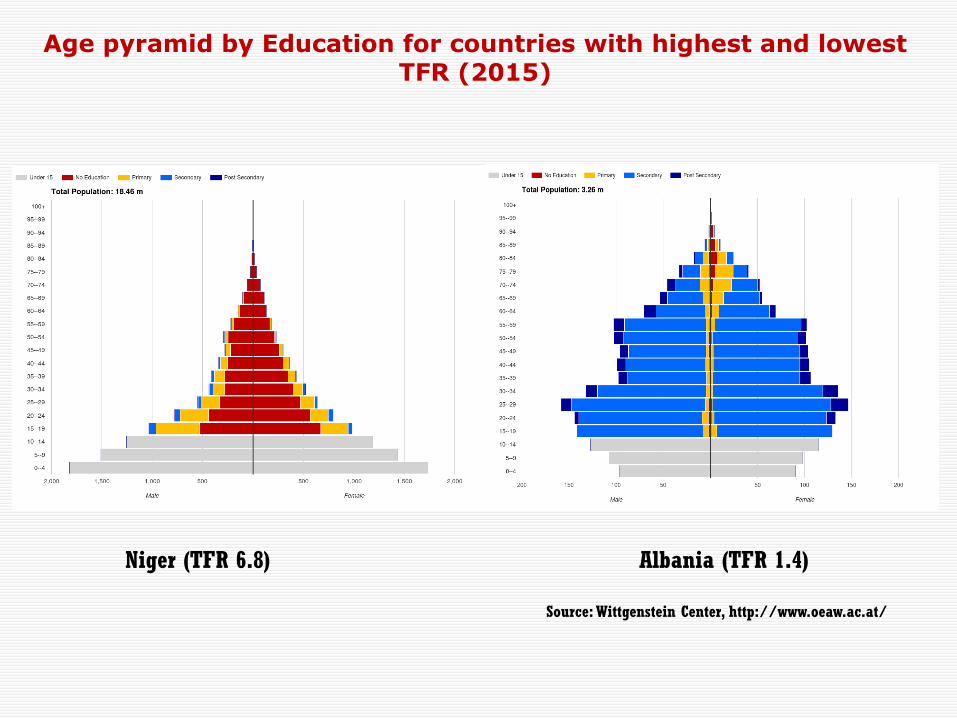
Niger (TFR 6.8) Albania (TFR 1.4)
Age pyramid by Education for countries with highest and lowest TFR (2015)
Source: Wittgenstein Center, http://www.oeaw.ac.at/
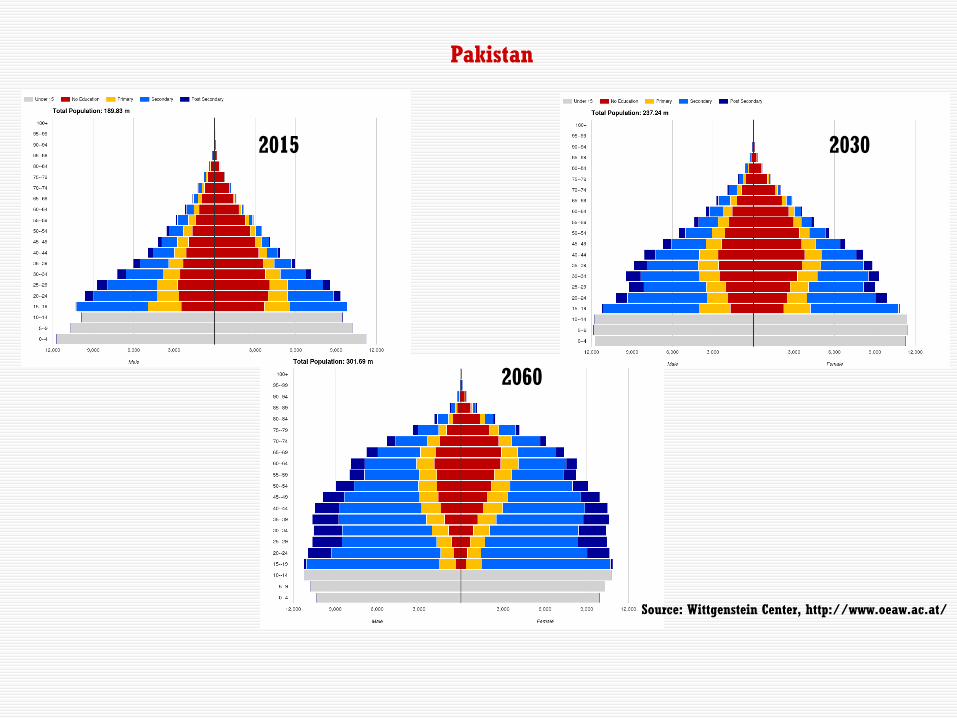
2015 2030
2060
Pakistan
Source: Wittgenstein Center, http://www.oeaw.ac.at/
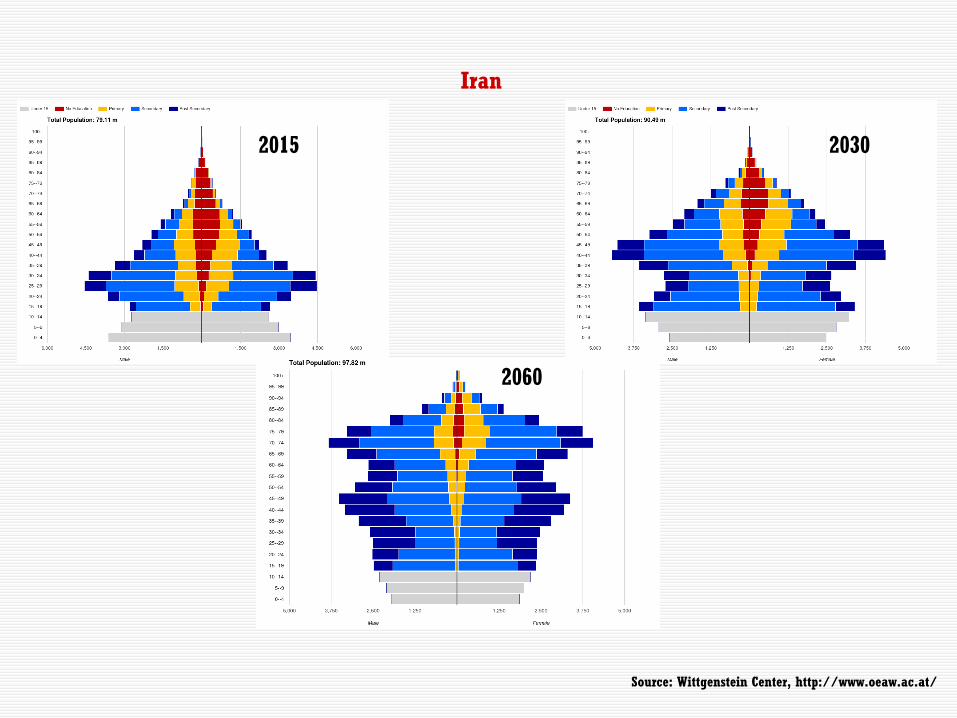
2015 2030
2060
Iran
Source: Wittgenstein Center, http://www.oeaw.ac.at/
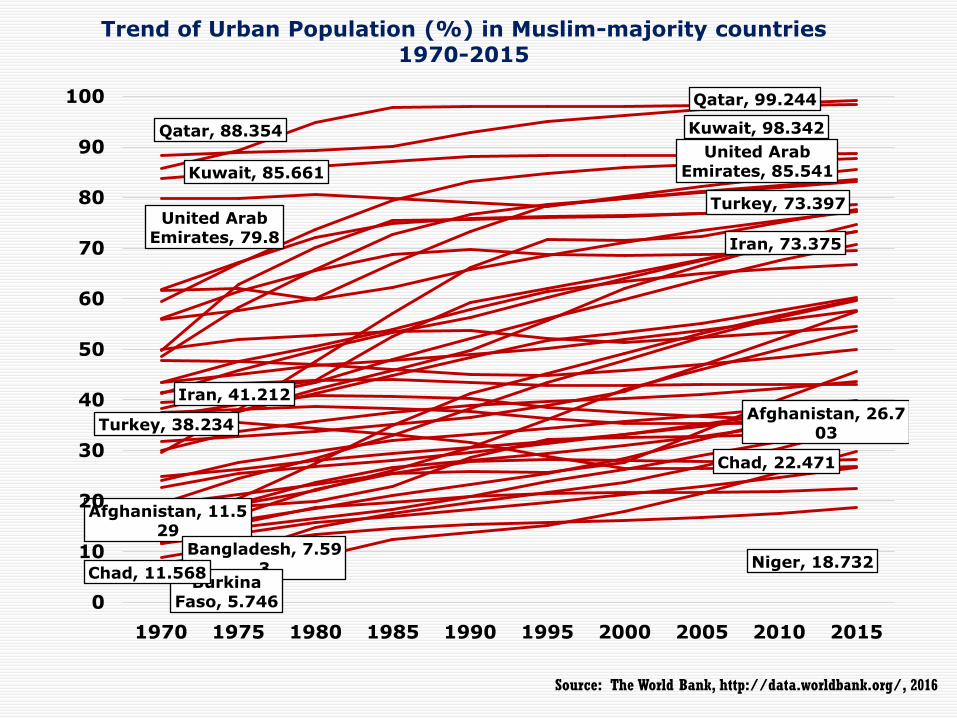
Trend of Urban Population (%) in Muslim-majority countries 1970-2015
Source: The World Bank, http://data.worldbank.org/, 2016
Afghanistan, 11.529
Afghanistan, 26.703
Bangladesh, 7.593
Burkina Faso, 5.746
Chad, 11.568
Chad, 22.471
Iran, 41.212
Iran, 73.375
Kuwait, 85.661
Kuwait, 98.342
Niger, 18.732
Qatar, 88.354
Qatar, 99.244
Turkey, 38.234
Turkey, 73.397United Arab
Emirates, 79.8
United Arab Emirates, 85.541
0
10
20
30
40
50
60
70
80
90
100
1970 1975 1980 1985 1990 1995 2000 2005 2010 2015
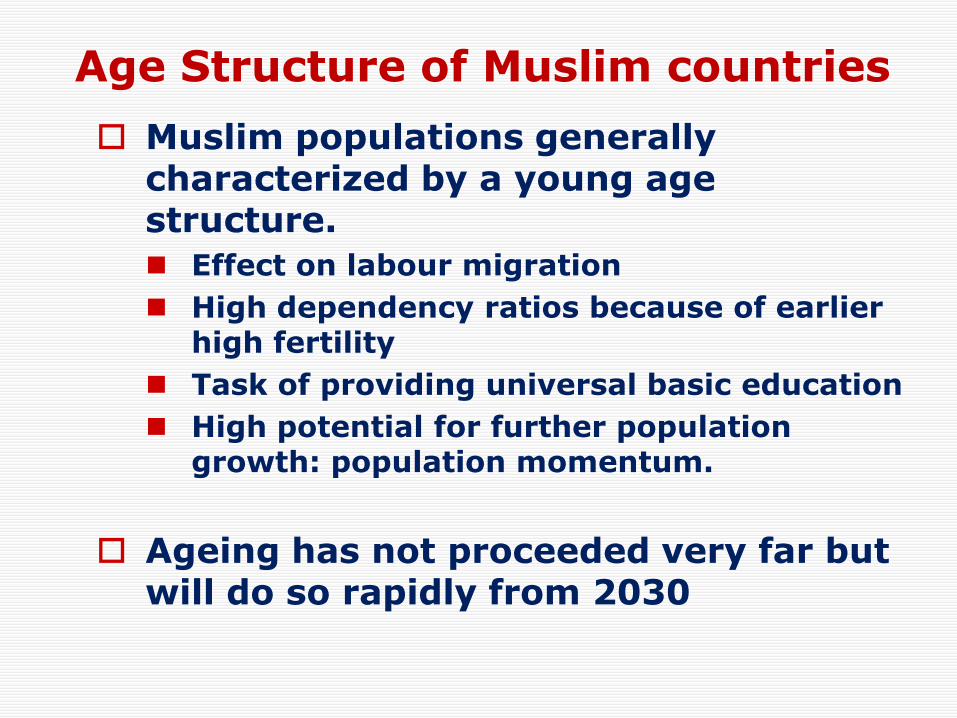
Age Structure of Muslim countries
Muslim populations generally characterized by a young age structure.
Effect on labour migration
High dependency ratios because of earlier high fertility
Task of providing universal basic education
High potential for further population growth: population momentum.
Ageing has not proceeded very far but will do so rapidly from 2030
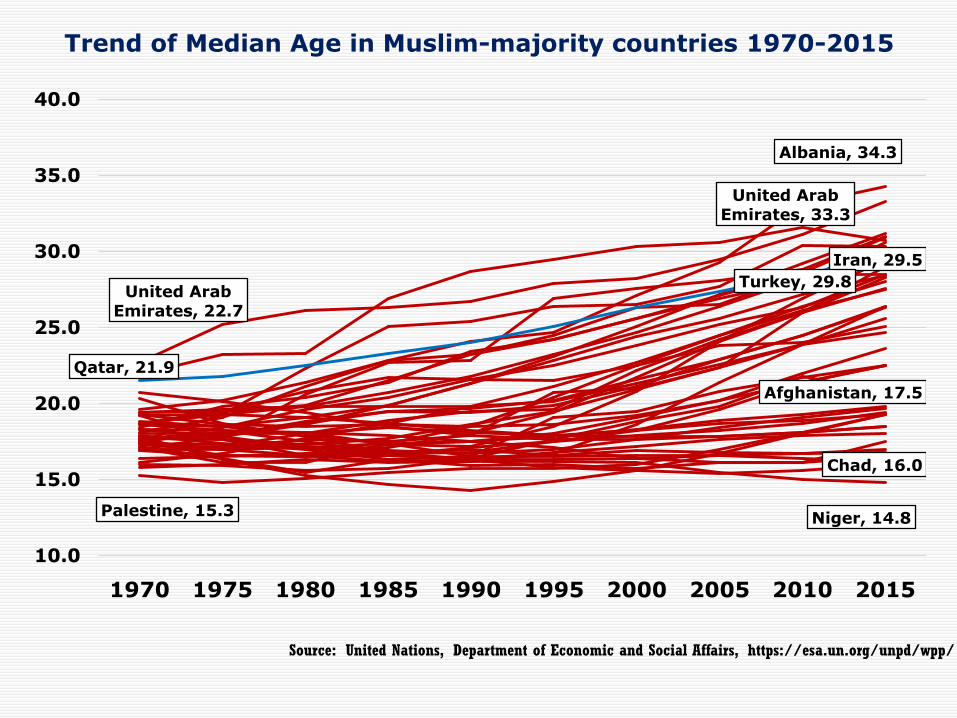
Afghanistan, 17.5
Albania, 34.3
Chad, 16.0
Iran, 29.5
Niger, 14.8Palestine, 15.3
Qatar, 21.9
Turkey, 29.8United Arab
Emirates, 22.7
United Arab Emirates, 33.3
10.0
15.0
20.0
25.0
30.0
35.0
40.0
1970 1975 1980 1985 1990 1995 2000 2005 2010 2015
Trend of Median Age in Muslim-majority countries 1970-2015
Source: United Nations, Department of Economic and Social Affairs, https://esa.un.org/unpd/wpp/
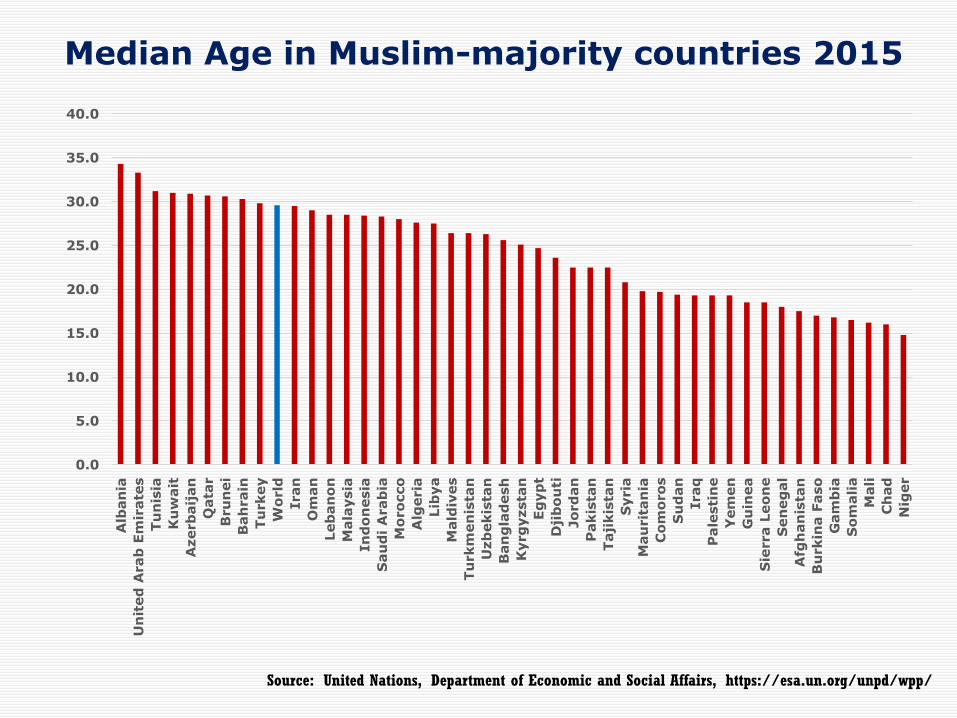
Median Age in Muslim-majority countries 2015
Source: United Nations, Department of Economic and Social Affairs, https://esa.un.org/unpd/wpp/
0.0
5.0
10.0
15.0
20.0
25.0
30.0
35.0
40.0A
lban
ia
Un
ited
Arab
Em
irate
s
Tu
nis
ia
Ku
wait
Azerb
aij
an
Qata
r
Bru
nei
Bah
rain
Tu
rkey
Wo
rld
Iran
Om
an
Leb
an
on
Mala
ysia
In
do
nesia
Sau
di
Arab
ia
Mo
ro
cco
Alg
eria
Lib
ya
Mald
ives
Tu
rkm
en
ista
n
Uzb
ekis
tan
Ban
gla
desh
Kyrg
yzsta
n
Eg
yp
t
Dji
bo
uti
Jo
rd
an
Pakis
tan
Taji
kis
tan
Syria
Mau
rit
an
ia
Co
mo
ro
s
Su
dan
Iraq
Pale
sti
ne
Yem
en
Gu
inea
Sie
rra L
eo
ne
Sen
eg
al
Afg
han
ista
n
Bu
rkin
a F
aso
Gam
bia
So
malia
Mali
Ch
ad
Nig
er
0.00
10.00
20.00
30.00
40.00
50.00
60.00
70.00
80.00
90.00B
urkin
a F
aso
Gam
bia
Azerb
aij
an
Sie
rra L
eo
ne
Sen
eg
al
Gu
inea
Ch
ad
Taji
kis
tan
Ban
gla
desh
Kyrg
yzsta
n
Mald
ives
Bru
nei
In
do
nesia
Co
te d
'Ivo
ire
Mali
Alb
an
ia
Qata
r
Uzb
ekis
tan
Tu
rkm
en
ista
n
Mala
ysia
Un
ited
Arab
Em
irate
s
Ku
wait
Gu
yan
a
Nig
er
Bah
rain
So
malia
Dji
bo
uti
Su
dan
Tu
rkey
Lib
ya
Om
an
Mau
rit
an
ia
Tu
nis
ia
Mo
ro
cco
Yem
en
Leb
an
on
Eg
yp
t
Pakis
tan
Sau
di A
rab
ia
Iran
Jo
rd
an
Afg
han
ista
n
Alg
eria
Pale
sti
ne
Iraq
Syria
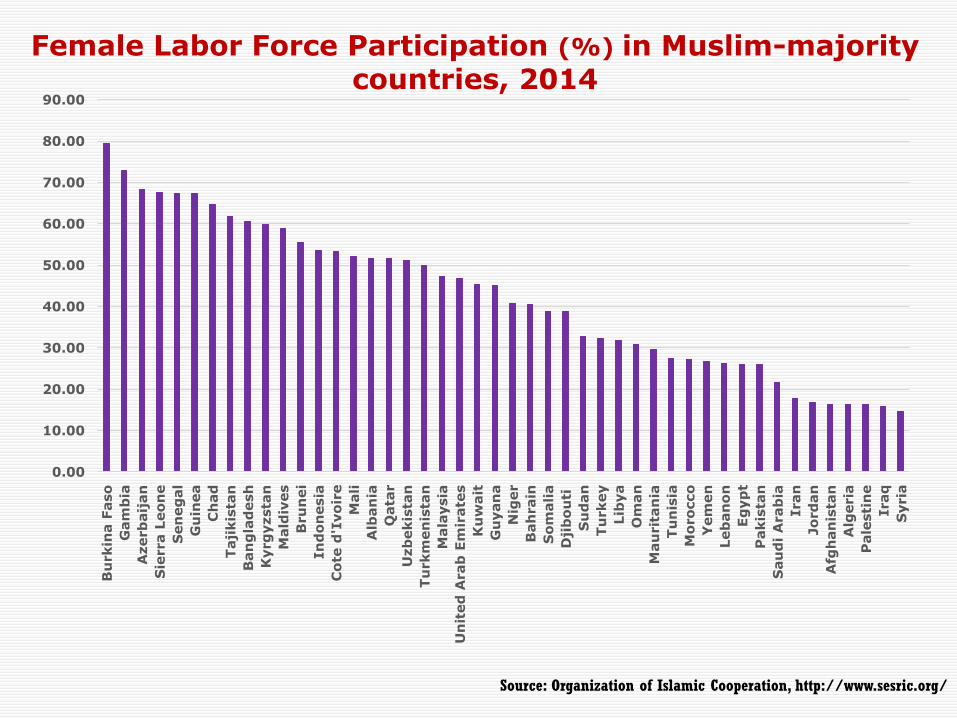
Female Labor Force Participation (%) in Muslim-majority countries, 2014
Source: Organization of Islamic Cooperation, http://www.sesric.org/
Youth unemployment rate particularly that of women is high in Muslim countries
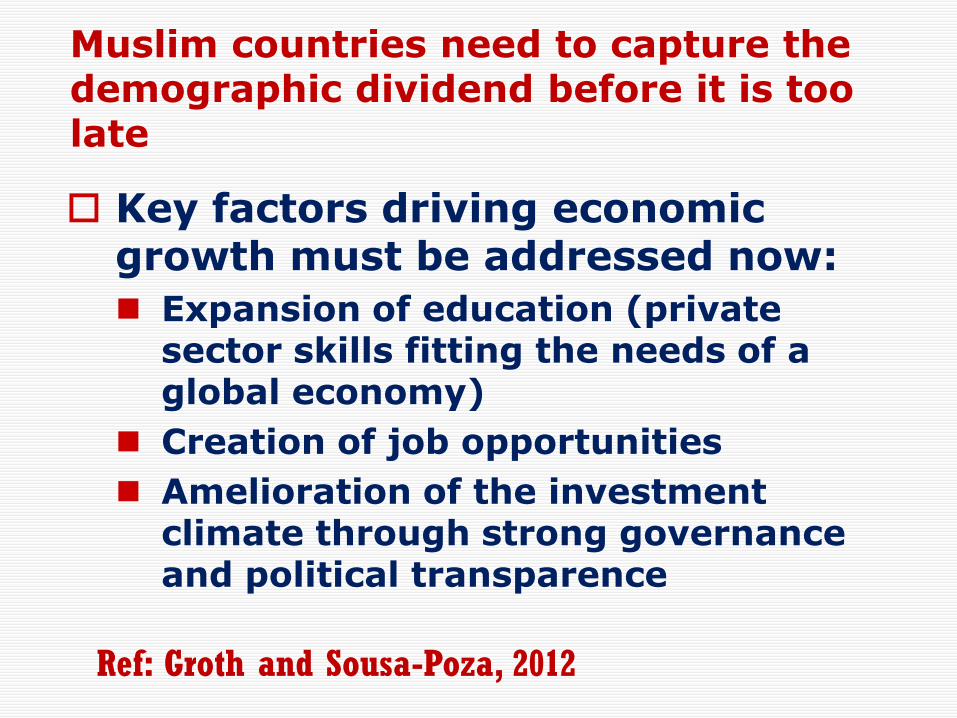
Muslim countries need to capture the demographic dividend before it is too late
Key factors driving economic growth must be addressed now:
Expansion of education (private sector skills fitting the needs of a global economy)
Creation of job opportunities
Amelioration of the investment climate through strong governance and political transparence
Ref: Groth and Sousa-Poza, 2012
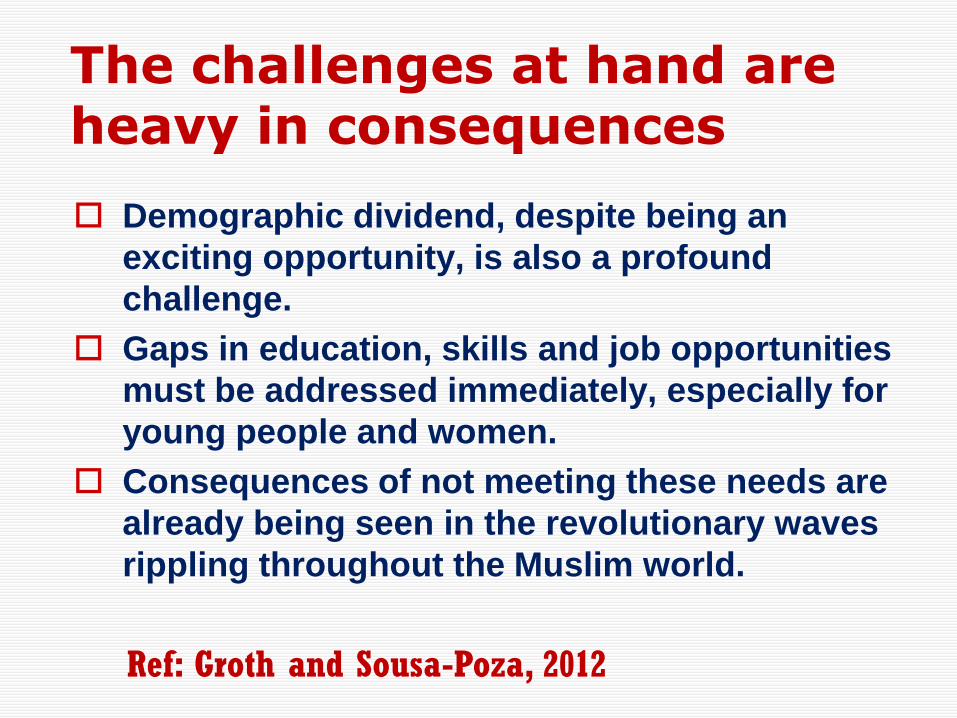
The challenges at hand are heavy in consequences
Demographic dividend, despite being an
exciting opportunity, is also a profound
challenge.
Gaps in education, skills and job opportunities
must be addressed immediately, especially for
young people and women.
Consequences of not meeting these needs are
already being seen in the revolutionary waves
rippling throughout the Muslim world.
Ref: Groth and Sousa-Poza, 2012
Selected References Abbasi-Shavazi, MJ., and Torabi, F. 2012, Education
and fertility in Islamic countries, In Hans Groth Alfonso (eds), Population Dynamics in Islamic Countries, Springer, pp. 43-62.
Abbasi-Shavazi, MJ., and Jones, G. 2005, Socio-economic and demographic setting of Muslim populations, in Jones G. and M. Karim (eds), Islam, the State and Population Policy, C. Hurst & Co. (Publishers), London., pp. 1-39.
Lutz, W., Crespo Cuaresma, J., M.J. Abbasi-Shavazi, 2010, Demography, Education and Democracy: Global Trends and the Case of Iran, Population and Development Review, 36(2): 253-281.
Torabi, F. and Abbasi-Shavazi, M.J., 2015, Women's Human Capital and Economic Growth in the Middle East and North Africa. Journal of International Women' s Studies, 16(3), 237-261.