www.ijemr.net ISSN (ONLINE): 2250-0758, ISSN (PRINT): 2394-6962
273 Copyright © 2017. Vandana Publications. All Rights Reserved.
Volume-7, Issue-4, July-August 2017
International Journal of Engineering and Management Research
Page Number: 273 -285
Demographics & Its Impact on Organisational Culture and Employee
Motivation
(A Study of the Employees in IRCTC)
Asra Wani
Assistant Professor, Department of Tourism studies, School of business studies, Central University of Kashmir, INDIA
ABSTRACT
In this day and age human resource management
and development is becoming more important due to the fact
that a man has gained a new place and a new role in all
societal processes and in their administration. The sheer
employees‟ characteristics, i.e., demographic factors, besides
the organisational factors, have a certain sway in this area.
By sufficient understanding of both demographic factors and
their influence, it is possible to apply measures to make the
employees motivated. This paper points out such influences
on the organisational culture and employees‟ motivation.
Also, the interface of certain demographic factors is
presented, such as the qualification, designation and gender,
onto employees perceiving motivation and onto respective
consequences. The research was done on employees in the
IRCTC in New Delhi.
Keywords-- motivation, demographic factors, employees,
IRCTC
I. INTRODUCTION
Culture
Culture is “the way things are done within a
group”. It sets priorities and expectation, enabling people
to learn and understand what is important, subsequently
identifying those actions that lead to punishment and those
lead to reward. Hofstede (1997) pointed that the culture of
organization is the collective programming of mind that
distinguishes the member from one organization to
another. Culture is an important part of internal
environment of organization. Organisation culture is set of
values, beliefs, attitudes that help the members of the
organization understand what it stands for, how it does
things and what it consider important.
What is organizational culture? Several scientists have defined organisational
culture in very different ways. The terms „organisational
culture‟ and „corporate culture‟ are used interchangeably.
According to George, Sleeth and Slider (1999)
organisational culture generally includes: a philosophy that
exemplifies an organisation‟s orientation toward its
customers and employees, and rules, both written and
unwritten, which dictate how a member of the organization
should act to 'get along‟. John McLaughlin defined
organizational culture as a system of shared assumptions,
values, and beliefs, which governs how people behave in
organizations.
Organizational culture is the behaviour of humans
within an organization and the meaning that people attach
to those behaviours. According to Needle (2004)
“Culture is how organizations „do things‟.” — Robbie
Katanga
“Organizational culture defines a jointly shared
description of an organization from within.” Bruce
Perron
Despite the diversity in the definitions, it can be
recognized that there is a common good where
organisational culture is based on namely; underlying
values and beliefs. These underlying values and beliefs are
the basis for the behaviour of individuals in the
organisation. It takes a long time before the values and
beliefs are enshrined in the organisation. To what extent
individuals in the organisation adopt the organisational
culture can be characterized by the type of culture that
prevails in the organisation, called either a strong or a
weak organisational culture.
Strong organisational culture: The term strong
organisational culture has been explained in different
ways. O‟Reily and Chatman (1996) define a strong
organisational culture as a set of norms and values that are
widely shared and strongly held throughout the
organisation.
Weak organisational culture: It can be said that the
definition of the concept weak organisational culture is the
www.ijemr.net ISSN (ONLINE): 2250-0758, ISSN (PRINT): 2394-6962
274 Copyright © 2017. Vandana Publications. All Rights Reserved.
opposite of a strong organisational culture. So the norms
and values within the organisation are not widely shared
and strongly held. Corillo and Grumb (1999) characterize a
weak culture by agents undertaking little culture- specific
investments and cultural changes being more likely.
Motivation
Motivation is the key component of organization
culture. Culture plays a significant role in an organization
regarding how people feel about their work, levels of
motivation commitment and in turn job satisfaction.
People in organization are the key factors for
competiveness and organization can demonstrate highly
complex social structure because of their culture strength.
There is clear mutual interdependence between
organization and its employees were both the parties have
an impact on each other‟s potential in achieving success.
There are evidences that motivation and job satisfaction
cannot treated in isolation. Motivated staff takes pride
whilst doing their jobs &thus feels responsible for the
organization success. There is no single method for
motivating employees. The biggest dilemma of
organization is still motivating employee. Methods have
changed over time and depend on situation that employee
experience. Thus managers have a crucial responsibility in
locating sub ordinates motivational factors and implement
ting them into organization culture. Managers thus need to
find proper tools that motivate their subordinates and fit
the current corporate culture. Nowadays the traditional
motivational practices such as money and promotion have
found in adequate. However, innovation practice now
needs to practice.
Motivation has been defined in various ways and
by different authors. This may explain the many
definitions that are developed. Atkinson (1964) defines
motivation as: “the contemporary influence on direction,
vigor, and persistence of action”, while Vroom (1964)
defines it as “a process governing choices made by persons
. . . among alternative forms of voluntary activity”.
Motivation is the inner power that pushes you toward
taking action and toward achievement. Motivation is
powered by desire and ambition, and therefore, if they are
absent, motivation is absent too. RemezSasson
Frank Hawkins (1993: 132-133) defines it as
“what drives or induces a person to behave in a particular
fashion the internal force which initiates, directs, sustains
and terminates all important activities. It influences the
level of performance, the efficiency achieved and the time
spent on an activity.”
Intrinsic motivation Intrinsic motivation is considered to
be of major importance to human behavior (see e.g. De
Charms, 1968; Deci, 1971). According to Deci (1992)
intrinsically motivated behavior is performed out of
interest and thus requires no "reward" other than the
spontaneous experience of interest and enjoyment that
accompanies it.
Extrinsic motivation: Now more insight is given in what
the concept intrinsic motivation means it can be said that
extrinsic motivation is the opposite, but that would be too
easy. Commonality between the two concepts is
incorporated in the fact that external motivation also is
explained by different definitions. According to Rigby,
Deci, Patrick, & Ryan (1992) extrinsically motivated
behaviors are instrumental, they are performed for the
external rewards or consequences that accrue from their
performance. Besides external rewards, status, acceptance,
good work environment, promotion et cetera can also serve
as instruments for motivation. Bruno (1994) confirms this
by stating that extrinsic preferences are those activated
outside the person concerned. Those external interventions
may be material in monetary or nonmonetary form, or they
may be immaterial, such as fame and recognition in the
media.
Displayed as percentages for example, percentage
of people in different age ranges percentages of people
from different genders etc.
Main Whitney U test: Main whitney U test is a non
parametric test of null hypothesis that two samples come
from the same population against an alternative
hypothesis, especially that are particular population tends
to have larger values than the other.
Kruskal- Wallis Test: The Kruskal-Wallis H test is a rank
based non parametric test that can used to determine if
there are statistically significant differences between 2 or
more groups of an independent variable on a continuous or
ordinal dependent variable.
Graphic Presentation: Bar Charts are used to present the
facts and data in appropriate manner, neat and clean and
good design form as far as possible because a graphic
illustration can be indeed worth a thousand words.
II. REVIEW OF LITERATURE
According to O‟Reilly et. al, 1991, motivation is
the key constituent of organisational culture.
Organisational culture plays a noteworthy role in an
organisation regarding how people feel about their work,
levels of motivation, commitment and in turn job
satisfaction. A strong culture brings out the positive energy
of people to perform with loyalty and at deeper level while
having emotional bonds of attachment with the
organisation.
People are the key factors for the competitiveness
and organizations can demonstrate highly complex social
structure because of their cultural strength. There is a clear
common interdependence between organisational culture
and motivation said by Schein, 2004.
When employees feel involved in the
organisational culture they may be more willing to pursue
the organisational goals and are more dedicated to the
cause stated by George, Sleeth and Snider, 1999.
www.ijemr.net ISSN (ONLINE): 2250-0758, ISSN (PRINT): 2394-6962
275 Copyright © 2017. Vandana Publications. All Rights Reserved.
It may be important for an organisation to know if
it is possible to bind employees to the organisation by the
organisational culture, so it can be ensured that they will
pursue the organisational goals.
According to Hofstede (1991) corporate culture as
a deeply rooted value or shared norm, moral or aesthetic
principles that guide action and serve as standards to
evaluate one‟s own and others‟ behaviors. Corporate
culture itself has a important role in providing a framework
where motivational factors operate.
(The most widely used organizational culture
framework is that of Schein (1988), who adopts the
functionalist view and described culture as a pattern of
basic assumptions, invented, discovered, or developed by a
given group, as it learns to cope with its problems of
external adaptation and internal integration, that has
worked well enough to be considered valid and, therefore
is to be taught to new members as the correct way to
perceive, think, and feel in relation to those problems
stated by Hofstede, 1991.
In the words Shneider and Baroux (2003),
“culture can also affect motivation at lower physical levels,
in that cultures produce are facts and alter the environment
in such a way that other mental processes that serve
motivational states are also affected.” Therefore, corporate
culture provides two implications to motivation: it limits
its existence and it also provides a framework where to
alleviate it.
Organisations have been experiencing a speedy
change regarding their outcomes and performance.
Companies must ensure the motivation of their employees
so as to make them committed for best outcomes, in order
to compete in the global competition said by Harrison
(1993).
III. RESEARCH OBJECTIVES AND
SCOPE OF STUDY
Research objectives
1. To study the relationship between Select
Demographic variables & the determinants of
Organizational Culture of the employees in
IRCTC.
2. To study the relationship between Select
Demographic variables & the determinants of
Motivation of the employees in IRCTC.
3. To make recommendations & suggestions to the
different stake holders of the Organisation.
Scope of Study
1. The study is helpful to organizations for
identifying the area of dissatisfaction of job of the
employees.
2. The study helps to make a managerial decision to
the company.
3. The study will be helpful for the researchers and
scholars who are conducting research on
Organizational Culture and employee motivation.
IV. RESEARCH METHODOLOGY
Sample of Research
The population for this study is the management
and staff Indian railways catering and Tourism
Corporation. According to Powell (2000), sampling is
often one of the most crucial steps in research. In fact,
rigorous sampling methods have been developed and used
primarily within the context of survey research. However,
according to Lancaster (2005), the basic logic and many of
the specific techniques of sampling are equally applicable
to other research methods such as content analysis,
experimentation, and even field research. This study used a
simple random sampling method to collect data from 100
respondents comprising 70 males and 30 females. Also, 62
respondents were lower level staff, while 24 respondents
were middle level employees, 14 of them were higher level
employees.
Research Instrument and Procedures
Questionnaires have been adopted as the
instrument for data collection. A self-structured
questionnaire i.e. (close-ended questions) was employed to
elicit information from the respondents. The questionnaire
was divided into two sections and an overall number of 20
items. Section A contained demography related questions,
and Basked participants to respond to questions related
organisational culture and motivation. A total of 100
survey questionnaires were distributed and the rationale of
the study was explained to the respondents before data was
collected. Questionnaires were sent out to the people with
different working backgrounds in order to gain responses
from almost every department of the Company. Besides,
few management staff in the tourism department was
interviewed so as to gain understanding of the culture
existing in the company studied. The quantitative response
of the items was taken on the Likert scale. The responses
were then analyzed through Descriptive statistics, Mann
Whitney U Test and Kruskal-wallis test.
Tools and techniques
Descriptive statistics
Descriptive statistics is a term given to analysis of
the date that helps to describe, show or summarize data in
a meaningful way such that, for example, the patterns
might emerge. In this study I have used mean and
percentage statistics. The most popular and widely used
measure for representing the entire data by one value is
what most laymen call and „average‟ and what the
statiscians call the arithmetic mean. Its value is obtained
by adding together all the items and by dividing this total
by the number of items. Distribution can also be displayed
as percentages for example, percentage of people in
www.ijemr.net ISSN (ONLINE): 2250-0758, ISSN (PRINT): 2394-6962
276 Copyright © 2017. Vandana Publications. All Rights Reserved.
different age ranges, percentages of people from different
genders etc.
Main Whitney U test Main whitney U test is a non parametric test of
null hypothesis that two samples come from the same
population against an alternative hypothesis, especially
that are particular population tends to have larger values
than the other.
Kruskal- Wallis Test The Kruskal-Wallis H test is a rank based non
parametric test that can used to determine if there are
statistically significant differences between 2 or more
groups of an independent variable on a continuous or
ordinal dependent variable
Graphic Presentation
Bar Charts are used to present the facts and data
in appropriate manner, neat and clean and good design
form as far as possible because a graphic illustration can
be indeed worth a thousand words.
The Limitation, Reliability and Validity of research
One of the main limitations for this study is the
time scale in which the survey must be completed, as it
was agreed that managers will allow duration of one week
for their employees to complete this survey. Another
limitation is finding participants who are willing to take
part in this research.
Validity is defined as „the extent to which
research findings are really about what they profess to be
about‟. (Saunders et al, 2007, p. 614). As this study is
mainly focused on job satisfaction and performance
evaluation it will be measured via a 24 statement
questionnaire, likewise validity was generalized by
implementing the scale which was developed by Allen and
Meyer 1990.
To ensure the reliability of this questionnaire a
pilot study was necessary to assess the reliability and the
effectiveness of the questionnaire. In order to establish the
suitability of the questions two lecturers took part in this
pilot test and suggested several improvements which could
be made and this resulted in further changes being made to
the questionnaire which made it more reliable so that data
could be recorded more accurately because only those
questions should be answered which relate to the original
question, resulting in fewer vague answers being assessed,
moreover it enabled the researcher to focus on the layout,
length and clarity of the questionnaire.
V. DATA ANALYSIS AND
INTERPRETATION
Data analysis and interpretation
The study entitled “demographics and its impact
on organisational culture and employee motivation” looks
into how organisational culture affects employee
motivation. Some of the components along with
demographics of a consumer were taken into consideration
which were analyzed and are explained through
verification of hypothesis.
Description of sample
1. Demographics
1.1 Gender
In order to provide descriptive information about
demographic variables, Frequency tests were employed
which revealed that 70% composed of males and 30%
were that of Females, which is evident from the bar chart:
Frequency Table (1.1)-Gender
Frequency Percent Valid Percent
Cumulative
Percent
Valid Male 70 70.0 70.0 70.0
Female 30 30.0 30.0 100.0
Total 100 100.0 100.0
The bar chart below also supports the frequency table of gender
www.ijemr.net ISSN (ONLINE): 2250-0758, ISSN (PRINT): 2394-6962
277 Copyright © 2017. Vandana Publications. All Rights Reserved.
1.2 Qualification
Educational qualification is yet another
demographic variable in the behavioral fields. In this case
the population of employees consists of 65% of graduates
and 35% are postgraduates, as depicted in the table:
Table (1.2) Qualification
Frequency Percent Valid Percent
Cumulative
Percent
Valid UG 65 65.0 65.0 65.0
PG 35 35.0 35.0 100.0
Total 100 100.0 100.0
The bar chart below also supports the frequency table of qualification
1.3 Designations
Designation forms an important part of
demographic profile that connects an employee profile
with organisational structure. Without assigning a job title
the system will not know where employee fits into the
company structure. The final results revealed that lower
level employees constituted about 62%, middle level
employees constituted about 24% and higher level
employees from 14%.
(Table 1.3) Designation
Frequency Percent
Valid
Percent
Cumulative
Percent
Valid Lower Level Employee 62 62.0 62.0 62.0
Middle level employee 24 24.0 24.0 86.0
Higher level employee 14 14.0 14.0 100.0
Total 100 100.0 100.0
www.ijemr.net ISSN (ONLINE): 2250-0758, ISSN (PRINT): 2394-6962
278 Copyright © 2017. Vandana Publications. All Rights Reserved.
The bar chart below also supports the frequency table of designation.
Demographics & determinants of organisational culture
This section includes verification of hypothesis
and discussions on the Results obtained and the hypotheses
have been discussed below under various sub sections.
Ho1: gender and determinants of organisational
culture do not have significant relationship. To tests this hypothesis, Mann Whitney U Test
was applied whose statistics are given in the table below.
Table 1: Verification of hypothesis:
Kruskal-Wallis Test/Ranks
Gender N Mean Rank
Dominant characteristics
Male 70 50.50
Female 30 50.50
Total 100
Organizational leadership
Male 70 50.50
Female 30 50.50
Total 100
Management of employees
Male 70 49.43
Female 30 53.00
Total 100
Organizational glue
Male 70 51.57
Female 30 48.00
Total 100
Strategic emphasis
Male 70 53.00
Female 30 44.67
Total 100
Criteria of success
Male 70 50.50
Female 30 50.50
Total 100
Test Statistics
Dominant
characteristics
Organizational
leadership
Management of
employees
Organizational
glue
Strategic
emphasis
Criteria of
success
Chi-Square
Df
Asymp.
Sig.
1050.000 1050.000 975.000 975.000 875.000 1050.000
1515.000 1515.000 3460.000 1440.000 1340.000 1515.000
.000 .000 -1.494 -1.494 -3.487 .000
Ho1.1: gender and dominant characteristics are
independent.
According to the table, the P value of gender with
respect to dominant characteristics is 1.00, being more
than significance level of 0.05; null hypothesis of no
www.ijemr.net ISSN (ONLINE): 2250-0758, ISSN (PRINT): 2394-6962
279 Copyright © 2017. Vandana Publications. All Rights Reserved.
significance was accepted. Which means organisation is
common place to all and males and females both show
same dominant characteristics.
Ho1.2: gender and organizational leadership are
independent.
According to the table, the P value is reported to
be (1.00) being more than significance level of 0.05, null
hypothesis of no significance was accepted. This means
that the organisational leadership is considered irrespective
of the gender of the candidate. There is no disparity
between males and female when it comes to organisational
leadership.
Ho1.3: gender and management of employees are
independent.
The P value of gender with respect to
management of employees is 0.135 being more than
significance value of 0.05. Hence the null hypothesis of no
significant relationship is accepted, which means that there
is no discrimination in terms of male and female with
respect to the management styles.
Ho1.4: gender and organizational glue are independent.
The P value of gender with respect to
organisation glue is reported to be 0.135, which is greater
than significance value of 0.05: hence accepting the null
hypothesis of no significant relationship, which means that
both males and females are equally treated as far as
organizational bond, is concerned.
Ho1.5: gender and strategic emphasis are independent.
The P value of gender with respect to the strategic
emphasis is reported to be 0.00 which is less than
significance value of 0.05. Hence the null hypothesis of no
significant relationship is rejected, which means gender &
strategic emphasis show a significant relationship.
Ho1.6: gender and criteria of success are independent. The P value of gender with respect to criteria of
success is reported to be 1.00, which is greater than
significance value of 0.05. Hence accepting the null
hypothesis has no significant relationship, which means
that success is independent of gender of an employee.
Ho2: Qualification and determinants of organisational
culture do not show any significant relationship. To tests this hypothesis, Kruskal-wallis Test was
applied whose statistics are given in the table below:
Table 2: Verification of hypothesis:
Kruskal-Wallis Test /Ranks
Qualification N Mean Rank
Dominant characteristics
Graduate 65 50.50
PG 35 50.50
Total 100
Organizational leadership
Graduate 65 50.50
Pg 35 50.50
Total 100
Management of employees
Graduate 65 49.15
Pg 35 53.00
Total 100
Organizational glue
Graduate 65 51.85
Pg 35 48.00
Total 100
Strategic emphasis
Graduate 65 49.15
Pg 35 53.00
Total 100
Criteria of success
Graduate 65 50.50
Pg 35 50.50
Total 100
Test Statistics
Dominant
characteristics
Organizational
leadership
Management of
employees
Organizational
glue
Strategic
emphasis
Criteria of
success
Chi-Square
Df
Asymp.
Sig.
.000 .000 2.806 2.806 2.806 .000
1 1 1 1 1 1
1.000 1.000 .094 .094 .094 1.000
www.ijemr.net ISSN (ONLINE): 2250-0758, ISSN (PRINT): 2394-6962
280 Copyright © 2017. Vandana Publications. All Rights Reserved.
Ho2.1: Qualification and dominant characteristics do not
show any significant relationship. According to the table, the P value of
qualification with respect to dominant characteristics is
1.00, being more than significance level of 0.05; null
hypothesis of no significance was accepted. This would
mean that qualification has no significant relationship with
the dominant characteristics. A person can show dominant
characteristics no matter what his qualification is.
Ho2.2: Qualification and organizational leadership do not
show any significant relationship. According to the table, the P value of
qualification with respect to organizational leadership is
1.00, being more than significance level of 0.05, null
hypothesis of no significance was accepted. This means
that qualification has no role in determining who the
leaders would be.
Ho2.3: Qualification and management of employees do
not show any significant relationship. According to the table, the P value of
qualification with respect to management of employees is
0.094, being more than significance level of 0.05, null
hypothesis of no significance was accepted. This means
that qualification has nothing to do with the management
of employees. Employees are managed as per their
requirement not as per their qualification.
Ho2.4: Qualification and organizational glue do not show
any significant relationship. According to the table, the P value of
qualification with respect to organizational glue is 0.094,
being more than significance level of 0.05; null hypothesis
of no significance was accepted. This suggests that there is
no discrimination on the basis of qualification as far as
organizational bond is concerned.
Ho2.5: Qualification and strategic emphasis do not show
any significant relationship. According to the table, the P value of
qualification with respect to strategic emphasis is 0.094,
being more than significance level of 0.05; null hypothesis
of no significance was accepted. This means that
qualification and strategic emphasis are not significantly
related.
Ho2.6: Qualification and criteria of success do not show
any significant relationship. According to the table, the P value of
qualification with respect to criteria of success is 1.00,
being more than significance level of 0.05; null hypothesis
of no significance was accepted. This would suggest that
success is independent of qualification.
Ho3: Designation and determinants of organisational
culture do not have any significant relationship. To tests this hypothesis, Kruskal-wallis Test was
applied whose statistics are given in the table below:
Table 3: Verification of hypothesis:
Kruskal-Wallis Test /Ranks Designation N Mean Rank
Dominant characteristics Lower Level Employee 62 50.50
Middle Level Employee 24 50.50
Higher Level Employee 14 50.50
Total 100
Organizational leadership Lower Level Employee 62 50.50
Middle Level Employee 24 50.50
Higher Level Employee 14 50.50
Total 100
Management of employees Lower Level Employee 62 49.77
Middle Level Employee 24 50.92
Higher Level Employee 14 53.00
Total 100
Organizational glue Lower Level Employee 62 51.23
Middle Level Employee 24 50.08
Higher Level Employee 14 48.00
Total 100
Strategic emphasis Lower Level Employee 62 49.77
Middle Level Employee 24 50.92
Higher Level Employee 14 53.00
Total 100
Criteria of success Lower Level Employee 62 50.50
www.ijemr.net ISSN (ONLINE): 2250-0758, ISSN (PRINT): 2394-6962
281 Copyright © 2017. Vandana Publications. All Rights Reserved.
Middle Level Employee 24 50.50
Higher Level Employee 14 50.50
Total 100
Test Statistics
Dominant
characteristics
Organizational
leadership
Management
of employees
Organizational
glue
Strategic
emphasis
Criteria of
success
Chi-Square
Df
Asymp. Sig.
.000 .000 1.037 1.037 1.037 .000
2 2 2 2 2 2
1.000 1.000 .596 .596 .596 1.000
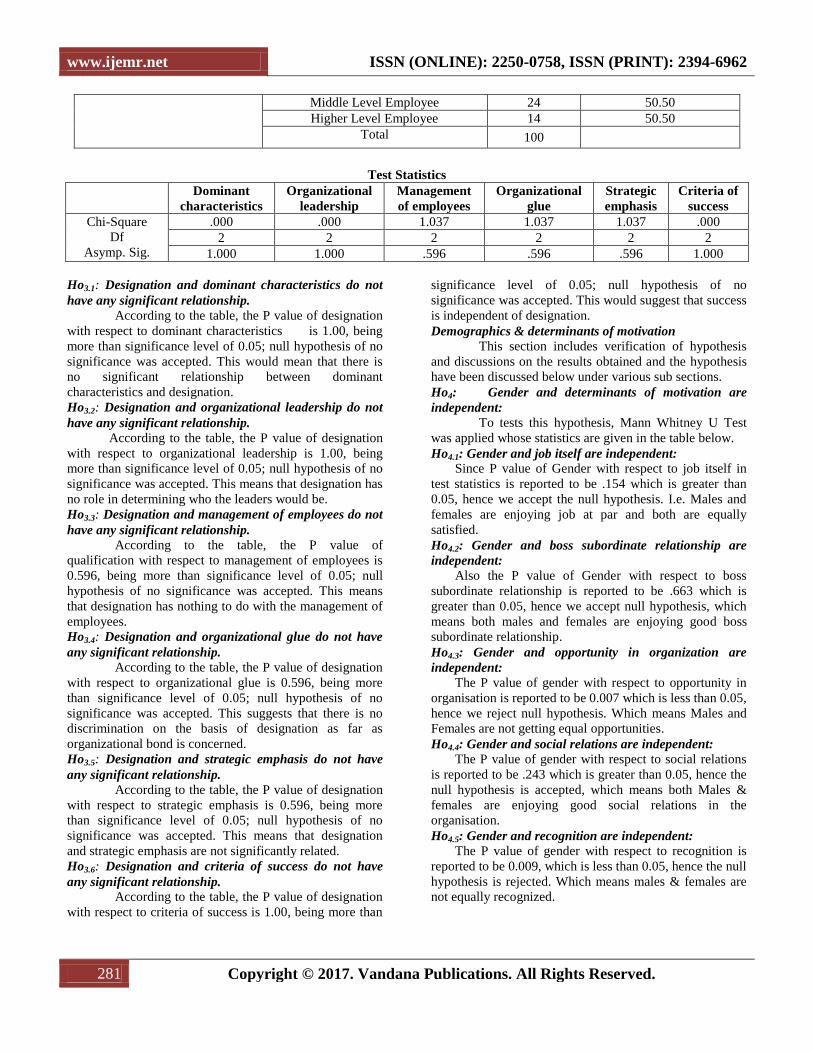
Ho3.1: Designation and dominant characteristics do not
have any significant relationship. According to the table, the P value of designation
with respect to dominant characteristics is 1.00, being
more than significance level of 0.05; null hypothesis of no
significance was accepted. This would mean that there is
no significant relationship between dominant
characteristics and designation.
Ho3.2: Designation and organizational leadership do not
have any significant relationship. According to the table, the P value of designation
with respect to organizational leadership is 1.00, being
more than significance level of 0.05; null hypothesis of no
significance was accepted. This means that designation has
no role in determining who the leaders would be.
Ho3.3: Designation and management of employees do not
have any significant relationship. According to the table, the P value of
qualification with respect to management of employees is
0.596, being more than significance level of 0.05; null
hypothesis of no significance was accepted. This means
that designation has nothing to do with the management of
employees.
Ho3.4: Designation and organizational glue do not have
any significant relationship. According to the table, the P value of designation
with respect to organizational glue is 0.596, being more
than significance level of 0.05; null hypothesis of no
significance was accepted. This suggests that there is no
discrimination on the basis of designation as far as
organizational bond is concerned.
Ho3.5: Designation and strategic emphasis do not have
any significant relationship. According to the table, the P value of designation
with respect to strategic emphasis is 0.596, being more
than significance level of 0.05; null hypothesis of no
significance was accepted. This means that designation
and strategic emphasis are not significantly related.
Ho3.6: Designation and criteria of success do not have
any significant relationship. According to the table, the P value of designation
with respect to criteria of success is 1.00, being more than
significance level of 0.05; null hypothesis of no
significance was accepted. This would suggest that success
is independent of designation.
Demographics & determinants of motivation
This section includes verification of hypothesis
and discussions on the results obtained and the hypothesis
have been discussed below under various sub sections.
Ho4: Gender and determinants of motivation are
independent:
To tests this hypothesis, Mann Whitney U Test
was applied whose statistics are given in the table below.
Ho4.1: Gender and job itself are independent:
Since P value of Gender with respect to job itself in
test statistics is reported to be .154 which is greater than
0.05, hence we accept the null hypothesis. I.e. Males and
females are enjoying job at par and both are equally
satisfied.
Ho4.2: Gender and boss subordinate relationship are
independent:
Also the P value of Gender with respect to boss
subordinate relationship is reported to be .663 which is
greater than 0.05, hence we accept null hypothesis, which
means both males and females are enjoying good boss
subordinate relationship.
Ho4.3: Gender and opportunity in organization are
independent:
The P value of gender with respect to opportunity in
organisation is reported to be 0.007 which is less than 0.05,
hence we reject null hypothesis. Which means Males and
Females are not getting equal opportunities.
Ho4.4: Gender and social relations are independent:
The P value of gender with respect to social relations
is reported to be .243 which is greater than 0.05, hence the
null hypothesis is accepted, which means both Males &
females are enjoying good social relations in the
organisation.
Ho4.5: Gender and recognition are independent:
The P value of gender with respect to recognition is
reported to be 0.009, which is less than 0.05, hence the null
hypothesis is rejected. Which means males & females are
not equally recognized.
www.ijemr.net ISSN (ONLINE): 2250-0758, ISSN (PRINT): 2394-6962
282 Copyright © 2017. Vandana Publications. All Rights Reserved.
Table 4: Verification of hypothesis:
Mann-Whitney Test/Ranks Gender N Mean Rank Sum of Ranks
Job itself
Male 70 53.18 3722.50
Female 30 44.25 1327.50
Total 100
Boss and subordinate relationship
Male 70 49.61 3472.50
Female 30 52.58 1577.50
Total 100
Opportunity in organization
Male 70 45.50 3185.00
Female 30 62.17 1865.00
Total 100
Social relations
Male 70 48.36 3385.00
Female 30 55.50 1665.00
Total 100
Recognition
Male 70 45.68 3197.50
Female 30 61.75 1852.50
Total 100
Test Statistics
Job itself
Boss and
subordinate
relationship
Opportunity in
organization Social relations Recognition
Mann-Whitney U 862.500 987.500 700.000 900.000 712.500
Wilcoxon W 1327.500 3472.500 3185.000 3385.000 3197.500
Z -1.424 -.478 -2.713 -1.168 -2.599
Asymp. Sig.
(2-tailed) .154 .633 .007 .243 .009
Ho5: qualification and determinants of motivation are
independent:
To tests this hypothesis, Mann Whitney U Test
was applied whose statistics are given in the table below.
Ho5.1: qualification and job itself are independent:
Since the P value of qualification with respect to
Job itself is reported to be 0.776 which is less than 0.05,
hence the null hypothesis is accepted, which means
qualification has no significant impact on doing job itself.
Ho5.2: qualification and boss subordinate relationship
are independent:
Also the P value of qualification with respect to
boss subordinate relationship is reported to b 0.007 in the
test statistics that is less than 0.05. hence the null
hypothesis is rejected, which means qualification has a
significant impact on the boss subordinate relationship.
Ho5.3: qualification and opportunity in organization are
independent:
The P value of qualification with respect to
opportunity in organisation is reported to be 0.412 which is
greater than 0.05. Hence the null hypothesis is accepted,
which means qualification and opportunity in organisation
are not significantly related.
Ho5.4: qualification and social relations are independent:
The P value of qualification with respect to social
relations is shown to be 0.00 which is less than 0.05.
Hence the null hypothesis is rejected which states that the
qualification which the employees possess has significant
impact on social relations.
Ho5.5: qualification and recognition are independent:
The P value of designation with respect to
recognition is shown to be 0.052, which is greater than
0.05. Hence the null hypothesis is accepted, which means
there is no significant relationship between qualification
and recognition.
Table 5: Verification of hypothesis:
Mann-Whitney Test/Ranks Qualification N Mean Rank Sum of Ranks
Job itself
UG 65 33.00 2145.00
3 0a .00 .00
Total 65
Boss and subordinate relationship UG 65 33.00 2145.00
www.ijemr.net ISSN (ONLINE): 2250-0758, ISSN (PRINT): 2394-6962
283 Copyright © 2017. Vandana Publications. All Rights Reserved.
3 0a .00 .00
Total 65
Opportunity in organization
UG 65 33.00 2145.00
3 0a .00 .00
Total 65
Social relations
UG 65 33.00 2145.00
3 0a .00 .00
Total 65
Recognition
UG 65 33.00 2145.00
3 0a .00 .00
Total 65
Test Statistics
Job itself
Boss and
subordinate
relationship
Opportunity in
organization Social relations Recognition
Mann-Whitney U 413.000 236.500 375.500 166.000 385.000
Wilcoxon W 518.000 2189.500 2328.500 2119.000 2338.000
Z -.285 -2.700 -.820 -3.692 -.672
Asymp. Sig.
(2-tailed) .776 .007 .412 .000 .502
Ho6: Designation & determinants of motivation are
independent
To tests this hypothesis, Mann Whitney U Test
was applied whose statistics are given in the table below.
Ho6.1: Designation &job itself are independent:
Since the P value of designation with respect to
Job itself is reported to be 0.776 which is less than 0.05,
hence the null hypothesis is accepted, which means
designation has no significant impact on doing job itself.
Ho6.2: Designation & boss subordinate relationship are
independent:
Also the P value of designation with respect to
boss subordinate relationship is reported to b 0.007 in the
test statistics that is less than 0.05: hence the null
hypothesis is rejected, which means designation has a
significant impact on the boss subordinate relationship.
Ho6.3: Designation & opportunity in organisation are
independent:
The P value of designation with respect to
opportunity in organisation is reported to be 0.412 which is
greater than 0.05. Hence the null hypothesis is accepted,
which means designation and opportunity in organisation
are not significantly related.
Ho6.4: Designation & social relations are independent:
The P value of designation with respect to social
relations is shown to be 0.00 which is less than 0.05.
Hence the null hypothesis is rejected which states that the
rank which the employees are enjoying has no significant
impact on social relations.
Ho6.5: Designation & recognition are independent:
The P value of designation with respect to
recognition is shown to be 0.052, which is greater than
0.05. Hence the null hypothesis is accepted, which means
there is no significant relationship between designation and
recognition.
Table 6: Verification of hypothesis:
Mann-Whitney Test/Ranks Designation N Mean Rank Sum of Ranks
Job itself
Lower level employee 62 38.84 2408.00
Higher level employee 14 37.00 2518.00
Total 76
Boss and subordinate relationship
Lower level employee 62 35.31 2189.50
Higher level employee 14 52.61 736.50
Total 76
Opportunity in organization
Lower level employee 62 37.56 2328.50
Higher level employee 14 42.68 597.50
Total 76
Social relations Lower level employee 62 34.18 2119.00
www.ijemr.net ISSN (ONLINE): 2250-0758, ISSN (PRINT): 2394-6962
284 Copyright © 2017. Vandana Publications. All Rights Reserved.
Higher level employee 14 57.64 807.00
Total 76
Recognition
Lower level employee 62 37.71 2338.00
Higher level employee 14 42.00 588.00
Total 76
Test Statistics
Job itself
Boss and
subordinate
relationship
Opportunity in
organization Social relations Recognition
Mann-Whitney U 413.000 236.500 375.500 166.000 385.000
Wilcoxon W 518.000 2189.500 2328.500 2119.000 2338.000
Z -.285 -2.700 -.820 -3.692 -.672
Asymp. Sig.
(2-tailed) .776 .007 .412 .000 .502
VI. RECOMMENDATIONS AND
SUGGESTIONS
The following are recommendations that I
recommend the management of IRCTC to consider as they
re-engineer and re-define the organisational culture in
order to induce employee motivation:-
1. The number of employees in IRCTC is dominated
by males. Male employees constitute about 70%
of total number of employees. This is evident
from frequency table as well as bar chart, which
means that the number of female employees is
quite low. Right now IRCTC requires more
young and dynamic female employees in tourism
and catering departments who will enhance the
quality of service delivery.
2. The results we obtained from our research
depicted that Males and Females are not getting
equal opportunities in IRCTC, which requires to
be corrected in the very near future in order to
excel further. The aspirants can have potential
irrespective of the gender and this potential can be
utilized if opportunities are provided equally to
both males and females.
3. One of the results depicted that designation has a
significant impact on the boss subordinate
relationship which means that higher level
employees are enjoying good boss subordinate
relationship as compared to the lower level
employees. In a situation like this lower level
employees may not be able to voice their
grievances at work. Thus communication process
should be made two ways so that the lower level
employees can voice their opinions in front of
higher level officials.
4. The gender and strategic emphasis were found to
have a significant relationship with each other in
IRCTC. It would be more favorable if gender
would have a lesser impact on strategic emphasis
because all employees, males or females need to
know the purpose of the organization and the
vision for the future so that they can help the
organisation in achieving its aims and objectives
will all their heart.
5. A culture should be developed where in
qualification is not the basis of developing social
relations. The lesser qualified employees can be
trained and developed to enhance their skills,
which would eventually lead to increase in
confidence and self esteem. This would create a
sense of equality among employees and lead to
better social relations irrespective of
qualifications.
VII. CONCLUSION
The purpose of this study was to present and
analyse data gathered from the respondents. The findings
were presented and analysed in accordance with the
theoretical framework. The objective was to investigate the
impact of demographics on organisational culture and
employee motivation and base the findings to the theories.
Mann Whitney, Kruskal test & were used to analyse the
data gathered so as to strengthen the validity and reliability
of the data.
1. There is a considerable gender difference among the
employees, out of which 70% were males and only 30%
were females.
2. The organization is having a well supportive
environment where both males and females feel
encouraged and come up with better performance thus
ensuring the employees to accomplish their work targets.
3. There is no significant impact of gender
The study showed that gender and determinants
of organisational culture do not have significant
relationship. It was also found that Qualification and
determinants of organisational culture do not show any
significant relationship. Gender and social relations were
www.ijemr.net ISSN (ONLINE): 2250-0758, ISSN (PRINT): 2394-6962
285 Copyright © 2017. Vandana Publications. All Rights Reserved.
found to be independent. However, it was noted that better
working environment is essential to induce employee
motivation. Irrespective of these, employees are motivated
to perform well because they live by the corporate culture
of the organisation.
REFERENCES
[1] Argyris, C. (1998) Organizational Learning: A
theory of Action Perspective, Addison Wesley, Reading.
[2] Alvesson, M. (2002).Understanding Organizational
Culture. UK: Sage Publication Ltd.
[3] Anthony, P. (1994). Managing Culture. London:
Open University Press.
[4] Armstrong M, (2005) A Handbook of Human
Resource Management Practice 10th Edition. London.
Kogan Page.
[5] Armstrong M, (2010) A Handbook of Human
Resource Management Practice 11th Edition. London.
Kogan Page
[6] Arnold, J. (2005) Work Psychology: Understanding
Human Behaviour in the Workplace, 4th edition.
London: FT Prentice Hall.
[7] Bandura, A. (2001) Social Cognitive Theory: An
Agentic Perspective, Annual Review of Psychology,
Volume 52.
[8] Brown, A. (1998) Organisational Culture, 2nd
edition: London: Pitman Publishing
[9] Burns, R (1994) Introduction to Research Methods.
2ndedition: Pearson Education
[10] Burrell, G. and Morgan, G. (1979) Sociological
paradigms and organizational analysis, Heinemann,
London
[11] Cameron, K.S. and Quinn, R.E. (2005).Diagnosing
and Changing Organizational Culture 2nd ed. USA:
Library of Congress Cataloguing-in-Publication.
[12] Conte, J.M. and Landy, F.J.(2010). Work in 21st
Century. 3rd ed. USA: Blackwell Publications Limited.
[13] Cook, T. and Campbell D.T. (1979) Quasi-
experimentation: Design and analysis issues for field
settings, Rand McNally, Chicago
[14] Cooper, D. R. and Schindler, P. S. (2003).Business
Research Methods.8th edition.
[15] Cresswell, J.W. (2003) Research Design:
Qualitative, Quantitative and Mixed Methods, 2nd
edition: USA, Sage Publication Ltd.