v, l .. ) OFFENDERS TO ADULT CORRECTIONAL CALENDAR 1976 tl ""'u.. OF CORRECTIONS \., ) .,'t> ,:p "'t \ .'". ' :" .. ,"J DEPARTMENT OF HEALTH AND SOCIAL SERVICES . DIVISION OF CORRECTIONS OFFICE OF SYSTEMS AND EVALUATION MADISON) WISCONSIN 53701 STATISTICAL BULLETIN C-53 JUNE 1977 If you have issues viewing or accessing this file contact us at NCJRS.gov.
Transcript
v, ~ l ..
)
OFFENDERS Anr~ITTED TO ADULT CORRECTIONAL INSTITUTIOi~S CALENDAR 1976
tl ""'u.. ",,~~
~ DIVISIO~y
OF CORRECTIONS
\., )
.,'t> ,:p
"'t ~.-.,.~,..{'~. '~""'''', "ir,:~ ',"~'~
~'.: \ .'". ' .~' :" "'~ ~ t~ .. :~~ ~ ,"J
DEPARTMENT OF HEALTH AND SOCIAL SERVICES . DIVISION OF CORRECTIONS
OFFICE OF SYSTEMS AND EVALUATION MADISON) WISCONSIN 53701
STATISTICAL BULLETIN C-53 JUNE 1977
If you have issues viewing or accessing this file contact us at NCJRS.gov.
S TAT E 0 F W I S CON SIN
DEPARTMENT OF HEALTH AND SOCIAL SERVICES Manuel Carball 0, Secretat'Y
DIVISION OF CORRECTIONS Allyn R. Sielaff, Administrator
OFFICE OF SYSTEMS AND EVALUATION Paul H. Kusuda, Director
Perry C. Baker, Assistant Director, Statistics and Evaluation Section Theodore H. Johnson, Assistant Director, Records Development Section
• J
Table 1 TYPE OF ADDITION
Additions to the Population of Residents At Wisconsin Adult Correctional Institutions
. (1975 and 1976 Compared)
Total Total I WCCS WHW Type of Addition Total Males Females WSP WSR WCI KMCl I Male Female Male Female
______________ ~ __ ~~1~97~5~1~97~6~1~9~75~1~9~76~~19~7~5~1~97~6~1~9~75~1~9~76~~19~7~5~19~7~6~1~97~5+1~9~76~1~9~7~5~"~97~6~!1~9~75~19~7~6_P9~75~19~7~6~1~97~5+1~9~7G~·~1~97~5+1~9~76 I .
New Admission New sentence New sentence, adult
probation violator I New sentence, Y.O.
probation violator New sentence, juvenile
probation violator Adult probation violator -
no new sentence
New sentence, Y.O. Parole violator I
New sentence, juvenile I',
aftercare violator Assi9nment from Y.O. Inst.
Re-admission With New Sentence
Adult parole violator Adult MR violator
Re-admission Without New Sentence
Adult parole violator Adult MR Violator Voluntary return from
parole/MR
Temporary Hold Pending Revocation Hearing
Parole Probati on
Transfer from: Adult Institution Adult Institution
~ l ~, ~ \ ~ \ ~ ~ ~: ~, ~.1 ~ ~ i ~ ~'~ ~ ~ " ~ I 42
8 2
l~fl ~ 44 60
117 m "l18 67
49 51
33 ~ 16 7 17 15
47
8
113 70
43
, - I
42 I i l
- I 2 ,
133 74
59 i
113 114 i 65 64
48 50
25 18 15 7' 10 11
2,9711~ ~,971 3,238 2,658I J ,UI I ,658 2,944
313 294 313 294
1 ,810 1, 906 kll1:hZZ.[
94 118 89 108 1,683 1,762 ,593 1,647
33 26 32 23
- I 47 \ 42 _ _ -' _ I - -:
2 T 1
1
- I _ - ,
65' 77 42 34 23' 43
4 4 59. 63 '3 '3' 34 I TI 1 1 t 25 30
8 T 7
I I
.1.1 19 - \ 12 4 i 7
.:. §l! 550 - 67 550
7 '3 4
406 406
2§. 128 ill 750
5 10 75 77 90 115 634 668 1 3 8 5
8
48 28 20
2
56 4D 16
54, 51 3T 3T 23 t 20
I '
.:.!
- I
- I _ I I
_ ~ _ t _
6 n I .:. .:.; '3 4 I - -.
25: 32: I 58: 15~: 25: 32~ \ 58~ 152:
463 427 323 269
8 22 446 396
9 9
6 7 310 261
7 1
I
-I , I \
.:.'
-'
m '489 ;!...&2i~; :. 291 ~489 781 949!-
- 2 74 i173 6 I 4
313 294
122 135 -
- \
- 1
- - --
53 ill 253 53 197 253
2 7 14 - 2 4
2 T 1
4 ~'
1
8 T 7
1
4 '3' 1
4
Ii 14
96 ill
5 10 90 113 1 3
Note: Additions include all types of movement into adult correctional institutions. Subsequent tables include only admissions into the correctional system for adult residents. Table 1 excludes status change admissions Which are shown on Table la and are included in all subsequent Tables.
,.
•
-2-
Table lA TYPE OF STATUS CHANGE ADMISSION/a
Additions to the Population of Residents at Wisconsin Adult Correctional Institutions
(1975 ~nd 1976 compared)
Type of Admission
TOTAL
New admission New sentence, adult probation violator Adult probation violator - no new sentence Re-admission with new sentence Adult parole violator Adult mandatory release violator Re-admission without' new sentence Adult parole violator Adult mandatory release violator
Total 1975 1976
37 13
18 7 13 6
5 1 1
1
19 5
13 1 6 4
/a Table 1 excludes status change admissions for residents temporarily admitted' p~nding revocation hearings whose admission status was changed to the permanent categories shown. The characteristics of these residents are included in all following tables.
., .~. ,IJ
-3-
Table 2 TYPE OF COMMITMENT
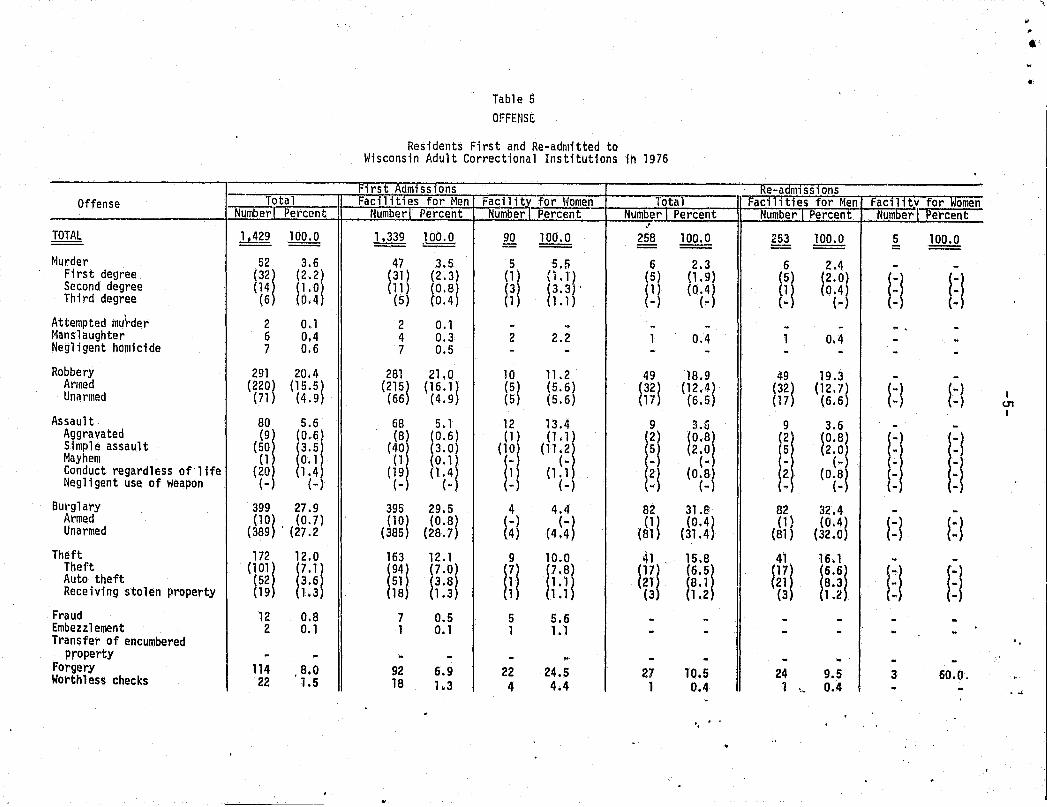
Residents First and Re-admitted to Wisconsin Adult Correctional Institutions in 1976
Type of Commitment
TOTAL FIRST ADMISSIONS Regular Commitment
Felony Misdemeanor
Sex deviate commitment TOTAL RE-ADMISSIONS Regular commitment
New sentence (499) (34.9) ( 460 ) ( 34.4 ) No new sentence (43) (3.0) (43) (3.2)
Juvenile aftercare violator 2 0.1 2 0.2
TOTAL R~ADMISSION~ 258 100.0 253 '100.0 =
Violators 258 100.0 253 100.0 .
Facili:t;y· for Women
NumberlPercent
90 100.0 90 100.0
(90) (100.0) (-) ( ... ) - -5 100.0 5 .. 100.0
. (5 r (l 00 . 0 ) (-) (-)
- ...
.-
Facil ity for Women
Numberl Percent 90 --90 51 39
(39) (-) -
. 5 -5 -
100.0
100.0 56.7 43.3
(43.3 (--
100.0
100.0
) )
-
'.J rt,
Age Total Numberl Percent
TOTAL 1,429 100.0 -- --Uncle\" 20 l::ears 335 23.4 16 years -3 D.2 17 yeil\"S 16 1.1 18 years 152 10.6 19 years 164 11.5
f.Q to 24 years 618 43.3 20 years m 12.4 21 yea rs 155 10:8 22 yea\"s 107 7.5 23 years 1 01 7.1 24 years 78 5.5
, 25 to 29 ~ears 214 14.9 25 years 51 ""3.6 26 years 40 2.8 27 years 52 3.6 28 years 33 2.3 29 years 38 2.6
30 to 34 years ill. .!!d 35 to 39 years 58 !:l 40 to 44 year.§ 38 2.6 45 to 49 years 28 b.Q. 50 to 54 years 11 !hi 55 to 64 yeau §. 0.4 65 l::ears and over 1 Q.J.
Table 4 AGE
Residents First and Re-admttted to Wisconsin Adult Correctional Institutions in 1976
First Adm1ss1ons Facilities for Men Facility for Women Total
Numberl Percent NumberJ Percent Number I Percent
1,339 100.0 90 100.0 258 100.0 -- --328 24.5 L l..J! i .Ll -3 0:2 - - - -
Prison or Taycheedah 63 4.4 52 3.9 Reformatory 133 9.3 133 9.9 Prison or Reformatory 6 0.4 6 , 0.5
Not at a Wisconsin institution but at other prison or
124 reformatory 8.7 122 9.1
Not at any penal institution but served a jail sentence 402 28.1 402 30.-0
~--------------------- ---
Facil ity' for Women
Numberl Percent
9Q 100.0
57 63.3 33 36.7 18 20.0
8 8.9 7 7.8
Faci 1 ity for "Iomen
Number-I Percent
90 100.0
77 85.6 - --13 14.4 -11 12.2 - -- -
2 2.2
- -
j j 1,... , '
-13-
Table 13 JUVENILE INSTITUTION EXPERIENCE
Residents First Admitted to Wisconsin Adult Correctional Institutions in 1976
Juvenile Institution Experience Total Numberl Percent
TOTAL 1,429 100.0 None recorded 1,053 73.7 At Wisconsin Institutions 320 22.4 Wisconsin juvenile traifiing schools 320 22.4 Wisconsin Child Center - -Wisconsin juvenile training
schools and Wisconsin Child Center - -
Not at Wisconsin Public Institutions but at other children's institutions 56 3.9 -
:Residents First Admitt~d 'to Wisconsin Adult Correctional Institutions in 1976
Facilities Achievement Test Total for Men
NumberlPercent NumberTPercent
TOTAL 1,429 100.0 1 ,339 100.0
Less than fourth grade 81 5.7 80 6.0 Fourth grade Fifth grade Sixth grade
Seventh grade Eighth grade Ninth grade
Tenth grade Eleventh grade Twelfth grade or more
Not tested
71 5.0 83 5.8
135 9.5
"46 10.2 159 11.1 185 12.9
163 11.4 117 8.1 158 11 .1
131 9.2
Table 16 INTELLIGENCE ESTIMATE
" ,
69 81
125
136 142 172
152 111 156
115
,Residents First Admitted to
5.1 6.0 9.3
10. 1 10.6 12.9
11.4 8.3
11.7
8.6
Wisconsin Adult Correctional Institutions in 1976
Facilities Intelligence Estimate Total for Men
NumberlPercent NumberlPercent
TOTAL 1,429 100.0 1,339 100.0
S~perior and above 11 0.8 10 0.8 Bright normal 130 9.1 127 9.5 Average or normal 576 40.3 560 41.8
Dull normal 218 15.2 209 15.6 Borderline 54 3.8 52 3.9 Defect; ve 14 1.0 13
• 1.0
Not tested 426 29.8 368, 27.4
Tables prepared by: Judith Goth, Management Information Technician Office of Systems and Evaluation Division of Corrections P.O. Box 669 Madison, WI 53701