76
DEPARTMENT OF PLANNING, TRANSPORT AND INFRASTRUCTURE ANNUAL REPORT 2011-12

Department of planning, transport anD infrastructure
annual report 2011-12

Prepared by the Department of Planning, Transport and Infrastructure, September 2012.
GPO Box 1533 Adelaide SA 5000
Telephone (08) 8463 6225Facsimile (08) 8303 0828Website www.dpti.sa.gov.au
Annual Report – (Print) ISSN 1448-7357Annual Report – (Online) ISSN 1448-742XABN 92 366 288 135
Creative CommonsThis work is licensed under a Creative CommonsAttribution 3.0 Australia Licence. A summary of the license terms is available fromhttp://creativecommons.org/licenses/by/3.0/au/deed.en

Department of Planning, Transport and Infrastructure Annual Report 2011-12
The Honourable John Rau MP
Minister for Planning
The Honourable Patrick Conlon MP
Minister for Transport and Infrastructure
Minister for Housing and Urban Development
The Honourable Jennifer Rankine MP
Minister for Road Safety
The Honourable Tom Kenyon MP
Minister for Recreation and Sport
The Honourable Chloë Fox MP
Minister for Transport Services
Dear Ministers
I am pleased to present the Annual Report of the Department of Planning, Transport and Infrastructure for the year ending 30 June 2012.
This report is a submission to Parliament and complies with the requirements of the Public Sector Act 2009, Public Finance and Audit Act 1987 and other relevant acts. The report of the Commissioner of Highways under the provisions of the Highways Act 1926 is also incorporated in this report.
Yours sincerely
Rod Hook
CHIEF EXECUTIVE
DEPARTMENT OF PLANNING, TRANSPORT AND INFRASTRUCTURE
28 September 2012

Department of Planning, Transport and Infrastructure Annual Report 2011-12
Commissioner of Highways Statement
As Commissioner of Highways I am charged with the duty of carrying the Highways Act 1926 into effect. Pursuant to section 28 of the Act the Commissioner has powers to make further and better provision for the construction and maintenance of roads and other works. In discharging these requirements under the Act, the Commissioner has the obligation to report on the operation of the Act.
Under my direction, the department continues to meet the requirements of the Act and to meet the policy objectives of the government. The requirements of the Act and the role, responsibilities and objectives of the department are intrinsically linked. Accordingly, I am pleased to provide the following report of the department as a report satisfying the requirements of the Highways Act. Financial matters relating to the Highways Fund have been incorporated into the Financial Statements of the department and the notes to and forming part of the statements.
Rod Hook
COMMISSIONER OF HIGHWAYS
Department of Planning, Transport and Infrastructure Annual Report 2011-12
ContentsFOREWORD 7
HIGHLIGHTS FOR 2011-12 9PLANNING REFORMS 9
THE RIVERBANK PRECINCT 9
ADELAIDE CONVENTION CENTRE REDEVELOPMENT 9
ADELAIDE OVAL REDEVELOPMENT 9
THE PARKS COMMUNITY CENTRE REDEVELOPMENT 10
PRIORITY TO PUBLIC TRANSPORT, PEDESTRIANS AND CYCLISTS 10
UPGRADING PUBLIC TRANSPORT 10
NORTH SOUTH CORRIDOR 10
DUKES HIGHWAY SAFETY IMPROVEMENT 11
ROAD REHABILITATION AND RESURFACING 11
NATIONAL TRANSPORT REGULATORY REFORM 11
TOWARDS ZERO TOGETHER: SOUTH AUSTRALIA’S ROAD STRATEGY 2020 11
BUILDING MANAGEMENT 11
RECREATION AND SPORT 11
ABOUT THE DEPARTMENT 12VISION 12
VALUES (AREA) 12
OPERATIONS AND INITIATIVES 13
ORGANISATIONAL CHART 15
GROUP OPERATIONS 17OFFICE OF THE CHIEF EXECUTIVE 17
PLANNING 17
BUSINESS SERVICES 17
PUBLIC TRANSPORT SERVICES 17
TRANSPORT SERVICES 17
SOUTH AUSTRALIA’S STRATEGIC PLAN TARGETS 19SEVEN STRATEGIC PRIORITIES 19
ACHIEVING THE OBJECTIVES OF SOUTH AUSTRALIA’S STRATEGIC PLAN 19
our community 20
TARGET 1: URBAN SPACES 20
TARGET 2: CYCLING 20
TARGET 6: ABORIGINAL WELLBEING 20
TARGET 22: ROAD SAFETY 21
TARGET 30: BOARDS AND COMMITTEES 21
TARGET 31: CHAIRS OF BOARDS AND COMMITTEES 21
TARGET 32: CUSTOMER AND CLIENT SATISFACTION WITH GOVERNMENT SERVICES 21
TARGET 33: GOVERNMENT PLANNING DECISIONS 21
Department of Planning, Transport and Infrastructure Annual Report 2011-12
OUR PROSPERITY 22
TARGET 50: PEOPLE WITH A DISABILITY 22
TARGET 52: WOMEN 22
TARGET 53: ABORIGINAL EMPLOYEES 22
TARGET 56: STRATEGIC INFRASTRUCTURE 22
OUR ENVIRONMENT 23
TARGET 61: ENERGY EFFICIENCY – GOVERNMENT BUILDINGS 23
TARGET 63: USE OF PUBLIC TRANSPORT 23
TARGET 68: URBAN DEVELOPMENT 24
OUR HEALTH 24
TARGET 83: SPORT AND RECREATION 24
FUTURE DIRECTIONS 27
Freedom oF InFormatIon act 1991 31
APPENDICES 33MACHINERY OF GOVERNMENT 33
LEGISLATION 33
BOARDS AND COMMITTEES 36
FRAUD 37
WHISTLEBLOWERS ACT 37
MANAGEMENT OF HUMAN RESOURCES 38
CONTRACTUAL ARRANGEMENTS 49
CONSULTANCIES 50
OVERSEAS TRAVEL 53
ACCOUNT PAYMENT PERFORMANCE 2011-12 54
URBAN DESIGN CHARTER 55
GREENING OF GOVERNMENT OPERATIONS 56
ENERGY EFFICIENCY ACTION PLAN REPORT 59
DISABILITY ACTION PLAN 60
REPORTS FROM THE REGISTRAR OF MOTOR VEHICLES 63
REPORTING AGAINST THE AIR TRANSPORT ACT 2002 66
REPORTING AGAINST THE PASSENGER TRANSPORT ACT 1994 67
REPORTING AGAINST THE CARERS RECOGNITION ACT 2005 72
FINANCIAL STATEMENTS 75

7
Department of Planning, Transport and Infrastructure Annual Report 2011-12
FOREWORDIt is with great pleasure that I present the Department of Planning, Transport and Infrastructure’s 2011-12 Annual Report, the first in the agency’s short history.
Borne of the machinery of government process undertaken late last year, the department delivers the state government’s planning, transport and infrastructure agenda through the collective efforts of almost four thousand people.
The department works within an operating budget of $1.4 billion and an approved capital investing program for 2012-13 of $1.3 billion. As a percentage of total operational expenditure this department has the lowest employment costs of any government agency.
With the advent of the deprtment the design, procurement, maintenance and operation of the state’s largest public assets, be they physical infrastructure or land holdings, reside with a single government agency – for the first time.
Along with the vital regulatory roles the department performs, the integration of these important government streams has delivered a new agency with an unprecedented role in setting strategic directions for the state.
And while it is in its infancy, the department is already delivering for the people of South Australia.
2011-12 will be remembered as the year the investment potential tightly locked within the terraces of Adelaide, was finally unleashed through a series of ground-breaking planning reforms. Such a significant breakthrough in the early months of a department’s existence bodes well for the future.
Similarly memorable is the continued emergence of Adelaide’s riverbank precinct which has finally begun the transformation from plan to place. In the last 12 months, major works began on the redevelopment of both the Adelaide Convention Centre and the Adelaide Oval.
Across the state the department oversaw the delivery of Towards Zero Together, South Australia’s new road safety strategy to 2020, which targets less than 80 fatalities and 800 serious injuries per annum by the end of the decade.
And despite the restraints of an uncertain financial climate, the commitment to delivering a public transport system South Australians can be truly proud of continued in earnest.
I have already seen enough to know the department is a resilient workforce ready for the challenges prevailing economic conditions present. Indeed we enter a new financial year extremely well placed to deliver on what remain historically significant operational and capital programs.
In delivering this Annual Report I would like to acknowledge the leadership and support provided by our Ministers: the Honourable John Rau MP, Minister for Planning, the Honourable Patrick Conlon MP, Minister for Transport and Infrastructure, the Honourable Jennifer Rankine MP, Minister for Road Safety, the Honourable Tom Kenyon MP, Minister for Recreation and Sport and the Honourable Chloë Fox MP, Minister for Transport Services.
Rod HookCHIEF EXECUTIVE

8
Department of Planning, Transport and Infrastructure Annual Report 2011-12

9
Department of Planning, Transport and Infrastructure Annual Report 2011-12
HIGHLIGHts FoR 2011-12PLANNING REFORMSThe department completed the reform of South Australia’s land use planning policies, which guide the growth and development of the state’s urban and regional communities. The reform simplified and standardised the policies to allow for more consistent and flexible rezoning, resulting in fewer barriers to development and more efficient assessment.
The new policies prepared the way for an amendment to the Adelaide City Development Plan that will unlock and stimulate investment in housing, support urban renewal and generate economic activity and jobs in the city. A new review process to ensure high-quality urban design and a pre-lodgement service to streamline assessments for large development projects were put in place to support the policy changes.
THE RIVERBANK PRECINCTThe Riverbank Master Plan, a vision for a new social, cultural and entertainment hub for the city, was finalised and released to the public for comment and expressions of interest. The department began evaluating the many proposals and ideas put forward to transform the underutilised area into an inviting, lively gathering place for people and events. The precinct will also form a unified panoramic landscape that ties together the upgraded Adelaide Oval, the redeveloped Adelaide Convention Centre, the new Royal Adelaide Hospital and the open spaces of the parklands.
ADELAIDE CONVENTION CENTRE REDEVELOPMENTThe department began stage one of the $350 million redevelopment of the Adelaide Convention Centre with the westward extension of the facility over the railway lines to link with Morphett Street Bridge. The expansion will add about 4300 square metres of floor space to the centre. Stage two, replacement of the existing plenary building, is scheduled for completion in mid 2017.
ADELAIDE OVAL REDEVELOPMENTConstruction to redevelop the Adelaide Oval into a world-class home for football and cricket began in April. The Chappell and Bradman Stands were demolished and the removal of some 280 000 tonnes of earth was started to make way for new southern and eastern stands (seating 14 000 and 19 000 spectators respectively). Many heritage features have been retained, including the scoreboard and 8,500 flip-style seats, which were offered to ninety community sporting clubs.
Works also started on the northern mound and a 3000-capacity seating bowl, which are expected to be complete in December 2012. The southern stand will be finished in time for the 2013 Ashes Test, with the remainder of the works to finish by March 2014. The $535 million project is being managed to allow continued playing of domestic and international cricket throughout construction.

10
Department of Planning, Transport and Infrastructure Annual Report 2011-12
tHe PARKs CoMMUnItY CentRe ReDeVeLoPMentThe department announced plans to redevelop the Parks Community Centre into a new home for local sport, recreation, health and cultural activities. The upgrade includes a 25-metre swimming pool and indoor children’s pool, a café and public plaza, 6.84 hectares of open space with soccer pitches and a playground, and a refurbished and extended children’s centre. The $28.7 million project will be completed in two stages starting in late 2012 and finishing in mid 2014.
PRIoRItY to PUBLIC tRAnsPoRt, PeDestRIAns AnD CYCLIsts In the first of several initiatives to prioritise public transport and the movement of people rather than cars in Adelaide, the department established dedicated bus lanes along the length of Currie and Grenfell Streets and part of East Terrace. The lanes operate between 7am and 7pm, Monday to Friday, allowing easier and faster bus travel across the city. Taxis, cyclists and emergency vehicles also use the lanes.
The department continued installing dedicated cycling and walking routes (Greenways) across Adelaide, with the Adelaide to Marino Rocks section reaching completion. Other works included the installation of pedestrian activated crossings at Marion/Daws Roads, Oaklands Park and Greenhill Road, and a new bridge and paths at Oaklands Park. It also developed a project list to improve safety and access for cyclists and enhance existing cycling facilities on the arterial network.
UPGRADInG PUBLIC tRAnsPoRtThe department continued to advance its revitalisation of Adelaide’s public transport network throughout the year by: providing new bus services in the Outer South and Outer North, including Gawler; refurbishing ninety per cent of the 3000/3100 railcar fleet; continuing the rail line extension to Seaford; building new railway stations at Elizabeth and Munno Para, upgrading Hallett Cove Beach, Elizabeth South, Gawler, Chidda and Evanston stations, and developing a new car park at Smithfield Station.
In addition, the department has been preparing for the delivery of Metrocard, a new smartcard ticketing system.
noRtH soUtH CoRRIDoR The north-south transport corridor between Gawler and Old Noarlunga continued to evolve in 2011-12, with two new components well underway and on schedule.
Construction of the 4.8 kilometre, non-stop South Road Superway between the Port River Expressway and Regency Road reached a major milestone with foundations laid for the 2.8 kilometre elevated roadway to bypass several busy intersections. The $842 million state and federally funded project – the biggest single investment in a South Australian road project and the state’s most complex engineering roadwork – will be completed in late 2013.
Work also began on the $407.5 million duplication of the Southern Expressway with excavation and construction of a new carriageway on the western side of the existing expressway. The result will be a two-way 18.5 kilometre link between Bedford Park and Old Noarlunga by mid-2014.

11
Department of Planning, Transport and Infrastructure Annual Report 2011-12
DUKes HIGHWAY sAFetY IMPRoVeMentThe department continued the rollout of its six-year program of safety improvements on the Dukes Highway with installation of a state-first centreline treatment on 32 kilometres of road between Tailem Bend and Coomandook and between Bordertown and the Victorian border. The 1.2 metre wide centreline has audio tactile features, which cause vibration and a rumbling sound to warn drivers when their vehicles stray across it.
Other works included: removal of trees to create a 5-6 metre clear zone; installation of roadside safety barriers; completion of three new overtaking lanes and progression of a further three lanes and one extension; and pavement reconstruction between Meatworks Road junction and the Pinnaroo turnoff.
RoAD ReHABILItAtIon AnD ResURFACInGThe department rehabilitated or resurfaced about 675 lane kilometres of road across South Australia in 2011-12.
nAtIonAL tRAnsPoRt ReGULAtoRY ReFoRMThe department provided input to the development of new national laws and frameworks for transport regulation. A significant reform was the integration of regulation across road, marine and rail, which will deliver a national transport system that is safe, secure, efficient and reliable, and that supports national social, economic and environmental prosperity. The reform was approved under the Council of Australian Governments (COAG) National Partnership Agreement to Deliver a Seamless National Economy.
TOWARDS ZERO TOGETHER: soUtH AUstRALIA’s RoAD stRAteGY 2020The state government launched its new road safety strategy, which sets a target of less than 80 fatalities and 800 serious injuries per year by 2020. The strategy is complemented by the Road Safety Action Plan 2011 & 2012, which was launched in October 2011 and aims to reduce serious casualty trauma by at least 30 per cent during the decade.
BUILDInG MAnAGeMentIn 2011-12 the department managed 430 major building construction projects in various phases of delivery with a total value of $2.93 billion. The projects included construction of the South Australian Health and Medical Research Institute (SAHMRI), Adelaide Film and Screen Centre, SA Police headquarters fit-out, Flinders Medical Centre redevelopment, Noarlunga GP Plus Health Care Centre, Fort Largs Police Academy, Women’s and Children’s Hospital Children’s Cancer Centre and Ceduna District Health Service redevelopment.
ReCReAtIon AnD sPoRt A South Australian Sports Institute services (SASI) hub for water sports was established at the SA Aquatic and Leisure Centre in Marion. The hub accommodates SASI staff and resident coaches and features a dry-land diving training hall with viewing windows and specialised equipment for above and underwater video analysis and biomechanical feedback monitoring.
The SA Aquatic and Leisure Centre, which opened in early 2011, hosted three major events that doubled as Olympic Trials: the Australian Swimming Championships – the largest swimming event ever held in the state, with 834 competitors and 47,500 spectators; the 2012 Australian Olympic Dive Team trials; and the Australian Age Diving Championships.

12
Department of Planning, Transport and Infrastructure Annual Report 2011-12
ABOUT THE DEPARTMENTVISIONTo provide safe, effective and efficient planning, transport and infrastructure networks, supporting the interests of all South Australians.
VALUES (AREA)To deliver our core responsibilities our philosophy is for the department workforce to be: Aligned committed to the vision and strategic priorities Responsive focussed on delivery Empowered encouraged to be bold and innovative Accountable responsible to the people of South Australia

13
Department of Planning, Transport and Infrastructure Annual Report 2011-12
The department was created by an amalgamation of the former Department of Transport, Energy and Infrastructure and the Planning, Recreation and Sport and Racing functions of the former Department of Planning and Local Government.
The department employs around 3,600 people and with responsibility for a diverse range of government services, has the opportunity to positively impact the lives of more than a million South Australians every day.
oPeRAtIons AnD InItIAtIVesWith a focus on building a culture of alignment, responsiveness, empowerment and accountability and with a commitment to safety, service delivery and communication, the department is:
> Ensuring public access to an efficiently regulated and safe transport environment across road, rail and marine (including public transport).
> Providing strategic land use and transport planning and development assessment functions supporting government policy and strategic objectives.
> Facilitating the planning and delivery of major projects and provision of essential infrastructure consistent with priorities set out in South Australia’s Strategic Plan.
> Managing the state government’s building assets.
> Developing policy and programs, the provision of funding, recreation and sport planning, infrastructure development, elite sport pathways and the promotion of physical activity.
> Administering property values and transactions and support for land boundary definitions.

14
Department of Planning, Transport and Infrastructure Annual Report 2011-12

15
Department of Planning, Transport and Infrastructure Annual Report 2011-12
GroupsMinisters
oRGAnIsAtIonAL CHARtThe following structure of the Department of Planning, Transport and Infrastructure was in place at 30 June 2012.
Hon JOHN RAU MP Minister for Planning
Hon PATRICK CONLON MP Minister for transport and
Infrastructure Minister for Housing and
Urban Development
Hon JENNIFER RANKINE MP Minister for Road safety
Hon TOM KENYON MPMinister for Recreation and sport
Hon CHLOË FOX MP Minister for transport services
Office of the Chief ExecutiveRod Hook
Chief executiveCommissioner of Highways
PlanningJohn Hanlon
Deputy Chief executive
Business ServicesLino Di Lernia
Deputy Chief executive
Public Transportemma thomas
Deputy Chief executive
Transport ServicesAndy Milazzo
Deputy Chief executive

16
Department of Planning, Transport and Infrastructure Annual Report 2011-12

17
Department of Planning, Transport and Infrastructure Annual Report 2011-12
GROUP OPERATIONSOFFICE OF THE CHIEF EXECUTIVEThe Office of the Chief Executive has operational oversight of the department and includes a dedicated strategic projects focus and the department’s centralised communications and community relations function.
PLANNINGPlanning drives strategic land use, transport and infrastructure planning for the state. It is responsible for planning and land-use management policy and regulation; transport planning and policy; and land survey, property valuation and administration services. It also oversees vehicle registration and licensing, the Office of Cycling and Walking, and the department’s road safety functions.
BUSINESS SERVICESBusiness Services is responsible for the provision of building management services, including facilities management across government, corporate services within the department, and policy and services related to recreation, sport and racing.
PUBLIC TRANSPORT SERVICESPublic Transport Services is responsible for the operation and regulation of the passenger transport network, including bus, train and tram services, and the regulation of the state’s taxi industry. A key focus is managing the programming and delivery of the significant capital investment in public transport, including electrification of rail.
TRANSPORT SERVICESTransport Services is responsible for the maintenance and operation of the state’s transport network and regulation of its use, and the delivery of major infrastructure projects.

18
Department of Planning, Transport and Infrastructure Annual Report 2011-12

19
Department of Planning, Transport and Infrastructure Annual Report 2011-12
SOUTH AUSTRALIA’S STRATEGIC PLAN TARGETSseVen stRAteGIC PRIoRItIes The Premier set out seven priorities to focus and drive the work of the state government in addressing major challenges, resolving community issues and planning the long-term future of our state:
1. Creating a vibrant city
2. Safe communities, healthy neighbourhoods
3. An affordable place to live
4. Every chance for every child
5. Growing advanced manufacturing
6. Realising the benefits of the mining boom for all South Australians
7. Premium food and wine from our clean environment.
ACHIeVInG tHe oBJeCtIVes oF SOUTH AUSTRALIA’S STRATEGIC PLANSouth Australia’s Strategic Plan guides individuals, community organisations, governments and businesses to secure the wellbeing of all South Australians. The Plan contains our community’s visions and goals; its 100 measurable targets reflect our priorities. The Plan identifies priorities for South Australia. These are our pillars for success.
> Our Community
> Our Prosperity
> Our Environment
> Our Health
> Our Education
> Our Ideas
20
Department of Planning, Transport and Infrastructure Annual Report 2011-12
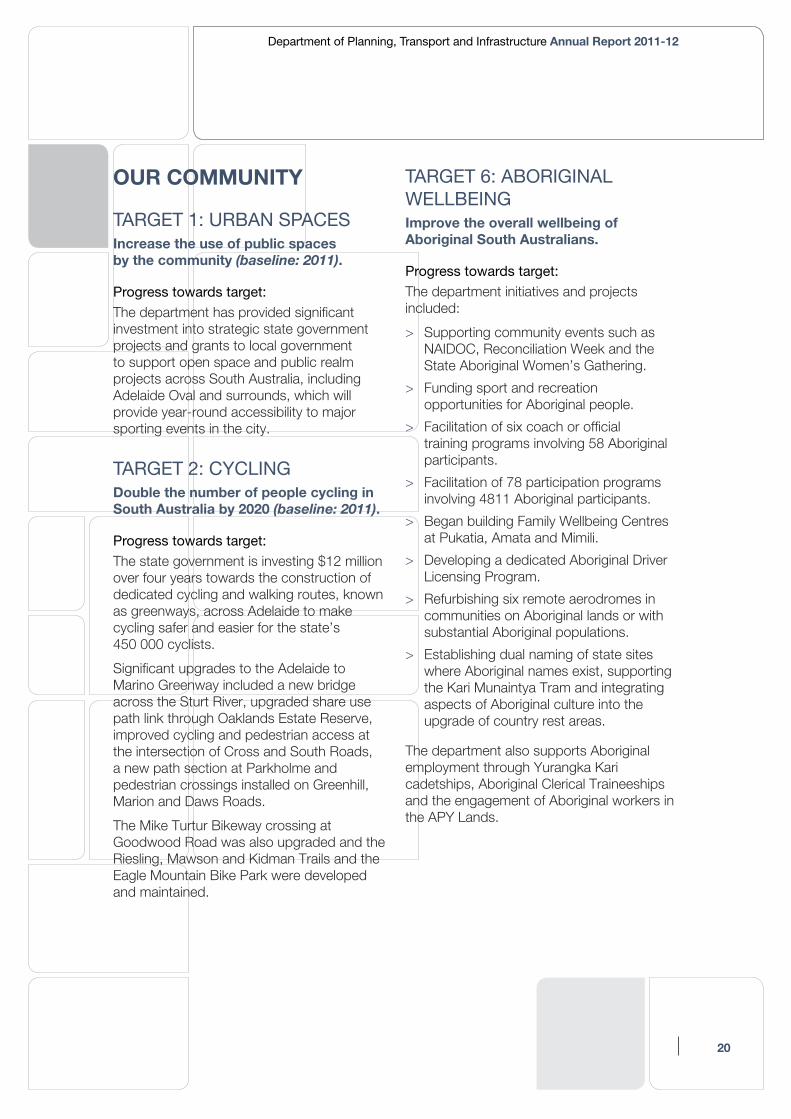
OUR COMMUNITY
tARGet 1: URBAn sPACesIncrease the use of public spaces by the community (baseline: 2011).
Progress towards target:
The department has provided significant investment into strategic state government projects and grants to local government to support open space and public realm projects across South Australia, including Adelaide Oval and surrounds, which will provide year-round accessibility to major sporting events in the city.
tARGet 2: CYCLInGDouble the number of people cycling in South Australia by 2020 (baseline: 2011).
Progress towards target:
The state government is investing $12 million over four years towards the construction of dedicated cycling and walking routes, known as greenways, across Adelaide to make cycling safer and easier for the state’s 450 000 cyclists.
Significant upgrades to the Adelaide to Marino Greenway included a new bridge across the Sturt River, upgraded share use path link through Oaklands Estate Reserve, improved cycling and pedestrian access at the intersection of Cross and South Roads, a new path section at Parkholme and pedestrian crossings installed on Greenhill, Marion and Daws Roads.
The Mike Turtur Bikeway crossing at Goodwood Road was also upgraded and the Riesling, Mawson and Kidman Trails and the Eagle Mountain Bike Park were developed and maintained.
tARGet 6: ABoRIGInAL WeLLBeInGImprove the overall wellbeing of Aboriginal South Australians.
Progress towards target:
The department initiatives and projects included:
> Supporting community events such as NAIDOC, Reconciliation Week and the State Aboriginal Women’s Gathering.
> Funding sport and recreation opportunities for Aboriginal people.
> Facilitation of six coach or official training programs involving 58 Aboriginal participants.
> Facilitation of 78 participation programs involving 4811 Aboriginal participants.
> Began building Family Wellbeing Centres at Pukatia, Amata and Mimili.
> Developing a dedicated Aboriginal Driver Licensing Program.
> Refurbishing six remote aerodromes in communities on Aboriginal lands or with substantial Aboriginal populations.
> Establishing dual naming of state sites where Aboriginal names exist, supporting the Kari Munaintya Tram and integrating aspects of Aboriginal culture into the upgrade of country rest areas.
The department also supports Aboriginal employment through Yurangka Kari cadetships, Aboriginal Clerical Traineeships and the engagement of Aboriginal workers in the APY Lands.

21
Department of Planning, Transport and Infrastructure Annual Report 2011-12
tARGet 22: RoAD sAFetYReduce road fatalities and serious injuries by at least 30 per cent by 2020 (baseline: 2008-10).
Progress towards target:
A default limit of 100km/h on 52 roads within 100km of Adelaide and on the Yorke Peninsula has been applied, there has also been a doubling of demerit points for low level speeding.
Road safety improvements included major upgrades of the Dukes Highway, with installation of a wide centre median, roadside barriers and improved passing opportunities. Work also began on the installation of a median wire rope barrier on Willunga Hill.
More than 2 500 alcohol interlocks were fitted to the vehicles of serious and repeat drink drivers, supporting the safety of all road users.
tARGet 30: BoARDs AnD CoMMItteesIncrease the number of women on all state government boards and committees to 50 per cent on average by 2014, and maintain thereafter by ensuring that 50 per cent of women are appointed, on average, each quarter (baseline: 2004).
tARGet 31: CHAIRs oF BoARDs AnD CoMMItteesIncrease the number of women chairing state government boards and committees to 50 per cent by 2014 (baseline: 2004).
Progress towards these targets:
At 30 June 2012, the department was responsible for 21 government boards and
committees. Of the 196 members, 29 per cent were women. Four of the 21 government boards and committees have a rotating chair, which consists of both male and female representation. Of the remaining 17 government boards and committees 23.5 per cent were chaired by women.
tARGet 32: CUstoMeR AnD CLIent sAtIsFACtIon WItH GoVeRnMent seRVICesIncrease the satisfaction of South Australians with government services by 10 per cent by 2014, maintaining or exceeding that level of satisfaction hereafter (baseline: 2008).
Progress towards target:
The Valuer-General is working to provide greater transparency to the community with access to valuation information through the Transparency Online project.
A more robust system for registering special purpose vehicles across the state has been introduced to ensure uniformity for all conditions.
tARGet 33: GoVeRnMent PLAnnInG DeCIsIonsSouth Australia leads the nation in timely decisions of development applications through to 2020 (baseline: 2009-10).
Progress towards target:
The National Report by the Council of Australian Governments on Development Assessment Performance compares performance measures across jurisdictions.
In its most recent report of 2009-10, South Australia leads the nation as the best performing state for the percentage of development assessments made within the statutory timeframe at 82 per cent.

22
Department of Planning, Transport and Infrastructure Annual Report 2011-12
OUR PROSPERITY
tARGet 50: PeoPLe WItH A DIsABILItYIncrease by 10 per cent the number of people with a disability employed in South Australia by 2020.
Progress towards target:
As at 30 June 2012, 1.4 per cent of employees identified themselves as having an ongoing disability as defined under the Disability Discrimination Act 1992, in comparison with the baseline of 1.9 per cent of employees at 30 June 2009.
tARGet 52: WoMenHave women comprising half of the public sector employees in the executive levels (including Chief Executives) by 2014 and maintain thereafter (baseline: 2003).
Key Measure:
Proportion of women executives in the public sector.
Progress towards target:
As at 30 June 2012, 22.7 per cent of department executives were women.
tARGet 53: ABoRIGInAL eMPLoYeesIncrease the participation of Aboriginal people in the South Australian public sector, spread across all classifications and agencies, to 2 per cent by 2014 and maintain or better those levels through to 2020 (baseline: 2003).
Key Measure:
Aboriginal or Torres Strait Islander employees as a percentage of all employees in the South Australian public sector.
Progress towards target:
As at 30 June 2012, 1.6 per cent of the department’s workforce were Aboriginal people.
tARGet 56: stRAteGIC InFRAstRUCtURe Ensure that the provision of key economic and social infrastructure accommodates population growth (baseline: 2010-11).
Progress towards target:
The department is delivering the following projects:
> South Road Superway – Construction continued on a 4.8 kilometre non-stop corridor, comprising of a 2.8 kilometre elevated roadway, from the Port River Expressway to Regency Road.
> Southern Expressway – Construction began of the 18.5km of new carriageway, turning the expressway into a two way connection between Bedford Park and Old Noarlunga.
> Northern Connector – The project’s impact report was published in July 2011.
> Adelaide Riverbank Precinct – A draft masterplan was released for the revitalisation of Adelaide’s Riverbank Precinct.
> Adelaide Oval – The Adelaide Oval Redevelopment and Management Bill 2011 passed through Parliament on 28 July 2012, and early construction works began on the $535m redevelopment of Adelaide Oval.
> Adelaide O-Bahn upgrade – $17.1m (2011-12 – 2012-13) is being invested to improve facilities at the O-Bahn interchanges to meet projected usage in 2021.
> The Parks Community Centre redevelopment – Planning has begun on a $28.7 million redevelopment of the Parks Community Centre to transform it into a sport and community hub for future generations.

23
Department of Planning, Transport and Infrastructure Annual Report 2011-12
> Glengowrie Tram Depot upgrade (stage 2) – to deliver a new operations facility, increased stabling capacity, car parking areas and associated site amenities to support the expanded tram fleet.
> Nation Building Economic Stimulus Plan – The timely delivery of projects funded under the Commonwealth Nation Building Economic Stimulus Plan provided improvements in transport safety, affordable and low-income housing opportunities, community-use facilities and contemporary built infrastructure in public and private schools across South Australia.
> Building management – The department is partnering with other government agencies to deliver an extensive program of social infrastructure projects. Highlight projects are the Adelaide Convention Centre Redevelopment, Flinders Medical Centre Redevelopment, South Australian Health and Medical Research Institute, Repatriation General Hospital Teaching Aged Care Facility, upgrading of Mount Gambier and Northfield Prisons, Tonsley Park Sustainable Industries Education Centre, and Family Wellbeing Centres at Pukatja, Amata and Mimili.
> Recreation and sport – over $7.5 million was invested in sport and active recreation facility grants to sports clubs, associations, councils and schools.
> Seaford Rail Extension – progress on the $316 million Seaford Rail Extension continued with the expected completion date 2012-13.
> Rail Revitalisation – The rail tracks between Mawson Lakes and Gawler were upgraded, station works on the Gawler line were completed, including two new stations at Elizabeth and Munno Para, and Bombardier commenced the construction of the new A–City electric railcars ordered by the State Government.
> Goodwood Junction – Approval to construct a rail underpass separating urban passenger trains and interstate freight trains was received and initial site investigations completed. The project is expected to to be complete in 2013.
OUR ENVIRONMENT
tARGet 61: eneRGY eFFICIenCY – GoVeRnMent BUILDInGsImprove the energy efficiency of government buildings by 30 per cent by 2020 (baseline: 2000-01) Milestone of 25 per cent by 2014.
Progress towards target:
New buildings were constructed following a broad range of environmental measures. In existing buildings lighting, air-conditioning and mechanical plant were upgraded to achieve improved energy performance.
tARGet 63: Use oF PUBLIC tRAnsPoRtIncrease the use of public transport to 10 per cent of metropolitan weekday passenger vehicle kilometres travelled by 2018 (baseline: 2002-03).
Progress towards target:
There has been a cumulative growth in passenger transport boardings since the introduction of the Adelaide Metro in 2000.
The estimated metropolitan public transport patronage in 2009-10 was 7.5 per cent of total weekday passenger vehicle kilometres, i.e. total public transport and car use (source ABS). This compares with a figure of 7.3 per cent in 2008-09.
It is noted that there is a significant amount of activity to improve public transport and the road networks, which has had a negative affect on patronage.

24
Department of Planning, Transport and Infrastructure Annual Report 2011-12
This included major rail line closures as part of the Rail Revitalisation works, as well as the closure of the Tonsley line and reduced services on the Grange line.
These works are crucial in providing an improved public transport system for South Australians and will support increased public transport patronage going forward.
tARGet 68: URBAn DeVeLoPMent By 2036, 70 per cent of all new housing in metropolitan Adelaide will be built in established areas (baseline: 2010).
Progress towards target:
The share of overall new housing in the established areas of Adelaide, as a proportion of the total built across the remainder of Greater Adelaide – including fringe areas and towns and rural locations – has tracked between 56 and 58 per cent in the period 2008-2010.
This reflects current levels of land supply available for new housing and may decline as new growth suburbs providing affordable housing come on line. This will be offset by efforts to rezone land in infill locations.
OUR HEALTH
tARGet 83: sPoRt AnD ReCReAtIonIncrease the proportion of South Australians participating in sport or physical recreation at least once per week to 50 per cent by 2020 (baseline: 2011-12).
Progress towards target:
Grants supported sport and recreation projects and organisations in 2011-12 with over $17 million allocated to achieving this target via the Statewide Enhancement Program, Active Club Program, Community Recreation and Sport Facilities Program, Inclusive Recreation, Inclusive Sport Program and the Move It! Making Community Active Program.
Other programs included Sports Bites (pilot), Indigenous Sports Program and STARCLUB initiative.
This funding supports planning and development of sustainable, inclusive, functional and fit for purpose active recreation and sport and facilities thoughout the state to meet the current and future needs of the South Australian community.

Department of Planning, Transport and Infrastructure Annual Report 2011-12
25

26
Department of Planning, Transport and Infrastructure Annual Report 2011-12

27
Department of Planning, Transport and Infrastructure Annual Report 2011-12
FUTURE DIRECTIONSThe department’s 2012-13 program of work will focus on strategic projects and activities to meet the targets set out in South Australia’s Strategic Plan and the South Australian Planning Strategy
DeLIVeR A MoDeRn, sAFe, ACCessIBLe AnD ReLIABLe PUBLIC tRAnsPoRt netWoRK.
> Continue preparations for the network-wide rollout of the Metrocard system, launch the new Adelaide Metro website and introduce a system giving passengers access to real time information about the running times of buses, trams and trains.
> Review the performance of the dedicated bus lanes in the CBD and develop similar lanes and measures to improve public transport on other corridors in the metropolitan arterial network.
> Enhance rail infrastructure and services, including trialling of a high-frequency (Go Zone) service, electrification of the Adelaide to Seaford line including deployment of the first electric trains, continuation of the re-sleepering program and construction of a new railway station for the St Clair transit-oriented development.
> Improve park and ride facilities at interchanges along the O-Bahn corridor, including expansion of parking capacity at the Klemzig interchange.
MAKe ADeLAIDe A MoRe VIBRAnt CItY WItH A ContInUeD FoCUs on CYCLInG AnD WALKInG.
> Progress the various projects in the Riverside Precinct, including the Adelaide Oval redevelopment and delivery of the southern stand for the 2013 Ashes Test; completion of stage one of the expanded Adelaide Convention Centre in time to host the 2014 World Aquaculture Conference; and construction of the new footbridge across the River Torrens.
> Trial pedestrian countdown timers, which show how many seconds are needed to make a safe crossing, at the intersection of North Terrace, Station Road and Bank Street, opposite the Adelaide Railway Station (in partnership with the Adelaide City Council).
> Roll out the next generation of safety and access improvements for cyclists, including: green bike lanes to improve cyclist visibility and reduce conflicts in high risk locations along arterial roads such as Greenhill Road, Fullarton Road and ANZAC Highway; bike boxes that allow cyclists to pull ahead of waiting vehicles at traffic signals; separated bike lanes on Port Road from West Terrace to South Road; and non-signalised median crossings along the Inner Ring Route.
> Continue development of Greenways and Cycle Paths projects, including a shared pedestrian-cyclist path in Noarlunga and a further seven-kilometre section of the Amy Gillet Bikeway between Charleston and Mount Torrens.

28
Department of Planning, Transport and Infrastructure Annual Report 2011-12
eFFeCtIVeLY MAIntAIn tHe tRAnsPoRt netWoRK AnD ensURe It Meets tHe neeDs oF ALL UseRs.
> Rehabilitate or reseal about 640 lane kilometres of road across the state.
> Start works on the Saltfleet Street Bridge at Port Noarlunga to strengthen it for higher loads, arrest deterioration and bring it up to current traffic safety standards, extending its life by about 30 years.
> Progress various infrastructure improvements, including construction of four intersection treatments on the Sturt Highway in Renmark and a new roundabout at the intersection of Main North Road and Redbanks Road, Willaston, Gawler.
> Contribute to the development of improved nation-wide approaches to the regulation of rail, commercial marine and heavy vehicles, and support the transition to single national regulators.
> Lead implementation of the state’s Low Emission Vehicle Strategy by focusing on ways to: promote fuel efficient vehicles and maintenance; progress renewable and low emission fuels; undertake research, development and commercialisation; and support and connect the community.
PRoVIDe tHe InFRAstRUCtURe to HeLP ReGIonAL soUtH AUstRALIA ReACH Its soCIAL AnD eConoMIC PotentIAL.
> Continue to upgrade regional infrastructure, specifically: complete sealing of 528 kilometres of shoulders on the Stuart Highway between Port Augusta and Pimba and from Pimba to Roxby Downs; and complete the refurbishment of the Port Bonython Jetty.
ContInUe ConstRUCtIon AnD PLAnnInG oF A 78 KILoMetRe non-stoP stRAteGIC tRAnsPoRt CoRRIDoR FRoM GAWLeR to oLD noARLUnGA.
> Advance construction of the South Road Superway and duplication of the Southern Expressway toward completion in 2013-14.
> Continue planning for the upgrade of South Road, with a focus on the section from Regency Road to Anzac Highway.

29
Department of Planning, Transport and Infrastructure Annual Report 2011-12
WoRK WItH sA PoLICe to DeLIVeR sAFeR RoADs WItH ConsIstent sPeeD LIMIts, AnD CHAnGe RIsKY BeHAVIoURs tHRoUGH BetteR InFoRMAtIon AnD enFoRCeMent.
> Continue to focus on reducing deaths and serious injuries on the state’s roads by taking actions under the Road Safety Action Plan to make roads and vehicles safer, effectively engage people in a stronger culture of road safety, and address the over-representation of Aboriginal people in road crash statistics.
> Prioritise state-wide roadworks that will make roads more forgiving and reduce the risk of crashes at black spot locations, including: the on-going Dukes Highway safety upgrade and two new overtaking lanes on the Princes Highway between Mount Gambier and Millicent; completion of the overpass at Victor Harbor Road and Main Road, McLaren Vale; and road widening and installation of a 2.5 km central wire rope to separate opposing traffic streams on the Willunga Hill section of the Victor Harbor Road.
> Use technological solutions to improve enforcement of safety regulations, such as a pilot program for on-road vehicle inspection, potential enhancements to the Safe-T-Cam system to improve capture of night time travel, and a review of the Intelligent Access Program to monitor road use by heavy vehicles.
PRoVIDe stRAteGIC LAnD Use AnD tRAnsPoRt PLAnnInG AnD DeVeLoPMent FUnCtIons sUPPoRtInG GoVeRnMent PoLICY AnD stRAteGIC oBJeCtIVes.
> Update the Housing and Employment Land Supply Program to reflect current demand for housing and consumption rates and to support a 15-year supply of zoned residential land in the state.
> Progress structure planning and policy development, particularly for the southern transit corridor, Roseworthy and Playford Projects, to advance the Metropolitan Adelaide Infill Housing Program.
> Finalise the requirements and guidelines for mitigating the impacts of external noise and air quality in new residential buildings in high-density urban areas and along major transport corridors.
> Release The Streets for People Compendium to guide the design of innovative pedestrian and cycling friendly streets in line with national standards and regulations.
> Continue reporting on the implementation of the South Australian Planning Strategy.
> Continue reporting on activity levels for residential land development and subdivision in the state.

30
Department of Planning, Transport and Infrastructure Annual Report 2011-12
sUPPoRt sPoRt AnD ReCReAtIon tHRoUGH tHe DeVeLoPMent oF PoLICY, PRoGRAMs AnD ResoURCes AnD tHe PRoMotIon oF PHYsICAL ACtIVItY.
> Expand the Respect for Officials ‘Fair Enough’ campaign aimed at encouraging more supportive player and spectator behaviour towards umpires and other officials by inviting the participation of several major sports in addition to the South Australian Cricket Association.
> Start development of Port Augusta’s new community sports hub, which will feature a playing field and indoor stadium, with a view to completion by March 2014.
> Launch the redevelopment of the Parks Community Centre into multi-use community hub with sporting and recreation facilities, as well as theatres, health services and a children’s centre.
> Work with other jurisdictions in seeking Federal Government support for legislation to protect Australian racing from unauthorised offshore wagering operators.
> Work with other jurisdictions to establish a national racing integrity advisory group.
> Prepare a business case to support the relocation of the South Australian Sports Institute’s training and sport science facilities to a new Centre for Sporting Excellence.
PRoVIDe eFFICIent AnD eFFeCtIVe CoRPoRAte AnD ACRoss-GoVeRnMent seRVICes.
> Revise and update the Adelaide CBD office accommodation strategic plan to optimise use of the Government’s office buildings, and office accommodation requirements.
> Complete the extension of the centralised across-government facilities management arrangements to all SA Health and SAFECOM sites.
> Continue the review of property held for transport purposes in regional centres to facilitate redevelopment and to reduce management costs.
> Develop a revised strategic plan and financial structure for the ongoing provision of housing services for government employees delivering services in regional South Australia.
> Finalise a business case on alternative models for the management of government office accommodation and establish a stronger mandate to support application of established office accommodation standards.

31
Department of Planning, Transport and Infrastructure Annual Report 2011-12
FREEDOm OF INFORmATION ACT 1991 In accordance with section 9 of the Freedom of Information Act 1991, the following represents the Department of Planning, Transport and Infrastructure’s information statement as at 30 June 2011.
Information statement
This statement is published in accordance with subsection 9 (2) of the Freedom of Information Act 1991 (FOI Act) . Subject to certain restrictions, the FOI Act gives members of the public a legally enforceable right to access information held by the South Australian Government. A comprehensive introduction to freedom of information can be found on the State Records website at http://www.archives.sa.gov.au/foi/index.html
Departmental functions and members of the public
The functions of the department affect the public both directly, in the form of service delivery to the community, and indirectly, through the department’s policy and strategic management improvement activities. Such activities result in the department having an input into the wide range of government programs and initiatives. The public has the opportunity to participate in the department’s policy development in a number of ways, including community consultation forums, panels, surveys and membership of government boards and committees.
Documents held by the department
Documents held by the Department of Planning, Transport and Infrastructure fall broadly into the categories described below. While most are available in hard copy, it should be noted that some are only available electronically. The listing of these categories does not necessarily mean all documents are accessible in full or in part under the Act. The categories include:
> corporate files containing correspondence, memoranda and minutes on all aspects of the department’s operations
> policies, procedures and guidelines prescribing the way various activities and programs are to be performed
> personnel files relating to the department’s employees
> accounting and financial reports relating to the running of the department
> departmental annual reports, strategic plans and policy reports
> minutes of meetings and terms of reference
> documents relating to the functions of the department’s divisions.
Making an application
In accordance with the Act, applications for access to documents held by an agency must:
> be made in writing (you may chose to write a letter or use the application form http://www.archives.sa.gov.au/files/forms_foi_request_for_access.pdf
> specify that the application is made under the FOI Act
> be accompanied by the application fee (exemptions apply for Members of Parliament and pensioners or health card holders)
> specify an address in Australia to which information can be sent
> clearly identify the documents being sought or the matter to which they pertain
> specify whether the documents contain information of a personal nature
> specify the desired type of access to the document, such as inspection of the document at an arranged location or having a copy made.
Applications under the Act should be forwarded to:
The Accredited FOI Officer Department of Planning, Transport and Infrastructure GPO Box 1533 SOUTH AUSTRALIA SA 5001
The Senior Policy Officer, FOI can be telephoned on (08) 8204 8208.
Freedom of Information applications
The Freedom of Information Act gives members of the public a legally enforceable right of access (subject to certain restrictions) to documents within the possession of South Australian government agencies, local government authorities and South Australian Universities. The purpose of the Freedom of Information Act is to make the business of government open and accountable to the public. The department fully supports the objectives and spirit of the Act and is active in its endeavours to continually improve records management practices.

32
Department of Planning, Transport and Infrastructure Annual Report 2011-12

33
Department of Planning, Transport and Infrastructure Annual Report 2011-12
APPenDICesMACHINERY OF GOVERNMENTOn 21 October 2011 changes to government departments were proclaimed.
The transition to the new ministerial and department responsibilities occurred on 1 January 2012 with Energy Division, Office of the Chief Information Officer and Service SA leaving the department’s portfolio. At the same time, planning functions from the former Department of Planning and Local Government and the Office for Recreation and Sport and the Office for Racing were integrated into the department.
LEGISLATIONAs at 30 June 2012 the department was responsible for administering the following legislation:
Minister for transport and Infrastructure
> Adelaide Oval Redevelopment and Management Act 2011
> Adelaide Railway Station Development Act 1984
> Aerodrome Fees Act 1998
> Air Navigation Act 1937
> Air Transport (Route Licensing – Passenger Services) Act 2002
> AustralAsia Railway (Third Party Access) Act 1999
> Civil Aviation (Carriers’ Liability) Act 1962
> Commissioner of Public Works Incorporation Act 1917
> General Tramways Act 1884
> Geographical Names Act 1991
> Golden Grove (Indenture Ratification) Act 1984
> Goods Securities Act 1986
> Harbors and Navigation Act 1993
> Highways Act 1926
> Maritime Services (Access) Act 2000
> Metropolitan Adelaide Road Widening Plan Act 1972
> Mile End Underpass Act 2005
> Mobil Lubricating Oil Refinery (Indenture) Act 1976
> **Morphett Street Bridge Act 1964
> Motor Vehicles Act 1959
> National Soldiers Memorial Act 1949
> Non-Metropolitan Railways (Transfer) Act 1997

34
Department of Planning, Transport and Infrastructure Annual Report 2011-12
Appendices
> North Haven Development Act 1972
> North Haven (Miscellaneous Provisions) Act 1986
> Oil Refinery (Hundred of Noarlunga) Indenture Act 1958
> Proof of Sunrise and Sunset Act 1923
> Protection of Marine Waters (Prevention of Pollution from Ships) Act 1987
> Public Employees Housing Act 1987
> Rail Commissioner Act 2009
> Rail Safety Act 2007
> Rail Safety National Law (South Australia) Act 2012
> Rail Transport Facilitation Fund Act 2001
> Railways (Operations and Access) Act 1997
> Railways (Transfer Agreement) Act 1975
> Roads (Opening and Closing) Act 1991
> Road Traffic Act 1961
> South Australian Ports (Bulk Handling Facilities) Act 1996
> South Australian Ports (Disposal of Maritime Assets) Act 2000
> **Steamtown Peterborough (Vesting in Property) Act 1986
> Survey Act 1992
> **Tarcoola to Alice Springs Railway Agreement Act 1974
> Terrorism (Surface Transport Security) Act 2011
> Valuation of Land Act 1971
> Victoria Square Act 2005
> West Lakes Development Act 1969** Denotes Act of limited application
Minister for Planning
> Development Act 1993
> Linear Parks Act 2006
> West Beach Recreation Reserve Act 1987
Minister for transport services
> Passenger Transport Act 1994

35
Department of Planning, Transport and Infrastructure Annual Report 2011-12
Appendices
Minister for Housing and Urban Development
> Architectural Practice Act 2009
> Housing and Urban Development (Administrative Arrangements) Act 1995
Minister for Recreation and sport
> Boxing and Martial Arts Act 2000
> Racing (Proprietary Business Licensing) Act 2000
> Recreational Greenways Act 2000
> Recreation Grounds (Joint Schemes) Act 1947
> Recreation Grounds Rates and Taxes Exemption Act 1981
> Sports Drug Testing Act 2000
Attorney-General – Administered by the department
> Bills of Sale Act 1886
> Community Titles Act 1996
> Liens on Fruit Act 1923
> Real Property Act 1886
> Real Property (Registration of Titles) Act 1945
> Registration of Deeds Act 1935
> Stock Mortgages and Wool Liens Act 1924
> Strata Titles Act 1988
> Worker’s Liens Act 1893
Minister for Road safety
Nil

36
Department of Planning, Transport and Infrastructure Annual Report 2011-12
Appendices
BOARDS AND COMMITTEESAs at 30 June 2012 the department provided administrative support to the following boards and committees:
Minister for Planning
> Building Advisory Committee
> Building Fire Safety Committee
> Building Rules Assessment Commission
> Development Assessment Commission
> Development Policy Advisory Committee
> Local Heritage Advisory Committee
> Public Space Advisory Committee
Minister for transport and Infrastructure
> Accident Towing Roster Review Committee
> Boating Facility Advisory Committee
> Government Office Accommodation Committee
> Motor Vehicles Act 1959 Review Committee
> Port Adelaide Container Terminal Monitoring Panel
> Public Employees Housing Advisory Committee
> State Crewing Committee
> Survey Advisory Committee
Minister for Housing and Urban Development
> Port Adelaide Renewal Steering Committee
Minister for Road safety
> State Level Crossing Strategy Advisory Committee
Minister for Recreation and sport
> Boxing and Martial Arts Advisory Committee
Minister for transport services
> Passenger Transport Standards Committee
> Premier’s Taxi Council

37
Department of Planning, Transport and Infrastructure Annual Report 2011-12
Appendices
FRAUDThere were 88 instances of fraud confirmed during the year. Eighty-three instances involved fraudulent South Australian Transport Subsidy Scheme (SATSS) claims by taxi drivers whereby costs of journey were inflated, two instances involved fraudulent use of cabcharge vouchers by taxi drivers and three related to procurement of toner cartridges.
The increase in the instances of fraud involving SATSS can be attributed to the continued focus on identifying misuse through data interrogation, matching drivers to vouchers and GPS records as a result of increased compliance measures and the review of controls and processes.
Strategies to control and prevent future occurrences have included the increase of awareness of penalties and outcomes communicated through the Taxi Council of SA and through SAPOL media releases.
The department’s fraud control framework strategies for fraud prevention, detection, investigation, awareness, training, and reporting are based on the Australian Standard 8001–Fraud and Corruption providing a rigorous internal control environment. Fraud control is embedded through this framework into the department’s governance and decision making processes.
WHISTLEBLOWERS ACT The Department of Planning, Transport and Infrastructure has appointed a responsible officer for the purposes of the Whistleblowers Protection Act 1993 (WPA) pursuant to Section 7 of the Public Sector Act 2009.
There has been one instance of disclosure of public interest information to the responsible officer of the department under the WPA. The declaration has been investigated and resolved. One previous disclosure that was ongoing has also been resolved.

38
Department of Planning, Transport and Infrastructure Annual Report 2011-12
Appendices
MANAGEMENT OF HUMAN RESOURCESHuman resource management within the department during 2011-12 built on the foundations of continuous improvement established over previous years. The department continued to develop the skills and wellbeing of employees through the ongoing review and improvement of human resource strategies and programs.
Within the framework provided by its principle based human resource management policy and comprehensive intranet based operating procedures, Managing Our People, strategies, programs and initiatives continued to develop to meet the needs of the department and support changes from machinery of government.
A summary of the department’s workforce and information on specific strategies is provided.
eMPLoYee nUMBeRs, GenDeR AnD stAtUs
total number of employees at 30 June 2012
Persons 3 594
FTEs 3 464.1
Gender % Persons % Ftes
Male 68.6 70.2
Female 31.4 29.8
number of persons during 2011-2012
Separated from the agency 409
Recruited to the agency 449
number of persons at 30 June 2012
On leave without pay 67
nUMBeR oF eMPLoYees BY sALARY BRACKet
salary bracket Male Female total
$0 - $51 599 523 258 781
$51 600 - $65 699 773 401 1 174
$65 700 - $84 099 761 319 1 080
$84 100 - $106 199 344 130 474
$106 200 + 66 19 85
Total 2 467 1 127 3 594
Note: Salary details relate to pre-tax income excluding superannuation and FBT. Non-executive employees on salary sacrifice arrangements are shown as pre-sacrifice values. Executive employees are shown according to the value of the financial benefits component of their Total Remuneration Package Value excluding superannuation. Non-financial benefits and allowances are excluded for all employees.

39
Department of Planning, Transport and Infrastructure Annual Report 2011-12
Appendices
All of the following tables refer only to employees who were ‘active’ or on leave with pay as at the end of the last pay period in the 2011-12 financial year. The tables include executive level employees.
stAtUs oF eMPLoYees In CURRent PosItIon As At 30 JUne 2012
Ftes ongoing short-term contract
Long-term contract
other (Casual) total
Male 2 104.6 104.4 211.2 12.6 2 432.8
Female 863.3 97.9 57.8 12.3 1 031.3
Total 2 967.9 202.3 269.0 24.9 3 464.1
Persons ongoing short-term contract
Long-term contract
other (Casual) total
Male 2 113 106 213 35 2 467
Female 939 100 60 28 1 127
Total 3 052 206 273 63 3 594
exeCUtIVes BY GenDeR, CLAssIFICAtIon AnD stAtUs
ongoing tenured contract Untenured contract other (Casual) total
Classification Male Female Male Female Male Female Male Female Male Female
EXEC 0 0 0 0 1 0 0 0 1 0
SAES 0 0 0 0 56 17 0 0 56 17
total 0 0 0 0 57 17 0 0 57 17
AVeRAGe LeAVe In DAYs PeR FULL-tIMe eqUIVALent eMPLoYee
Leave type 2008-09 2009-10 2010-11 2011-12
Sick leave 7.7 7.2 8.6 8.0
Family Carer’s leave 0.8 0.9 1.1 1.0
Miscellaneous Special leave
0.6 0.8 0.6 0.6

40
Department of Planning, Transport and Infrastructure Annual Report 2011-12
Appendices
nUMBeR oF ABoRIGInAL AnD/oR toRRes stRAIt IsLAnDeR eMPLoYees BY sALARY BRACKet
salary bracket Aboriginal staff total staff % Aboriginal % Target
$0 - $51 599 36 781 4.6 2.0
$51 600 - $65 699 11 1 174 0.9 2.0
$65 700 - $84 099 8 1 080 0.7 2.0
$84 100 - $106 199 1 474 0.2 2.0
$106 200 + 0 85 0.0 2.0
total 56 3 594 1.6 2.0
Note: An Aboriginal and/or Torres Strait Islander is someone who: > is of Australian Aboriginal and/or Torres Strait Islander descent > identifies as an Aboriginal and/or Torres Strait Islander > is accepted as such by the community in which they live or have lived.
nUMBeR oF eMPLoYees BY AGe BRACKet AnD GenDeR
Age bracket Male Female total % of total sA 2012 Workforce
Average1 %
15-19 9 10 19 0.5 5.6
20-24 77 80 157 4.4 9.9
25-29 163 130 293 8.2 10.6
30-34 204 158 362 10.1 10.4
35-39 229 155 384 10.7 10.7
40-44 274 146 420 11.7 11.7
45-49 356 133 489 13.6 11.4
50-54 403 145 548 15.3 11.0
55-59 430 110 540 15.0 9.2
60-64 235 49 284 7.9 5.6
65+ 87 11 98 2.7 4.0
total 2467 1127 3594
1 Source: Australian Bureau of Statistics Australian Demographic Statistics, Catalogue No. 6291.0.55.001, June 2012.
Note: Percentages may not add up to exactly 100 per cent due to rounding.

41
Department of Planning, Transport and Infrastructure Annual Report 2011-12
Appendices
CULtURAL AnD LInGUIstIC DIVeRsItY
Male Female total % of agency % sA Community2
Number of employees born overseas
378 153 531 14.8 20.3
Number of employees who speak language(s) other than English at home
187 96 283 7.9 16.6
2 Source: Publication Basic Community Profile (SA) Cat No. 2001.0, 2006 census.
NOTE: Employees self identify and therefore not all employees with cultural or linguistic diversity may be reflected.
totAL nUMBeR oF eMPLoYees WItH DIsABILItIes (ACCoRDInG to CoMMonWeALtH DDA DeFInItIon
Male Female total % of agency
35 14 49 1.4
NOTE: Employees self identify and therefore not all employees with a disability may be reflected.
tYPes oF DIsABILItY (WHeRe sPeCIFIeD)
Disability Male Female total % of agency
Disability requiring workplace adaptation
35 14 49 1.4
Physical 16 8 24 0.7
Intellectual 4 2 6 0.2
Sensory 6 5 11 0.3
Psychological/ Psychiatric
4 1 5 0.1
NOTE: An employee may report more than one type of disability.

42
Department of Planning, Transport and Infrastructure Annual Report 2011-12
Appendices
VoLUntARY FLexIBLe WoRKInG ARRAnGeMents BY GenDeR
Male Female total
Purchased leave 10 21 31
Flexi time 1 591 970 2 561
Compressed weeks 70 6 76
Part-time 76 270 346
Job share 0 12 12
Working from home 34 42 76
Note: An employee may be utilising more than one flexible working arrangement at the same time.
PeRFoRMAnCe MAnAGeMent
employees with a documented review of performance % total workforce
Within the 12 months to 30 June 2012 72.1
Older than 12 months 17.6
No review 10.3
LeADeRsHIP AnD MAnAGeMent DeVeLoPMent exPenDItURe In 2011-12
training and development total expenditure $ % of total salary expenditure
Total training and development 4 471 828 1.5%
Total leadership and management development
1 868 221 0.6%

43
Department of Planning, Transport and Infrastructure Annual Report 2011-12
Appendices
ACCReDIteD tRAInInG PACKAGes BY CLAssIFICAtIon
The following table refers to employees enrolled in an accredited training package or who have attained a qualification or statement of attainment during 2011-12 and who were ‘active’ or on leave with pay with the agency as at the end of last pay period in 2011-12.
Classification number achieving a qualification linked to an accredited training package
ASO1 2
ASO2 5
ASO3 60
ASO4 66
ASO5 54
ASO6 33
ASO7 42
ASO8 35
CMW1 9
CMW2 6
CMW3 2
CMW4 1
CMW5 8
CMW6 1
CMW7 3
INF2 1
MAS3 26
OPS3 5
OPS4 4
OPS6 6
PO1 8
PO2 12
PO3 13
PO4 3
PO5 21
SAES 3
STO1 1
STT1 3
TGO1 1
TGO3 4
TGO4 2
TOMS 45
TRA11 1
TRA12 5
Trainee 9
TSO3 1

44
Department of Planning, Transport and Infrastructure Annual Report 2011-12
Appendices
eqUAL eMPLoYMent oPPoRtUnItY PRoGRAMs
The department employed people through the following public sector wide equal employment opportunity programs during 2011-12:
> SA Government Youth Training Scheme and the Trainee Employment Register.
> SA Public Sector Aboriginal Recruitment and Development Strategy and the Aboriginal Employment Register.
> Strategy for Employment of People with Disabilities (which includes the Disability Employment Register).
In addition, the department continued to offer Sylvia Birdseye scholarships to women undertaking civil engineering studies at university.
oCCUPAtIonAL HeALtH, sAFetY AnD InJURY MAnAGeMent
A core value of the department is the priority it places on the safety and welfare of employees. It extends that priority to a commitment to the safety of all contractors, visitors and members of the public.
Regular consultation and communication on matters of Occupational, Health Safety and Welfare (OHS&W) is a key feature of the department’s OHS&W system. Quarterly meetings of the whole-of-department OHS&W Consultation and Communication Committee are held, and consultation continues through the department’s Consultative Forum. The department intranet provides a source of information about OHS&W and access to reporting tools for hazards and incidents through the whole-of-government system. Regular OHS&W news updates are disseminated throughout the department at least monthly.
During 2011-12, an employee climate survey was undertaken. Employees indicated a high degree of satisfaction with the health and safety systems throughout the department, and their ability to influence safety outcomes.
The department continues to engage executives through the quarterly provision of information of OHS&W performance. Each division is provided with an update of their OHS&W performance and particular areas of concern or interest are highlighted.
Following on from the WorkCover evaluation against the Performance Standards for Self Insurers in 2010-2011, the department has continued to focus on improving hazard identification and risk management. A number of training sessions have been held, additional information provided on the intranet, and internal audits carried out against compliance with the policies relating to hazard identification and accident and incident investigation.
During 2011-2012, the department commenced a review of its OHS&W systems, taking into account injury management components, reviews of performance, organisational change, legislative change and proposed implementation of the Work Health and Safety Act 2011. This review continues with extensive consultation across the department.

45
Department of Planning, Transport and Infrastructure Annual Report 2011-12
Appendices
Health and wellbeing continues to be a focus area within the department with a range of wellbeing activities undertaken by employees, including Corporate Cup, Quit smoking, Life Be In It games, health assessments and influenza vaccinations. The department offers an employee assistance program for employees. A number of informal lunch and learn sessions along with other information sessions designed to assist employees to manage stress in their lives, and manage and adapt to change were held.
A series of manager focused training sessions on injury management and the manager/supervisor’s role in supporting return to work of injured workers has seen an improved focus on employee return to work.
During 2011-2012, the department underwent significant organisational change as a result of Machinery of Government changes. Three divisions transferred to other agencies, and two divisions joined the department. In addition, the former TransAdelaide (Rail Commissioner) was under the responsibility of the department for the full 12 month period, although it did not transfer to the department’s injury management system provider until February 2012.
The following tables reflect performance of the entity for those divisions which are part of the department as at 30 June 2012. It is not possible to make comparisons with data published in previous year’s annual reports.
oHs notICes AnD CoRReCtIVe ACtIon tAKen
Number of notifiable occurrences pursuant to OHS&W Regulations Part 7 Division 6
15
Number of notifiable injuries pursuant to OHS&W Regulations Part 7 Division 6
5
Number of notices served pursuant to OHS&W Act s35, s39 and s40 (default, improvement and prohibition notices)
18
Of the notifiable occurrences and injuries, 12 occurrences and 5 injuries were related to the rail works in the Public Transport Services Division. This increase from the previous year was primarily linked to the increase in construction activity related around Rail Revitalisation works.
All notices issued as a result of incidents were effectively closed out through remedial actions and, as a result of the incident investigation process; further actions were taken to improve performance. Four Default Notices and two Improvement Notices in Public Transport Services Division related to an industrial issue, and were dismissed after the matter was taken to the Industrial Commission.

46
Department of Planning, Transport and Infrastructure Annual Report 2011-12
Appendices
AGenCY GRoss* WoRKeRs CoMPensAtIon exPenDItURe FoR 2011-12 CoMPAReD WItH 2010-11
exPenDItURe 2011-12 ($m) 2010-11 ($m) Variation ($m) + (-) % Change
Income maintenance $0.69 $0.55 $0.14 25.45%
Lump sum settlements
redemptions - Sect.42 $0.11 $0.45 -$0.34 -75.56%
Lump sum settlements
permanent disability – Sect. 43
$0.07 $0.35 -$0.28 -80.00%
Medical / hospital costs combined
$0.78 $0.61 $0.17 27.87%
Other $0.23 $0.25 -$0.02 -8.00%
total claims expenditure
$1.88 $2.21 -$0.33 -14.93%
* before third party recovery
Overall, claims expenditure has decreased in 2011-12 compared to the previous year, for the combined entity (including where claims were previously managed by the Rail Commissioner). This is mostly due to a decrease in the lump sum settlements. Medical costs and income maintenance costs have both increased by around 25 per cent.
MeetInG sAFetY PeRFoRMAnCe tARGets
During 2011-2012, the performance targets against the Safety and Wellbeing in the Public Sector 2010-2015 Strategy were reported and monitored separately for the Rail Commissioner and the rest of the department. The following data is based on the entities which are part of the department as at 30 June 2012.
47
Department of Planning, Transport and Infrastructure Annual Report 2011-12
Appendices
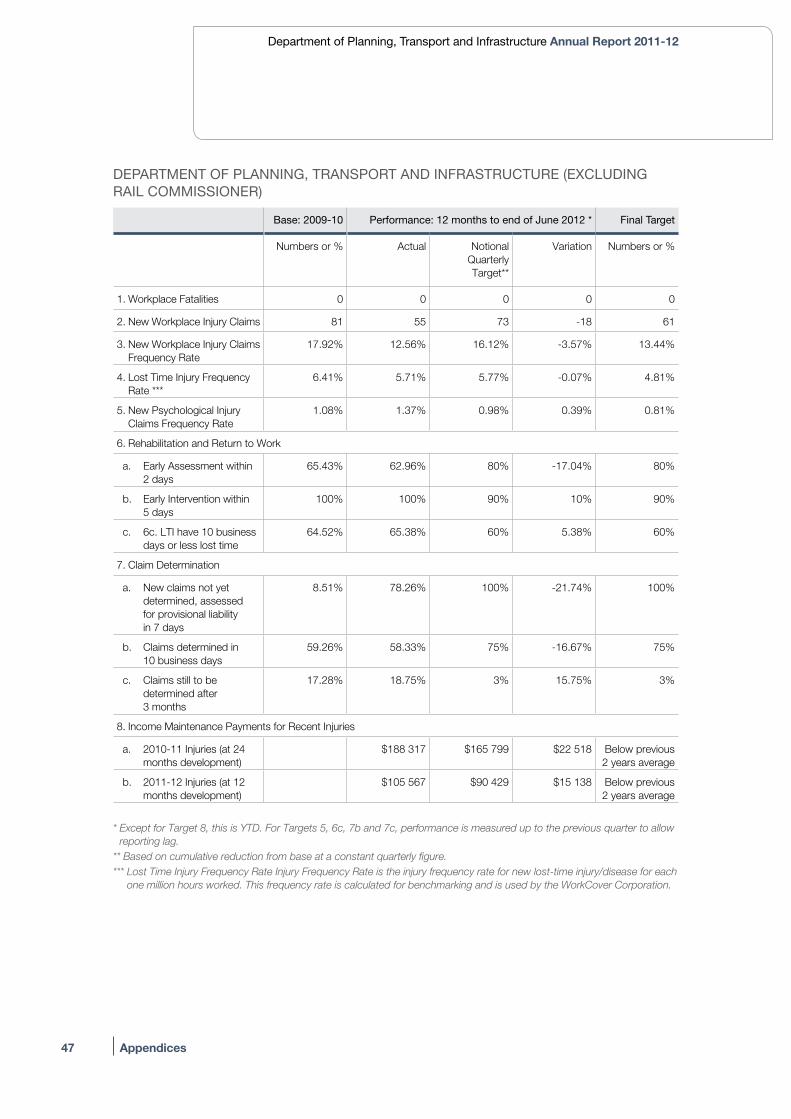
DePARtMent oF PLAnnInG, tRAnsPoRt AnD InFRAstRUCtURe (exCLUDInG RAIL CoMMIssIoneR)
Base: 2009-10 Performance: 12 months to end of June 2012 * Final target
Numbers or % Actual Notional Quarterly Target**
Variation Numbers or %
1. Workplace Fatalities 0 0 0 0 0
2. New Workplace Injury Claims 81 55 73 -18 61
3. New Workplace Injury Claims Frequency Rate
17.92% 12.56% 16.12% -3.57% 13.44%
4. Lost Time Injury Frequency Rate ***
6.41% 5.71% 5.77% -0.07% 4.81%
5. New Psychological Injury Claims Frequency Rate
1.08% 1.37% 0.98% 0.39% 0.81%
6. Rehabilitation and Return to Work
a. Early Assessment within 2 days
65.43% 62.96% 80% -17.04% 80%
b. Early Intervention within 5 days
100% 100% 90% 10% 90%
c. 6c. LTI have 10 business days or less lost time
64.52% 65.38% 60% 5.38% 60%
7. Claim Determination
a. New claims not yet determined, assessed for provisional liability in 7 days
8.51% 78.26% 100% -21.74% 100%
b. Claims determined in 10 business days
59.26% 58.33% 75% -16.67% 75%
c. Claims still to be determined after 3 months
17.28% 18.75% 3% 15.75% 3%
8. Income Maintenance Payments for Recent Injuries
a. 2010-11 Injuries (at 24 months development)
$188 317 $165 799 $22 518 Below previous 2 years average
b. 2011-12 Injuries (at 12 months development)
$105 567 $90 429 $15 138 Below previous 2 years average
* Except for Target 8, this is YTD. For Targets 5, 6c, 7b and 7c, performance is measured up to the previous quarter to allow
reporting lag.** Based on cumulative reduction from base at a constant quarterly figure.*** Lost Time Injury Frequency Rate Injury Frequency Rate is the injury frequency rate for new lost-time injury/disease for each
one million hours worked. This frequency rate is calculated for benchmarking and is used by the WorkCover Corporation.

48
Department of Planning, Transport and Infrastructure Annual Report 2011-12
Appendices
RAIL CoMMIssIoneR
Base: 2009-10 Performance: 12 months to end of June 2012 * Final target
Numbers or % Actual Notional Quarterly Target**
Variation Numbers or %
1. Workplace Fatalities 0 0 0 0 0
2. New Workplace Injury Claims 84 86 76 10 63
3. New Workplace Injury Claims Frequency Rate
76.07% 70.72% 68.47% 2.25% 57.06%
4. Lost Time Injury Frequency Rate ***
37.13% 23.85% 33.42% -9.57% 27.85%
5. New Psychological Injury Claims Frequency Rate
21.74% 13.95% 19.56% -5.62% 16.30%
6. Rehabilitation and Return to Work
a. Early Assessment within 2 days
55.95% 31.40% 80.00% -48.60% 80%
b. Early Intervention within 5 days
83.87% 100.00% 90.00% 10.00% 90%
c. LTI have 10 business days or less lost time
70.73% 68.75% 60.00% 8.75% 60%
7. Claim Determination
a. New claims not yet determined , assessed for provisional liability in 7 days
0% 40.43% 100.00% -59.57% 100%
b. Claims determined in 10 business days
90.59% 60.98% 75.00% -14.02% 75%
c. Claims still to be determined after 3 months
4.71% 20.73% 3.00% 17.73% 3%
8. Income Maintenance Payments for Recent Injuries
a. 2010-11 Injuries (at 24 months development)
$194 735 $113 672 $81 063 Below previous 2 years average
b. 2011-12 Injuries (at 12 months development)
$86 685 $88 478 -$1 793 Below previous 2 years average
* Except for Target 8, this is YTD. For Targets 5, 6c, 7b and 7c, performance is measured up to the previous quarter to allow
reporting lag.** Based on cumulative reduction from base at a constant quarterly figure.*** Lost Time Injury Frequency Rate Injury Frequency Rate is the injury frequency rate for new lost-time injury/disease for each
one million hours worked. This frequency rate is calculated for benchmarking and is used by the WorkCover Corporation.
49
Department of Planning, Transport and Infrastructure Annual Report 2011-12
Appendices
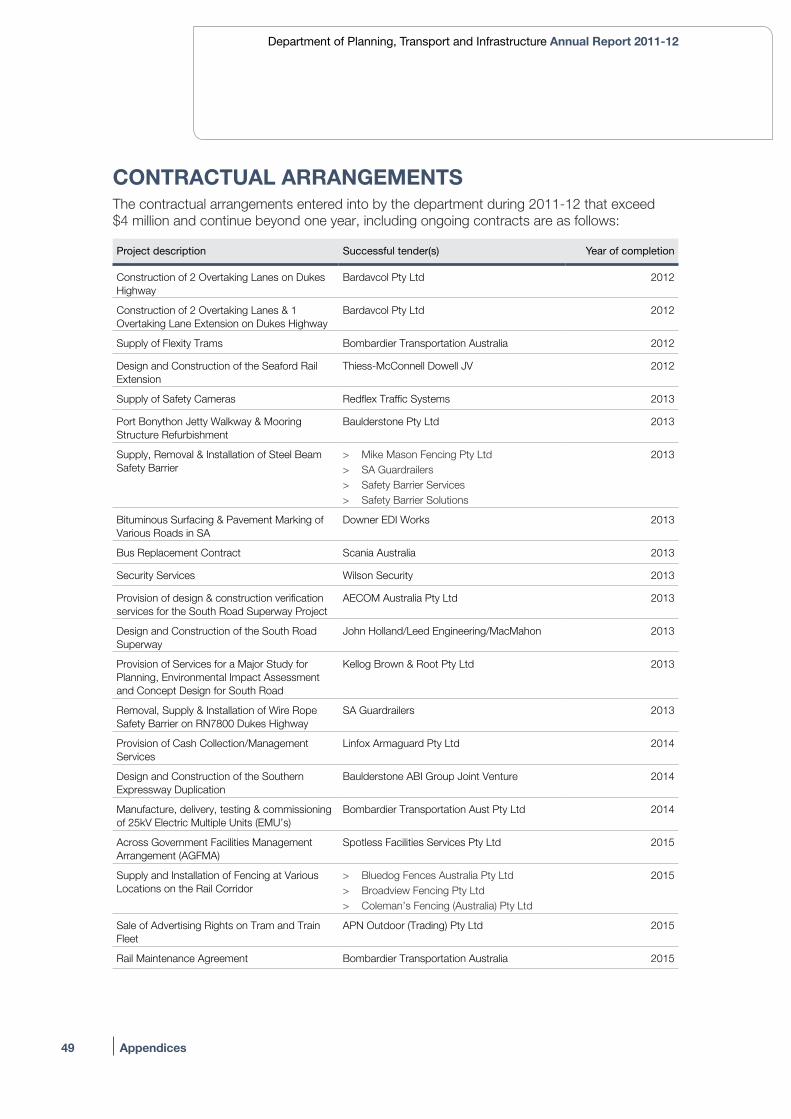
CONTRACTUAL ARRANGEMENTSThe contractual arrangements entered into by the department during 2011-12 that exceed $4 million and continue beyond one year, including ongoing contracts are as follows:
Project description successful tender(s) Year of completion
Construction of 2 Overtaking Lanes on Dukes Highway
Bardavcol Pty Ltd 2012
Construction of 2 Overtaking Lanes & 1 Overtaking Lane Extension on Dukes Highway
Bardavcol Pty Ltd 2012
Supply of Flexity Trams Bombardier Transportation Australia 2012
Design and Construction of the Seaford Rail Extension
Thiess-McConnell Dowell JV 2012
Supply of Safety Cameras Redflex Traffic Systems 2013
Port Bonython Jetty Walkway & Mooring Structure Refurbishment
Baulderstone Pty Ltd 2013
Supply, Removal & Installation of Steel Beam Safety Barrier
> Mike Mason Fencing Pty Ltd > SA Guardrailers > Safety Barrier Services > Safety Barrier Solutions
2013
Bituminous Surfacing & Pavement Marking of Various Roads in SA
Downer EDI Works 2013
Bus Replacement Contract Scania Australia 2013
Security Services Wilson Security 2013
Provision of design & construction verification services for the South Road Superway Project
AECOM Australia Pty Ltd 2013
Design and Construction of the South Road Superway
John Holland/Leed Engineering/MacMahon 2013
Provision of Services for a Major Study for Planning, Environmental Impact Assessment and Concept Design for South Road
Kellog Brown & Root Pty Ltd 2013
Removal, Supply & Installation of Wire Rope Safety Barrier on RN7800 Dukes Highway
SA Guardrailers 2013
Provision of Cash Collection/Management Services
Linfox Armaguard Pty Ltd 2014
Design and Construction of the Southern Expressway Duplication
Baulderstone ABI Group Joint Venture 2014
Manufacture, delivery, testing & commissioning of 25kV Electric Multiple Units (EMU’s)
Bombardier Transportation Aust Pty Ltd 2014
Across Government Facilities Management Arrangement (AGFMA)
Spotless Facilities Services Pty Ltd 2015
Supply and Installation of Fencing at Various Locations on the Rail Corridor
> Bluedog Fences Australia Pty Ltd > Broadview Fencing Pty Ltd > Coleman’s Fencing (Australia) Pty Ltd
2015
Sale of Advertising Rights on Tram and Train Fleet
APN Outdoor (Trading) Pty Ltd 2015
Rail Maintenance Agreement Bombardier Transportation Australia 2015

50
Department of Planning, Transport and Infrastructure Annual Report 2011-12
Appendices
Maintenance and Operation of the State Aquatic Centre
YMCA Aquatic and Events Services Ltd, Victoria YMCA
2016
Provision of Transport Services for the City of Mt Gambier
McCormick’s Bus Service 2016
Routine Maintenance of Roads in the Metropolitan North Region
Fulton Hogan Construction Pty Ltd 2016
Operation of the Vehicular Ferry Crossing the River Murray at Mannum
> Radell Services Pty Ltd 2017
Provision of Bus Passenger Transport Services for the Adelaide Metro Network
> Australian Transit Enterprises > Transfield Services > Transit Systems Pty Ltd
2019
Provision of a Land Administration System Salmat 2019
Smartcard fare collection system for Adelaide Metro public transport
Affiliated Computer Services Solutions 2024
(EMU) Railcar Maintenance Agreement Bombardier Transportation Australia 2024
CONSULTANCIESThe following tables display the department’s use of consultancies and the nature of work undertaken during 2011-12. Further to Machinery of Government changes, consultancies for incoming divisions are reported for the period commencing 1 January 2012 until 30 June 2012.
The categorisation used for reporting consultancies is under $10 000; $10 001-$50 000; and above $50 001.
Value below $10 000
Consultant Purpose of consultancy number total $
Various Various
Subtotal 15 15 $72 075
Value $10 000 - $50 000
Consultant Purpose of Consultancy number total $
Evans & Peck Prepare draft rail revitalisation report $10 000
KPMG Assess red tape reduction targets $10 000
K Thomas Strategic Solutions Marketing and sponsorship consultant $10 610
Australasian Transport Risk Solutions Court case review $11 417
MBM Across Government Facilities Management Arrangements - Contract Amendments
$12 182
Property Beyond Property management review $12 224
Spiros Sarris Archiving and Genealogy Services
Prepare Operational Records of Disposal Schedule
$13 200
ARU2000 Review of risk profile for new and changed infrastructure
$13 258

51
Department of Planning, Transport and Infrastructure Annual Report 2011-12
Appendices
Evans & Peck Incident investigations $14 835
David McArdle Consulting Leasing transactions review $14 864
Margaret Heylen Consulting Assess proposal for boundary adjustment
$14 923
HDS Australia Project Traffic Survey $16 100
PKF Org Development Consultation with industry as part of grants programs review
$17 485
S&J Rodger Pty Ltd Adelaide Oval media monitor $8 750
Philbak Pty Ltd Assess facilities and infrastructure of Kingscote Airport
$19 800
South Australian Centre for Economic Studies
Economic consultancy – Health $20 000
K Thomas Strategic Solutions Marketing and sponsorship consultant $20 000
Deep End Services Pty Ltd Activity centres and retail analysis review
$20 000
Arup P/L Consultancy services to develop concept design for relocation of SASI at Santos
$21 490
Halcrow Investigation report $21 548
Caravel Group Review Adelaide Convention Centre project
$22 500
AECOM Australia Pty Ltd Prepare concept designs for acoustic barriers
$23 182
CTC Treasury and Corporate Finance Adelaide Oval financial management $25 000
PKF Across Government Facilities Management Arrangements - SA Health Transitions
$25 350
Ernst & Young Across Government Facilities Management Arrangements - SA Health Transitions
$25 750
RLB Across Government Facilities Management Arrangements - Housing SA
$26 030
Heynen Planning Consultants Prepare report on Residential Codes complying conditions
$31 796
AMOG Engineering Solutions Develop a steady state safe case Provision of engineering services
$32 160
Ernst & Young Across Government Facilities Management Arrangements - Due Diligence Methodology
$38 935
Colliers International Consulting Services(SA)
Analysis of multi storey development in inner city corridor areas
$40 000
MBM Across Government Facilities Management Arrangements - Housing SA
$48 721
subtotal 31 $652 108

52
Department of Planning, Transport and Infrastructure Annual Report 2011-12
Appendices
Value above $50 000
Consultant Purpose of Consultancy number total $
KPMG Assess social and economic impacts of short term and long term sea access arrangements for Kangaroo Island
$51 500
Ernst & Young Across Government Facilities Management Arrangements - Housing SA
$71 070
Connor Holmes Develop consistent suite of land use and built form policies
$82 591
sub total 3 $205 161
total 49 $929 343*
* Note: the final amount does not include any amounts for payments made by divisions of the department outgoing due to
the Machinery of Government changes listed in the table below.
Consultancies for outgoing divisions
Consultant Purpose of Consultancy number total $
Bearing Point Pty Ltd Capability Assessment 1 $177 000

53
Department of Planning, Transport and Infrastructure Annual Report 2011-12
Appendices
OVERSEAS TRAVELInformation on overseas travel involving the Department of Planning Transport and Infrastructure staff for 2011-12 is presented below.
Total cost to the department includes flight cost, accommodation, conference fees, salary, on-costs etc.
number of employees
Destination/s Reasons for travel total cost to Agency (in whole dollars)
2 Canada Attendance: International Association of Transport Regulators (IATR) Annual Conference International Regulators (Taxi Services)Meeting: Proposed Stakeholder and Scoping Project
$27 970
1 China and Thailand Tour: BBV Systems factory/facility, Bangkok elevated structures.Meet with: AECOM, HAMCO China Steel Fabrication Facility and Atkins
$9 621
1 China, Shanghai and Beijing Attendance: 2012 Beach Volleyball World TourAll costs covered by Australian Volleyball Federation
NIL
2 France Attendance : World Road Association (WRA) Technical Committee
$13 730
1 France, England Attendance: WRA - Permanent International Association of Road Congresses (PIARC) meeting
$8 882
2 France, Germany and UK Attendance: Annual IVU User Forum.Site visit and assessment of Contract Management & Real Time Information Tools
$38 777
1 Holland Attendance, Head Coach SA Volleyball: Volleyball training camp for Australian Youth Beach Volleyball Teams
$1 508
1 Hungary, Poland, Germany, Russia, Canada
Attendance, Head Coach SA Canoe Sprint; appointed Assistant Coach of the Australian Men’s Olympic Kayak Team: International campaign, three World Cup events and European training camp
$13 066
1 Istanbul, Turkey, France, Netherlands, UK and Germany
Attendance: Eurasphalt & Eurobitume CongressParticipation: Australian Asphalt Pavement Association study tour of Europe
$20 681
1 Malaysia, Kuala Lumpur Attendance (speaker): Road Safety conference
$8 527
2 Mexico Attendance: World Road Association (WRA) Technical Committee
$12 008
1 Russia Attendance SA Diving Coach of 2012 Australian Diving Team: Participation in FINA Grand Prix
$1 600

54
Department of Planning, Transport and Infrastructure Annual Report 2011-12
Appendices
1 South Africa Attendance: Australian Asphalt Pavement Association Study Tour and 11th Conference of Asphalt Pavements for South Africa
$12 778
1 South Africa, Johannesburg Attendance: International Standards Organisation Project Committee to finalise ISO3900 Road Traffic Safety Management for publication
$8 629
2 USA Tour: Major sporting facilities.Meet with representatives from sporting organisations
$50 760
1 USA Orlando Florida Attendance: Present at 18th World Congress on Intelligent Transport Systems and 7th International Workshop on Vehicle Communications for Safety & Sustainability
$10 961
1 USA, Idaho Falls Attendance: Control Systems Cyber Security Advanced Training
$2 625
Total $242 130
ACCOUNT PAYMENT PERFORMANCE 2011-12Treasurer’s Instruction 11 Payment of Creditor’s Accounts requires public authorities to report to the Under Treasurer on the extent to which creditor’s accounts are paid by the due date on a monthly basis. The following table provides this information for 2011-12.
Particulars number of accounts paid
Percentage of accounts paid
(by number)
Value in $A of accounts paid
Percentage of accounts paid
(by value)
Paid by due date* 239,581 91.6% $3,373,623,479 95.9%
Paid late, within 30 days of due date
15,890 6.1% $92,610,915 2.6%
Paid late, more than 30 days from due date
6,105 2.3% $52,815,611 1.5%
* Note: the due date is defined under section 11.7 of Treasurer’s Instruction 11 Payment of Creditors’ Accounts.

55
Department of Planning, Transport and Infrastructure Annual Report 2011-12
Appendices
URBAN DESIGN CHARTERThe South Australian Urban Design Charter commits government agencies to achieve good urban design and foster liveable, efficient, creative, sustainable and socially inclusive environments through the design of public places and their interaction with private buildings. It applies to urban areas, including metropolitan Adelaide, regional centres and country towns.
The department directly contributed to the enhancement of South Australia’s public realm in 2011-12 through the following initiatives:
THE 30-YEAR PLAN FOR GREATER ADELAIDE
A growing population and changes in the region’s demographic make-up signal the need for new and more diverse forms of housing. Much of this new housing will be located close to good quality public transport and in activity centres and transit corridors that support the transition to more sustainable ways of living in and moving around the city.
The plan aims to deliver the following urban design principles:
> maximise and increase the amount and quality of public open space in areas expecting a significant increase in population and development intensity, as well as integrating this space with private open space
> ensure active street edges in and around activity centres, mixed-use environments and transit-oriented developments
> create good connectivity to encourage walking and cycling and promote the use of public transport
> strengthen local character to maintain neighbourhood and township identity
> create good connectivity between major open space corridors.
BUILDInG ConstRUCtIon CAPItAL InVestMent PRoGRAM
The department works in partnership with other government agencies and private sector professional service contractors to plan, design and deliver building projects that meet community needs, reflect good urban design practice and achieve positive outcomes for government and the community.
‘Our Buildings, Our Communities’ developed by the department articulates the objectives and principles for public building construction procurement complements the Urban Design Charter by drawing attention to the importance of good buildings, ethical, transparent and fair procurement processes and meeting the objectives of South Australia’s strategic and infrastructure plans.
PLACes FoR PeoPLe GRAnts
The department administered the Places for People funding program with the aim to revitalise or create public spaces that are important to the social, cultural and economic life of their communities.
The program fosters a culture of strategic urban design in councils and establishes practices that will benefit future public realm projects. In 2011–12 grants totalling $2.6 million were provided to councils to undertake eleven public realm projects across the state.
Since 2002 about $24.8 million has been made available for 214 Places for People projects, many receiving professional and industry awards.

56
Department of Planning, Transport and Infrastructure Annual Report 2011-12
Appendices
GREENING OF GOVERNMENT OPERATIONSThe DPTI Green Plan is the department’s response to the GoGO Action Plan and provides a framework to support the delivery of our services in a sustainable manner.
Highlights of the department’s GoGO achievements for 2011-12 are:
Priority Area 1 – Energy managementIn accordance with Government directives, 20 per cent of the energy purchased by the department is green energy.
All newly constructed office buildings used by government are required to be designed and built to at least a five-star rating. The department utilises the Green Building Council of Australia Green Star suite of design tools that includes a 5 star energy rating.
The department considers the National Australian Built Environment Rating System (NABERS) rating of a building as part of all lease renewals or new leases and negotiates sustainability upgrade works as part of lease terms and conditions where appropriate. In 2010-11, 34 per cent of the portfolio (owned and leased) had a NABERS rating of 4 stars or above and in 2011-12 this percentage has increased to 47 per cent.
Priority Area 2 – Water Conservation and Wastewater managementThe department has a range of water conservation and wastewater management practices in place and has implemented and negotiated with building owners for further water savings opportunities, including the replacement of taps and cisterns with water efficient units.
Water Sensitive Urban Design (WSUD) treatments are installed on infrastructure projects including the rail station upgrades for the Rail Revitalisation project. Treatment measures include biofiltration and using stormwater captured in swales to improve water quality which contribute to local recharge and assist watering of landscape plants.
Most urban road landscape projects are irrigated, with department maintained landscapes (including Anzac Highway median, City West Connector Stage 1 & 2, Portrush Road and the Gateway at the base of the freeway) consuming approximately 4 megalitres of mains water annually. Non potable water is used where available, for road construction and landscape establishment, for example on the Elder Smith road project and Southern Expressway Duplication.
Recycled water is used for cleaning and washing the bus and train fleet. Approximately two thirds of the 8.3ML of water per annum at the Dry Creek Railcar Depot uses recycled stormwater sourced from the adjacent Salisbury ASR scheme with the remainder of the water sourced from mains water. The majority of water usage at the site relates to the washing of trains and approximately 60-80 per cent of the train wash water is recycled.

57
Department of Planning, Transport and Infrastructure Annual Report 2011-12
Appendices
Priority Area 3 – Waste management and Resource UseBuilding waste recycling contracts have been adopted on a permanent basis at Netley Commercial Park, Victoria Place Precinct (representing four buildings), and Roma Mitchell House. These contracts enable reporting on waste streams and recent reports indicate 100 per cent of waste under these contracts is diverted from landfill.
For new projects and office refurbishments, the department makes use of the Ecospecifier tool (a library of green materials and products with information on their environmental footprint) for the selection of materials and office products.
The department changed the Metropolitan asphalt pavement rehabilitation contracts in early 2012 to require 15 per cent recycled asphalt (RAP) in 75 per cent of the asphalt supplied.
Use of recycled material and reuse of waste material is undertaken on transport infrastructure projects where feasible. Examples include, use of 53 600 tonnes of waste rail ballast and subgrade in the McLaren Vale Overpass project; reuse of 10 tonnes of recycled asphalt planings, 6 tonnes of concrete and 1 500 tonnes of fill material from the Eyre Highway, Caroona Road project in roads and levees within the local Council area; and reuse of mulch from Adelaide City Council green waste in landscaping in Narnungga Park 25.
Priority Area 4 – Built Facilities (Green Building management)Since January 2005, building owners seeking new or renewed leases for areas equal to, or greater than, one floor of a multi-storey building are required to disclose the NABERS Energy rating of the base building.
75 per cent of the Government’s leased accommodation portfolio in the CBD is in buildings with official NABERS Energy ratings as follows:
5.0 star nABeRs energy 27%
4.5 star nABeRs energy 15%
4.0 star nABeRs energy 20%
3.5 star nABeRs energy 5%
3.0 star nABeRs energy 5%
2.0 star nABeRs energy 3%

58
Department of Planning, Transport and Infrastructure Annual Report 2011-12
Appendices
Priority Area 5 – Travel and Fleet managementAll buses in the Adelaide Metro diesel bus fleet use a biodiesel blend with approximately a third of the fleet operating on B5 and two thirds using B20; 24 per cent are Euro5 EEV compliant; 20 per cent of the buses in the Adelaide Metro Fleet are powered by Compressed Natural Gas (CNG).
The department has bicycles at various sites available for work travel and the ANZ Building , Roma Mitchell House, 77 and 101 Grenfell Street, Norwood Office, and Tower 1 (Waymouth Street) are equipped with bicycle facilities.
Currently 78 per cent of the department’s Light Vehicle Fleet use low emission fuels.
Priority Area 6 – Green ProcurementThe department participated in the Zero Waste SA Sustainable Procurement project, undertaking a needs analysis/benchmarking study of departmental procurement practices with a view to addressing issues raised.
Requirements related to environmental management systems, use of recycled products and achievement of environmental enhancements as key features of infrastructure procurement.
Priority Area 7 – Human ResourcesEnvironmental modules are included in the induction of employees with links to the GoGO website and the DPTI Green Plan. Staff are encouraged to incorporate environmental considerations into their daily work activities.
Priority Area 8 – Administrative Policies and GuidelinesThe pre-qualification register for professional services contractors and construction contractors has a component relating to environmental criteria. Environmental considerations are referenced in the Government Office Accommodation Committee’s Office Accommodation Guidelines. This includes reference to Green Building Standards including the National Australian Built Environment Rating System which measures the environmental performance of office buildings during their operation. Environmental policies, guidelines and standards which are integrated into the Project Management Process across the department.

59
Department of Planning, Transport and Infrastructure Annual Report 2011-12
Appendices
ENERGY EFFICIENCY ACTION PLAN REPORTAgencies are required to report their performance against annual energy efficiency targets under the government’s Energy Efficiency Action Plan. The plan defines efficiency measures for new buildings and major refurbishment projects and incorporates energy efficiency practices into maintenance programs and procurement policies. It links to South Australia’s Strategic Plan Target 61, Energy efficiency – government buildings: improve the energy efficiency of government buildings by 30 per cent by 2020.
Measure: Percentage increase in energy efficiency in South Australian government buildings (2000-01 baseline).
sUMMARY oF eneRGY UsAGe, eneRGY exPenDItURe AnD GReenHoUse GAs eMIssIons 2000-01 AnD 2011-12
energy Use (GJ) energy expenditure $ GHG emissions (tonnes Co2)
2000-2001 energy – Facilities (department and across government)
Facilities – Electricity 130 053 – 34 724
Facilities – Gas 31 542 – 1 631
Total Energy – Facilities 161 595 – 36 355
2011-2012 energy - Facilities (across government – base building only)
Facilities – Electricity 27 571 1 134 235 5 207
Facilities – Gas 39 652 634 432 2 030
Total Energy – Base Building 67 223 1 768 667 7 237
2011-2012 energy - Facilities (department occupied sites only)
Facilities – Electricity 51 486 2 006 534 9 725
Facilities – Gas 380 6 094 19
Total Energy – department occupied
51 866 2 012 628 9 744
total energy – Facilities 119 089 3 781 295 16 981
Notes:1. Further refinements to the scope of the Department of Planning, Transport and Infrastructure (DPTI) 2010-11 reporting of
energy cost and consumption have been made for the 2011-12 reporting period to address anomalies in the allocation of facilities types.
2. Department reports its cost and consumption of energy: > for base building consumption (not tenant cost and consumption) as manager of the whole-of-government commercial
property portfolio; and > for sites occupied by department employees (predominantly offices but also some industrial facilities).
3. Energy Division, the Office of the Chief Information Officer and Service SA ceased to be part of the department portfolio on 1 January 2012 due to machinery of government changes. Planning SA and the Office for Recreation and Sport became a division of the department from 1 January 2012; however their energy use is not included in these figures.
4. Assumptions have been made to project full financial year expenditure and energy usage due to incomplete invoices received to date.

60
Department of Planning, Transport and Infrastructure Annual Report 2011-12
Appendices
DISABILITY ACTION PLANPromoting Independence – Disability Action Plans for South Australia provide a framework of action for agencies to meet the requirements of the Disability Discrimination Act 1992 (Cwlth) (DDA) and the Equal Opportunity Act 1984 (SA).
The department’s report of the progress against the six outcome areas outlined in Promoting Independence follows.
1. Ensuring facilities and services are accessible to people with disabilities The department is committed to ensuring the accessibility to services and facilities for all customers and government employees.
Ongoing refurbishments have been made to government owned and leased properties to address accessibility requirements and disability access consultants have been engaged on construction projects for new buildings to review designs before the final stages of planning and documentation.
Negotiations at the time of renewal of lease for 101 Grenfell Street has led to the upgrading of lifts, entrances and toilets, as well as the fitting out of workstations and team areas on several levels. Accessibility improvements include the installation of ramps and customised counter heights at the customer service area of the Lands Titles Office as well as audio enhancing handsets for people with hearing impediments. Interpreters are also available for clients.
Other leased buildings have also been upgraded with installation of automatic doors, improvement of external kerbing, installation access ramps and the upgrading of toilet facilities.
Infrastructure upgrades for all new and upgraded road, rail and marine projects and facilities incorporate accessible infrastructure, products and services for the community. Audio tactile pushbuttons at road signal sites are being provided for vision impaired people as well as refuges, access ways and ramps for people in wheelchairs or gophers
The department’s Disability Access Guidelines are provided to guide other state government agencies, local government, industry and the broader community to ensure projects meet the needs of people with disabilities.
Upgrades to public transport facilities to meet accessibility requirements have continued, with new railway stations built at Munno Para, Elizabeth and Elizabeth South and major upgrades at Gawler, Chidda and Evanston stations. Other works included upgrading lights and signage along the rail network.
The department’s $5.2 million grants program over four years is enabling local government across South Australia to replace or upgrade bus shelters to be DDA compliant. Since 2010, 327 grants have been issued for shelters, the majority of these installed by 30 June 2012.
61
Department of Planning, Transport and Infrastructure Annual Report 2011-12
Appendices
The Adelaide Metro fleet is ahead of the required schedule for DDA compliance with approximately 84 per cent of the bus fleet now wheelchair accessible. The annual bus replacement program introduces approximately 30 new buses to the fleet each year.
The 3000/3100 series railcar refurbishment program has almost reached full DDA compliance with the addition of audio loops for onboard announcements and increased space for wheelchairs and other mobility aids. Only three railcars of the 70 remain to be completed.
2. Information on services and programs are accessible and inclusiveThe department is committed to providing printed and online information that is accessible to everyone who uses its services and programs. Refinements are guided by user groups as well as disability service and training providers. An example is the removal of graduations in colour on printed timetables for better contrast for people with vision impairments.
Information and instructional material for the impending introduction of the new smart card ticketing system, Metrocard, is being made available in a range of formats to ensure accessibility and inclusiveness. Instructional video clips, which will be available on websites and on DVD, will have voice-over with AUSLAN sign-language as well as subtitles to assist a wider audience to whom written communication is less effective.
The department conducted a ‘Come and Try’ day in November 2011 for people with disabilities to try bus, train, tram and taxi services in a safe, supported environment. In addition to increasing the confidence of the people who participated, this also proved a valuable source of feedback for continued improvement in the provision of public transport services. The day was very successful and similar days are being planned for late 2012.
The department is committed to providing information in appropriate formats for people with disabilities and engages interpreters whenever necessary. Online services are also available for people who may be unwilling or unable to attend in person.
3. Disability Awareness and Discrimination Training Disability awareness training is well established within the department. New employees undertake online training during induction and resources are also available on the department’s intranet. In many cases, frontline staff training includes presentations by disability groups.
The department’s intranet provides a range of information about working with people with a disability and highlights our commitment to a diverse, discrimination free workplace. References are provided for managers and employees in relation to recruitment, workplace modifications and other general support available through disability service providers.

62
Department of Planning, Transport and Infrastructure Annual Report 2011-12
Appendices
4. Consultation with people with disabilities While initially convened and focussed on public transport, the Transport Accessibility Advisory Group (TAAG), is now the key body for consultation with people with disabilities throughout the department. TAAG consists of representatives drawn from the representative peak bodies and/or consumer representatives from the recognised areas of disability; physical; sensory; intellectual; psychiatric; neurological; mental health, developmental and learning disabilities. The following organisations and government departments attend or collaborate:
> Office of the Commissioner for Equal Opportunity
> Council on the Ageing
> Local Government Association
> Carers SA
> Physical Disability Council
> Disability Advocacy and Complaints Service Inc
> Disability Information Resource Centre
> Department for Communities and Social Inclusion
> Domiciliary Care Equipment Service.
TAAG provides input into the design, delivery and continuous improvement of our services and infrastructure.
5. Ensuring portfolios meet requirements of Disability Discrimination Act (DDA) and Equal Opportunity Act (EOA)
The department’s Disability Action Plan continues to be developed and refined to meet the requirements of the DDA and EOA.
Infrastructure and facilities are continuously upgraded, with DDA compliance reviews a requirement at each stage of a major infrastructure design project. Accessible information is being made increasingly available to customers and staff alike.
Regular communication with existing staff at all levels of the department is increasing awareness of DDA and EOA responsibilities and these responsibilities are highlighted during the induction of new employees.
6. Increasing the rate of employment of people with a disability (SASP Target 50. People with a disability)
The department is committed to the achievement of SASP Target 50. People with a disability: Increase by 10 per cent the number of people with a disability employed in South Australia by 2020.
The department’s Attracting the People We Need strategy actively provides opportunities to people with disabilities through its recruitment processes, presenting all vacancies up to and including ASO4 to the Disability Employment Register.
In addition, resources for managers to assist in undertaking recruitment and selection processes includes an intranet page on promoting independence. This page contains information regarding the services provided by Disability Works Australia as well as promoting the Disability Employment Register.

63
Department of Planning, Transport and Infrastructure Annual Report 2011-12
Appendices
REPORTS FROM THE REGISTRAR OF MOTOR VEHICLESInformation from the department’s 2010-11 Annual Report has been provided as a reference to this year’s annual report.
VeHICLes seCURItIes ReGIsteR
The Vehicles Securities Register which provided a means of identifying motor vehicles that are the subject of financial interests as defined under the Goods Securities Act 1986 (GSA) ceased operating on 27 January 2012. Under the Vehicles Securities Register, a fee was charged for each interest registered and for each certificate issued to prospective purchasers of motor vehicles. This service is now provided by the national Personal Properties Securities Register, administered by the Australian Government’s Insolvency and Trustee Service Australia.
In accordance with section 15(3) of the GSA, the following information is provided for the period 1 July 2011 to 30 June 2012:
> the total amount credited to the Highways Fund was $255 939.
> the cost to administer the provisions of the GSA during this period was $164 876.
> no fees were paid to other jurisdictions for the exchange of vehicles securities data.
> there was no compensation payment made during the 12 month period ending 30 June 2012 as a result of a court order.
> as at 30 June 2012 the net amount credited to the Highways Fund was $91 063 taking the cumulative balance credited to the fund to $5 340 547.
ReVenUe CoLLeCteD UnDeR tHe mOTOR VEHICLES ACT 1959 AnD BY ADMInIstRAtIVe ARRAnGeMent
2010-11 Million
2011-12 Million
Registration charges 317.98 337.63
Drivers Licence fees 35.57 63.77
Sundries* and commissions 16.98 18.95
Special Plates 5.25 5.41
General Plates 4.09 4.34
totAL ReVenUe 379.87 430.11
* Note: Sundries include revenue for Rider Safe, Examiners Courses, Tow Trucks, Driver Intervention, Sale of Information,
Administration Fees on Federal Registration and Alcohol Interlock Admin Subsidy. Commissions include Motor Accident Commission, Emergency Services and Courts.

64
Department of Planning, Transport and Infrastructure Annual Report 2011-12
Appendices
Revenue collected undeR the Motor Vehicles Act 1959 and dispeRsed to otheR agencies
2010-11 Million
2011-12 Million
Stamp Duty (inc Hospital Fund) 207.38 208.07
Third Party Insurance 586.05 604.66
Federal Registrations 8.07 9.28
Emergency Services Levy 31.27 31.53
total disbursed 832.77 853.54
vehicles RegisteRed as at 30 June 2012
vehicles by type 2011 2012 +/- change
Cars 730 419 732 528 0.29%
Station Wagons 245 466 257 802 5.03%
Panel Vans 35 900 35 708 -0.53%
Utilities 128 678 133 104 3.44%
Trucks 43 627 43 048 -1.33%
Prime Movers 7 495 7 796 4.02%
Other Commercial 12 924 12 880 -0.34%
Commercial Trailers 26 875 27 847 3.62%
Buses 4 252 4 222 -0.71%
Tractors 31 782 31 274 -1.60%
Motor Cycles 41 675 42 803 2.71%
Caravans 39 343 40 677 3.39%
Trailers 242 816 247 685 2.01%
Others 14 693 15 446 5.12%
total vehicles 1 605 945 1 632 820 1.67%

65
Department of Planning, Transport and Infrastructure Annual Report 2011-12
Appendices
DRIVeR’s LICenCes ReGIsteReD As At 30 JUne 2012
Class Common terms 2011 2012 +/- change
C (Car) Car 972 601 983 659 1.14%
LR Light rigid truck 21 793 23 323 7.02%
MR Medium rigid truck 40 065 40 150 0.21%
HR Heavy rigid truck 58 788 58 781 -0.01%
HC Heavy combination 39 487 38 897 -1.49%
MC Multi trailer combination
9 281 9 755 5.11%
R Size restricted Motor Bike
151 550 152 390 0.55%
R ‘Date’ Full Motor Bike Licence
14 907 16 019 7.46%
total Licence Holders*
1 141 912 1 154 578 1.11%
* Note: Includes licence types, Learner, P1, P2, Probationary and Full. Drivers can have multiple classes of licence
i.e. “C” and “R” therefore the number of licence holders will not equal the sum of the classes.
RIGHts oF ReVIeW AnD APPeAL
Section 98Z of the Motor Vehicles Act 1959 ‘Rights of Review and Appeal’ enables a person aggrieved by certain decisions of the Registrar of Motor Vehicles to apply for an internal review of the decision. If a person is dissatisfied with the outcome of a review, section 98ZA provides the person with a right of appeal to the District Court.
ReVIeWs AnD APPeALs UnDeR s98z oF tHe mOTOR VEHICLES ACT 1959
2010-11 2011-12
Total number received 51* 30
Confirmed 27 12
Varied 1 1
Set aside 15 4
Court Appeal 0 1
Not eligible to seek review 3 3
Application withdrawn 2 4
Pending 3 5
* The number of reviews increased in 2010-11 financial year due to the introduction of High Powered Vehicle Restrictions for
provisional licence holders.

66
Department of Planning, Transport and Infrastructure Annual Report 2011-12
Appendices
ACCIDent toWInG AnD InVestIGAtIons
During the past financial year, the 40 towing services registered to operate on the Accident Towing Roster Scheme performed 11 981 accident tows on behalf of the public within the Declared Area (greater metropolitan Adelaide) compared with 12 068 accident tows in 2010-11.
e-CoMMeRCe
In 2011-12, 1.6 million registration and licensing payments were made online over the internet, an increase of approximately 21 per cent on 2010-11.
Registration renewals are the most common transaction. In 2011-12. Of the 3.2 million registration renewals paid, 1.4 million (45 per cent) were paid online, an approximate increase of 20 per cent on 2010-11. 267 000 renewals were made by telephone and 50 000 were completed by a smart phone.
688 000 registration renewals were paid at a Service SA customer service centre, a decrease of approximately 23 per cent per cent on 2010-11.
In 2011-12 over 350 000 licences were renewed and renewing driver’s licences online remains popular and constant with previous years.
REPORTING AGAINST THE aIr tranSPort act 2002the following report is provided pursuant to section 19 of the Air Transport (Route Licensing-Passenger Services) Act 2002 (the Act).
oPeRAtIon & ADMInIstRAtIon oF tHe ACt In 2011-2012
Adelaide-Port Augusta was the only route subject to a Route Service Licence during Financial Year 2011-12. This route is marginally viable and licensed in accordance with s5(3) of the Air Transport (Route Licensing-Passenger Services) Act 2002 (the Act) “…to encourage an operator or operators of air services to establish, maintain, re-establish, increase or improve scheduled air services on the route.”
Sharp Aviation Pty Ltd, trading as Sharp Airlines, is the licence holder and operated in accordance with its licence conditions throughout the period.
On 13 March 2012, as required by condition 3 of its route service licence, Sharp Airlines gave formal notification of its intention to raise the fully flexible fare on the route from 1 July 2012 by $14 from $267 to $281 (5.2 per cent).
The Minister for Transport and Infrastructure noted the increase on 10 April 2012. The Minister confirmed that he was satisfied the increase was justified as a result of increased input costs and Consumer Price Index, withdrawal of the Australian Government’s enroute navigation charge subsidy from 1 July 2012 and the Commonwealth Government’s increase in aviation fuel excise from 1 July 2012.

67
Department of Planning, Transport and Infrastructure Annual Report 2011-12
Appendices
REPORTING AGAINST THE PaSSenGer tranSPort act 1994
PAtRonAGe In MetRoPoLItAn ADeLAIDe
The department administers the Passenger Transport Act 1994 and Regulations by planning, regulating and funding public transport services (bus, train and tram, taxi and hire car) across South Australia.
Public transport bus services in Adelaide, Gawler and the Adelaide Hills are provided through contracts administered by department with three private bus providers that operate as Southlink, Torrens Transit and Light-City Buses. The department operates all metropolitan rail and tram services through the Rail Commissioner entity which has accreditation under the Passenger Transport Act 1994.
The Department also administers public transport services in regional South Australia. These include regular route services (country bus services), provincial city services, community passenger networks, integrated transport plans, special medical-related services and dial-a-ride services.
For the 2011-12 year, metropolitan public transport patronage has seen:
> initial boardings on the public transport system decreased by 3.2 per cent.
> transfer boardings on the public transport system decreased by 5.4 per cent.
> total patronage, including initial boardings and transfers, decreased by 3.7 per cent across the Adelaide Metro network in 2011-12.
Decreases in patronage are directly related to major rail line closures (with additional patronage impact on feeder bus services). Major Rail Revitalisation closures included the Noarlunga line which re-opened in mid July 2011, Gawler line closure from mid-September 2011 until late March 2012, closure from late February 2012 of the Tonsley line and reduced services on the Grange line.
In addition, traffic disruptions associated with projects such as the North-South Pipeline, Southern Expressway Duplication and the Harris Scarfe redevelopment in the Central Business District impacted operations and had a negative effect on patronage. The state government in response developed new timetables which came into operation on 1 July 2012. These new timetables are closely aligned to the actual operating times of services and with the planned introduction of bus priority on Currie and Grenfell Streets are expected to improve customer confidence in the services and lead to an increase in patronage.

68
Department of Planning, Transport and Infrastructure Annual Report 2011-12
Appendices
ADeLAIDe MetRo BoARDInGs 2011-12 (MILLIons)
Initial boardings by mode:
Year Bus tram train total initial boardings
2011-12 39.197 2.423 7.991 49.611
Initial boardings by passenger type:
Year Regular Concession other total initial boardings
2011-12 15.554 24.021 10.036 49.611
Initial boardings by ticket type:
Year singletrip Daytrip Multitrip other/Free total initial boardings
2011-12 8.261 1.338 33.941 6.071 49.611
sPeCIAL eVent seRVICes
The department made special arrangements to enhance passenger transport for a range of special events including the Royal Adelaide Show, New Year’s Eve celebrations, Clipsal 500, WOMADelaide, Santos Tour Down Under, Credit Union Christmas Pageant, City-Bay Fun Run and ANZAC Day. A temporary show grounds train station, temporary bus route changes, additional bus stops, bus parking zones and taxi stands, as well as strategically increased capacity were all provided to ensure passenger transport needs were met and that public transport to these major events ran smoothly.
The SA Lotteries Footy Express continued to be popular with people attending AFL football. Almost 128 000 patrons had used the service, representing on average approximately 20.1 per cent of the AAMI stadium attendance each game.
ADeLAIDe FRee seRVICes
The Adelaide Free services provide free travel for customers in the central city area. The City Loop service (99C) travels around the city taking in many of Adelaide’s attractions. Adelaide Free buses are fully accessible and powered by environmentally friendly compressed natural gas. The Adelaide Free bus service complements the popular free tram service between South Terrace and the Adelaide Entertainment Centre. This free tram service has become increasingly popular as more people park their cars at the Entertainment Centre and take a tram into the Central Business District.

69
Department of Planning, Transport and Infrastructure Annual Report 2011-12
Appendices
ReGIonAL seRVICes
The department regulates and contributes to funding transport services in some regional areas and fosters regional transport initiatives that provide collective transport solutions identified through extensive community consultation and detailed transport studies.
Regular route services operate across regional SA and link major centres in South Australia and to Adelaide. Services operate in the Barossa, Murray Mallee, Mid North, Upper North, Far North, Riverland, Eyre, South East and Fleurieu regions.
Integrated transport services operate in the Coorong District Council, Karoonda East Murray District Council, Southern Mallee District Council, Mid-Murray District Council, Southern Yorke Peninsula, Tatiara, the Eastern Riverland, the Upper North, the Mid North and Mount Barker.
Special (medical) services also operate in a number of regions that provide accessible, door to door services for people unable to access conventional public transport to travel to medical appointments. These services operate in the Murray Mallee, Yorke Peninsula, Upper North and Mid North.
Based on data provided by country bus operators, country bus patronage for 2011-12 was 900 133 compared to 905 318 in 2010-11, a decrease of 0.6 per cent.
PRoVInCIAL CItY BUs seRVICes
Regular passenger services also operate in South Australia’s provincial cities of Port Lincoln, Whyalla, Port Augusta, Port Pirie, Murray Bridge and Mount Gambier.
Dial-a-Ride door to door services are also provided in Gawler, Angle Vale, Victor Harbor, Port Lincoln, Murray Bridge, the Copper Coast and Barossa Valley. These supplement regular timetabled services and extend the range of public transport for these communities.
Based on data provided by provincial city bus operators, patronage for 2011-12 was 431 141 compared to 452 216 in 2010-11, a decrease of 4.7 per cent.
ALteRnAte seRVICes DURInG MAJoR RAIL PRoJeCts
Substitute bus services provided during the Rail Revitalisation program works were contracted to the Adelaide Metro providers with a key task to minimise disruption to customers while rail lines were closed.
The substitute services were required until mid July 2011 for Noarlunga services as the Noarlunga Centre to Oaklands section of track was upgraded and for the Gawler line from 18 September 2011 until 31 March 2012 for works between Mawson Lakes and Gawler Central.
In addition, substitute services have been made available for customers who would normally use the Tonsley lines while closed and to supplement Grange line services which have been restricted, both due to temporary platform closures at the Adelaide Railway Station since February 2012 – associated with upgrade works at the Adelaide Convention Centre.
CoMPLAInts, CoMMenDAtIons AnD sUBMIssIons
This section established for the purpose of the Act reports on the number and nature of complaints, commendations and submissions made to the Minister by members of the public.

70
Department of Planning, Transport and Infrastructure Annual Report 2011-12
Appendices
FeeDBACK on PUBLIC tRAnsPoRt
The department welcomes feedback from customers about passenger transport services and provides multiple opportunities through the Adelaide Metro website, Adelaide Metro Infoline and InfoCentres, and via social media on Facebook and Twitter. The level of complaints represented 0.03 per cent of total public transport patronage (initial boardings and transfers) in the 2011-12 financial year. Further details on feedback received are provided below.
Feedback 2010-11 2011-12
Commendations 538 639
Suggestions 306 539
Complaints
Service changes and service quality 6 338 7 705
Punctuality 2 074 7 372
Fares and ticketing 726 679
Passenger comfort 389 1 301
Other 446 535
total complaints 9 973 17 592
FeeDBACK on tAxI AnD sMALL PAssenGeR VeHICLe seRVICes
The department receives complaints and commendations regarding taxis and small passenger vehicles. Complaints may lead to disciplinary action being taken if a breach of the Regulations under the Act is found to have occurred. Total taxi complaints presented in the table below represent 0.01 per cent of the estimated eight million journeys provided over the past year.
Feedback 2010-11 2011-12
Commendations 17 8
Complaints 1 086 771

71
Department of Planning, Transport and Infrastructure Annual Report 2011-12
Appendices
WAItInG tIMes
The taxi centralised booking services reported that the average waiting time for general taxis in metropolitan Adelaide for 2011-12 was 8.92 minutes during the day (6.00 am to 6.00 pm), which represents a decrease compared to 2010-11 which was 9.6 minutes. At night (6.00 pm to 6.00 am) the waiting time was 9.86 minutes which is also a decrease compared to 2010-11 which was 11.6 minutes. These figures include waiting times for phone-booked, hailed and taxi rank trips and meet the prescribed waiting time, as stated in the conditions for accreditation, of 12 minutes.
There are currently 988 active general licenses operating in metropolitan Adelaide following the addition of 20 general licenses in this past year.
ACCess tAxIs
For the 2011-12 financial year 86.4 per cent of Access taxi passengers were picked up within 13 minutes, a minor decrease compared to the previous year where the number of passenger pick ups within 13 minutes was 87 per cent. The number of Access taxi passengers picked up within 30 minutes has averaged 98.1 per cent, remaining consistent with the result achieved the previous year.
The Access taxi fleet has been expanded to 100 following the addition of three general taxi licenses with special conditions (accessible taxis). This increased the fleet by 3 per cent which now represents 9.2 per cent of the total taxi fleet.
PAssenGeR tRAnsPoRt stAnDARDs CoMMIttee
The Passenger Transport Standards Committee (PTSC) is a statutory committee established under the Passenger Transport Act 1994 responsible for exercising disciplinary powers under Part 4, Division 5 of the Act, and for exercising or performing such other powers or functions as may be conferred on the PTSC by the Minister from time to time.
In 2011-12 the PTSC met on 97 occasions and considered 235 matters, including:
> 107 accreditation applications
> 118 disciplinary matters
> 3 vehicle age limit exemption applications
> 7 Exclusion Orders.
Of the 118 disciplinary matters, the PTSC suspended the accreditation of 44 accredited persons for a period of time and permanently disqualified 8 persons from holding accreditation under the Act. The remaining accredited persons were fined and required to undertake further training.

72
Department of Planning, Transport and Infrastructure Annual Report 2011-12
Appendices
REPORTING AGAINST THE carerS recoGnItIon act 2005 The department is required to report on action taken to comply with the requirements of section 6 of the Carers Recognition Act 2005 (the Act):
> ensuring its officers, employees or agents have an awareness and understanding of the SA Carers’ Charter
> taking action to reflect the principles of the charter in the provision of relevant services
> consulting with carers and organisations that represent carers, particularly in relation to policy or program development, or strategic or operational planning, relevant to carers and the persons they care for.
Carers are defined under the Act as the family and friends who provide ongoing care or assistance to someone who has a disability, or a chronic illness including a mental illness, or is frail and requires assistance carrying out everyday tasks. Carers include members of the South Australian community who are our customers as well as employees of the department who are also carers.
As the lead agency for the implementation of the Carers Recognition Act, the Department for Communities and Social Inclusion (DCSI) requires all agencies to address a number of questions to enable them to assess progress.
seRVICe DeLIVeRY RePoRtInG
Legislated Obligation 1:There is a system to ensure all management, staff and volunteers have an awareness and understanding of the Carers Charter.
The one-stop contact point for government information, products and services www.sa.gov.au provides information and help to the South Australian community, including department staff and organisations who represent carers.
The department also provides specific public transport information for carers available via www.adelaidemetro.com.au as well as the Adelaide Metro Infoline and InfoCentres.
South Australians with disabilities are able to apply for transport assistance under the Plus One Free Companion card and the South Australian Transport Subsidy Scheme (SATSS). The Plus One Free Companion card provides assistance to people who cannot travel independently, due to physical mobility, cognitive sensory or communication impairments.
Holders of a Plus One Free Companion card are able to travel on all Adelaide Metro bus, train and tram services throughout metropolitan Adelaide accompanied by a companion/carer. The companion/carer is automatically recognised through their relationship with the person requiring care who controls the card and travels free of charge.
Please rate the extent to which you think your agency has achieved Legislated obligation 1
80-100% 60-80% 40-60% 20-40% 0-20%

73
Department of Planning, Transport and Infrastructure Annual Report 2011-12
Appendices
Legislated Obligation 2:there is a system to ensure appropriate consultation with carers, or persons or bodies that represent carers, in the development of strategic and business plans and policies and procedures
The department convenes the Transport Accessibility Advisory Group (TAAG), which meets regularly with South Australian peak body groups for people with disability, their advocates and carers. TAAG consults on implementation, operation and evaluation of services, facilities and infrastructure initiatives.
Representation includes Carers SA, the Disability Complaints and Advocacy Service and Physical Disability Council of SA (who include the concerns of carers for people with disabilities). TAAG also provides advice on the development and review of the department’s Disability Action Plan and strategic planning for disability service provision across the department.
Please rate the extent to which you think your agency has achieved Legislated obligation 2
80-100% 60-80% 40-60% 20-40% 0-20%
Legislated Obligation 3:there is a system to ensure the principles of the Carers’ Charter are reflected in divisional practices.
The involvement of Carers SA in the department’s Transport Accessibility Advisory Group is greatly valued. This involvement provides input to inform and enable the department to reflect the principles of the Carers’ Charter.
Please rate the extent to which you think your agency has achieved Legislated obligation 3
80-100% 60-80% 40-60% 20-40% 0-20%
HUMAn ResoURCe RePoRtInG
Legislated Obligation 1:there is a system to ensure all management, staff and volunteers have an awareness and understanding of the Carers’ Charter.
As part of machinery of government changes, the department reviewed and integrated a number of areas and employees into its existing human resource policy framework.
The department’s policy framework sets out the responsibilities of managers to assist employees to meet their caring responsibilities and provides a range of options to employees, including family carer’s leave, flexible leave arrangements and access to special leave. An online carers awareness program is available through the departmental intranet and is a mandatory component of the corporate induction program for all new employees and managers.

74
Department of Planning, Transport and Infrastructure Annual Report 2011-12
Appendices
Legislated Obligation 2:there is a system to ensure appropriate consultation with carers, or persons or bodies that represent carers, in the development of strategic and business plans and policies and procedures
Consultation occurs with employees who are carers as part of normal employee consultative processes. The department has a wide range of consultative processes including both at the corporate and local levels.
Legislated Obligation 3:there is a system to ensure the principles of the Carers’ Charter are reflected in divisional practices.
The principles of the Carers’ Charter are incorporated into human resource operating procedures, the online training program and the corporate induction program.
Individual divisions are responsible for implementing policies at a divisional level and reporting back on this through the annual reporting process.

75
Department of Planning, Transport and Infrastructure Annual Report 2011-12
FInAnCIAL stAteMents

76
Department of Planning, Transport and Infrastructure Annual Report 2011-12


