122
Department of Primary Industries IHD Inclusion into ESI scheme Final Report December 2011

Department of Primary Industries
IHD Inclusion into ESI scheme
Final Report
December 2011
December 2011 2
Authors
This research and report was completed in December 2011 by:
Simon Vardy (Accenture)
Dominic Mendonca (Accenture)
Roderick Murchison (Accenture)
Michael Clements (Accenture)
Robert Vurens van Es (Accenture)
About Accenture
Accenture is a global management consulting, technology services and outsourcing company, with more than 223,000 people servi ng clients in more than 120 countries. Combining unparalleled experience, comprehensive capabilities across all industries and business
functions, and extensive research on the world‘s most successful companies, Accenture collaborates with clients to help them become high-performance businesses and governments. Its home page is www.accenture.com.

December 2011 3
Table of Contents 1 Executive Summary ............................................................................................................................ 5
2 Introduction ......................................................................................................................................... 8
2.1 Objective of this report ............................................................................................................ 8
2.2 Scope / Terms of Reference ................................................................................................... 9
2.3 Process and Industry Consultation .......................................................................................... 9
3 Summary of Recommendations ........................................................................................................ 10
4 A Survey of IHDs and Their Impacts .................................................................................................. 13
4.1 What is an In Home Display? ................................................................................................ 13
4.2 Where have IHDs been used? .............................................................................................. 15
4.3 How have Consumers Responded to Feedback? .................................................................. 20
5 Calculating the Benefits of IHDs installed .......................................................................................... 30
5.1 Calculating the associated greenhouse gas abatement ......................................................... 30
5.2 VEECs generated and end-user cost of IHD ......................................................................... 40
5.3 Other Benefits of IHDs for Victoria......................................................................................... 44
6 IHD Minimum Features ..................................................................................................................... 45
6.1 Minimum Features Required ................................................................................................. 46
6.2 Features not included as minimum ........................................................................................ 49
6.3 Minimum Specifications ........................................................................................................ 51
6.4 Examples of IHDs Meeting the Proposed Minimum Specifications ......................................... 53
7 Industry Processes and B2B Procedures........................................................................................... 55
7.1 Guiding Principles ................................................................................................................. 55
7.2 ESI scheme Participants ....................................................................................................... 57
7.3 AP Accreditation ................................................................................................................... 58
7.4 Proposed Procedures ........................................................................................................... 61
7.5 Stakeholders Engaged .......................................................................................................... 77
8 Legislative and Regulatory Considerations ........................................................................................ 79
8.1 Privacy ................................................................................................................................. 79
8.2 Health and Safety ................................................................................................................. 82
8.3 Auditing and Administration of Program ................................................................................ 83
8.4 Disposal and e-waste............................................................................................................ 84
8.5 Contestability of the HAN market .......................................................................................... 84
8.6 Accessibility of electricity interval meter data ......................................................................... 86

December 2011 4
9 Potential Supplementary Measures ................................................................................................... 87
10 Selected References ......................................................................................................................... 88
11 Glossary ........................................................................................................................................... 92
12 Appendices ....................................................................................................................................... 95
Appendix A1: Literature Review ...................................................................................................... 95
Appendix A2: Trials Reviewed without Consumption Savings........................................................ 100
Appendix B: Calculation of Trial relevance and Market relevance .................................................. 102
Appendix C: Retailer Issues raised during consultation process .................................................... 104
Appendix D: Deeming Calculation & VEET Activity Modelling........................................................ 105
Appendix E: Key Criteria for Certificate Calculation Methodology .................................................. 113
Appendix F: Summary of Submissions to Discussion Paper .......................................................... 116
Appendix G: Process Flows for Key IHD Lifecycle Processes ....................................................... 119

December 2011 5
1 Executive Summary
In Home Displays (IHDs) are not currently included in the Victorian Energy Saver Incentive (ESI) scheme. However global pilots and trials have shown they have the potential to allow energy consumers to save energy and reduce their bills by changing their behaviours based on direct feedback of energy usage information.
This report details the issues and provides recommendations on how IHDs could be included in the ESI scheme. As has been made clear by many industry stakeholders, this topic necessarily touches upon a much broader set of issues to do with enabling industry wide collaboration to establish Home Area Networks for consumers. Where possible the report presents solutions and recommendations but also identifies where further investigation and industry input is needed.
IHDs can take a number of forms based on the definition we use in this report. They are not restricted to being a stand-alone device linked to a smart meter. The principal test used is that it must provide near-real time feedback on energy use in the home (along with other minimum specifications). This can be achieved in a variety of ways such as linking via a dongle to a tablet device or personal computer. Additionally our definition also covers devices that do not need to use a smart meter but rather estimate usage by measuring electrical current into the home.
The first area of investigation for this report is the likely effect of IHDs on consumer behaviour. Unlike many other registered activities in the ESI scheme IHDs are designed to prompt a behavioural change in consumers and it is this which gives rise to greenhouse gas abatement. To determine the possible range of energy reduction amounts we reviewed 76 trials as well as numerous meta-studies of global trials. The analysis also investigates seven Australian trials. The main conclusions are that IHDs:
1. Drive energy consumption reduction in isolation from other feedback types; 2. Elicit a positive response from consumers when they are asked about them 3. Promote energy saving behaviours which persist over time – they appear to have a stimulating
effect on consumers helping them to understand their consumption patterns.
Using these findings and matching the trial structures to local conditions we concluded that IHDs could reasonably provide an average annual energy reduction of 6.6% across all consumers in Victoria for 5 years. For consumers in metro areas, this leads to a lifetime GHG abatement potential of 1.83 tonnes for consumers with access to reticulated gas and 2.42 tonnes for those without. However for consumers in regional areas, the lifetime GHG abatement potential for those with access to reticulated gas is 1.94 tonnes, and for those without access to reticulated gas is 2.57 tonnes. This corresponds with 3 VEECs generated for regional consumers without access to reticulated gas, and 2 VEECs for all other cases. There is of course some interpretation of trial data required to reach these conclusions however this report provides the full list of trials and methods for others to use and analyse.
Minimum features and specifications of IHDs required in order to achieve this lifetime GHG abatement and to maintain customer confidence in the activity were investigated and we have recommended a number of features that IHDs must have in order to qualify for VEECs under the ESI scheme.
The final main area of analysis included in this report are the key processes and responsibilities required to establish a robust, reliable and functioning market for IHDs in the ESI scheme.
To inform this report we established a quick consultation process with industry leading to a workshop with a request to provide follow up written responses to an issues paper. Submissions from numerous parties

December 2011 6
were received including combined responses from the 5 distribution businesses and the industry body representing energy retailers. All stakeholders were broadly supportive of the inclusion of IHDs in the ESI scheme, and of IHDs in general being available to consumers. However there were a number of key concerns raised. These are detailed and expanded upon in this report.
If IHDs are to be included in the ESI scheme processes, procedures and agreements will be required to enable IHDs to be sold, registered, utilised and possibly decommissioned in a streamlined and robust manner. Depending on timing this may establish the groundwork and a foundation for a national HAN or beyond-the-meter market
1. The roles and responsibilities of different parties was a key part of the
consultation and analysis leading to the findings in this report.
The following key issues were identified and are analysed in detail:
Processes to ensure IHDs will operate with existing AMI infrastructure;
Requirements for parties selling devices including service levels (including discussion on energy retailer involvement);
Ensuring reliable and reasonable service for binding processes from distribution businesses;
Ensuring appropriate levels of interaction for customer support;
Safeguarding customer privacy.
An overview of the report‘s recommendations for the involvement of responsible parties2 in the lifecycle of
IHDs in the ESI scheme appears in Table 1 below.
1 However this report is solely concerned with the establishment of processes within the existing Victorian regulatory and operational
market environment to enable a practical implementation within the known constraints. 2 This is based on market role descriptions, a particular entity might hold multiple roles in the market and hence an energy retailer
might also be an AP.

December 2011 7
Table 1: Responsibilities of Stakeholders across an IHDs Lifecycle Within the ESI Scheme
This report, while undertaken in a relatively short timeframe should provide the foundation for the DPI to determine the most applicable route to include IHDs in the ESI scheme (an outcome widely supported by industry). The recommendations which follow show clearly where we believe a conclusion can be reached and also where further work is required. Overall program success will require a combination of in-depth analysis with stakeholder acceptance, robust processes, industry collaboration and directed communication.
Process Stage (See Section 7 for further detail)
Participants IHD Accreditation Sale & Registration Usage Decommissioning
Accredited
Persons
(APs)
Identifies
new products
Sells IHDs,
informs
customers
Handle
customer
queries
Distributors
(DBs)
Tests new
IHDs with
AMI systems
Actions
binding
requests
Re-binding,
site visits if
needed
De-binds IHD
if needed
Retailers
(RBs)
Advises DB
if retailer
changed
Informs DBs
of move-out
Essential
Services
Commission
(ESC)
Approves
IHD inclusion
into ESI
Registers
VEECs for
APs
Customer
Purchases
IHD,
requests
binding
Calls
APs/RBs if
maintenance
needed
Requests
move-out /
de-bind
Level of interaction responsibility for each stakeholder at each process stage
Key:
December 2011 8
2 Introduction
The Victorian Energy Efficiency Target (VEET) is an initiative designed to make energy efficiency improvements more affordable, contribute to the reduction in greenhouse gases, and encourage investment, employment and innovation in industries that supply energy efficiency goods and services. It was established under the Victorian Energy Efficiency Target Act (2007) and came into effect on 1 January 2009, promoted as the Energy Saver Incentive (ESI) and implemented as a legislative requirement placed on electricity and gas retailers. The role of the Department of Primary Industries (DPI) is to provide policy advice to the Minister for Energy and Resources regarding the ESI scheme. The scheme is administered by the Essential Services Commission of Victoria (ESC).
The first three-year phase of the scheme (2009 – 2011) concentrated on domestic usage and had a limited set of allowed activities. The next three year phase of the scheme (2012 – 2014) will include small and medium enterprises and has the potential to include additional activities. The target for the 2012 – 2014 period has also been doubled to 5.4 million lifetime tonnes of greenhouse gas.
Under the scheme, an obligation is placed on energy retailers to purchase a certain number of certificates (VEECs) every year. Each certificate represents a lifetime saving of 1 tonne of CO2 abatement. That is, an activity generates one certificate if it causes, over the lifetime of the activity, 1 tonne of CO2 to be saved relative to business as usual (i.e. without the activity having taken place). As there is an obligation on retailers to purchase these certificates, they have a value and this value can be discounted (or be an effective subsidy) for the activity taking place.
IHDs as an eligible activity
In-Home Displays (IHDs) are devices that allow energy consumers to potentially save energy and reduce their energy bills through a better understanding of their household energy consumption.
IHDs are not currently included in the Energy Saver Incentive scheme; however there is evidence that they could have the potential to be an effective driver of greenhouse gas abatement by changing the energy consumption behaviour of consumers due to:
The mass roll-out of electricity smart meters as part of the Victorian AMI program which enables the installation of a range of IHD devices
Maturity of IHD technology as vendors refine their products
Increased Victorian household focus on rising energy bills
2.1 Objective of this report
The Department of Primary Industries (DPI) engaged Accenture to evaluate the inclusion of IHDs as an approved activity under the Energy Saver Incentive scheme and how the activity could be implemented. The evaluation includes answering the following key questions:
a) What amount of greenhouse gas abatement (and hence VEECs), should be ascribed to the installation of IHDs?
b) What are the market processes and business to business (B2B) procedures that are required to operationalise the roll-out of IHDs?

December 2011 9
c) What are the regulatory and legislative issues to consider for an IHD roll-out, and how can they be managed?
3
d) What are the expected end costs to consumers? e) What are the key risks from including IHDs in the ESI scheme?
As far as possible this report has attempted to define and recommend workable processes that could facilitate the quick and easy implementation of IHDs in the ESI scheme. We have also stated where further work and consultation should occur before implementation. However this report aims to facilitate a quick but robust inclusion within the ESI scheme.
2.2 Scope / Terms of Reference
The scope as defined in the RFQ dated 29th July 2011 is to:
―...deliver a plan to support the introduction of IHDs as an activity under the ESI scheme. The overall objective supported by the plan is to enable rollout of IHDs, supported by the ESI, in the shortest timeframe that allows risks to be effectively managed. It is important that the plan recognises and proposes approaches to effectively address barriers to market rollout, allowing a range of APs (not solely energy retailers) to install IHDs.‖
This report does not focus on broader AMI issues regarding In Home Displays – for example the potential for load shifting and benefits associated with reduction of peak demand through load control or messaging. It also does not focus on considerations of social equity such as specifically enabling lower-income consumers to be included in the scheme as these issues are not directly related to the objectives of the ESI scheme.
We have commented in Section #8 on some of those broader issues for consideration by the DPI, but have not focussed on them in this report.
2.3 Process and Industry Consultation
This report was completed over a 6 week period and included the following processes:
1) Global literature review and SME consultation 2) Industry briefing paper and call for written submissions 3) Industry Workshop 4) NGO and non industry interviews 5) Draft report compilation and review 6) Final report for the DPI
A public presentation also occurred on 22nd
November 2011 at 1 Spring St, Melbourne.
3 Accenture is not licensed to provide legal or regulatory advice. Any information in this report regarding legal issues is as obtained by
project stakeholders with Accenture making no assessment of such information.

December 2011 10
3 Summary of Recommendations
The following are the summarised recommendations of this report. It is recognised that several issues are outstanding and this report recommends further work to finalise these issues.
Recommendation Reference Further work required?
Minimum specifications for the IHDs eligible for VEECs have been identified in order to obtain the GHG abatement estimated. These are:
near real-time feedback of < 30 seconds
historical usage data of at least 45 days
indicative cost data in c/kWh and accumulated cost ($)
a non-numerical and numerical display
data communications security
a minimum level of accuracy to within +/- 5% of a correctly functioning meter
a power draw of no more than 0.6 W
the ability to erase data
battery replacement not required for life of device (5 years)
Section #6 Further consultation with industry and interested stakeholders should follow, and other related technologies (particularly the provision of electricity consumption feedback to consumers over the internet) should be considered for inclusion into the ESI scheme.
Some minimum features for the IHDs were not included as they were not directly related to GHG abatement; however they may be of interest to government more broadly.
Section #6.2 We recommend that the DPI consider these features in light of broader government objectives than just the ESI scheme.
The process for IHD device accreditation should include a testing period by Victorian distributors to ensure that the devices function correctly with the Victorian AMI infrastructure. This should not be seen as an opportunity for Victorian distributors to ―veto‖ the device, but rather as a precautionary testing and pre-warning process.
Section #7.4.1 Precise timeframes and notification processes will need to be agreed between the ESC and Victorian distributors.
Additional rigorous conditions should be applied to AP‘s applying for accreditation under this scheme. This includes minimum disclosure of privacy, IHD warranty and customer education, ability to handle customer complaints /calls and ability to coordinate with distributors to enable services.
Section #7.3
December 2011 11
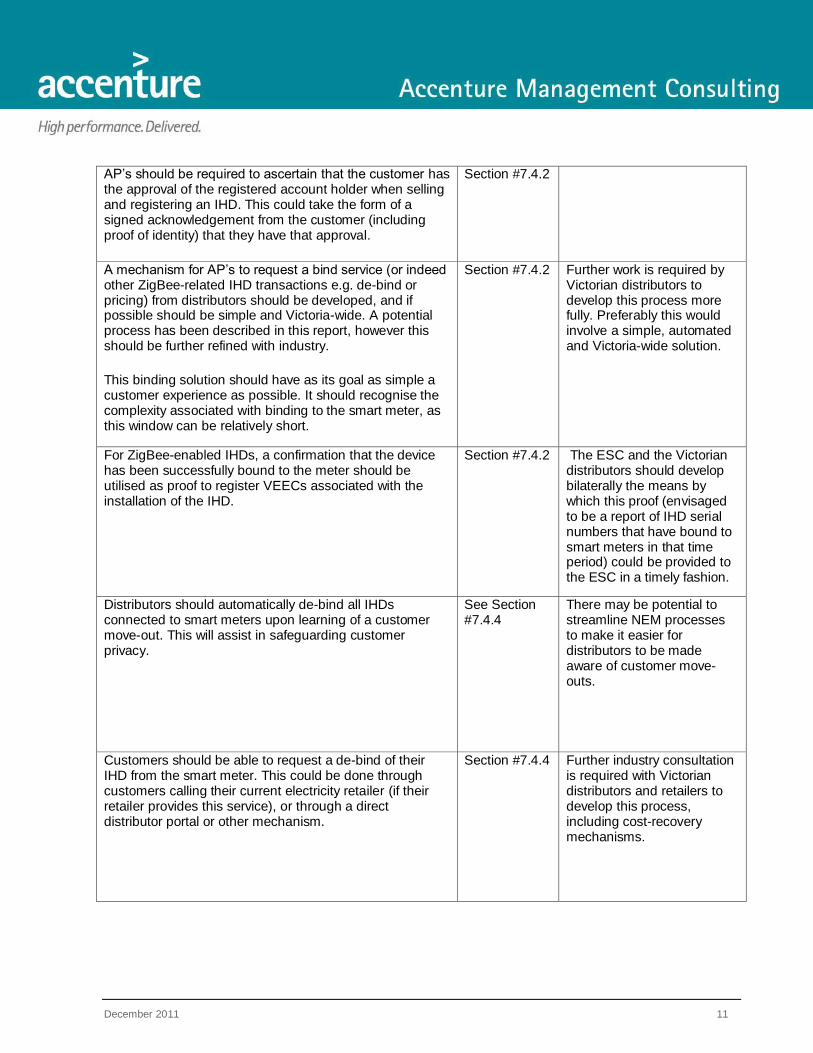
AP‘s should be required to ascertain that the customer has the approval of the registered account holder when selling and registering an IHD. This could take the form of a signed acknowledgement from the customer (including proof of identity) that they have that approval.
Section #7.4.2
A mechanism for AP‘s to request a bind service (or indeed other ZigBee-related IHD transactions e.g. de-bind or pricing) from distributors should be developed, and if possible should be simple and Victoria-wide. A potential process has been described in this report, however this should be further refined with industry.
This binding solution should have as its goal as simple a customer experience as possible. It should recognise the complexity associated with binding to the smart meter, as this window can be relatively short.
Section #7.4.2 Further work is required by Victorian distributors to develop this process more fully. Preferably this would involve a simple, automated and Victoria-wide solution.
For ZigBee-enabled IHDs, a confirmation that the device has been successfully bound to the meter should be utilised as proof to register VEECs associated with the installation of the IHD.
Section #7.4.2 The ESC and the Victorian distributors should develop bilaterally the means by which this proof (envisaged to be a report of IHD serial numbers that have bound to smart meters in that time period) could be provided to the ESC in a timely fashion.
Distributors should automatically de-bind all IHDs connected to smart meters upon learning of a customer move-out. This will assist in safeguarding customer privacy.
See Section #7.4.4
There may be potential to streamline NEM processes to make it easier for distributors to be made aware of customer move-outs.
Customers should be able to request a de-bind of their IHD from the smart meter. This could be done through customers calling their current electricity retailer (if their retailer provides this service), or through a direct distributor portal or other mechanism.
Section #7.4.4 Further industry consultation is required with Victorian distributors and retailers to develop this process, including cost-recovery mechanisms.
December 2011 12
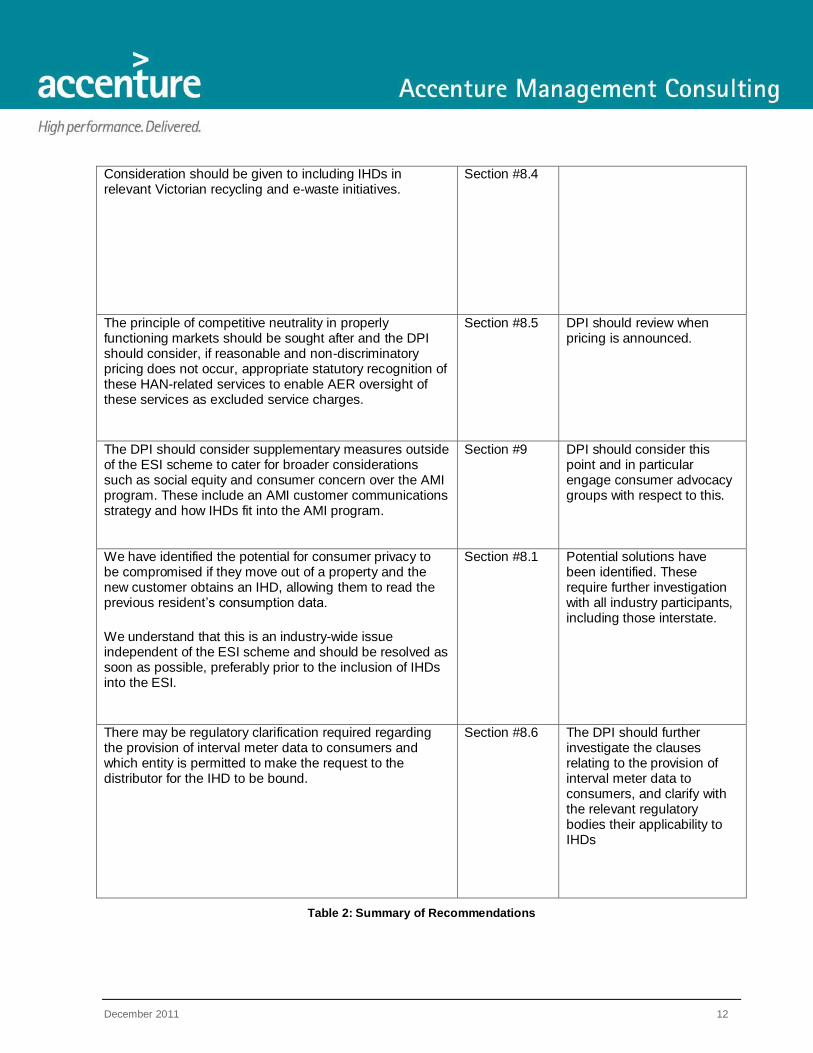
Consideration should be given to including IHDs in relevant Victorian recycling and e-waste initiatives.
Section #8.4
The principle of competitive neutrality in properly functioning markets should be sought after and the DPI should consider, if reasonable and non-discriminatory pricing does not occur, appropriate statutory recognition of these HAN-related services to enable AER oversight of these services as excluded service charges.
Section #8.5 DPI should review when pricing is announced.
The DPI should consider supplementary measures outside of the ESI scheme to cater for broader considerations such as social equity and consumer concern over the AMI program. These include an AMI customer communications strategy and how IHDs fit into the AMI program.
Section #9 DPI should consider this point and in particular engage consumer advocacy groups with respect to this.
We have identified the potential for consumer privacy to be compromised if they move out of a property and the new customer obtains an IHD, allowing them to read the previous resident‘s consumption data.
We understand that this is an industry-wide issue independent of the ESI scheme and should be resolved as soon as possible, preferably prior to the inclusion of IHDs into the ESI.
Section #8.1 Potential solutions have been identified. These require further investigation with all industry participants, including those interstate.
There may be regulatory clarification required regarding the provision of interval meter data to consumers and which entity is permitted to make the request to the distributor for the IHD to be bound.
Section #8.6 The DPI should further investigate the clauses relating to the provision of interval meter data to consumers, and clarify with the relevant regulatory bodies their applicability to IHDs
Table 2: Summary of Recommendations

December 2011 13
4 A Survey of IHDs and Their Impacts
This section defines In Home Displays (IHDs), places them within the broader context of Energy Feedback Mechanisms and Home Energy Management and details a segmentation of IHD product categories. We then introduce where IHDs have been deployed and how consumers have responded to the technology.
4.1 What is an In Home Display?
This report defines an In-Home Display (IHD) as any in-home feedback mechanism that provides whole of house energy consumption information in near real time and with historical comparisons, enabling a customer to better understand and manage their consumption of electricity.
4 IHDs ―turn the ―once opaque
and static electric bill into a transparent, dynamic and controllable process‖5 and have enabled consumers
to reduce their energy consumption and reduce their bills6. Generally IHDs have been received positively
where they have been trialled and provide an opportunity to offset customer dissatisfaction at a time of rising energy prices by providing consumers with more insight and control over their power usage.
However, despite the name In-Home Display a device does not technically need its own physical display in order to be considered an IHD. According to the definition in this report it may also interact with other devices with displays (such as a PC, smart-phone or television) to translate usage information from the household meter to actionable consumer behavioural change and actions.
The trials and pilots reviewed tested IHDs as well as other methods of educating the customer on their energy use. These various methods fall into the broad category of ‗feedback‘ on energy use. Forms of feedback tested in these trials range from enhanced bills and mail outs to real-time displays showing consumers accurate breakdowns of their consumption.
4.1.1 Energy Consumption Feedback
As illustrated in the below figure, IHDs are one of a number of technologies that provide energy consumption feedback to the customer. We have built on the work of EPRI
7 in categorising feedback
technologies from standard quarterly billing to full HAN control and disaggregated appliance feedback. We particularly differentiate between after consumption feedback and near real-time feedback
4 Initially, an IHD was defined as ―a device that is wireless, linked to a smart meter and displays feedback on energy use in the home,
including the cost of energy use‖ in the Request for Quotation: Including In Home Displays as a Prescribed Energy Saver Incentive
Scheme, August 2011, p. 7. Also we note that IHDs could potentially be used for gas or water as well as for electricity, however the
scope of this report is concerned only with IHDs which provide information on electricity use. 5 The Brattle Group, The Impact of Informational Feedback on Energy Consumption – A Survey of The Experimental Evidence, 2009,
p. 1. 6 Tammy Sakry, Energy Wise Pilot Project Helps Customers Discover Ways to Save, ABC Newspapers, January 2011, p.4.
7 Electric Power Research Institute, Residential Electricity Use Feedback: A Research Synthesis and Economic Framework, 2009.

December 2011 14
Figure 1: Types of Feedback Available to Consumers
4.1.2 Types of IHD
IHDs are an evolving group of technologies with a diverse range of features and specifications. Shown in Figure 2 below, we classify IHDs into product categories on the basis of three characteristics:
Type of Feedback (from basic Pricing alerts to robust analytical data)
Communications Technology (Communication interface between the user and the device)
Backhaul Technology (Communication between the device and the meter)
Figure 2: The Range of IHD Functionalities
StandardBilling
Enhanced BillingEstimated Feedback
Periodic Feedback
Near Real-Time IHD
Home AreaNetwork (HAN)
• Total consumption over billing period
• Detailedconsumption
• Social comparison
• Household specif ic advice
• Hourly, daily or weekly
• Based on consumption measurements
• Web based estimating tool
• Appliance usage estimates
• Energy Audits
• Aggregated whole house usage
• Easily accessible display
• Pricing signals
• Disaggregatedconsumption data
• Per appliance
• Includes control
Types of Feedback
Less timely & less precise feedback
After Consumption Feedback:The Customer only receives information af ter the use has occurred
Near Real-Time Feedback:The Customer receives information in closer
to real-time
More timely and granular
Functional Categories of Feedback
Co
mm
un
ica
tio
n
T
ec
hn
olo
gy
Qualitative Information Simple Feedback Robust Feedback &
Analysis
Rich Content &
Interrogatable
One-Way
Low Band-Width,
Simple Two-Way
High Band-Width ,
Robust Two-Way
Web Enabled
(WiFi with Dongle)
• Ambient device
• Shows peak price periods
• Real-time feedback
• Projects Bill
• Touch screen
• Hourly usage comparison• Threshold Alerts
• Rich real-time web-portal
• App on smart phone• Social media Interactive
• Detailed touch-screen
• Drill downs• Savings calculators
• Touch screen
• Numerical / visual data• Past Bill Comparison• Low-res display
• Historical data• Can upload data
• Simple LED display
• Shows current usage
Push
Pull
December 2011 15
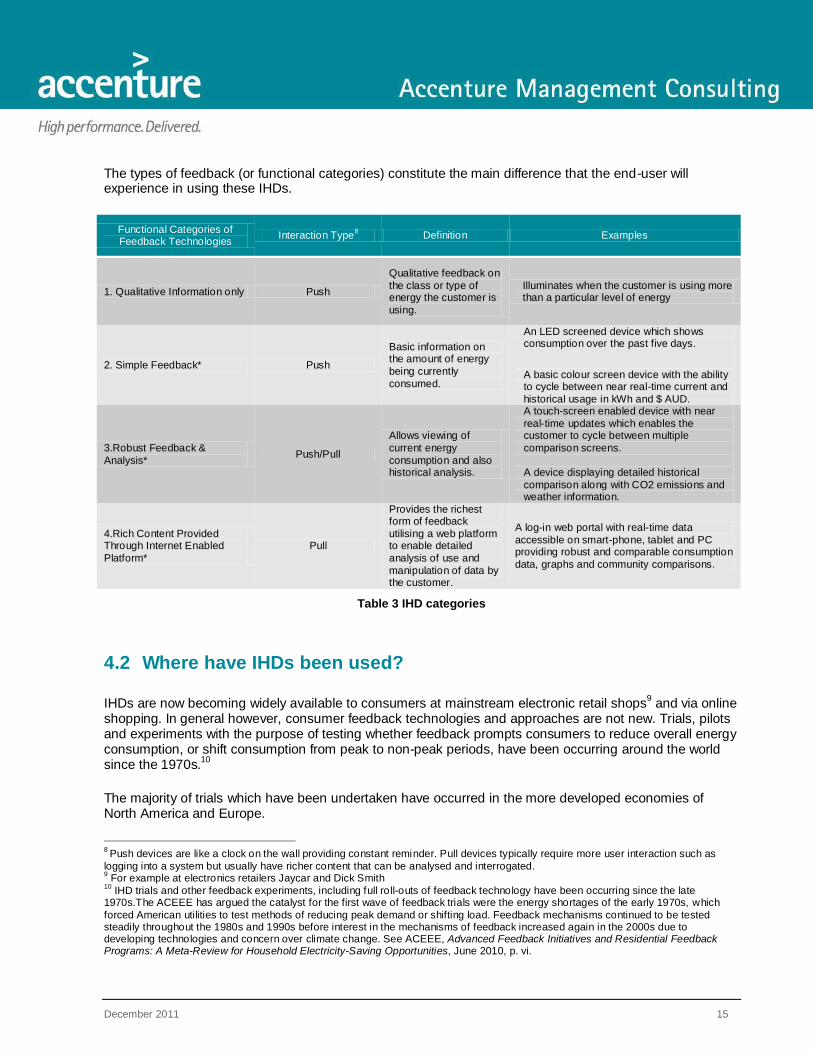
The types of feedback (or functional categories) constitute the main difference that the end-user will experience in using these IHDs.
Functional Categories of Feedback Technologies
Interaction Type8 Definition Examples
1. Qualitative Information only Push
Qualitative feedback on
the class or type of energy the customer is
using.
Illuminates when the customer is using more than a particular level of energy
2. Simple Feedback* Push
Basic information on the amount of energy
being currently
consumed.
An LED screened device which shows consumption over the past five days.
A basic colour screen device with the ability to cycle between near real-time current and
historical usage in kWh and $ AUD.
3.Robust Feedback &
Analysis* Push/Pull
Allows viewing of
current energy
consumption and also historical analysis.
A touch-screen enabled device with near
real-time updates which enables the customer to cycle between multiple
comparison screens.
A device displaying detailed historical
comparison along with CO2 emissions and weather information.
4.Rich Content Provided Through Internet Enabled
Platform*
Pull
Provides the richest form of feedback
utilising a web platform to enable detailed
analysis of use and
manipulation of data by the customer.
A log-in web portal with real-time data
accessible on smart-phone, tablet and PC providing robust and comparable consumption
data, graphs and community comparisons.
Table 3 IHD categories
4.2 Where have IHDs been used?
IHDs are now becoming widely available to consumers at mainstream electronic retail shops9 and via online
shopping. In general however, consumer feedback technologies and approaches are not new. Trials, pilots and experiments with the purpose of testing whether feedback prompts consumers to reduce overall energy consumption, or shift consumption from peak to non-peak periods, have been occurring around the world since the 1970s.
10
The majority of trials which have been undertaken have occurred in the more developed economies of North America and Europe.
8 Push devices are like a clock on the wall providing constant reminder. Pull devices typically require more user interaction such as
logging into a system but usually have richer content that can be analysed and interrogated. 9 For example at electronics retailers Jaycar and Dick Smith
10 IHD trials and other feedback experiments, including full roll-outs of feedback technology have been occurring since the late
1970s.The ACEEE has argued the catalyst for the first wave of feedback trials were the energy shortages of the early 1970s, which
forced American utilities to test methods of reducing peak demand or shifting load. Feedback mechanisms continued to be tested steadily throughout the 1980s and 1990s before interest in the mechanisms of feedback increased again in the 2000s due to developing technologies and concern over climate change. See ACEEE, Advanced Feedback Initiatives and Residential Feedback Programs: A Meta-Review for Household Electricity-Saving Opportunities, June 2010, p. vi.

December 2011 16
4.2.1 Global Trials
To develop a global picture of feedback initiatives, 76 trials, six sets of recommendations and five meta-studies have been analysed in this report.
11 These are summarised in Figure 3 below:
85% of the trials were concentrated in North America and Europe. The remaining trials were located in Australia (9%) and Asia (5%)
12.
Trial structure has varied substantially in terms of timing, duration and the number of participants.
A wide range of feedback types and mechanisms were trialled including real-time feedback, periodic feedback, real-time pricing indications and enhanced billing with richer information.
We acknowledge that this list of 76 feedback trials is by no means exhaustive. This desktop study incorporates results from the publically available pilots and trials that we were able to identify and access.
Figure 3: IHD and Feedback Activity Included in this Report
As can be seen in Table 4 below, trials have been mostly conducted in North America and Europe, with no published trial data lasting longer than 2.5 years.
11
Trials were included for analysis where information is publicly available. 12
Of the 76 trials reviewed, 60 have published and verified data on consumption reduction specifically, which is analysed in greater
detail in section 3.3. Some of the IHD and other feedback trials reviewed are ongoing and are yet to publish conclusive findi ngs and results, while others have concluded but have not published their results.
Total Trials: 12
Trials with Pub. Data: 11Trials of IHDs: 7
Canada
Total Trials: 7
Trials with Pub. Data: 2Trials of IHDs: 1
AustraliaTotal Trials: 40
Trials with Pub. Data: 32Trials of IHDs: 14
The United States
Total Trials: 13
Trials with Pub. Data: 13Trials of IHDs: 6
Europe & the UK
Total Trials: 4
Trials with Pub. Data: 3Trials of IHDs: 2
Japan & East Asia
<5 trials per country
5-10 trials per country
>10 trials per country
Key

December 2011 17
Region # of Trials
Earliest Trial Completed
Latest Trial Completed
Longest Completed Duration
Shortest Completed Duration
Highest # of Participants
in Trial
Lowest # of Participants
in Trial
Australia 7 1997 2012 18 months 4 Weeks 300 000
(projected) 113
Canada 12 1986 2009 2.5 Years 2 Months 30 000 60
Europe and the UK
13 1989 2010 2 Years 1 Month 125 000 44
Japan and East Asia
4 1998 2013 2 Years
(projected) 3 Months
1000 (projected)
9
The USA 40 1977 2011 2 Years 1 Month 85 000 20
All Trials: 76 1977 2011 2.5 years 4 weeks 300 000
(projected) 9
Table 4: IHD and Feedback Trials by Global Region
Mechanism Trialled
# of Trials
Earliest Trial Completed
Latest Trial Completed
Longest Completed Duration
Shortest Completed Duration
Highest # of Participants
in Trial
Lowest # of Participants
in Trial
Real-Time IHD or Web Feedback
47 1979 Ongoing 2.5 Years 4 Weeks 300 000
(projected) 4
Periodic Feedback
17 1999 Ongoing 1 Year 3 Months 981 29
Estimated Feedback
3 1999 2007 6 Months 3 Months 190 120
Enhanced Billing 9 1992 Ongoing 2 Years 8 Months 85 000 150
Table 5: Feedback Mechanisms Tested in Trials
4.2.2 Australian Trials
Seven Australian trials and rollouts identified during this investigation are summarised in Table 6. This list represent a sample of programs in Australia, it is not an exhaustive list of all feedback or IHD trials which have taken place in Australia. As mentioned earlier, many trials are not publically undertaken and do not publish data, this is the case in Australia as it is in the rest of the world.
December 2011 18
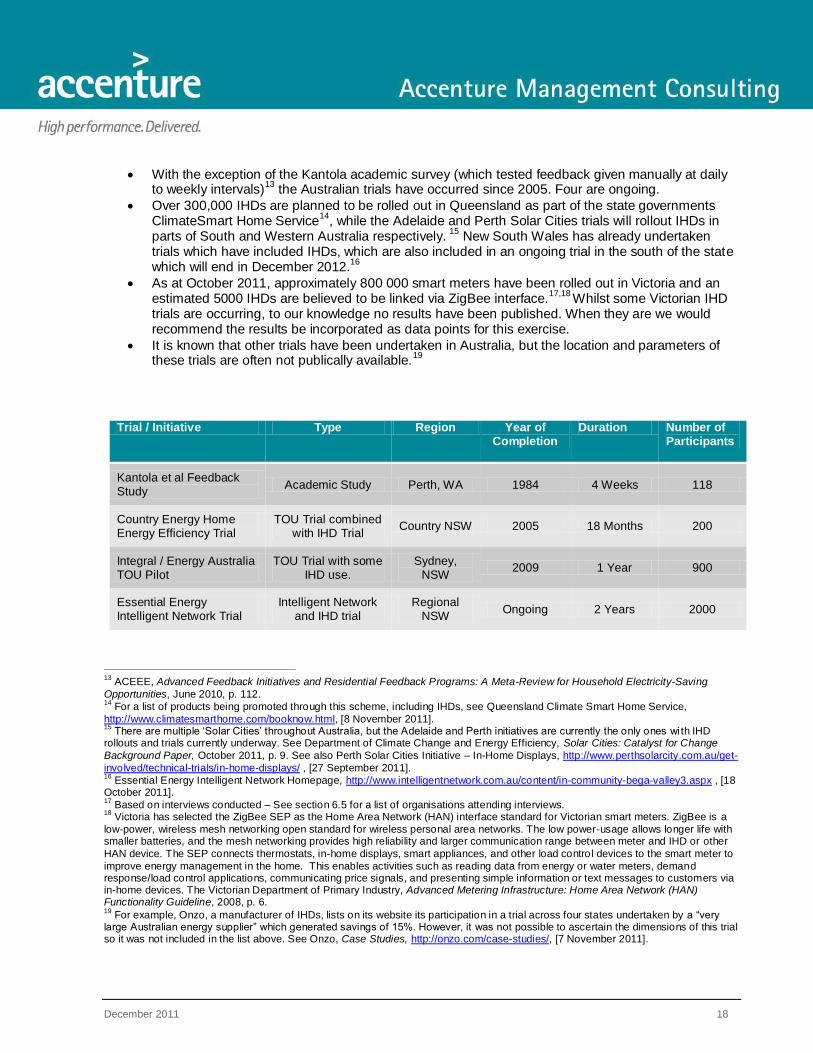
With the exception of the Kantola academic survey (which tested feedback given manually at daily to weekly intervals)
13 the Australian trials have occurred since 2005. Four are ongoing.
Over 300,000 IHDs are planned to be rolled out in Queensland as part of the state governments ClimateSmart Home Service
14, while the Adelaide and Perth Solar Cities trials will rollout IHDs in
parts of South and Western Australia respectively. 15
New South Wales has already undertaken trials which have included IHDs, which are also included in an ongoing trial in the south of the state which will end in December 2012.
16
As at October 2011, approximately 800 000 smart meters have been rolled out in Victoria and an estimated 5000 IHDs are believed to be linked via ZigBee interface.
17,18 Whilst some Victorian IHD
trials are occurring, to our knowledge no results have been published. When they are we would recommend the results be incorporated as data points for this exercise.
It is known that other trials have been undertaken in Australia, but the location and parameters of these trials are often not publically available.
19
Trial / Initiative Type Region Year of Completion
Duration Number of Participants
Kantola et al Feedback Study
Academic Study Perth, WA 1984 4 Weeks 118
Country Energy Home Energy Efficiency Trial
TOU Trial combined with IHD Trial
Country NSW 2005 18 Months 200
Integral / Energy Australia TOU Pilot
TOU Trial with some IHD use.
Sydney, NSW
2009 1 Year 900
Essential Energy Intelligent Network Trial
Intelligent Network and IHD trial
Regional NSW
Ongoing 2 Years 2000
13
ACEEE, Advanced Feedback Initiatives and Residential Feedback Programs: A Meta-Review for Household Electricity-Saving
Opportunities, June 2010, p. 112. 14
For a list of products being promoted through this scheme, including IHDs, see Queensland Climate Smart Home Service,
http://www.climatesmarthome.com/booknow.html, [8 November 2011]. 15
There are multiple ‗Solar Cities‘ throughout Australia, but the Adelaide and Perth initiatives are currently the only ones wi th IHD rollouts and trials currently underway. See Department of Climate Change and Energy Efficiency, Solar Cities: Catalyst for Change
Background Paper, October 2011, p. 9. See also Perth Solar Cities Initiative – In-Home Displays, http://www.perthsolarcity.com.au/get-
involved/technical-trials/in-home-displays/ , [27 September 2011]. 16
Essential Energy Intelligent Network Homepage, http://www.intelligentnetwork.com.au/content/in-community-bega-valley3.aspx , [18 October 2011]. 17
Based on interviews conducted – See section 6.5 for a list of organisations attending interviews. 18
Victoria has selected the ZigBee SEP as the Home Area Network (HAN) interface standard for Victorian smart meters. ZigBee is a
low-power, wireless mesh networking open standard for wireless personal area networks. The low power-usage allows longer life with smaller batteries, and the mesh networking provides high reliability and larger communication range between meter and IHD or other
HAN device. The SEP connects thermostats, in-home displays, smart appliances, and other load control devices to the smart meter to
improve energy management in the home. This enables activities such as reading data from energy or water meters, demand response/load control applications, communicating price signals, and presenting simple information or text messages to customers via in-home devices. The Victorian Department of Primary Industry, Advanced Metering Infrastructure: Home Area Network (HAN) Functionality Guideline, 2008, p. 6. 19
For example, Onzo, a manufacturer of IHDs, lists on its website its participation in a trial across four states undertaken by a ―very large Australian energy supplier‖ which generated savings of 15%. However, it was not possible to ascertain the dimensions of this trial so it was not included in the list above. See Onzo, Case Studies, http://onzo.com/case-studies/, [7 November 2011].

December 2011 19
Trial / Initiative Type Region Year of Completion
Duration Number of Participants
Climate Smart Home Initiative
Ongoing Rollout QLD Ongoing Indefinite 300 000
(projected)
Adelaide Solar City Initiative
Energy advisory, efficiency programs
and IHDs Adelaide, SA Ongoing Indefinite Unknown
Perth Solar City Initiative Energy advisory,
efficiency programs and IHDs
Perth, WA Ongoing 4 Years Unknown
Table 6: Australian Trials and Pilots

December 2011 20
4.3 How have Consumers Responded to Feedback?
The wide range of trial structures and objectives mean that generalised conclusions need to be treated with caution (the range of customer responses is as varied as the trials themselves). In addition, many trials tested other things such as dynamic pricing in addition to the consumption feedback. However, focusing on the impact of feedback on overall consumption,
20 seven key trends can be identified:
1. Consumers measurably reduce energy consumption in response to feedback; 2. IHDs do drive energy consumption reduction in isolation from other feedback types; 3. Opt-out trials lead to smaller energy consumption reductions than opt-in trials; 4. Dynamic pricing tends to drive load-shifting behaviour, whereas feedback drives overall reduction in
consumption 5. On-going education has a negligible effect on IHD users 6. When consumers were asked, they responded positively to IHDs;
21
7. Energy saving behaviour persists over time –this is especially the case with IHDs which appear to have a stimulating effect on consumers helping them to understand their consumption patterns and locking in new habits.
4.3.1 Consumers reduce energy consumption in response to feedback
As shown in Table 7, the 60 trials with published data showed that consumers reduced energy consumption in response to feedback:
The mean average energy consumption reduction was 7.9%.22
90% of trials recorded an energy saving. Only six trials out of 60 reported minimum customer consumption savings which were ‗statistically insignificant‘ or less than1%,
Consumption savings are most robust when the feedback provided is in real-time (see Figure 4 below).
As Figure 4 shows, real-time feedback through a dedicated display or web portal generated greater savings than trials which provided after consumption data through a device (i.e. data provided through a display or web portal on a delay or updating periodically such as once per hour), daily or weekly feedback
23 or
feedback by way of an enhanced bill.
20
The trials reviewed were often driven by energy utilities themselves and focussed on utility goals such as strategies for easing stress on power generators at peak times, or to shifting load so as to avoid expensive infrastructure upgrades (e.g. the stated aim of
Oklahoma Gas and Electric Co.‘s energy efficiency scheme, which included an IHD trial, was to eliminate the short term need to build two additional ‗peaker‘ power plants until at least 2020. See SilverSpring Networks / Oklahoma Gas and Electricity, Positive Energy
Together Results, 2011, p.1). Some trials were testing specific load variations as a result of peak time pricing and included IHDs only as an additional feature such as time-of-use pricing, see VaasaETT Empower, The Potential of Smart Meter Enabled Programs to
Increase Energy and Systems Efficiency: A Mass Pilot Comparison, 2011, p. 16-22). Some other trials were primarily concerned with
customer perceptions rather than consumption outcomes, see Centerpoint, 500 Unit In-Home Display Pilot – Mid Program Review,
March 2011). Given that the ESI scheme relates GHGs emitted to energy consumption we focus our description of consumer response
on overall level of consumption. 21
However the majority of trials reviewed (46 out of 60) were opt-in. 22
The standard deviation across all these trials was 4.8%. 23
Note studies prior to 2000 which tested personal feedback with a small number of residences are omitted from this number. Many
such studies generated energy consumption savings but did so in conjunction with personally delivered and tai lored tips on energy savings.

December 2011 21
Figure 4: Consumption Savings by Feedback Type
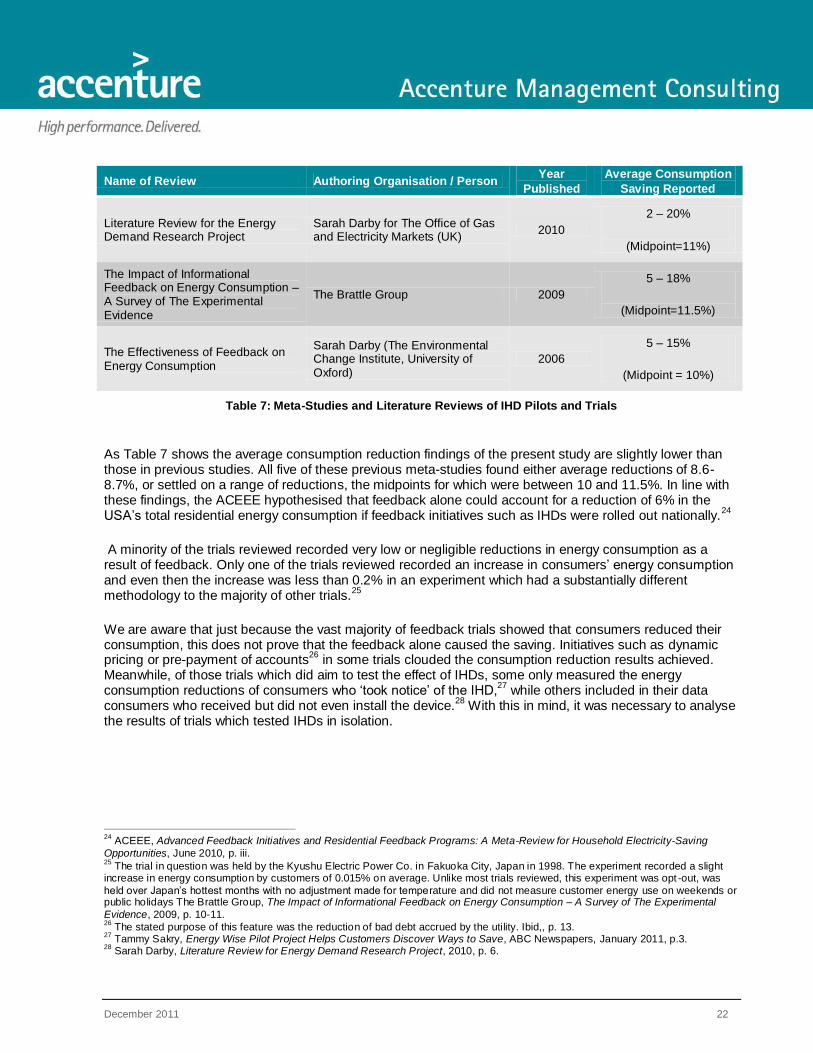
Overall, the results observed across all trials in this study are in line with existing meta-studies of trials. Table 7 shows five of the meta-studies reviewed along with the average consumption reduction they recorded in their reviews.
Name of Review Authoring Organisation / Person Year
Published
Average Consumption
Saving Reported
Present Study 2011 7.9%
Empower Demand: A Mass Pilot Comparison
VaasaETT 2011 8.7%
Advanced Feedback Initiatives and Residential Feedback Programs: A Meta-Review for Household Electricity-Saving Opportunities
The American Council for an Energy Efficient Economy (ACEEE)
2010 8.6%
Standard Billing Enhanced Billing Estimated Feedback Periodic Feedback Near Real-Time IHD ACEEE
% R
ed
uctio
n in
En
erg
y C
on
su
mp
tion
After Consumption Feedback Near Real-Time Feedback
Standard Billing Estimated
Feedback1
Periodic
Feedback2
1) These percentages were found by the ACEEE in a study of trials between 1995 and 2010. See ACEEE, Advanced Feedback Initiatives and Residential Feedback Programs: A Meta-Review for Household Electricity-Saving Opportunities, June 2010, p. iii.
2) Excludes trials where periodic feedback was provided in person as opposed to through a device.
‗Real-Time Plus‘
Feedback
Including HAN1
Near Real-Time
IHD
Enhanced Billing
4.8%
6.8% 6.3%
Not Applicable
12%
8.0%
December 2011 22
Name of Review Authoring Organisation / Person Year
Published
Average Consumption
Saving Reported
Literature Review for the Energy Demand Research Project
Sarah Darby for The Office of Gas and Electricity Markets (UK)
2010
2 – 20%
(Midpoint=11%)
The Impact of Informational Feedback on Energy Consumption – A Survey of The Experimental Evidence
The Brattle Group 2009
5 – 18%
(Midpoint=11.5%)
The Effectiveness of Feedback on Energy Consumption
Sarah Darby (The Environmental Change Institute, University of Oxford)
2006
5 – 15%
(Midpoint = 10%)
Table 7: Meta-Studies and Literature Reviews of IHD Pilots and Trials
As Table 7 shows the average consumption reduction findings of the present study are slightly lower than those in previous studies. All five of these previous meta-studies found either average reductions of 8.6-8.7%, or settled on a range of reductions, the midpoints for which were between 10 and 11.5%. In line with these findings, the ACEEE hypothesised that feedback alone could account for a reduction of 6% in the USA‘s total residential energy consumption if feedback initiatives such as IHDs were rolled out nationally.
24
A minority of the trials reviewed recorded very low or negligible reductions in energy consumption as a result of feedback. Only one of the trials reviewed recorded an increase in consumers‘ energy consumption and even then the increase was less than 0.2% in an experiment which had a substantially different methodology to the majority of other trials.
25
We are aware that just because the vast majority of feedback trials showed that consumers reduced their consumption, this does not prove that the feedback alone caused the saving. Initiatives such as dynamic pricing or pre-payment of accounts
26 in some trials clouded the consumption reduction results achieved.
Meanwhile, of those trials which did aim to test the effect of IHDs, some only measured the energy consumption reductions of consumers who ‗took notice‘ of the IHD,
27 while others included in their data
consumers who received but did not even install the device.28
With this in mind, it was necessary to analyse the results of trials which tested IHDs in isolation.
24
ACEEE, Advanced Feedback Initiatives and Residential Feedback Programs: A Meta-Review for Household Electricity-Saving
Opportunities, June 2010, p. iii. 25
The trial in question was held by the Kyushu Electric Power Co. in Fakuoka City, Japan in 1998. The experiment recorded a slight increase in energy consumption by customers of 0.015% on average. Unlike most trials reviewed, this experiment was opt -out, was
held over Japan‘s hottest months with no adjustment made for temperature and did not measure customer energy use on weekends or public holidays The Brattle Group, The Impact of Informational Feedback on Energy Consumption – A Survey of The Experimental
Evidence, 2009, p. 10-11. 26
The stated purpose of this feature was the reduction of bad debt accrued by the utility. Ibid,, p. 13. 27
Tammy Sakry, Energy Wise Pilot Project Helps Customers Discover Ways to Save, ABC Newspapers, January 2011, p.3. 28
Sarah Darby, Literature Review for Energy Demand Research Project, 2010, p. 6.
December 2011 23
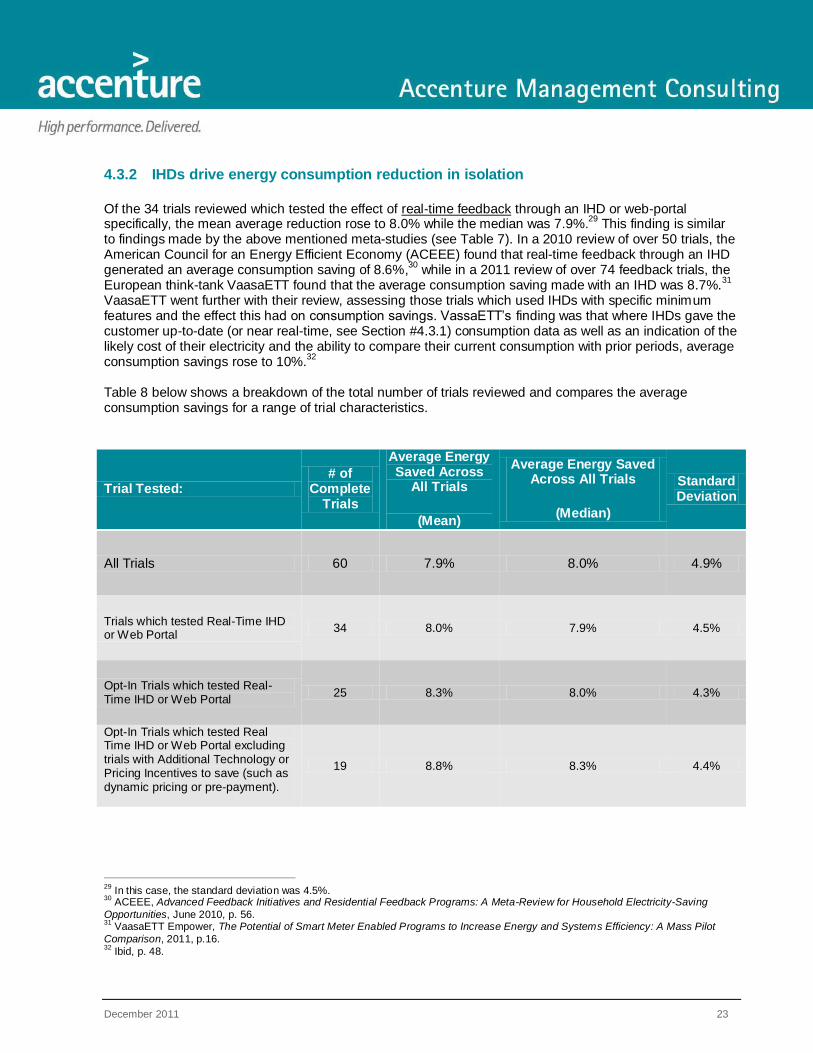
4.3.2 IHDs drive energy consumption reduction in isolation
Of the 34 trials reviewed which tested the effect of real-time feedback through an IHD or web-portal specifically, the mean average reduction rose to 8.0% while the median was 7.9%.
29 This finding is similar
to findings made by the above mentioned meta-studies (see Table 7). In a 2010 review of over 50 trials, the American Council for an Energy Efficient Economy (ACEEE) found that real-time feedback through an IHD generated an average consumption saving of 8.6%,
30 while in a 2011 review of over 74 feedback trials, the
European think-tank VaasaETT found that the average consumption saving made with an IHD was 8.7%.31
VaasaETT went further with their review, assessing those trials which used IHDs with specific minimum features and the effect this had on consumption savings. VassaETT‘s finding was that where IHDs gave the customer up-to-date (or near real-time, see Section #4.3.1) consumption data as well as an indication of the likely cost of their electricity and the ability to compare their current consumption with prior periods, average consumption savings rose to 10%.
32
Table 8 below shows a breakdown of the total number of trials reviewed and compares the average consumption savings for a range of trial characteristics.
Trial Tested: # of
Complete Trials
Average Energy Saved Across
All Trials
(Mean)
Average Energy Saved Across All Trials
(Median)
Standard Deviation
All Trials 60 7.9% 8.0% 4.9%
Trials which tested Real-Time IHD or Web Portal
34 8.0% 7.9% 4.5%
Opt-In Trials which tested Real-Time IHD or Web Portal
25 8.3% 8.0% 4.3%
Opt-In Trials which tested Real Time IHD or Web Portal excluding trials with Additional Technology or Pricing Incentives to save (such as dynamic pricing or pre-payment).
19 8.8% 8.3% 4.4%
29
In this case, the standard deviation was 4.5%. 30
ACEEE, Advanced Feedback Initiatives and Residential Feedback Programs: A Meta-Review for Household Electricity-Saving
Opportunities, June 2010, p. 56. 31
VaasaETT Empower, The Potential of Smart Meter Enabled Programs to Increase Energy and Systems Efficiency: A Mass Pilot
Comparison, 2011, p.16. 32
Ibid, p. 48.
December 2011 24
Trial Tested: # of
Complete Trials
Average Energy Saved Across
All Trials
(Mean)
Average Energy Saved Across All Trials
(Median)
Standard Deviation
Opt-In Trials which tested Real Time IHD or Web Portal Excluding Trials with Time-Of-Use Pricing Components and excluding trials in which consumers were reminded to use the device.
13
8.8% 8.0% 4.0%
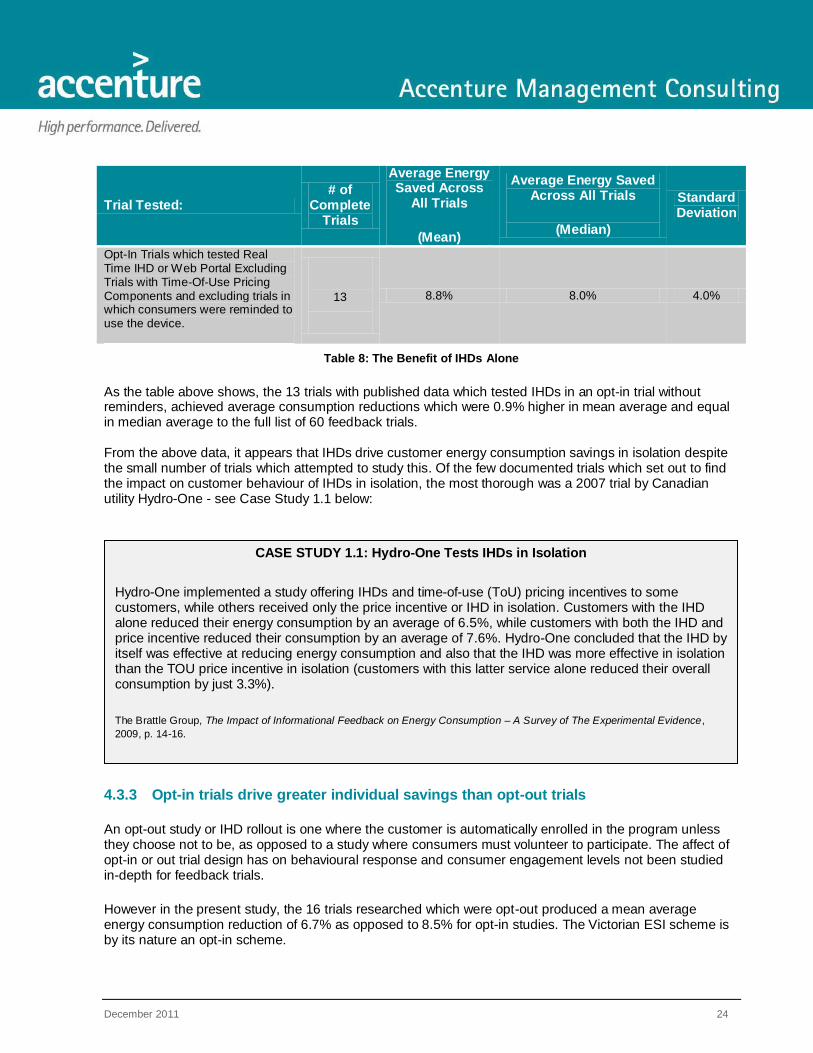
Table 8: The Benefit of IHDs Alone
As the table above shows, the 13 trials with published data which tested IHDs in an opt-in trial without reminders, achieved average consumption reductions which were 0.9% higher in mean average and equal in median average to the full list of 60 feedback trials. From the above data, it appears that IHDs drive customer energy consumption savings in isolation despite the small number of trials which attempted to study this. Of the few documented trials which set out to find the impact on customer behaviour of IHDs in isolation, the most thorough was a 2007 trial by Canadian utility Hydro-One - see Case Study 1.1 below:
4.3.3 Opt-in trials drive greater individual savings than opt-out trials
An opt-out study or IHD rollout is one where the customer is automatically enrolled in the program unless they choose not to be, as opposed to a study where consumers must volunteer to participate. The affect of opt-in or out trial design has on behavioural response and consumer engagement levels not been studied in-depth for feedback trials.
However in the present study, the 16 trials researched which were opt-out produced a mean average energy consumption reduction of 6.7% as opposed to 8.5% for opt-in studies. The Victorian ESI scheme is by its nature an opt-in scheme.
CASE STUDY 1.1: Hydro-One Tests IHDs in Isolation
Hydro-One implemented a study offering IHDs and time-of-use (ToU) pricing incentives to some customers, while others received only the price incentive or IHD in isolation. Customers with the IHD alone reduced their energy consumption by an average of 6.5%, while customers with both the IHD and price incentive reduced their consumption by an average of 7.6%. Hydro-One concluded that the IHD by itself was effective at reducing energy consumption and also that the IHD was more effective in isolation than the TOU price incentive in isolation (customers with this latter service alone reduced their overall consumption by just 3.3%).
The Brattle Group, The Impact of Informational Feedback on Energy Consumption – A Survey of The Experimental Evidence,
2009, p. 14-16.

December 2011 25
4.3.4 Dynamic Pricing tends to drive load-shifting behaviour, whereas feedback drives overall consumption reduction
Dynamic pricing is an incentive whereby customers are encouraged to flatten overall network load profile through price signals. One type of dynamic pricing, critical peak pricing, has been shown to be effective in reducing customer energy consumption by itself in some cases.
33 However meta-studies have noted
smaller overall consumption reductions as a result of dynamic ‗time-of-use‘ (ToU) pricing alone when compared with feedback by IHD alone
34 (see also Case Study 1.1). Trials reviewed by our research found
that those with ToU pricing drove smaller savings than those with an IHD alone.35
One possible explanation for this finding is that ToU pricing encourages customers to use less electricity during more expensive periods, but this is offset as they use more during cheaper periods (i.e. load shifting rather than load reduction is more prevalent). Results to this effect were observed in one US trial, when consumption during low-priced periods rose 5%.
36 It was also the stated aim of other ToU or other dynamic
pricing trials not to reduce consumption overall, but to reduce peak load,37
unlike IHD trials which have tended to aim for overall consumption reductions.
Although there is insufficient evidence to conclusively state that IHDs alone drive greater long term savings than ToU pricing alone, trials and pilots reviewed appear to show customers will save more energy with an IHD or other feedback mechanism alone rather than an IHD and dynamic pricing such as ToU.
4.3.5 Evidence suggests that on-going education has little or no additional effect on the behaviour of IHD users
Evidence was found that ongoing (as opposed to initial) education for recipients of IHDs appears to have negligible effect on the overall consumption reduction. This was in contrast to other feedback type trials, such as enhanced billing, which showed highly positive results from providing additional information to consumers throughout trials. The VaasaETT meta-study showed that trials which included ongoing education provided to IHD users drove the same consumption reduction as those trials which provided no ongoing education after the IHD was installed. It argued that this was due to customers learning of the IHD features effectively through testing the device themselves, rendering ongoing education unnecessary.
38
Of the trials reviewed in our research, those which trialled a near real-time IHD along with reminders and further education achieved an average consumption reduction which was 0.2% less than that achieved when near real–time IHDs were trialled without reminders or further education, as per the figure below:
39
33
VaasaETT Empower, The Potential of Smart Meter Enabled Programs to Increase Energy and Systems Efficiency: A Mass Pilot Comparison, 2011, p. 21. 34
Although the two were not directly compared, IHDs were attributed a consumption reduction of 8.6% while TOU pricing alone (i.e. without critical peak pricing) was attributed a consumption saving of 5%. See Ibid, p. 16, 21. 35
The average consumption reduction of all trials bar those with dynamic pricing was 8.3%, while the average consumption reduction of all trails with dynamic pricing was 6.7%. It should be remembered however that both of these categories of trials included many
other variables which may have had effect on customer behaviour. 36
The Brattle Group, BGE’s Smart Energy Pricing Pilot Summer 2008 Impact Evaluation, 2009, p. 21. 37
For example the stated aim of Oklahoma Gas and Electric Co.‘s energy efficiency scheme, which included an IHD trial , was to
eliminate the short term need to build two additional ‗peaker‘ power plants until at least 2020. See SilverSpring Networks / Oklahoma Gas and Electricity, Positive Energy Together Results, 2011, p.1 38
VaasaETT Empower, The Potential of Smart Meter Enabled Programs to Increase Energy and Systems Efficiency: A Mass Pilot Comparison, 2011, p. 38. 39
Included in these figures are those trials of near real-time IHDs which included reminders to use the device in the form of reminders of pricing periods (e.g. time of use pricing) but not those trials which required pre-payment of the electricity account.

December 2011 26
Figure 5: Compared Results of IHD Trials with and without Customer Education / Reminders
4.3.6 When consumers are asked, they respond positively to IHDs
All trials studied in this report where published data included a customer satisfaction survey returned net-positive responses to the introduction of an IHD and other feedback mechanism. The Brattle group undertook a study of several feedback trials up until and including 2009 and several reported very strong positive views from the consumers involved (this included qualitative feedback from the Country Energy trial in NSW
40). One study which conducted only a customer satisfaction survey found satisfaction levels
amongst US consumers surveyed averaging around 90% with the IHD itself and 98% for the utilities decision to provide the devices.
41 This trend is consistent with other individual studies (see Case Study 1.2
below) and global surveys of energy consumers undertaken by Accenture, which have found that customers want their utilities to take the initiative in helping them to drive consumption savings.
42
40
The Brattle Group, The Impact of Informational Feedback on Energy Consumption – A Survey of The Experimental Evidence, 2009,
p. 20. 41
Centerpoint, 500 Unit In-Home Display Pilot – Mid Program Review, March 2011, p. 28. 42
Accenture, The New Energy World – The Consumer Perspective, 2010, p. 13, 17.
0
1
2
3
4
5
6
7
IHDs Trialled in conjunction with Further Education / Reminders
IHDs Trialled without Further Education / Reminders
% R
ed
uctio
n in
En
erg
y C
on
su
mp
tion
Near Real-Time IHDs Trialled in
Conjunction with Further
Education / Reminders
Near Real-Time IHDs Trialled
without Further Education /
Reminders
7.6% 7.8%
December 2011 27
4.3.7 Energy saving behaviours appear to persist over time
Persistence of savings refers to the longer-term sustainability of energy consumption reduction. There is a lack of robust data on how long the customer behaviours which drive the energy savings last as no trial has tested this thoroughly for a period of more than two and half years
43. Meta studies which looked at the issue
of persistence show varied results for shorter trials44
but trials where customer behaviour was measured over a two year period tended to show that the consumption savings were largely maintained.
45 They also
showed that that persistence of behaviours does occur, even without reminders or interventions in some cases, and that in other cases, consumption savings actually grew over time.
46. The impact this may have
on our analysis for Victorian consumers is discussed further in Section #5.
43
G. Rossini, In-Home Real-Time Display, Customer Feedback from a 30,000 Unit Deployment, April 2009. 44
One Meta-review analysed 22 feedback studies to test for the persistence of the energy saving behaviours developed by customers and returned results of between 66 and 100% persistence as well as two occasions in which savings had increased. However these studies only tested persistence up to a year after the feedback trials ended. ACEEE, Advanced Feedback Initiatives and Residential Feedback Programs: A Meta-Review for Household Electricity-Saving Opportunities, June 2010, p. 88-89, 119-125 45
VaasaETT Empower, The Potential of Smart Meter Enabled Programs to Increase Energy and Systems Efficiency: A Mass Pilot Comparison, 2011, p. 64-65. 46
Although these findings were not conclusive and further research was called for. ACEEE, Advanced Feedback Initiatives and Residential Feedback Programs: A Meta-Review for Household Electricity-Saving Opportunities, June 2010, p. 88-89.
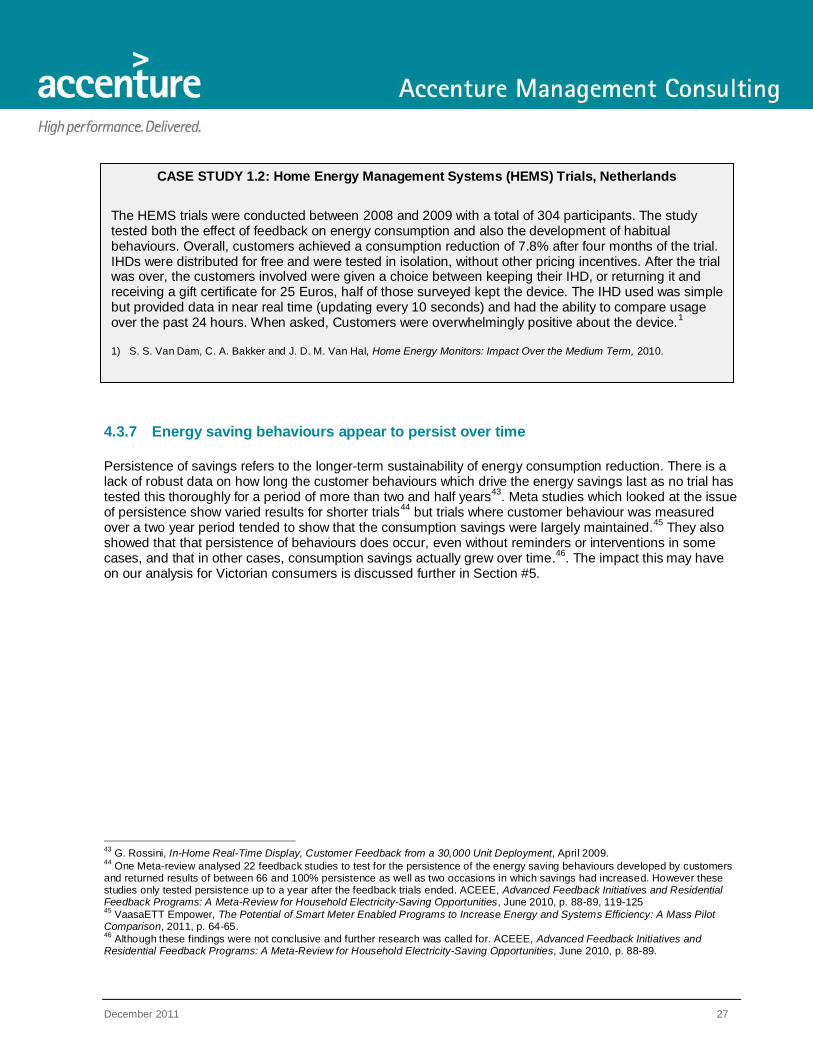
CASE STUDY 1.2: Home Energy Management Systems (HEMS) Trials, Netherlands
The HEMS trials were conducted between 2008 and 2009 with a total of 304 participants. The study tested both the effect of feedback on energy consumption and also the development of habitual behaviours. Overall, customers achieved a consumption reduction of 7.8% after four months of the trial. IHDs were distributed for free and were tested in isolation, without other pricing incentives. After the trial was over, the customers involved were given a choice between keeping their IHD, or returning it and receiving a gift certificate for 25 Euros, half of those surveyed kept the device. The IHD used was simple but provided data in near real time (updating every 10 seconds) and had the ability to compare usage over the past 24 hours. When asked, Customers were overwhelmingly positive about the device.
1
1) S. S. Van Dam, C. A. Bakker and J. D. M. Van Hal, Home Energy Monitors: Impact Over the Medium Term, 2010.

December 2011 28
4.3.8 Findings by region
Figure 6 below shows trial findings by region. Some key trends include the expansion of IHDs and other feedback capabilities into new markets, the consistently positive savings made by IHDs and, in the case of the UK CERT rollout in particular (see Case Study 1.3 for more detail), the lower estimated percentage saving when compared to Opt-In trials such as Hydro-One, and San Diego Gas and Electricity (SDG&E).
Figure 6: Summary of IHD Findings by Region
Ontario's Hydro One has been prolific in trialling feedback technology. In 2007 Hydro One attributed 6.5% of savings made in one trial to IHDs alone.
Hydro One 6.5%
A San Diego Utility found savings of 13% when feedback was used specifically to target high energy users.
SDG&E 13%
BC Hydro has run multiple trials, with the most recent IHD trial in 2008 recording a consumption saving of 8.6%.
BC Hydro 2.7%-8.6%
A meta-review of feedback studies completed in 2010 by the American Council for an Energy Efficient Economy recorded an average saving of 8.6% in feedback studies spanning 4 decades.
ACEEE 8.6%
Trials are now underway in a range of non-Euro/American Markets, with Singapore's HAN trial testing IHDs and home area network use by 1000 customers.
Singapore HAN Study
The UK‘s Carbon Emission Reduction Target believes that AMI and IHD rollouts will reduce energy consumption by a 3.5% flat rate for a period of 15 years.
CERT 3.5%
Although the Stavanger trials did not test IHDs, they recorded strong persistence, and even continued reduction, by customers who had reduced their consumption as a result of feedback over 2 years.
Stavanger Energi 8%
A trial in Kyushu in 1998 with an early model IHD showed no consumption reduction at all. In 2006 a Tokyo trial with an interactive web portal providing feedback showed a reduction of 12%.
Japan 0% - 12%
A 2005 NSW trial of IHDs showed a consumption reduction of 8%. Meanwhile the Ministerial Council on Energy has recommended that Australia can reduce energy consumption by 7% by using HAN capabilities along with IHDs
Australia 7%-8%
December 2011 29
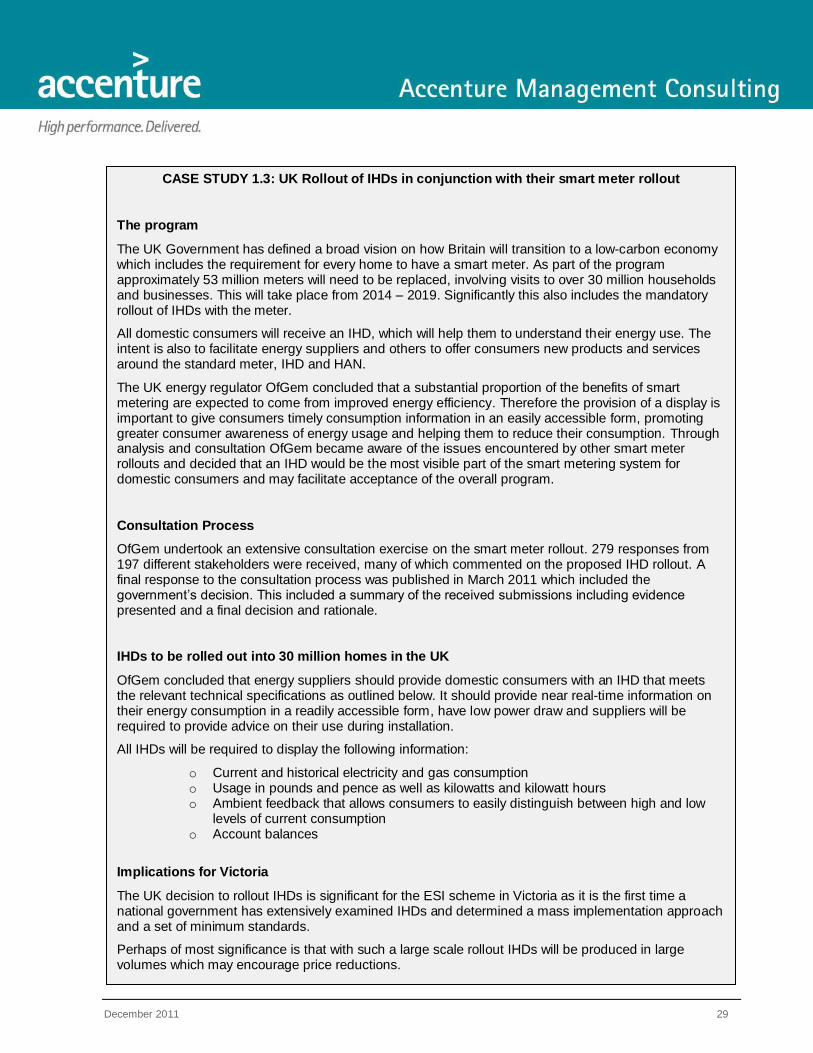
CASE STUDY 1.3: UK Rollout of IHDs in conjunction with their smart meter rollout
The program
The UK Government has defined a broad vision on how Britain will transition to a low-carbon economy which includes the requirement for every home to have a smart meter. As part of the program approximately 53 million meters will need to be replaced, involving visits to over 30 million households and businesses. This will take place from 2014 – 2019. Significantly this also includes the mandatory rollout of IHDs with the meter.
All domestic consumers will receive an IHD, which will help them to understand their energy use. The intent is also to facilitate energy suppliers and others to offer consumers new products and services around the standard meter, IHD and HAN.
The UK energy regulator OfGem concluded that a substantial proportion of the benefits of smart metering are expected to come from improved energy efficiency. Therefore the provision of a display is important to give consumers timely consumption information in an easily accessible form, promoting greater consumer awareness of energy usage and helping them to reduce their consumption. Through analysis and consultation OfGem became aware of the issues encountered by other smart meter rollouts and decided that an IHD would be the most visible part of the smart metering system for domestic consumers and may facilitate acceptance of the overall program.
Consultation Process
OfGem undertook an extensive consultation exercise on the smart meter rollout. 279 responses from 197 different stakeholders were received, many of which commented on the proposed IHD rollout. A final response to the consultation process was published in March 2011 which included the government‘s decision. This included a summary of the received submissions including evidence presented and a final decision and rationale.
IHDs to be rolled out into 30 million homes in the UK
OfGem concluded that energy suppliers should provide domestic consumers with an IHD that meets the relevant technical specifications as outlined below. It should provide near real-time information on their energy consumption in a readily accessible form, have low power draw and suppliers will be required to provide advice on their use during installation.
All IHDs will be required to display the following information:
o Current and historical electricity and gas consumption o Usage in pounds and pence as well as kilowatts and kilowatt hours o Ambient feedback that allows consumers to easily distinguish between high and low
levels of current consumption o Account balances
Implications for Victoria
The UK decision to rollout IHDs is significant for the ESI scheme in Victoria as it is the first time a national government has extensively examined IHDs and determined a mass implementation approach and a set of minimum standards.
Perhaps of most significance is that with such a large scale rollout IHDs will be produced in large volumes which may encourage price reductions.

December 2011 30
5 Calculating the Benefits of IHDs installed
Based on the calculations below, it is predicted that if IHDs were included under the ESI scheme, they could drive energy consumption savings of 6.6% for the average Victorian household, which translates to a VEEC value of between 1.83 and 2.57. Applying arithmetic rounding,
47 most IHD provision activities would
generate two VEECs (the exception is IHD installation in regional areas without access to reticulated gas, which generates three VEECs), which would lead to an incentive per IHD of 77% for a $50 IHD (see Table 10: Potential IHD Capabilities and Price at the end of this section).
To date there are approximately 800,000 smart meters deployed in Victoria.48
It is estimated that there are also about 5,000 IHDs deployed in Victoria
49. These have been installed in an ad-hoc fashion or through
private utility trials. There is no reliable public data available as to whether the devices meet the minimum standards set out in Section #6, or what consumption reduction behavioural change (if any) they have achieved with consumers to date.
5.1 Calculating the associated greenhouse gas abatement
This section describes the methodology employed to estimate the average greenhouse gas abatement created through the installation of an IHD that meets minimum specifications in a Victorian residential home. In a practical sense, this translates to the number of certificates (VEECs) to be allocated to an AP upon the completion of this activity.
The deeming methodology criteria employed for all ESI scheme activities are listed below, and are described fully in Appendix E
50. The following standard deeming methodology principles were used in
developing the GHG abatement associated with IHDs.
1) Simplicity 2) Utilise recognised and reliable data 3) Reputable: Certificates allocated for a particular activity provide a good estimate of the abatement
achieved for the average household in which the activity is undertaken 4) Justify additionality and address free rider effects 5) Incentivise innovation: Where appropriate and possible, certificate values should recognise higher
efficiency and greater capacity products 6) Support robust compliance and administrative simplicity 7) Responsive: The certificate creation methodology can accommodate changes to minimum energy
efficiency standards, as well as improvements in BAU levels of energy efficiency 8) Consistent
The deeming methodology rests on five building blocks representing the parameters for calculating the estimated greenhouse gas abatement. These are depicted in the Figure 7 below.
47
Arithmetic rounding is used by the DPI to calculate VEECs as only whole numbers of VEECs can be assigned. Thus 1.87 VEECs
becomes 2 VEECs and 2.47 VEECs also becomes 2 VEECs. 48
Based on the smart meter rollout schedule (note: it is likely that there are more than these rolled out as the rollout is continuing) 49
Based upon anecdotal evidence from distributors and industry experts. 50
Drawn from the Request for Quotation: ―Including In-Home-Displays as a prescribed Energy Saver Incentive activity‖, 29 July 2011

December 2011 31
Figure 7: Deeming Methodology Building Blocks
Each building block is described in the sections below:
5.1.1 The average reduction in household electricity consumption due to IHD
Percentage reduction in electricity consumption was used as a basis for calculating abatement as it is simple and is the most common measurement of IHD impact in trials globally. As GHG abatement for IHDs relies on a behavioural change from consumers (rather than providing this directly such as is achieved from light globes replacement activities) observed outcomes from global trials was assumed to provide the best indicator for possible savings.
The assumption was made that Victorian households would achieve similar results to the average consumption reduction across global trials after factoring in a scoring mechanism to determine those trials which had the most relevance to the Victorian context (see Figure 8 below).
We note that there are limitations in undertaking a time bound global literature review to assess behavioural changes from pilots and trials. Results from certain trials may not be published because they did not achieve the desired results or they may be commercial-in-confidence. Additionally we note the lack of substantial Australian trials in our list of global trials. However, while we acknowledge and disclose these inherent limitations we believe that there will always be the opportunity to update the input data from behavioural response trials and therefore update this value parameter. We recommend this should in fact be done as more trials are undertaken (particularly Australian or Victorian trials) and data published. Of special importance will be the Smart Grid Smart City demonstration project
51 in Newcastle, which will be
testing (amongst other things) basic and advanced IHDs across a sample set indicative of Australian households and in Australian conditions. This will begin in 2012 and initial results are expected in 2013.
The average expected electricity consumption reduction per household, for those trials most relevant to Victoria, was determined to be 6.6%.
51
Smart Grid Smart City is a federally funded demonstration project with results to be fully publically available.
December 2011 32
Process:
We used a conservative approach in analysing trial consumption savings being careful not to over-estimate likely consumption savings. Where a trial published a range of consumption savings, the midpoint was taken; where a trial listed consumption reduction as ‗statistically insignificant‘ but gave no numerical data, it was included in the review with a savings range of between 0.0% and 0.1%.
52
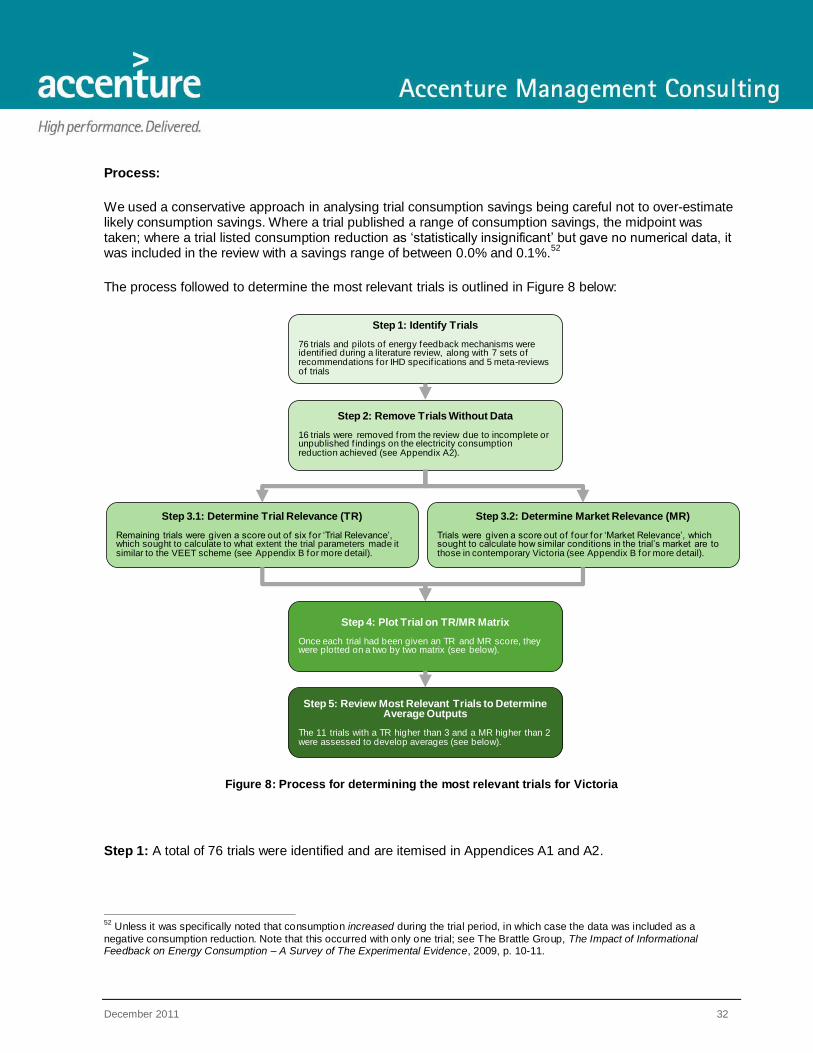
The process followed to determine the most relevant trials is outlined in Figure 8 below:
Figure 8: Process for determining the most relevant trials for Victoria
Step 1: A total of 76 trials were identified and are itemised in Appendices A1 and A2.
52
Unless it was specifically noted that consumption increased during the trial period, in which case the data was included as a
negative consumption reduction. Note that this occurred with only one trial; see The Brattle Group, The Impact of Informational Feedback on Energy Consumption – A Survey of The Experimental Evidence, 2009, p. 10-11.
Step 1: Identify Trials
76 trials and pilots of energy feedback mechanisms were identif ied during a literature review, along with 7 sets of recommendations for IHD specif ications and 5 meta-reviews of trials
Step 2: Remove Trials Without Data
16 trials were removed f rom the review due to incomplete or unpublished f indings on the electricity consumption reduction achieved (see Appendix A2).
Step 3.1: Determine Trial Relevance (TR)
Remaining trials were given a score out of six for ‗Trial Relevance‘, which sought to calculate to what extent the trial parameters made it similar to the VEET scheme (see Appendix B for more detail).
Step 3.2: Determine Market Relevance (MR)
Trials were given a score out of four for ‗Market Relevance‘, which sought to calculate how similar conditions in the trial‘s market are to those in contemporary Victoria (see Appendix B for more detail).
Step 4: Plot Trial on TR/MR Matrix
Once each trial had been given an TR and MR score, they were plotted on a two by two matrix (see below).
Step 5: Review Most Relevant Trials to Determine Average Outputs
The 11 trials with a TR higher than 3 and a MR higher than 2 were assessed to develop averages (see below).
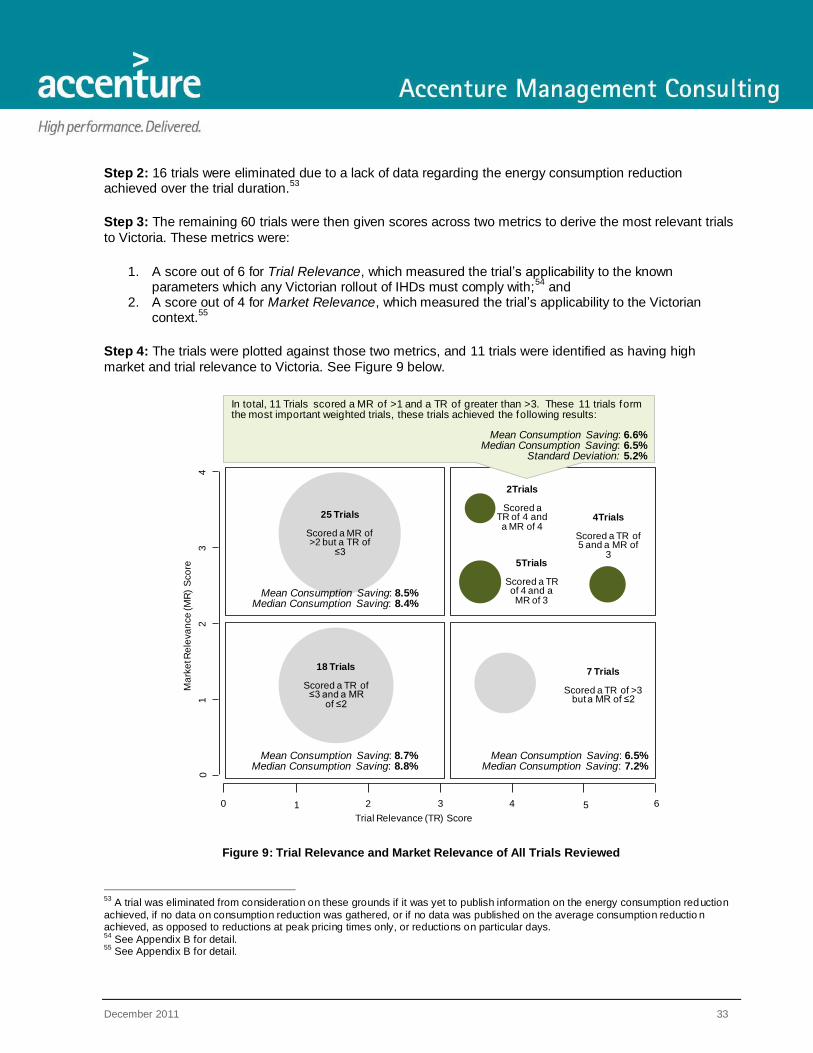
December 2011 33
Step 2: 16 trials were eliminated due to a lack of data regarding the energy consumption reduction achieved over the trial duration.
53
Step 3: The remaining 60 trials were then given scores across two metrics to derive the most relevant trials
to Victoria. These metrics were:
1. A score out of 6 for Trial Relevance, which measured the trial‘s applicability to the known parameters which any Victorian rollout of IHDs must comply with;
54 and
2. A score out of 4 for Market Relevance, which measured the trial‘s applicability to the Victorian context.
55
Step 4: The trials were plotted against those two metrics, and 11 trials were identified as having high
market and trial relevance to Victoria. See Figure 9 below.
Figure 9: Trial Relevance and Market Relevance of All Trials Reviewed
53
A trial was eliminated from consideration on these grounds if it was yet to publish information on the energy consumption reduction
achieved, if no data on consumption reduction was gathered, or if no data was published on the average consumption reductio n achieved, as opposed to reductions at peak pricing times only, or reductions on particular days. 54
See Appendix B for detail. 55
See Appendix B for detail.
1 64320 5
Trial Relevance (TR) Score
18 Trials
Scored a TR of ≤3 and a MR
of ≤2
25 Trials
Scored a MR of >2 but a TR of
≤3
In total, 11 Trials scored a MR of >1 and a TR of greater than >3. These 11 trials form the most important weighted trials, these trials achieved the following results:
Mean Consumption Saving: 6.6%Median Consumption Saving: 6.5%
Standard Deviation: 5.2%
5Trials
Scored a TR of 4 and a MR of 3
Mean Consumption Saving: 8.5%Median Consumption Saving: 8.4%
Mean Consumption Saving: 6.5%Median Consumption Saving: 7.2%
Mean Consumption Saving: 8.7%Median Consumption Saving: 8.8%
Ma
rke
t Re
leva
nce
(M
R)
Sco
re
01
23
4
7 Trials
Scored a TR of >3 but a MR of ≤2
2Trials
Scored a TR of 4 and a MR of 4
4Trials
Scored a TR of 5 and a MR of
3

December 2011 34
Step 5: The 11 most relevant trials for Victoria
The trials which had both high market relevant and trial characteristics relevance to Victoria were found to have an overall average of 6.6% consumption reduction. This average was the lowest of all the four quadrants of results, and so may represent a conservative figure.
The figure below shows the results of the 11 identified trials,56
also depicted are the results found in three of the meta-studies described in Section #4.3.1.
Figure 10: The Most Relevant Trial Results
The 11 trials identified have:
savings range of 0.2% to 18%
mean average saving of 6.6%
median average saving of 6.5%
standard deviation of 5.2%
56
This list is confined to relevant trials which had published and verified results at the time of this report‘s writing. Ongoing trials and trials with conflicting results were removed from consideration. See Appendices A1 and A2 for a list of trials reviewed.
8.6%
2.5%
2.7%
5.2%
6.5%
6.7%
7.8%
8.0%
13.0%
18.0%
University of Oxford Study 2006
ACEEE Study 2010
Vaasa ETT Empower Study 2011
Connecticut Light and Power 'Plan-it Wisely'
SMUD IHD Behaviour Change Pilot
BC Hydro Power Pilot
Massachusetts Feedback trial
Hydro One Power-Cost Monitor Deployment
Hydro One Real-Time Feedback Pilot
Hydro One Time-of-Use Pilot (IHD Only Pilot)
HEMS (Home Energy Management System) Trials
Country Energy Home Energy Efficiency Trial
SDG&E In-Home Display Program
Newfoundland Power Pilot
Reduction in Energy Consumption in Most Relevant Trials to Victoria
Tri
al R
evie
wed
1.9 – 3.0%
6.6%
(Average of
11 Trials)
Meta
-Stu
die
s
5.0 – 15.0%
6.0 – 10.0%
Low Range of Average Reduction
High Range of Reduction (if applicable)
Mean Average of All Trials
Key:
0.2%
Massachusetts Feedback Trial

December 2011 35
The results of three comprehensive meta-studies are also included in the Figure 10 above. These meta-studies found savings from the use of IHDs fell between 5% and 15% of energy consumption with the two more recent studies both finding that the average consumption saving in trials they reviewed was 8.6-8.7%.
57
It is important to note that Figure 10 represents a conservative view of the savings made in global trials. Many trials in which more robust savings were made were removed from consideration (see Figure 9 above). Some of those trials with low consumption savings which are represented in the 11, including Connecticut Light and Power‘s ‗Use-it-Wisely‘ trial and the Sacramento Municipal Utilities District (SMUD) IHD trial were opt-out as opposed to opt-in trials, which would have likely lowered the average savings they were able to make across all consumers. Meanwhile, the Massachusetts feedback trial listed above tested an IHD which encountered serious technical failures and defects, hampering its ability to drive customer savings and included in its numbers the 24% of customer who did not even install their IHD.
58
It is also important to note that the removal or addition of one or two trials to the 11 listed below has been shown to have little impact on the average result. During the consultation process for this report, trials have been added and removed from the above list based upon further data becoming available which impacts the score TR and MR score they achieved (see Step 3 in Process above), the result has been a minor fluctuation of the average consumption reduction between 6.4% and 6.7%.
59
5.1.2 Household electricity consumption
To obtain a reduction in electricity consumption in absolute terms the current household electricity consumption is required as well as the percentage reduction found above. We have used a State-wide average of residential electricity consumption, but differentiate between the average of households with access to reticulated gas and those without.
This decision was made whilst considering two competing factors:
The more targeted the household electricity consumption value the more greenhouse gas abatement could potentially be achieved
The more onerous and specific the compliance obligations the more costly the transaction costs of implementing and auditing the scheme
After discussion with stakeholders, we came to the conclusion that more detailed estimates which used, for example, house size or number of inhabitants could be difficult and potentially costly to audit compliance and could be therefore subject to rorting. In addition, analysis of household electricity consumption segmented by those factors showed a large spread of results, which would have made any such segmentation less useful.
57
ACEEE, Advanced Feedback Initiatives and Residential Feedback Programs: A Meta-Review for Household Electricity-Saving Opportunities, June 2010, p. 56; VaasaETT Empower, The Potential of Smart Meter Enabled Programs to Increase Energy and
Systems Efficiency: A Mass Pilot Comparison, 2011, p. 16. 58
Sarah Darby, Literature Review for Energy Demand Research Project, 2010, p. 13-14. 59
For example, some stakeholders consulted for the present report have reported hearing of conflicting results for the NSW Home Energy Efficiency Trial, which also included some ToU and peak pricing incentives. These results are yet to be confirmed, but their
fluctuation by the range suggested by stakeholders would result in only a 0.1-0.2% difference in the average consumption reduction calculated above in Figure 10.

December 2011 36
However there is a significant difference in average household electricity consumption between those with and without access to reticulated gas. This is a factor which already exists in the ESI scheme and is already audited by the ESC, implemented as a postcode lookup against the customer address.
The average household electricity consumption is therefore:
Victorian households without access to reticulated gas use on average 7,765 kWh per annum;
Victorian households with access to reticulated gas use on average 5,882 kWh per annum.60
5.1.3 Lifetime of greenhouse gas savings
The life-span of the GHG savings driven by an IHD is another key input for the aggregate greenhouse gas saving that this activity will generate. We have assumed a life-span of 5 years for IHD generated savings. We considered two key factors when arriving at this assumption:
1. The working life-span of an IHD and its component parts; and 2. The persistence of savings made by a customer using an IHD.
61
5.1.3.1 The working life-span of an IHD and its component parts
Determining the lifespan figure is a difficult exercise as:
IHDs are a fast developing technology with little reliable historical data on life-span.
Multiple factors will have an effect on the functional life-span of an IHD including its complexity, construction and frequency of use.
There is also a considerable range of devices which could be considered IHDs for our purposes, from a compact ZigBee compatible USB drive to advanced colour screen monitor.
Given this, to develop a defensible assumption we referenced Accounting standards for similar devices. Accounting standards have been utilised because they are impartial estimated guidelines to assist tax-payers in determining the likely useful lifetime and depreciating value of assets.
62
Presently, the ATO does not publish accounting life-spans for IHDs, but does publish standards on several components of IHDs.
The ATO is an independent assessor whose assessments have legal consequences, this makes accounting standards more impartial than warranty periods, which are calculated based on the cost benefit analyses‘ of manufacturers and retailers.
60
Annual electricity consumption (split by access to reticulated gas and no access to reticulated gas) was provided by DPI, derived from Department of Sustainability and Environment (2009) figures. See Department of Sustainability and Environment, Residential Electricity and Gas Use Data by Statistical Local Area 2004 – 2007, www.climatechange.vic.gov.au/energyuse , [11 November 2011]. 61
IHDs differ from other activities in the ESI scheme in that we must consider the behavioural change induced by the installation of the IHD in addition to the technical specifications of the device. 62
Australian Taxation Office, Taxation Ruling: Income Tax: Effective Life of Depreciating Assets (applicable from 1 July 2011), 2011, p.
1-2.

December 2011 37
Since a physical monitor-based IHD is made up of a screen, a set of buttons or touchpad, a battery or power source and a transmitter to communicate with the meter or binding device, we analysed the accounting standard life-spans of these various components.
The minimum standard life-spans of these components is 5 years, as it is for devices similar to the IHD
63.
We have taken this minimum as our assumed life-span for the entire IHD, as the IHD will only last as long as its weakest component.
64
To ―sense check‖ a lifetime of 5 years, we considered a number of other data points and came to the conclusion that 5 years represented a conservative device lifetime. The others, which are represented in Figure 11 below, were:
The expected minimum life-span of a smart meter, on which an IHD might rely, which is 15 years.65
The opinions of retailers and IHD manufacturers who placed an IHD‘s average functional life-span between 7 and 15 years.
The average lifespan of other appliances within the VEET scheme is 13.4 years.66
The fact that an IHD may have a similar life-span to a smart thermostat based on similar components: the consumer warranty for a smart thermostat is 3-5 years while the expected life-span is 7-10 years.
Figure 11: Evidence Considered in Developing IHD Lifespan Estimate
63
These included code pads (5 years), clocks and clock radio displays (5 years), batteries for transmitters (6 years) and two way
radios or transceivers (6.6 years). See Ibid, p. 134, 147, 160, 191. 64
this assumes that the IHD has been properly installed and the customer has been provided appropriate information and instruct ion
on its functionality and use 65
An external report for the Victorian AMI program used 15 years as the expected lifetime of the smart meters. Oakley Greenwood, Benefits and Costs of the Victorian AMI Program, August 2010. 66
This figure was obtained based on an analysis conducted by the Department of Primary Industry and Sustainability Victoria.
7 Years:Smart thermostat life-span
(device with similar components to an IHD)
1 2 3 4 5 6 7 8 9 10 11 12 13 14 15 16
Years
5 Years:ATO Accounting life-span for
component products
15 Years: Smart meter life-span
Estimated Life-span
13.4 Years: Average life-span of other appliances covered by VEET scheme
7 - 15 Years: IHD life-span range suggested by manufacturers and retailers

December 2011 38
5.1.3.2 The persistence of consumption reduction made by a customer using an IHD
Persistence of consumption reduction refers to whether the electricity consumption reductions continue over time. The duration of a saving made as a result of an IHD must consider both the lifetime of the device and the lifetime of the consumer behaviour driven by the device.
We found varied evidence on persistence of savings caused by IHDs or feedback generally during our literature review. One meta-study published in 2010 found evidence that, in longer trials, the levels of electricity saved by customers fell slightly, which the study attributed to longer studies capturing seasonal variation in electricity use.
67 A second study found that longer trials increased the level of savings made,
which it attributed to the customer gaining a better understanding of how to use the IHD over time.68
Hindering both of those studies as well as ours is the fact that there is no published data of IHD trials extending longer than 2.5 years.
69
While there are some trials which show a drop off in customer consumption savings over time,70
there are more trials which demonstrate persistence of savings over the trial duration
71 and past it.
72 In some cases
the consumption saving actually increased over time,73
while in others the consumption saving was consistent until the IHD or other feedback mechanisms was removed.
74
Based on the above, we determined that there was evidence that persistence over time broadly occurs, and that it was reasonable to assume consumption savings would persist for the duration of the 5 year device lifetime.
5.1.3.3 Additional life-span factors
We considered a number of other factors when arriving at the 5 year average life-span for an IHD. These included, but were not limited to:
The IHD is generally an indoor, low impact appliance - this was noted, but not considered as it would be equally possible to place portable IHD outdoors or place it next to a heat source etc. the effect such actions would have on the average life-span of IHDs across all types of Victorian consumers is very hard to quantify.
IHDs could be battery powered or mains powered, potentially impacting their life-span – this was noted but not included as one of the components considered in the analysis of accounting life-spans was a battery (see Section #5.1.3.1 above).
The customer could change retailers or tariff structures potentially reducing the useful lifetime of their IHD – this was noted but based on the minimum specifications and processes set out in
67
ACEEE, Advanced Feedback Initiatives and Residential Feedback Programs: A Meta-Review for Household Electricity-Saving Opportunities, June 2010, p. 54. 68
VaasaETT Empower, The Potential of Smart Meter Enabled Programs to Increase Energy and Systems Efficiency: A Mass Pilot Comparison, 2011, p. 28-29. 69
Though some Feedback trials have published data for longer periods, and have shown maintained savings. See ACEEE, Advanced
Feedback Initiatives and Residential Feedback Programs: A Meta-Review for Household Electricity-Saving Opportunities, June 2010,
p. 124. 70
S. S. Van Dam, C. A. Bakker and J. D. M. Van Hal, Home Energy Monitors: Impact Over the Medium Term, 2010, p. 465. 71
ACEEE, Advanced Feedback Initiatives and Residential Feedback Programs: A Meta-Review for Household Electricity-Saving
Opportunities, June 2010, p. 121. 72
Ibid, p. 123. 73
Ibid, p. 123-124. 74
Ibid, p. 54.
December 2011 39
Sections #6 and #7 respectively, an IHD should be able to change retailers or tariffs in order to meet ESI eligibility.
5.1.4 Additionality / Discount Factor
The discount factor deals with the problem of additionality, and refers to the discount to savings to be factored in as a result of business as usual uptake of IHDs (i.e. the number of IHDs which would have been purchased prior to, or outside the ESI scheme).
There are currently 800,000 smart meters deployed in Victoria, and it is estimated that currently around 5,000 IHDs are in use by Victorian consumers.
75 We recommend that no discount factor be applied,
given that:
There are a very small number of consumers currently believed to be using an IHD in Victoria (less than 1% of those with a smart meter)
There are currently no defined B2B or business to customer (B2C) procedures to facilitate easy adoption of IHDs
There is no commercial-scale roll-out of IHDs currently planned or in place in Victoria
On the basis of this it will be assumed that the predicted consumption reduction of 6.6% is not adjusted by household to allow for IHDs already in use.
However, we are aware of a number of potential developments which could change this status:
There are plans by industry to bundle IHDs with energy offers in the future.
Technology is changing rapidly in this area and a low marginal cost means of achieving the minimum specifications listed in this document could conceivably be achieved
As IHD production increases and economies of scale are reached (particularly as demand from other countries causes production to be ramped up), low cost IHDs will become easily available
We therefore recommend that the DPI watch these developments and be prepared to apply a discount factor as circumstances change. As the ESI scheme operates in 3-year phases, this provides an opportunity to review this factor before the next phase and adjust accordingly.
5.1.5 Greenhouse gas emissions factor for Victoria
This is a factor that is applied consistently across all activities in the ESI scheme, with separate greenhouse coefficients specified for electricity savings and gas savings. The average Victorian greenhouse coefficient for electricity savings is 0.963 kg/kWh, although due to the different distribution and transmission losses between Melbourne and Regional Victoria the coefficient applied to savings in Melbourne is 0.945
75
Anecdotal evidence received from distributors and industry experts.

December 2011 40
kg/kWh and for regional Victoria is 0.999 kg/kWh76
. In this study we have not made any adjustments to this factor and recommend it be taken as per all other activities in the ESI scheme.
5.2 VEECs generated and end-user cost of IHD
Based upon the assumptions laid out in Section #5.1, we calculated that the greenhouse gas abatement achieved over the lifetime of the IHD then gives the following results in VEECs:
Figure 12: GHG Abatement
This is calculated using the deeming methodology described above. A worked example of the calculation can be found in Appendix D.
When regional factors (0.98 for Melbourne and 1.04 for regional Victoria) are applied, this gives the following VEECs:
Access to reticulated gas No access to reticulated gas
Melbourne 1.83 2.42
Regional Victoria 1.94 2.57
As VEECs are rounded to the nearest whole number, this gives 3 VEECs for regional Victoria without access to reticulated gas, and 2 VEECs for all other combinations.
Table 9 below demonstrates how the number of VEECs generated by IHDs would change if the device lifetime or the % reduction electricity consumption is altered.
76
This is an estimated marginal greenhouse coefficient for electricity, which was estimated by NEM modelling prior to the commencement of the scheme. It is not the average greenhouse coefficient.
1.87
2.47
Access to Reticulated Gas No Access to Reticulated Gas
Tonnes of C02 Reduced = VEECs
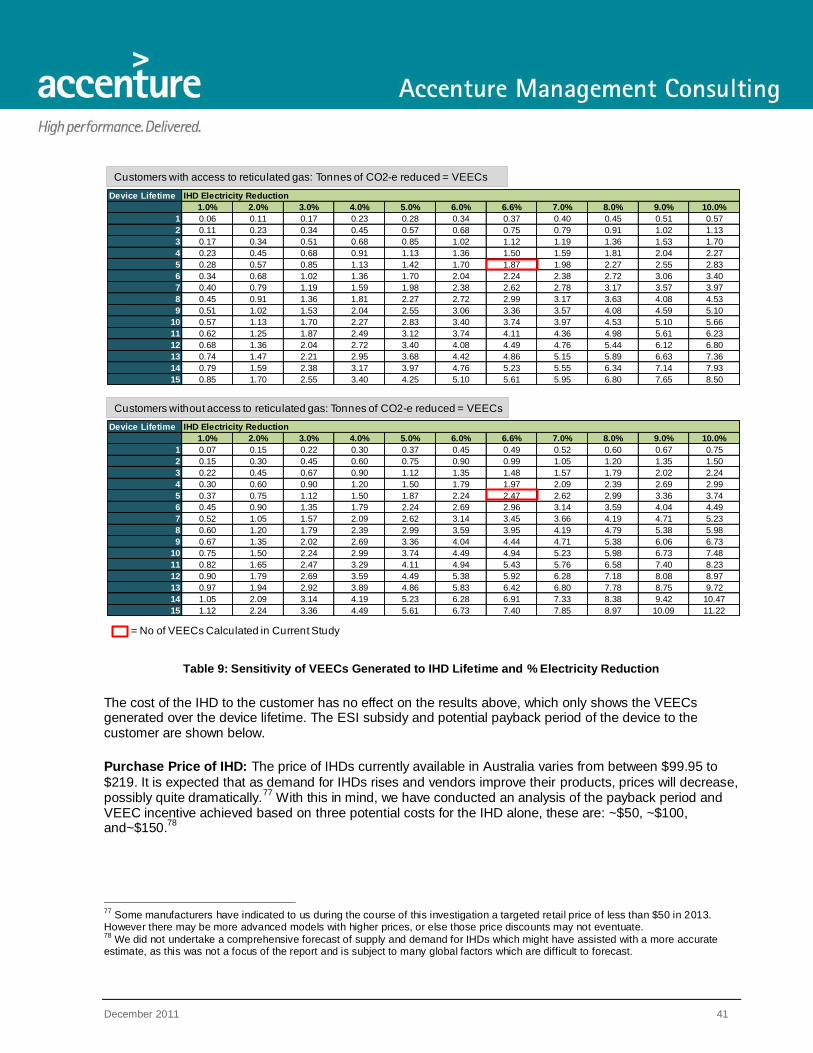
December 2011 41
Table 9: Sensitivity of VEECs Generated to IHD Lifetime and % Electricity Reduction
The cost of the IHD to the customer has no effect on the results above, which only shows the VEECs generated over the device lifetime. The ESI subsidy and potential payback period of the device to the customer are shown below.
Purchase Price of IHD: The price of IHDs currently available in Australia varies from between $99.95 to
$219. It is expected that as demand for IHDs rises and vendors improve their products, prices will decrease, possibly quite dramatically.
77 With this in mind, we have conducted an analysis of the payback period and
VEEC incentive achieved based on three potential costs for the IHD alone, these are: ~$50, ~$100, and~$150.
78
77
Some manufacturers have indicated to us during the course of this investigation a targeted retail price of less than $50 in 2013. However there may be more advanced models with higher prices, or else those price discounts may not eventuate. 78
We did not undertake a comprehensive forecast of supply and demand for IHDs which might have assisted with a more accurate estimate, as this was not a focus of the report and is subject to many global factors which are difficult to forecast.
Device Lifetime IHD Electricity Reduction
3.11 1.0% 2.0% 3.0% 4.0% 5.0% 6.0% 6.6% 7.0% 8.0% 9.0% 10.0%
1 0.07 0.15 0.22 0.30 0.37 0.45 0.49 0.52 0.60 0.67 0.75
2 0.15 0.30 0.45 0.60 0.75 0.90 0.99 1.05 1.20 1.35 1.50
3 0.22 0.45 0.67 0.90 1.12 1.35 1.48 1.57 1.79 2.02 2.24
4 0.30 0.60 0.90 1.20 1.50 1.79 1.97 2.09 2.39 2.69 2.99
5 0.37 0.75 1.12 1.50 1.87 2.24 2.47 2.62 2.99 3.36 3.74
6 0.45 0.90 1.35 1.79 2.24 2.69 2.96 3.14 3.59 4.04 4.49
7 0.52 1.05 1.57 2.09 2.62 3.14 3.45 3.66 4.19 4.71 5.23
8 0.60 1.20 1.79 2.39 2.99 3.59 3.95 4.19 4.79 5.38 5.98
9 0.67 1.35 2.02 2.69 3.36 4.04 4.44 4.71 5.38 6.06 6.73
10 0.75 1.50 2.24 2.99 3.74 4.49 4.94 5.23 5.98 6.73 7.48
11 0.82 1.65 2.47 3.29 4.11 4.94 5.43 5.76 6.58 7.40 8.23
12 0.90 1.79 2.69 3.59 4.49 5.38 5.92 6.28 7.18 8.08 8.97
13 0.97 1.94 2.92 3.89 4.86 5.83 6.42 6.80 7.78 8.75 9.72
14 1.05 2.09 3.14 4.19 5.23 6.28 6.91 7.33 8.38 9.42 10.47
15 1.12 2.24 3.36 4.49 5.61 6.73 7.40 7.85 8.97 10.09 11.22
Device Lifetime IHD Electricity Reduction
2.14 1.0% 2.0% 3.0% 4.0% 5.0% 6.0% 6.6% 7.0% 8.0% 9.0% 10.0%
1 0.06 0.11 0.17 0.23 0.28 0.34 0.37 0.40 0.45 0.51 0.57
2 0.11 0.23 0.34 0.45 0.57 0.68 0.75 0.79 0.91 1.02 1.13
3 0.17 0.34 0.51 0.68 0.85 1.02 1.12 1.19 1.36 1.53 1.70
4 0.23 0.45 0.68 0.91 1.13 1.36 1.50 1.59 1.81 2.04 2.27
5 0.28 0.57 0.85 1.13 1.42 1.70 1.87 1.98 2.27 2.55 2.83
6 0.34 0.68 1.02 1.36 1.70 2.04 2.24 2.38 2.72 3.06 3.40
7 0.40 0.79 1.19 1.59 1.98 2.38 2.62 2.78 3.17 3.57 3.97
8 0.45 0.91 1.36 1.81 2.27 2.72 2.99 3.17 3.63 4.08 4.53
9 0.51 1.02 1.53 2.04 2.55 3.06 3.36 3.57 4.08 4.59 5.10
10 0.57 1.13 1.70 2.27 2.83 3.40 3.74 3.97 4.53 5.10 5.66
11 0.62 1.25 1.87 2.49 3.12 3.74 4.11 4.36 4.98 5.61 6.23
12 0.68 1.36 2.04 2.72 3.40 4.08 4.49 4.76 5.44 6.12 6.80
13 0.74 1.47 2.21 2.95 3.68 4.42 4.86 5.15 5.89 6.63 7.36
14 0.79 1.59 2.38 3.17 3.97 4.76 5.23 5.55 6.34 7.14 7.93
15 0.85 1.70 2.55 3.40 4.25 5.10 5.61 5.95 6.80 7.65 8.50
Customers with access to reticulated gas: Tonnes of CO2-e reduced = VEECs
Customers without access to reticulated gas: Tonnes of CO2-e reduced = VEECs
= No of VEECs Calculated in Current Study

December 2011 42
Installation Price of IHD: For our analysis, an installation price of $3079
per IHD has been used. This covers the likely distributor costs of binding the IHD to the smart meter, the sales costs of reaching the customer, and potentially the installation costs if an AP was to do doorknock sales and install the IHD for the customer. We have also analysed a ―high‖ option of $80 for the installation cost.
Other Costs
Other industry costs have not been quantified in this report but may include:
Retailer cost of customer enquiries related to IHD. This is expected to be highest immediately after a customer purchases an IHD, or where price variations and tariff changes occur
Ongoing cost of IHD maintenance
The table below shows a breakdown of the potential IHD functionality which may be available for each of the costs mentioned above. Note that this table, while referring to real products, is indicative only, these products are not currently available for the below prices and market condition in Australia may not enable the sale of these or like products at the following prices in the future.
Table 10: Potential IHD Capabilities and Price
79
We were unable to obtain costings from industry, however have made assumptions based on similar functions – for example the
bind function is likely similar to remote re-energisations, and online sales are likely similar as for other (small) consumer devices. In submissions, retailers indicated that this price was likely too low. Hence we have included an estimate of an $80 installation fee.
Approx. Item
Cost of IHD
Total IHD Cost
(including $30
Installation fee)
Example in the Present Global Market
(Indicative of potential cost only – not current cost in Australian market)
$50 $80
ComVerge IntelliFocus
• Displays kWh and indicative $ cost
• Operated by rechargeable batteries
• LED indicator lights for peak use
• ZigBee certified
Source:
http://www.comverge.com/Comverge/media/pdf/Fact%20Sheet/Comverge_IntelliF
OCUS.pdf
$100 $130
ENVR Energy Monitor
• Real-time consumption feedback
• Allows comparison with prior period
• Data downloadable to PC
• Shows current temperature
• Reads consumption through clamp on mains
Source:
http://aussiehomeenergy.com.au/html/monitors.html
$150+
$180+
(or $230+ with
an $80
installation fee)
Intellergy In-Touch
• Large colour touch-screen monitor
• Ambient graphical display
• Detailed historical comparison enabled
• Able to access limited online content
• ZigBee certified
Source:
http://www.intellergy.net/products.php

December 2011 43
Table 11 below shows the indicative ESI incentive (as a % of the total price) for each of the costs listed above. The values in Table 11 are based upon the assumptions laid out in Section #5.1 and a $35 certificate value. In keeping with the DPI approach, the number of VEECs generated by both homes with gas access and those without has been arithmetically rounded,
80 resulting in a flat number of two VEECs
generated per IHD:
Table 11: Incentive against IHD Cost
80
Numbers of VEECs generated are rounded arithmetically as only whole numbers of VEECs can be conferred. See section 5.0.
Total IHD Cost (including Installation fee)
Incentive Generated by VEECs as a % of Total IHD Cost(Assumes 2 VEECs per IHD @ $35 per VEEC, a $1 ESC fee and 10%
administrative overheads)
$80 77%
$130 47%
$180 34%
$230 27%
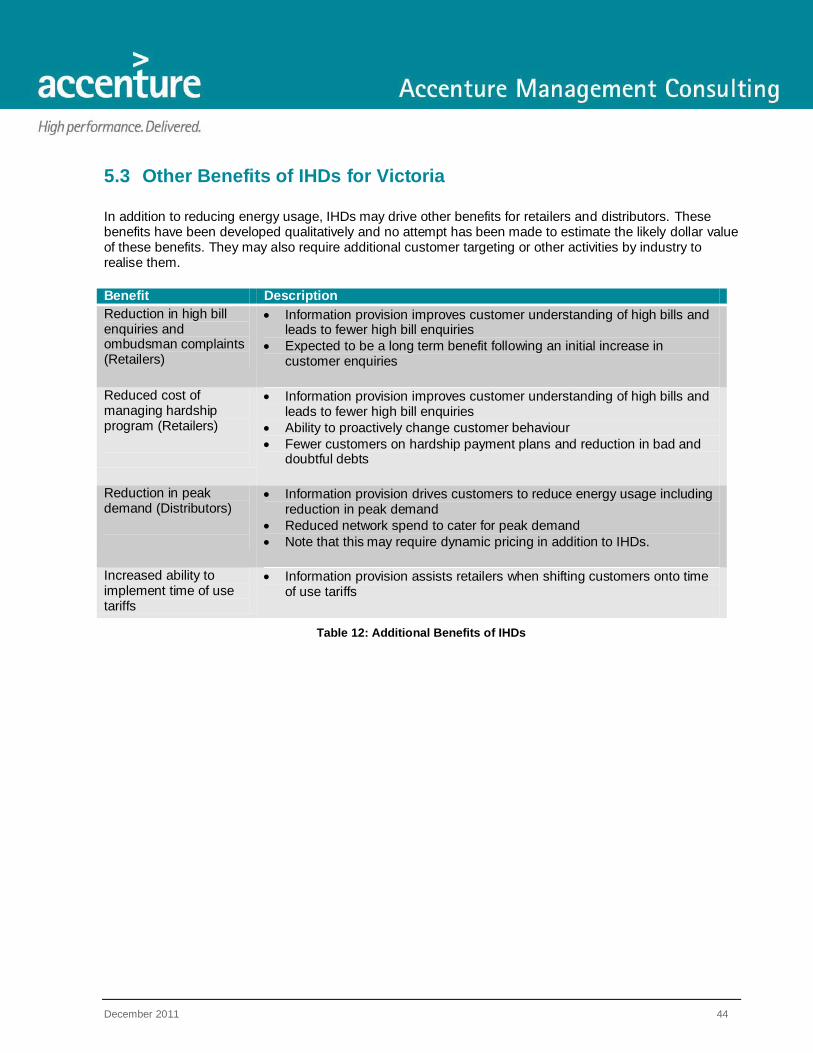
December 2011 44
5.3 Other Benefits of IHDs for Victoria
In addition to reducing energy usage, IHDs may drive other benefits for retailers and distributors. These benefits have been developed qualitatively and no attempt has been made to estimate the likely dollar value of these benefits. They may also require additional customer targeting or other activities by industry to realise them.
Benefit Description
Reduction in high bill enquiries and ombudsman complaints (Retailers)
Information provision improves customer understanding of high bills and leads to fewer high bill enquiries
Expected to be a long term benefit following an initial increase in customer enquiries
Reduced cost of managing hardship program (Retailers)
Information provision improves customer understanding of high bills and leads to fewer high bill enquiries
Ability to proactively change customer behaviour
Fewer customers on hardship payment plans and reduction in bad and doubtful debts
Reduction in peak demand (Distributors)
Information provision drives customers to reduce energy usage including reduction in peak demand
Reduced network spend to cater for peak demand
Note that this may require dynamic pricing in addition to IHDs.
Increased ability to implement time of use tariffs
Information provision assists retailers when shifting customers onto time of use tariffs
Table 12: Additional Benefits of IHDs

December 2011 45
6 IHD Minimum Features
In this section, we consider the minimum features which an IHD should have in order to encourage consumer behavioural change and therefore obtain the expected greenhouse gas savings. We then determine the specifications required to meet those minimum features.
This feature set was developed after discussions with stakeholders and an analysis of the features of global pilots and trials that enabled consumer behavioural change. As discussed above these global pilots and trials have had diverse aims and requirements. This makes it difficult to isolate the impact of particular IHD feature sets on consumer behaviour.
However there were several overarching themes and principles that can be used81
in assessing the minimum feature set:
Greenhouse gas abatement – features that have been shown to enable consumer behavioural
change have been considered favourably
Consumer protection –reasonable precautions should be considered against undesired outcomes
(e.g. compromising consumer privacy) which may put consumers at risk and reflect poorly upon the scheme.
Technology-agnostic –technology is changing rapidly in the area of energy feedback - innovation is expected and should be encouraged. It is expected that the market will respond to consumer demand and that devices not originally envisaged now will later become eligible under these minimum features.
Minimum features only – niche players and some consumer segments are likely to desire
additional features to those specified below. Suppliers are likely to compete on the basis of value-added services and features offered. The features described as part of the minimum specification do not impede additional services from being offered and also qualifying for VEECs under the ESI scheme.
Best value for consumers –minimum features should only be included if they would not be unduly
costly for suppliers. In particular, the UK rollout of IHDs is an opportunity for some price reductions and so benefits could be gained for Victorian consumers if UK IHDs are also ESI-applicable.
81
Informed by the UK regulator OfGem, which defined a minimum feature set for IHDs in their mandatory rollout.

December 2011 46
6.1 Minimum Features Required
The following nine features were included as the minimum feature set for the ESI scheme.
ID: Features Description
MF1 Near Real-Time Feedback Energy feedback should be shown in near real-time
MF2 Historical Usage Data Must be able to show historical energy consumption data, and enable the customer to compare this to current data.
MF3 Indicative Cost Data Must be able to demonstrate an indicative cost of energy used to give the customer context around their consumption.
MF4 Numerical & Non-Numerical Display
Must include a visual, non-numerical display which allows a consumer to easily distinguish between low and high current consumption
MF5 Data Security Must have security in place to protect customer data
MF6 Minimum Accuracy Level Must present consumption information which is accurate
MF7 Maximum Power Draw Must use no more than 0.6W of power on average in order to power itself
MF8 Ability to erase data Consumption data must be able to be erased by the user from the IHD memory
MF9 Battery does not require replacement over estimated life
If a battery is required for operation of the IHD, it should not require replacement prior to the estimated lifetime of the IHD (namely, 5 years)
Table 13: Minimum Features of IHDs
The following describes the rationale for inclusion of each minimum feature:
MF1. Near Real-Time Feedback
Hypothesis: Consumers reduce their energy consumption more if they are presented with near real-time
energy consumption feedback.
Evidence: Published findings indicate that near real-time feedback can drive savings which are 4% greater
than those driven by feedback which is delivered after the fact.82
Surveys have also found that consumers prefer close to real-time feedback and feel that it better enables them to manage and reduce their energy consumption.
83
82
ACEEE, Advanced Feedback Initiatives and Residential Feedback Programs: A Meta-Review for Household Electricity-Saving
Opportunities, June 2010, p. iv. See also VaasaETT Empower, The Potential of Smart Meter Enabled Programs to Increase Energy and Systems Efficiency: A Mass Pilot Comparison, 2011, p. 48, 68. 83
The Brattle Group, The Impact of Informational Feedback on Energy Consumption – A Survey of The Experimental Evidence, 2009,
p. 16 found that 63% of customers surveyed agreed that real-time feedback better enabled them to reduce energy consumption.

December 2011 47
MF2. Capable of Displaying Historical Usage Data
Hypothesis: Consumers will be better able to understand their electricity usage if they can contextualise
their current usage against what they have used over time.
Evidence: One meta-study found savings of 10.4% in IHD trials which allowed consumers to compare their
usage historically, as opposed to 6.8% in trials which did not.84
Customer focus groups held within the UK demonstrated this was a capability which consumers saw as valuable and one they felt would assist them in reducing their energy consumption.
85
MF3. Display Indicative Cost of Energy Being Consumed
Hypothesis: Consumers can better understand and relate to (and hence respond to) indicative cost rather
than energy consumption.
Evidence: Saving money was the single most common reason that consumers opted-in to global trials of
IHDs.86
Trials which utilised feedback mechanisms capable of displaying a currency value via an IHD have seen higher savings than trials which did not display this data.
87 It has been shown that cost information was
most effective when it allowed the customer to view the indicative cost since their last bill.88
MF4. Display of Usage Data in a visual, non-numerical form
Hypothesis: Consumers will take more notice of the IHD if they can assess their consumption easily and in
a visual rather than just numerical form – especially high and low levels of current consumption
Evidence: Evidence shows that visual displays which do not require the consumers detailed attention and
quickly alert the customer to ―unusually high‖ consumption, assist in driving customer savings.89
The UK‘s OfGem has mandated that IHDs include a ‗visual, non-numerical‘ display ―which allows a consumer to easily distinguish between low and high current consumption‖.
90 Provision of non-numerical data could also
be helpful for consumers with low levels of numeracy or literacy or who are visually impaired,91
making the IHD accessible to a broader community. This requirement does not mean that a dedicated display is required for the IHD, only that whatever display mechanism is used allows consumption data to be shown visually, not just numerically.
84
This study also noted that customers interviewed post-trial routinely indicated that this function was well received, VaasaETT Empower, The Potential of Smart Meter Enabled Programs to Increase Energy and Systems Efficiency: A Mass Pilot Comparison ,
2010, p. 46-47. 85
Will Anderson and Vicki White, Exploring Consumer Preferences for Home Energy Display Functionality, August 2009, p 14. This point was reiterated in stakeholder interviews undertaken during the research phase of this study Accenture, Stakeholder Interview
with the Alternative Technology Association, 11 October 2011, Stakeholder Interview with Municipal Association of Victoria, 17 October 2011, Stakeholder Interview with Consumer Utilities Advocacy Centre (Victoria), 12 October 2011. 86
ACEEE, Advanced Feedback Initiatives and Residential Feedback Programs: A Meta-Review for Household Electricity-Saving Opportunities, June 2010, p. 70. 87
Ibid, p. 107-118. See also Will Anderson and Vicki White, Exploring Consumer Preferences for Home Energy Display Functionality,
August 2009, p 39. 88
VaasaETT Empower, The Potential of Smart Meter Enabled Programs to Increase Energy and Systems Efficiency: A Mass Pilot
Comparison, 2011, p. 48, 68. 89
Will Anderson and Vicki White, Exploring Consumer Preferences for Home Energy Display Functionality , August 2009, p 6, 37. See
also Sarah Darby, Literature review for the Energy Demand Research Project, 2010, p. 6. 90
In addition to the ability to show consumption in kWh and cost. See OfGem, Industry’s Draft Technical Specifications, August 2011,
p. 180. 91
OfGem, Smart Metering Implementation Programme: In-Home Display, 2011, p. 10.

December 2011 48
MF5 Data Security
Hypothesis: Breaches or even the perception of breaches of customer data will negatively impact the
uptake of IHDs.
Evidence: There is significant community concern around privacy of data and access to meter information.
Consumer groups have consistently argued the need to maintain customer privacy92
and argued that a key concern of the AMI rollout is that consumers are worried about their data not being secure. Requiring the IHD to communicate securely with the measuring apparatus should mitigate this concern.
MF6 Accuracy
Hypothesis: Consumers will be better enabled to make informed decisions about their electricity usage if
the data provided to them is accurate.
Evidence: The purpose of IHDs is to provide feedback on electricity consumption. It seems reasonable that
some degree of accuracy of that feedback is required if consumers are to make informed decisions about their electricity consumption. The ACEEE meta-study found that providing estimated energy consumption feedback which was not accurate resulted in lower overall consumption reductions amongst consumers when compared with the reduction achieved by accurate feedback
93.
MF7. The Average Power Draw of the IHD should be no more than 0.6W
Hypothesis: Low power draw IHDs will enable greater consumption savings and greater customer uptake
as they will not consume electricity themselves whilst operating.
Evidence: The IHD power draw clearly adds to household electricity consumption, and so counts against
any behavioural change savings induced by the IHD. 0.6W was the minimum required for the proposed UK rollout.
MF8. The IHDs consumption data should be erasable
Hypothesis: Customer privacy will be enhanced if consumers are able to delete consumption history from
the IHD.
Evidence: It is possible that consumers may leave an IHD at a premise when they vacate. If so, their
consumption history will be viewable by the new householder unless they have the ability to delete that history.
MF9. Battery does not require replacement over estimated life
92
Stakeholder Interview with St Vincent de Paul Society, 12 October 2011 93
Accurate feedback, driven from a meter, produced consumption reductions which were between 1.6% and 5.2% higher, on average,
than estimated feedback, accurate feedback was more effective in driving consumption savings regardless of whether it was delivered in real-time or after the fact. See ACEEE, Advanced Feedback Initiatives and Residential Feedback Programs: A Meta-Review for
Household Electricity-Saving Opportunities, June 2010, p. iii.

December 2011 49
Hypothesis: There is a risk that customers will not use the IHD and hence not achieve the GHG abatement estimated if the batteries require replacement prior to the end-life of the IHD.
Evidence: It has been shown in other devices such as smoke alarms that battery replacement is a major
factor in devices not being used, even when the unit itself is fully operational. The lifetime of the IHD device is an important input into the total GHG abatement and as such this requirement ensures that the lifetime is not compromised. This requirement allows for cradle-based IHDs with rechargeable batteries – it does not refer to the life of the battery before recharging, but rather to the life before the battery itself requires replacement.
6.2 Features not included as minimum
The following represent those capabilities which were considered, but were not included as minimum features for an IHD. These could be considered for potential inclusion at a later date.
Portability
This feature enables consumers to move their IHD around the home. Consumers would be able to view the almost immediate benefits of turning off individual electrical items as they move around the home.
Rationale for exclusion: While evidence has shown that consumers value the ability to move their IHD (so
called ‗learning by doing‘ as customer move throughout the house switching appliances on and off), at least as a short term novelty value,
94 there is no evidence to suggest that this functionality results in greater
electricity consumption savings than those made with stationary devices.95
Consumers also noted the limitations of the IHDs being battery powered, which would be necessary to ensure the devices were fully portable as opposed to able to be moved from power socket to socket.
96 This can be an optional feature..
The Ability to Show Level of Carbon Emissions
This feature displays energy consumption in terms of the amount of CO2 emitted.
Rationale for exclusion: We were unable to find evidence to conclude that this feature was valuable in driving consumption reductions.
97 In addition, we noted that the likely implementation of this feature (as a
multiplicative emissions factor for electricity consumption) would result in the same view as electricity consumption but simply with a different scale
98.
A Dedicated Visual Display Mounted on the IHD
This feature would require an IHD to have a dedicated display mounted on the device. At present the minimum feature set does not require this and so a customer could ―bring their own display‖ and use an
94
Will Anderson and Vicki White, Exploring Consumer Preferences for Home Energy Display Functionality, August 2009, p. 25. 95
OfGem, Smart Metering Implementation Programme: Response to Prospectus Consultation, Supporting Document 3/5, Design
Requirements, 2011, p. 38. 96
Ibid. 97
One survey reviewed showed this factor to be the least important of several to US customers desiring a home energy monitoring system. See PA Consulting, Residential Smart Energy Monitoring Program: Final Report, March 2010, p. 1-2. 98
For example, the Victorian Scope 3 electricity emissions factor is 1.45 kg CO2e / kWh (refer to the Australian NGA Emissions Factors July 2011). Therefore the CO2 emitted would be simply 1.45 times the electricity consumption values. We note of course that
more complex implementations could be devised, for example by considering the generation mix relative to time of use, or by i ncluding distributed generation. However we believe this is the most likely implementation.

December 2011 50
existing display mechanism (for example a smart phone or TV) as the display provided it shows data in near real-time.
Rationale for exclusion: While there have been few trials conducted involving energy feedback accessed by the customer through devices such as the home PC, those which have been held have not shown consumption reductions substantially different to those experienced with physical displays.
99 Stakeholders
and experts interviewed have expressed an expectation that current dedicated display IHDs will eventually be eclipsed by HAN
100 enabled transmitters which interface with the customer‘s preferred display (pointing
to a trend for consumers to consolidate their in home devices). Requiring that IHDs have a physical display would preclude this second type of device from being considered an IHD in Victoria. In order to meet minimum standards, screenless devices would still need to provide near-real time information on consumption in ambient form either through a web portal, smart-phone application or other display.
Interoperability with gas and/or water smart meters
This feature would enable the IHD to retrieve data from gas or water smart meters that may be rolled out to Victorian households in the future. We note that the water network suffers from some of the same network constraint issues as does the electricity network, and that smart water meters are being discussed in industry as a potential solution. In Australia‘s drought-prone climate, water conservation may become more important, while globally, water consumers are showing preferences for services which could be supplied by IHDs.
101 As such if those smart meters are rolled out this feature would enable the same IHD to be used to
display water or gas consumption as well as electricity.
Reason for exclusion: There are currently no plans to rollout smart gas and water meters in Victoria.
Compatibility with the Victorian smart meter HAN technology (ZigBee)102
The AMI program has mandated ZigBee SEP 1.0 as the standard for HAN technology. The future Home Energy Management space is likely to include HAN technology, and as such requiring that IHDs be ZigBee-compliant would ensure that the IHDs could participate in a HAN leveraging the smart meter.
Rationale for exclusion: Requiring IHDs to be ZigBee-compliant would be an elegant solution that leverages the Victorian AMI investment. However on the basis of the ESI scheme alone (which is primarily concerned with greenhouse gas abatement) it is not possible to justify the exclusion of some IHDs which have the same greenhouse gas abatement as ZigBee-compliant IHDs and may be preferred by some consumers.
Non-ZigBee compliant IHDs are likely to be more expensive in the medium term than ZigBee-compliant IHDs, and consequently less attractive to consumers.
103. All other things being equal, consumers should
self-select ZigBee-compliant IHDs.
Messaging Capability from utility to IHD
99
ACEEE, Advanced Feedback Initiatives and Residential Feedback Programs: A Meta-Review for Household Electricity-Saving Opportunities, June 2010, p. 107-108, 112, 114. 100
Home Area Network; a residential local area network (LAN) used for communication between digital devices deployed in the home. 101
In the US Market, see ETC Institute, Water One Utility Residential Customer Survey Results, 2004. For an overview of European
customer attitudes see Techneau, Consumer Preferences, 2007. 102
A HAN is a residential local area network (LAN) used for communication between digital devices deployed in the home. 103
A non-ZigBee IHD would require a sensor device, a transmitter and the IHD itself. Some also require installation by a registered electrician.
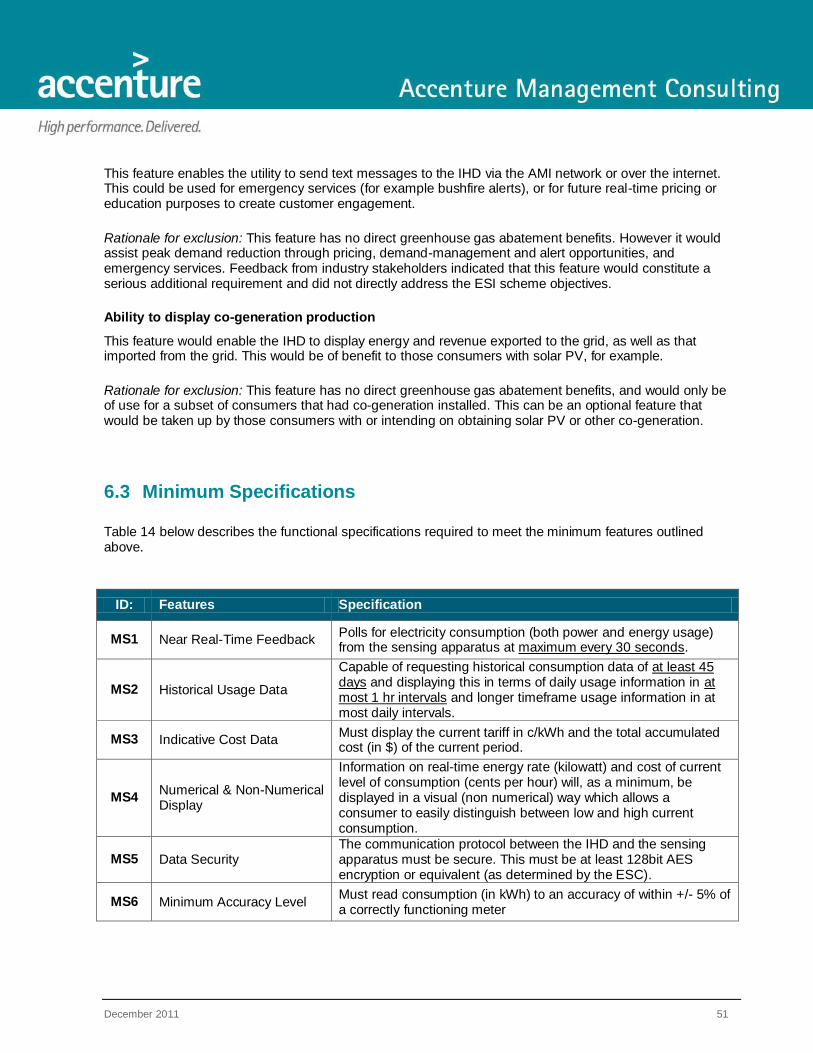
December 2011 51
This feature enables the utility to send text messages to the IHD via the AMI network or over the internet. This could be used for emergency services (for example bushfire alerts), or for future real-time pricing or education purposes to create customer engagement.
Rationale for exclusion: This feature has no direct greenhouse gas abatement benefits. However it would assist peak demand reduction through pricing, demand-management and alert opportunities, and emergency services. Feedback from industry stakeholders indicated that this feature would constitute a serious additional requirement and did not directly address the ESI scheme objectives.
Ability to display co-generation production
This feature would enable the IHD to display energy and revenue exported to the grid, as well as that imported from the grid. This would be of benefit to those consumers with solar PV, for example.
Rationale for exclusion: This feature has no direct greenhouse gas abatement benefits, and would only be of use for a subset of consumers that had co-generation installed. This can be an optional feature that would be taken up by those consumers with or intending on obtaining solar PV or other co-generation.
6.3 Minimum Specifications
Table 14 below describes the functional specifications required to meet the minimum features outlined above.
ID: Features Specification
MS1 Near Real-Time Feedback Polls for electricity consumption (both power and energy usage) from the sensing apparatus at maximum every 30 seconds.
MS2 Historical Usage Data
Capable of requesting historical consumption data of at least 45 days and displaying this in terms of daily usage information in at most 1 hr intervals and longer timeframe usage information in at most daily intervals.
MS3 Indicative Cost Data Must display the current tariff in c/kWh and the total accumulated cost (in $) of the current period.
MS4 Numerical & Non-Numerical Display
Information on real-time energy rate (kilowatt) and cost of current level of consumption (cents per hour) will, as a minimum, be displayed in a visual (non numerical) way which allows a consumer to easily distinguish between low and high current consumption.
MS5 Data Security The communication protocol between the IHD and the sensing apparatus must be secure. This must be at least 128bit AES encryption or equivalent (as determined by the ESC).
MS6 Minimum Accuracy Level Must read consumption (in kWh) to an accuracy of within +/- 5% of a correctly functioning meter

December 2011 52
MS7 Maximum Power Draw Must use no more than 0.6W of power on average in order to power itself. If coupled with another device this represents the additional power requirement.
MS8 Ability to erase data Consumption data must be able to be erased permanently from the IHD memory by the user
MS9 Rechargeable battery life of at least 5 years
If a dedicated unit IHD is employed which requires a battery for operation, then the lifetime of that battery before replacement (not the battery life before recharging is required) must be at least 5 years.
MSX If ZigBee communication is used, be forwards compatible
If ZigBee communications to the smart meter are used, then the IHD must be forward compatible with the ZigBee standard SEP 1.1 as well as the ZigBee standard SEP 1.0 which is currently in the Victorian AMI minimum specification
Table 14: Functional IHD Minimum Specifications
Some notes explaining the rationale and further implications of those specifications are given below:
MS1: The ZigBee SEP specification recommends that end devices only request information not
more than once every 30 seconds. The AMI minimum specification provides meters with the capability of serving up data only every 30 seconds. Whilst a quicker feedback timeframe would be desirable, it would be outside the AMI specification.
104
MS2: In Victoria, it is currently mandatory that energy retailers provide consumers with a
comparison of current period consumption with consumption from a year ago. However the AMI minimum specification only requires meter data from 45 days to be held in the meter. We also note that it is likely that historical comparisons could be achieved through means other than IHDs (for example web portals).
MS3: There is currently a moratorium on new Time of Use tariffs being applied by distributors in Victoria, and many networks (and hence retailers) offer block tariffs – both inclining and declining. The requirement to show indicative cost would therefore require IHDs to be able to handle these tariff structures. There are also fixed electricity charges in Victoria that are applied as a c/day figure. The requirement to show accumulated cost for the period would necessitate calculation of those charges as well.
MS3: Retail tariffs in Victoria are subject to regular Price Variations. In order for the IHD to hold the
latest tariff information, it must be either reprogrammable or able to be updated over the air (for example, by pushing tariff information via the smart meter to the IHD
105).
MS4: A graphical display which does not require the consumers detailed attention and can quickly
alert them to high usage. The aim of a graphical display is to remove the need for the consumer to stop and digest the information being presented.
106 It does not require a dedicated display.
MS5, MS8: Applying a security specification to the communications protocol will prevent ―drive-by‖ hacking which could result in the customer‘s information becoming available to others. 128 Bit AES encryption is in common use and is widely accepted as being secure. However we have not precluded some other encryption algorithm or security measure from being employed, as long as it can be proven to be secure. As an adjunct to this requirement, consumers must be able to erase
104
This requirement applies to the IHD polling for information, not necessarily to the update of information or transmission of
information between the smart meter and the IHD. We recognise that transmission delays from the smart meter (in the case of a ZigBee-enabled IHD) may result in data from the smart meter being up to 45 seconds or even 1 minute delayed. 105
This would necessitate use of the price cluster in the ZigBee SEP specification, and agreed protocols between the distributors and retailers for sending retail tariff information 106
OfGem, Smart Metering Implementation Programme: Response to Prospectus Consultation Overview Document, March 2011, p
14.

December 2011 53
data from the IHD to facilitate its potential use by others if the customer leaves their current home (especially applicable to renters with landlord installed IHDs).
MS6: The current Energy Retail Code requires retailers to inform the customer that their electricity
bill may not directly match their information displayed on their IHD107
. It is envisaged that this would become a disclosure requirement for all AP‘s, and is discussed further in Section #7of this document. In order to test this specification for CT clamp devices tests should be conducted against resistive loads with a power factor of 1.
MS7: Keeping the incremental average energy consumption per hour of the IHD at no more than
0.6W would result in the IHD accounting for no more that 0.001% of the average Victorian household with access to reticulated gas, and 0.00075% for the average Victorian household without reticulated gas. It is assumed that a USB or other device or will not draw more than 0.6W of power from any monitor it is plugged into.
MS8: The responsibility for erasing the data on the IHD therefore rests with the customer. The device must have this capability.
MS9: This requirement aligns with the estimated lifetime GHG abatement of the IHD (5 years). If
batteries required replacement prior to the 5 year mark, there is a risk that customers may not replace them and hence may not achieve the estimated 5 year GHG benefit.
MSX: This requirement was put in place as it is very likely that an upgrade to the latest ZigBee
standard in the Victorian AMI meters will occur in the future. Ensuring that all downstream devices, including IHDs, are compatible with SEP 1.1 will reduce the complexity and costs of that upgrade.
6.4 Examples of IHDs Meeting the Proposed Minimum Specifications
In this section are some examples of types of In Home Displays that would meet the minimum specifications drafted. Not all of the below examples are necessarily available in Australia, and also this list is not intended to be exhaustive. It is intended to provide examples to aid in interpretation of the minimum specifications.
A. ZigBee-enabled, physical device with display included
This device contains a display and a ZigBee communications chip, as well as memory and processor. The device communicates with the smart meter via the ZigBee protocol, and displays usage information on the display.
B. ZigBee-enabled and Wi-Fi enabled HAN controller and web server, no display
This device plugs into a wall power socket. It has no display but is a web server that can be securely accessed via any internet-connected device. It is ZigBee-enabled and as such communicates with the smart meter via the ZigBee protocol, and is accessible to the internet via Wi-Fi. The customer would review their electricity usage via their own internet-connected display, and the usage would be depicted in an ambient, glanceable format. Note that this could also be done via a smart phone application.
C. CT Clamp with secure communications protocol, display included
This device comprises multiple parts. It has a sensor that clamps onto the electrical wires leading into or from the smart meter, this measures the power delivered through those wires to an accuracy of +/- 5%. A
107
Section 4.7, ESC Energy Retail Code Version 8 April 2011

December 2011 54
transmitter then communicates via a secure communications protocol (e.g. Wi-Fi with SSL/TLS) with a display located in the house. All three components are delivered as part of the IHD package and installation is done securely and safely by an electrician according to existing electrical safety laws.

December 2011 55
7 Industry Processes and B2B Procedures
In Victoria‘s disaggregated electricity industry, a number of participants are required to be involved to facilitate the activation, usage and decommissioning of IHDs at a customer premise. As part of investigating the introduction of IHDs into the ESI scheme, we have explored the potential industry processes and B2B procedures that could be established to facilitate a robust program.
This section also considers the need for new requirements for accredited persons and the potential means by which IHDs could be enabled to function successfully at a customer premise.
This section is divided into 2 areas:
Accredited Person (AP) Requirements
IHD lifecycle
In considering these questions, key industry stakeholders in particular were engaged through workshops, interviews and written feedback received. This covered proposed roles and responsibilities within the market, potential processes that could be employed, and issues that arose from the usage of IHDs. The full list of stakeholders and methods of engagement are described in Section #7.5.
While all stakeholders were broadly supportive of the inclusion of IHDs in the ESI scheme there was a strong consensus that IHDs were a different category of product to others in the ESI scheme. In particular IHDs could require some post-installation management and support
108.
Industry stakeholders also raised issues that are applicable to IHDs (and the HAN market) outside of the ESI scheme. Many of these issues need to be addressed regardless of whether IHDs are to be included in the ESI scheme. As a general rule processes discussed for the ESI scheme also need to be workable in a non-ESI scheme environment.
Stakeholders were also very concerned about the potential effects of these processes on the customer. It was generally understood by all that consumers must be afforded a positive experience with IHD installation.
7.1 Guiding Principles
In developing the following requirements and procedures some high level guiding principles were used:
To maximise uptake and customer benefits, costs should be kept to a minimum.
To implement the roll-out as soon as possible (enabling uptake), processes and B2B procedures should be kept as simple as possible
108
The ERAA noted that IHDs ―rely on access to metering data to deliver the energy savings (not just to a power supply) and the
metering data is integral to the Retailer‘s relationship with the customer..‖, and that ―As IHDs will get customers engaged i n making energy savings, they will be looking for the effects of their behaviour on their bills from Retailers‖.

December 2011 56
Simplicity should be balanced by the need to have processes that are not prone to error and which may lead to a poor customer experience. Compliance to the ESI scheme‘s goals should be easily validated and processes that particularly deal with privacy and security issues should be robust.
Processes need to facilitate IHDs that meet the minimum specifications and support both ZigBee and Clamp On devices.
Processes need to consider the full lifecycle of IHDs.
Clarity on which party is responsible for each process step to lessen the risk of customers being caught between the multiple parties involved
We also recognised that a National Smart Metering Program had been put in place to answer many of the
HAN-related questions asked in this investigation. This program has now been suspended, this report
however aims to build upon any insights that were developed during the NSMP.

December 2011 57
7.2 ESI scheme Participants
The following table provides an overview of the current roles of participants in the Victorian electricity industry.
Role Description
Accredited Persons (AP)
To be eligible to create Victorian energy efficiency certificates (VEECs) under the Victorian Energy Efficiency Target (VEET) persons must be Accredited. The introduction of IHDs as a prescribed activity as part of the ESI would require businesses and existing APs to apply to become APs offering IHDs.
Retailers An organisation primarily engaged in the purchase of electricity and gas from the wholesale market for on-selling to individual consumers and businesses. They have a relationship with customers as they interact with them frequently through billing and service order processes.
Distributors Electricity distributors own and manage the power poles and wires which deliver power to homes and businesses across the state. They also provide technical services including inspection of equipment and maintenance. The distributor is responsible for rolling out of AMI meters under the Victorian government mandate and ensuring they meet the AMI minimum functional specification
109 that contains requirements around ZigBee functionality. They are
responsible until end of 2013 for undertaking this roll-out and operating the metrology for small customers (refer to Section #7.2.1 below)
Essential Services Commission (ESC)
The Essential Services Commission (ESC) administers the ESI scheme in accordance with the Victorian Energy Efficiency Target Act 2007 and the Victorian Energy Efficiency Target Regulations 2008.
Australian Energy Regulator (AER)
The Australian Energy Regulator (AER) performs economic regulation of the National Electricity Market (NEM), and enforcement of the National Electricity Law and National Electricity Rules. The AER oversees any mandated regulated distributor activity requiring cost recovery. AER is part of the Australian Competition and Consumer Commission (ACCC).
Australian Competition and Consumer Commission (ACCC)
ACCC is responsible for ensuring compliance with the Commonwealth‘s competition, fair trading and consumer protection laws.
Department of Primary Industries (DPI)
The DPI is responsible for agriculture, fisheries, earth resources, energy and forestry in Victoria. The DPI initiated the AMI program which mandated the rollout of smart meters by distributors, specifying requirements for meter functionality and the associated service levels. The DPI is the department with primary responsibility for oversighting the AMI program on behalf of the Victorian government.
109
Advanced Metering Infrastructure, Minimum AMI Functional Specification (Victorian) Release 1.1, September 2008
December 2011 58
Table 15: Roles of Stakeholders within the ESI scheme
7.2.1 Derogation
A derogation to the National Electricity Rules110
was passed to establish the local network service provider (LNSP – i.e. distributor as per terminology in Table 15 above) as the exclusive responsible party (RP) for the rollout of advanced metering infrastructure. This derogation expires at 31 December 2013 and is currently being reviewed. This report refers to the responsibilities of distributors and retailers under this derogation; however the processes described herein should be evaluated in the event of a change to that derogation which might occur at its expiration.
7.3 AP Accreditation
The Act and the Victorian Energy Efficiency Target Regulations 2008 allow for accredited entities, known as Accredited Persons, to create VEECs when they help consumers make selected energy efficiency improvements to their homes. These improvements are prescribed activities in the Regulations. Revenue generated through the sale of VEECs enables Accredited Persons to offer consumers incentives to undertake these energy efficiency improvements.
To become an AP, a business needs to meet a number of requirements including:
Auditing
Mandatory safety training
Insurance requirements
Record keeping
Fees
Further details can be found at the ESI website. As part of the investigation into the addition of IHDs to the list of prescribed activities, determination of the need for additional requirements around regulation of AP‘s was undertaken. Based on the stakeholder responses and information received and evaluated the report recommends that AP‘s must be able to demonstrate that they meet the following requirements:
110
National Electricity Amendment (Victorian Jurisdictional Derogation, Advanced Metering Infrastructure Roll Out) Rule No 2, 2009.

December 2011 59
Requirement Description Justification
Warranty An AP must disclose to the customer the manufacturer warranty of the IHD
To improve transparency of what the IHD warranty is for the customer
Retail Code AP‘s should be required to abide by the relevant clauses of the retail code relating to IHDs – noting that some AP‘s may be retailers and some not. At this stage Clause #4.7 of the Energy Retail Code
111 is relevant, which requires them
to provide information to the customer setting out how any consumption and cost information will compare to that on their bill.
This would be placed as a requirement for AP accreditation
To provide a competitively neutral environment, requirements for all AP‘s should be the same wherever possible (regardless of retailer affiliation).
Process The sale process should require customers to confirm that they do not currently have a working IHD in the home. This will make them eligible to receive a VEEC related to the IHD activity.
As per other scheme activities customer signature is seen as sufficient proof of eligibility.
AP should facilitate a customer premise IHD Suitability Assessment. For ZigBee IHDs this will ensure that, at a minimum, there is a smart meter at the premise and that customer IHD location is suitable. (IHD connectivity is limited by distance and obstructions between the meter and IHD.)
The customer will acknowledge that this assessment has taken place
To provide a check for the customer on their suitability to use an IHD, so that customers do not purchase IHDs only to find their premises is not suitable. .
To preserve the reputability of the ESI scheme
AP should demonstrate that the IHDs they are selling have been tested with the relevant distributors in the areas they are selling to.
It were better for IHD faults or incompatibilities to be discovered by the AP rather than at the customer premise.
There is already an inbuilt incentive for APs to test that IHDs bind to the smart meter as APs only receive VEECs upon the successful binding of IHDs
AP will be required to provide documented evidence of a successfully working device to register their VEECs. In the case of ZigBee IHDs this would be confirmation of binding to the smart meter. In the case of non-ZigBee IHDs the proof is acknowledgement from the customer.
The confirmation of ZigBee IHDs should be provided directly from the distributors
This proves that the device is operating and displaying electricity consumption, which is the basis of the GHG abatement potential and hence the VEEC allocation.
111
Essential Services Commission, Energy Retail Code Version 8, April 2011.

December 2011 60
to the ESC.
AP should demonstrate the ability to confirm the identity of the customer and to keep records of explicit informed consent from the customer including that:
they do not have a working IHD at the premises
they have the approval of the registered electricity account holder
they live at the address and can provide proof of identity
they agree to the installation of the IHD and any associated services
they acknowledge they have received the customer education and disclosures (see below) required.
To obtain clear traceability / auditability for the GHG abatement validation purposes
To cover privacy concerns - only the registered electricity account holder should provide approval for an IHD installation (so that the household has visibility of electricity consumption data)
AP will demonstrate processes to assist customers in troubleshooting faulty devices, this includes meeting the minimum IHD warranty provision,
AP should demonstrate a process by which the customer could contact the distributor if operations on the AMI infrastructure are necessary (e.g. faulty meter, binding process required, etc)
In home devices may require post installation management and support.
Customer Disclosure
Disclose all costs at point of sale. This should include any future costs to be incurred such as binding charges or electrician costs.
To comply with regulations and improve customer satisfaction upfront disclosure of all costs and potential costs in a transparent manner must be required.
Disclose that due to nature of wireless technology, reliable communications cannot be guaranteed due to other potential wireless interference within the home.
To ensure customers are properly informed
Both distributors and retailers noted that customers may not realise this themselves without clear disclosure by the AP
Disclose steps to ensure data privacy. This would include: o How to erase IHD Data o How to safely remove an IHD
device on move out. o That the customer should inform
their retailer they have an IHD when they move to another retailer or they may lose their IHD data
To protect the customer‘s private data (interval electricity consumption data) from potential compromise
Disclose whom to contact in the event that there are service issues
To prevent calls from being misdirected and hence increasing utility costs
As per the Retail Code, the relationship between the customer‘s bill and cost information presented by the IHD
To prevent bill shock, a poor customer experience and increased utility costs.
Table 16: Summary of AP Registration Requirements
December 2011 61
7.3.1 Should AP’s participate in the Victorian electricity Ombudsman scheme?
Some stakeholders suggested that AP‘s should be required to participate in the Energy and Water Ombudsman of Victoria (EWOV) scheme, as is required of every electricity retailer, distributor and transmission company operating in Victoria
112. This requirement of electricity industry participants
recognises that electricity is an essential service and a level of consumer protection is therefore warranted. EWOV ―deal with most of the issues that arise between a customer and an energy or water company — the provision and supply of a service (or the failure to provide or supply it), billing, credit and payment services, disconnections and restrictions, refundable advances (security deposits) and land and property issues.‖
113
The basis for the suggestion that AP‘s join the ombudsman scheme is that IHDs are fundamentally an energy-service item. The initial cost of the device is relatively small, and so unscrupulous operators could sell IHDs without the care being taken to ensure a positive customer experience. The longer-term energy relationship might then be left to others (particularly energy retailers) to manage.
114 Requiring AP‘s join the
ombudsman scheme, while seemingly a ―safe‖ option, as it gives customers significant recourse for complaints, however would be a high impost on AP‘s.
At this time we do not believe there are sufficient grounds to recommend that AP‘s are required to become EWOV scheme participants in order to engage in the provision of IHDs as a prescribed ESI activity. We note that no other ESI activity requires AP‘s to join EWOV, including other energy-related services such as solar PV installations, which arguably have more of an ongoing customer energy relationship (in that the solar PV typically involves a retailer provided feed-in tariff and has a lifetime of up to 30 years).
The following form some of the key consumer protections available for recipients of IHDs, which we believe are sufficient and appropriate for this type of activity (the sale of an IHD device):
Must meet IHD minimum specifications
AP accreditation requirements (including minimum disclosures to customers and a warranty period on the device)
The trade practice and competition requirements applicable to all businesses in Australia
VEECs will only be available after the IHD is successfully bound to the smart meter (in the event of ZigBee IHDs being used)
The ESC has the ability to suspend and/or revoke the accreditation of AP‘s that are found to engage in improper conduct
7.4 Proposed Procedures
Processes are required to support the inclusion of IHDs as an activity in the ESI scheme. These have been categorised into 4 broad categories covering the lifecycle of an IHD device. These are:
112
It is a requirement of their Victorian operating license. 113
Refer http://www.ewov.com.au/AboutEWOV/Complainthandling.aspx 114
The ERAA requested that AP‘s ―Become members of EWOV and are subject to the Retail and Marketing Codes (as the market for IHDs, the size of the subsidy available to APs, and the close linkage with energy market issues should warrant this).‖

December 2011 62
Device Accreditation
Sale and Registration
Usage
Decommissioning
Figure 13: IHD Process Categories
As discussed in Section #4.1, IHDs that meet the minimum specification fall into two distinct categories: ZigBee and Non-ZigBee. As such any proposed processes need to be flexible enough to cater for both types of devices.
The processes here attempt to strike the appropriate balance between well defined specifications to enable service delivery, yet not too onerous to restrict the market operating effectively. It was raised in stakeholder consultation that the timeframe for development of these processes was short, and whilst some level of agreement could be obtained now, more industry consultation and agreement to consider these issues was required between now and the likely commencement of the activity within the scheme.
7.4.1 Device Accreditation
As with other approved activities in the ESI scheme the proposal is for Accredited Persons to apply to the ESC to have products approved in order to create VEEC‘s from installation of IHDs. To have an IHD product approved for use in the ESI scheme, Accredited Persons must submit an Application for Approval of Product form to the ESC, together with documentary evidence showing that the product meets the criteria set out in the Regulations. For IHDs the proposed criteria to be met would be detailed in the IHD minimum specifications list.

December 2011 63
Table 17: IHD Device Approval
1 Accredited Person identifies a new IHD product to be added as a registered product.
2 AP confirms the product is ZigBee certified and has been tested with the relevant distributors in the area they are to be sold. (only required for ZigBee IHDs)
3 AP confirms the device meets the minimum specification and provides evidence to ESC
4 ESC adds to register of products
5 ESC notifies AP of outcome
Considerations
Issue Sub-Issue(s)
Approval of IHD Devices Evidence that IHD meets minimum specification
Confirmation that IHD is operable on distributor AMI system (ZigBee Only)
For a device to be approved the AP needs to demonstrate that the device meets the minimum specification.
ZigBee certification will provide the majority of required evidence that the IHD meets the minimum functional specification. All ZigBee certified devices are listed on the ZigBee website along with the documented evidence of what sections of the ZigBee protocol that device meets. Further evidence will be required to demonstrate that the IHD meets the other minimum specifications that are not ZigBee related such as Ambient Display, power draw etc. We recommend that if IHDs are included in the ESI scheme the ESC develop guidelines as to what constitutes sufficient evidence for an AP to prove an IHD device is compliant with the minimum specification and the acceptable method(s) for obtaining this - for example Lab trials, field trials, HAN
IHDZigBee
Tested with DBs?
AP
1 2
345
AP
Min. Specs?
AP
Non-ZigBee

December 2011 64
specification review etc. It is expected that approval of IHD products that are ZigBee enabled should closely align with ZigBee certification requirements around devices and models. Non-ZigBee enabled devices will likely require a more rigorous certification process and lab testing as the ZigBee standard cannot be employed. Refer to Table 18 below for minimum specifications linked to likely testing methods.
ID: Specification ZigBee Non ZigBee
MS1 Near Real-Time Feedback
ZigBee 1.0 and 1.1 Certification (Metering cluster)
Lab Test
MS2 Historical Usage Data ZigBee 1.0 and 1.1 Certification (Metering cluster)
Lab Test
MS3 Indicative Cost Data ZigBee 1.0 and 1.1 Certification (Pricing cluser)
Lab Test
MS4 Numerical & Non-Numerical Display
Device Specifications (Photo evidence sufficient)
Device Specifications (Photo evidence sufficient)
MS5 Data Security ZigBee 1.0 and 1.1 Certification (intrinsic to ZigBee protocol as ZigBee operates natively with 128-bit AES encryption)
Technical specifications
MS6 Minimum Accuracy Level
n/a (data received from smart meter so is 100% accurate to the meter)
Lab Test
MS7 Maximum Power Draw Lab Test or review of technical specifications
Lab Test or review of technical specifications
MS8 Ability to erase data Lab Test or review of technical specifications
Lab Test or review of technical specifications
MS9 Battery does not require replacement over estimated life
Lab Test or review of technical specifications
Lab Test or review of technical specifications
MSX
If ZigBee communication be used, be forward compatible
ZigBee 1.1 Certification as per MS1-MS5 Not applicable
Table 18: Proposed tests for minimum specifications
APs must be required to test IHDs with the relevant distributors of the areas in which they are selling IHDs. This is required to reduce the risk of ZigBee IHDs not working successfully with distributors‘ AMI systems and will give them an opportunity to test support for the device prior to them being installed.
The current Victorian AMI minimum functional specifications contain a set of ZigBee requirements. These require distributors‘ system to be compatible with all devices that pass the IHD accreditation process. We envisage that where disagreement arose between IHD manufacturers and distributors as to the cause of any incompatibility between the smart meter and the IHD, the DPI may become involved to investigate.
115
115
4 out of the 5 distributors noted that due to their systems using SilverSpring Networks technology there was a greater certainty of IHDs that are SSN certified working with their systems.

December 2011 65
7.4.2 Sale and Registration
Once an AP has gained ESC approval for an IHD product it can be sold to customers and installed under the ESI scheme. To be eligible for VEECs the AP must demonstrate that the compliant IHD has been installed and is operational. Table 19 highlights the key steps in this process.
Table 19: IHD Sale and Registration (ZigBee)
1 Accredited Person offers for sale their accredited device(s)
2 AP confirms customer details and confirms customer‘s eligibility for VEEC
3 AP discloses all required information to customer
4 Customer purchases IHD 5 Customer or AP requests
binding of IHD device from the distributor. This could be directly to the distributor or through the retailer
6 Distributor sends binding request through to meter
7 IHD binds to meter 8 Distributor notifies AP /
customer of successful bind, potentially through retailer
9 Charge is billed to customer as required, potentially through retailer. Alternatively the AP could aggregate this charge into a single IHD installation fee
10 AP sends ESI information to ESC
11 Distributor sends binding confirmation to ESC
12 ESC issues VEEC to AP
For Non ZigBee IHDs binding is not required, however the AP would be required to send an acknowledgement by the customer of the successful and safe installation of the IHD to the ESC for assignation and registration of VEECs. We currently understand that non-ZigBee IHDs require a sensor clamp to be placed on the wires leading into the household electricity meter, and that this should be performed by a registered electrician (REC). As such, an AP installing a non-ZigBee IHD should be bound by existing laws and regulations to be a REC.
AP
1-4 5 6
78-1112
AP
AP
OR
AP
OR

December 2011 66
Table 19A: Sale and Registration (Non-ZigBee)
1 Accredited Person offers for sale their accredited device(s)
2 AP confirms customer details and confirms customer‘s eligibility for VEEC
3 AP discloses all required information to customer
4 Customer purchases IHD 5 Registered electrician AP installs IHD 6 AP obtains necessary acknowledgements
and assignment of VEECs form from customer
7 AP sends installation information to ESC 8 ESC issues VEEC to AP
Considerations
Issue Sub-Issue
Impost on retailers through new services
Retailers may have additional call volumes due to the customer having access to the IHD – e.g. increased number of inbound calls due to pricing, or the device not working, etc
As described in Section #7.3 it is proposed that the AP will be required to meet minimum disclosure standards that includes adequate information to enable the installation of the IHD, configuration of the required tariff information, and a disclosure that the interval energy data available from the IHD may be different to that used by retailers for billing purposes.
Further AP requirements related to this issue are described in Section #7.4.3.
For ZigBee-enabled devices, AP‘s will only receive VEECs when the IHD is bound to the meter. This incentivises AP‘s to ensure devices are bound correctly and should reduce calls relating to device installation.
For non-ZigBee-enabled devices, AP‘s are obliged to obtain customer acknowledgement that the IHD is working correctly.
1-4 5
678
AP
APAP
Registered Electrician
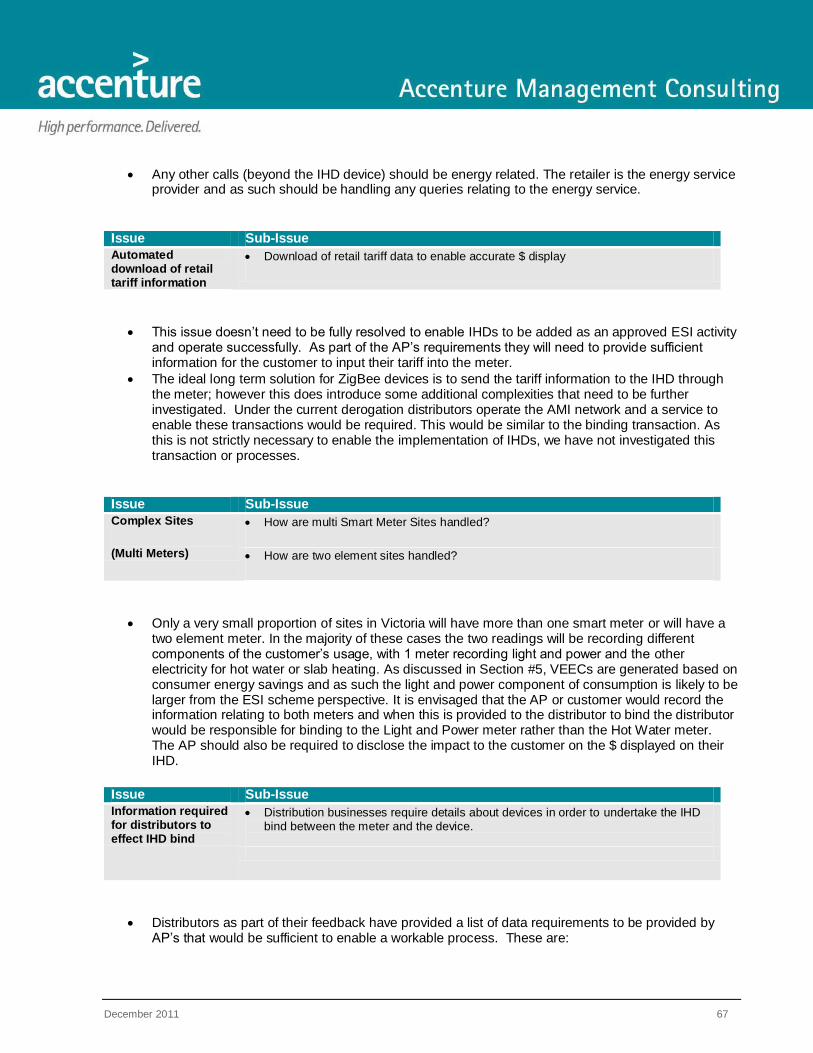
December 2011 67
Any other calls (beyond the IHD device) should be energy related. The retailer is the energy service provider and as such should be handling any queries relating to the energy service.
Issue Sub-Issue
Automated download of retail tariff information
Download of retail tariff data to enable accurate $ display
This issue doesn‘t need to be fully resolved to enable IHDs to be added as an approved ESI activity and operate successfully. As part of the AP‘s requirements they will need to provide sufficient information for the customer to input their tariff into the meter.
The ideal long term solution for ZigBee devices is to send the tariff information to the IHD through the meter; however this does introduce some additional complexities that need to be further investigated. Under the current derogation distributors operate the AMI network and a service to enable these transactions would be required. This would be similar to the binding transaction. As this is not strictly necessary to enable the implementation of IHDs, we have not investigated this transaction or processes.
Issue Sub-Issue
Complex Sites
(Multi Meters)
How are multi Smart Meter Sites handled?
How are two element sites handled?
Only a very small proportion of sites in Victoria will have more than one smart meter or will have a two element meter. In the majority of these cases the two readings will be recording different components of the customer‘s usage, with 1 meter recording light and power and the other electricity for hot water or slab heating. As discussed in Section #5, VEECs are generated based on consumer energy savings and as such the light and power component of consumption is likely to be larger from the ESI scheme perspective. It is envisaged that the AP or customer would record the information relating to both meters and when this is provided to the distributor to bind the distributor would be responsible for binding to the Light and Power meter rather than the Hot Water meter. The AP should also be required to disclose the impact to the customer on the $ displayed on their IHD.
Issue Sub-Issue
Information required for distributors to effect IHD bind
Distribution businesses require details about devices in order to undertake the IHD bind between the meter and the device.
Distributors as part of their feedback have provided a list of data requirements to be provided by AP‘s that would be sufficient to enable a workable process. These are:

December 2011 68
o NMI o NMI checksum o Meter serial number o ESI scheme device (Yes or No) o Device Name o Device Class o Device Type o Manufacturer o Device Model Name/ Number o Device Serial Number o Battery Powered (Yes or No) o HAN Identifier / Code
This should be reviewed and confirmed with industry further as retailers/ AP‘s will be required to provide this information and obtain this from customers.
It was noted by distributors116
that the current ―lowest common denominator‖ approach to sending this kind of information through to distributors was currently a list sent via email. It was recognised that moving forward, the distributors would like to facilitate access via a more automated manner and allow non-retailers to be involved. This could involve a common installer ―portal‖ and potentially a B2B interface existing across all distributors, and in the future potentially as part of the NEM
117.
Issue Sub-Issue
Registered account holder
Interval meter data may be considered personal information. As such only the registered account holder at the premises should be entitled to register an IHD to that NMI.
Distributors are not aware of the registered account holder as this information is held by the current retailer. The AP will not know this information either, so there needs to be a method of confirming that the person gaining access to the interval meter data is properly authorised to do so. Ideally this should not result in excessive administrative overhead, but should also acknowledge the privacy concerns of electricity customers that their personal information might become available to unauthorised persons.
Obtaining proof of registered account holder status via access to an electricity bill could enable fraudulent activities or rorting to occur. It also gives the AP access to private electricity consumption data.
We recommend that the AP must obtain acknowledgement from the customer that they have the approval of the registered account holder at the premises. The AP must also obtain customer details such as a driver‘s license or other similar identity confirmation and confirm that the customer lives at that address.
116
Refer to ―Distributor Response – IHD inclusion in ESI Industry Workshop,14 October 2011.‖ 117
This was raised with AEMO in a meeting on 3 November 2011. To create a new NEM B2B transaction or update an existing one would require an assessment of options and the AEMO Change Request process to be followed. It was noted that this is not a quick
process and also that the NEM B2B process was applicable to energy participants only (i.e. non-retailer AP‘s would still require a method of contacting distributors).
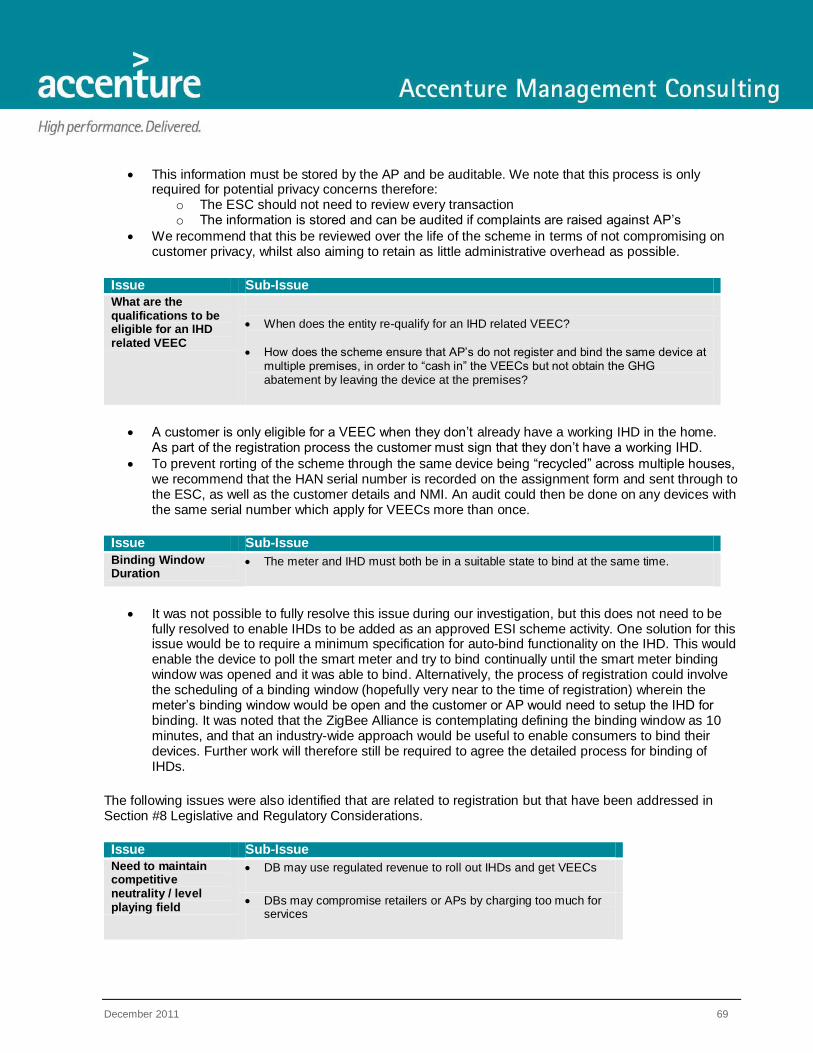
December 2011 69
This information must be stored by the AP and be auditable. We note that this process is only required for potential privacy concerns therefore:
o The ESC should not need to review every transaction o The information is stored and can be audited if complaints are raised against AP‘s
We recommend that this be reviewed over the life of the scheme in terms of not compromising on customer privacy, whilst also aiming to retain as little administrative overhead as possible.
Issue Sub-Issue
What are the qualifications to be eligible for an IHD related VEEC
When does the entity re-qualify for an IHD related VEEC?
How does the scheme ensure that AP‘s do not register and bind the same device at multiple premises, in order to ―cash in‖ the VEECs but not obtain the GHG abatement by leaving the device at the premises?
A customer is only eligible for a VEEC when they don‘t already have a working IHD in the home. As part of the registration process the customer must sign that they don‘t have a working IHD.
To prevent rorting of the scheme through the same device being ―recycled‖ across multiple houses, we recommend that the HAN serial number is recorded on the assignment form and sent through to the ESC, as well as the customer details and NMI. An audit could then be done on any devices with the same serial number which apply for VEECs more than once.
Issue Sub-Issue
Binding Window Duration
The meter and IHD must both be in a suitable state to bind at the same time.
It was not possible to fully resolve this issue during our investigation, but this does not need to be fully resolved to enable IHDs to be added as an approved ESI scheme activity. One solution for this issue would be to require a minimum specification for auto-bind functionality on the IHD. This would enable the device to poll the smart meter and try to bind continually until the smart meter binding window was opened and it was able to bind. Alternatively, the process of registration could involve the scheduling of a binding window (hopefully very near to the time of registration) wherein the meter‘s binding window would be open and the customer or AP would need to setup the IHD for binding. It was noted that the ZigBee Alliance is contemplating defining the binding window as 10 minutes, and that an industry-wide approach would be useful to enable consumers to bind their devices. Further work will therefore still be required to agree the detailed process for binding of IHDs.
The following issues were also identified that are related to registration but that have been addressed in Section #8 Legislative and Regulatory Considerations.
Issue Sub-Issue
Need to maintain competitive neutrality / level playing field
DB may use regulated revenue to roll out IHDs and get VEECs
DBs may compromise retailers or APs by charging too much for services
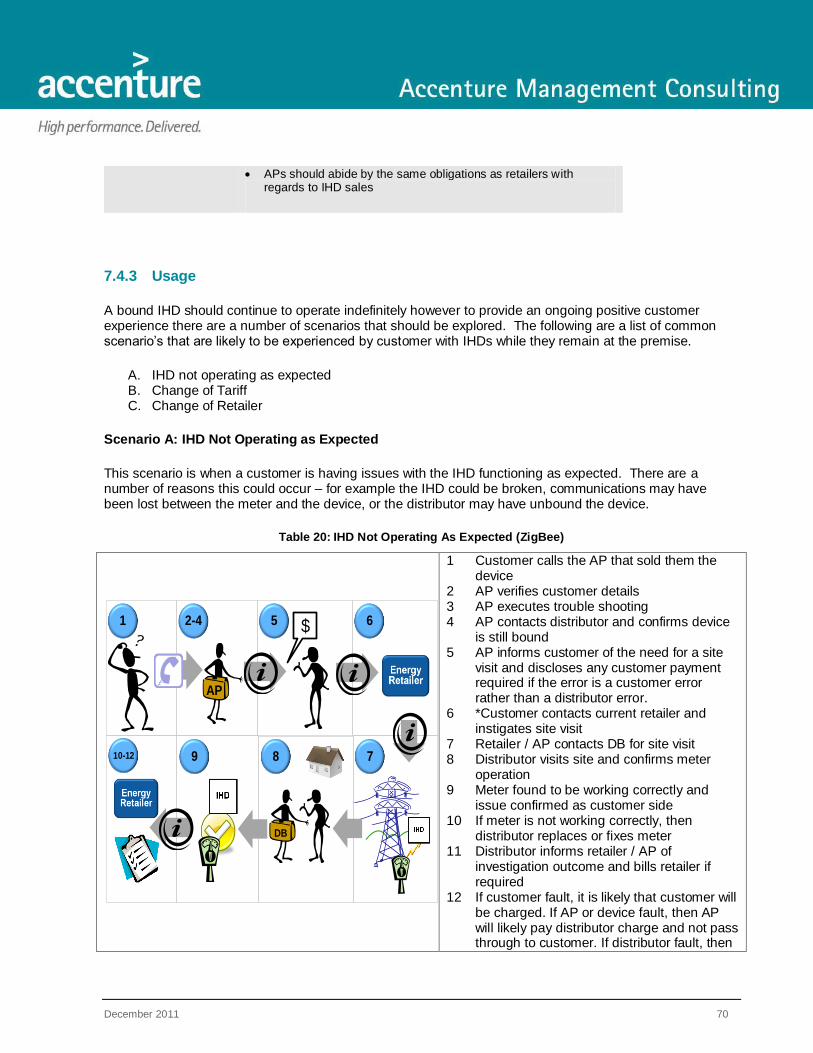
December 2011 70
APs should abide by the same obligations as retailers with regards to IHD sales
7.4.3 Usage
A bound IHD should continue to operate indefinitely however to provide an ongoing positive customer experience there are a number of scenarios that should be explored. The following are a list of common scenario‘s that are likely to be experienced by customer with IHDs while they remain at the premise.
A. IHD not operating as expected B. Change of Tariff C. Change of Retailer
Scenario A: IHD Not Operating as Expected
This scenario is when a customer is having issues with the IHD functioning as expected. There are a number of reasons this could occur – for example the IHD could be broken, communications may have been lost between the meter and the device, or the distributor may have unbound the device.
Table 20: IHD Not Operating As Expected (ZigBee)
1 Customer calls the AP that sold them the device
2 AP verifies customer details 3 AP executes trouble shooting 4 AP contacts distributor and confirms device
is still bound 5 AP informs customer of the need for a site
visit and discloses any customer payment required if the error is a customer error rather than a distributor error.
6 *Customer contacts current retailer and instigates site visit
7 Retailer / AP contacts DB for site visit 8 Distributor visits site and confirms meter
operation 9 Meter found to be working correctly and
issue confirmed as customer side 10 If meter is not working correctly, then
distributor replaces or fixes meter 11 Distributor informs retailer / AP of
investigation outcome and bills retailer if required
12 If customer fault, it is likely that customer will be charged. If AP or device fault, then AP will likely pay distributor charge and not pass through to customer. If distributor fault, then
AP
DB
$1
10-12 9 8
2-4 5 6
7

December 2011 71
no charge is likely to apply to customer. 13 Customer pays bill
*Customer may decide to go through current retailer to instigate the site visit. Alternatively, if the AP has an arrangement with the distributor, the AP could organise the site visit directly.
For non-ZigBee IHDs, only Steps 1-3 are required.
Scenario B: Change of Tariff
This is the scenario where a customer changes tariff, either through changing energy plans with their current retailer, or through a Price Variation Event. The IHD will need to be updated with the new tariff otherwise the $ displayed will diverge from the billed amount.
Table 21: Change of Tariff – Manual Update
1 Customer calls AP or refers to AP documentation, who sold them the device (optional step)
2 AP assists in instructing customer to manually update IHD (optional step)
3 Customer updates IHD with new tariff
If the customer has a ZigBee IHD, it is possible for the tariff to be downloaded to the IHD through the meter. This would obviate the need for manual intervention in updating the tariff. We envisage that this would become more likely as the market matures and as industry develops processes to deal with HAN functionality.
Scenario C: Change of Retailer
This is the scenario where a customer with an IHD churns from one retailer to another whilst staying at the same premises (an in-situ transfer). There is no direct impact on the ESI scheme for this but it is in the interests of customer satisfaction for the IHD to remain bound.
AP IHD
1 2 3
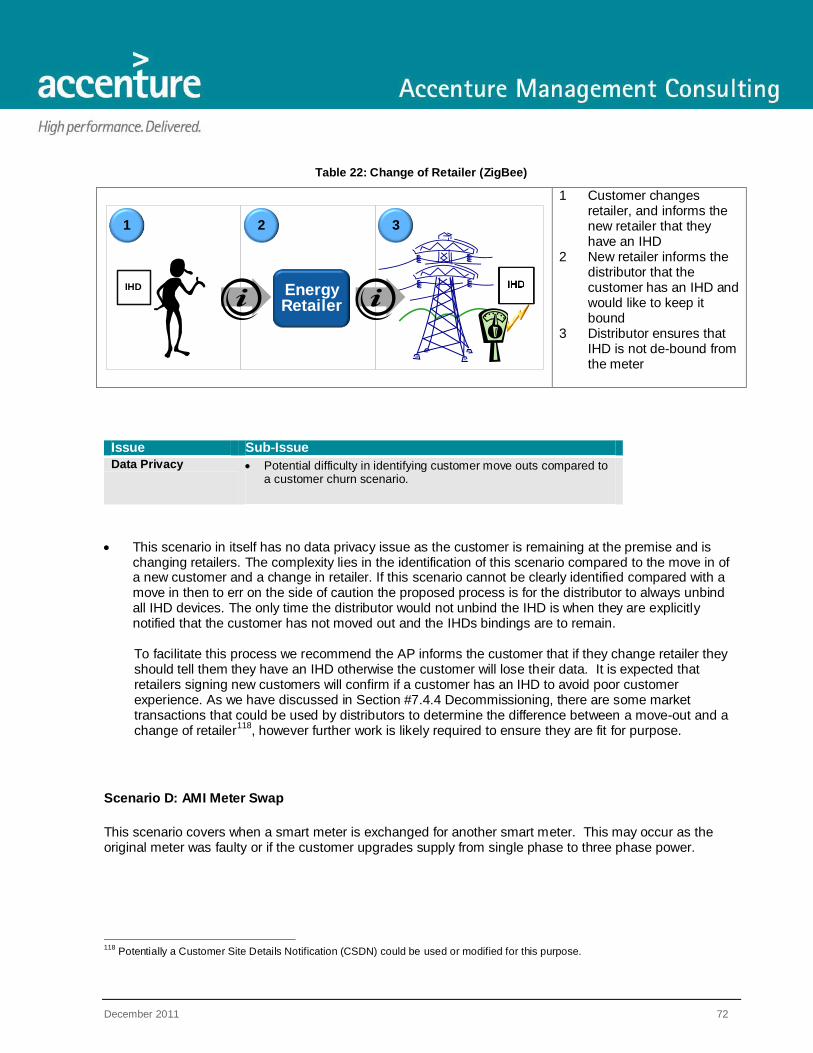
December 2011 72
Table 22: Change of Retailer (ZigBee)
1 Customer changes retailer, and informs the new retailer that they have an IHD
2 New retailer informs the distributor that the customer has an IHD and would like to keep it bound
3 Distributor ensures that IHD is not de-bound from the meter
Issue Sub-Issue
Data Privacy Potential difficulty in identifying customer move outs compared to a customer churn scenario.
This scenario in itself has no data privacy issue as the customer is remaining at the premise and is changing retailers. The complexity lies in the identification of this scenario compared to the move in of a new customer and a change in retailer. If this scenario cannot be clearly identified compared with a move in then to err on the side of caution the proposed process is for the distributor to always unbind all IHD devices. The only time the distributor would not unbind the IHD is when they are explicitly notified that the customer has not moved out and the IHDs bindings are to remain.
To facilitate this process we recommend the AP informs the customer that if they change retailer they should tell them they have an IHD otherwise the customer will lose their data. It is expected that retailers signing new customers will confirm if a customer has an IHD to avoid poor customer experience. As we have discussed in Section #7.4.4 Decommissioning, there are some market transactions that could be used by distributors to determine the difference between a move-out and a change of retailer
118, however further work is likely required to ensure they are fit for purpose.
Scenario D: AMI Meter Swap
This scenario covers when a smart meter is exchanged for another smart meter. This may occur as the original meter was faulty or if the customer upgrades supply from single phase to three phase power.
118
Potentially a Customer Site Details Notification (CSDN) could be used or modified for this purpose.
EnergyRetailer
IHD
1 2 3

December 2011 73
Table 23: AMI Meter Swap (ZigBee)
1 Distributor identifies an AMI meter swap is required
2 Distributor identifies IHD device is bound to AMI meter
3 Distributor notifies customer for Meter Swap and informs the customer of the need for IHD binding
4 Distributor visits site and exchanges AMI meter and rebinds IHD
Considerations
Issue Sub-Issue
Faulty IHD IHD Warranty period
The need for on-going support of IHDs by AP‘s
Recovery of wasted visit costs
Although this issue wouldn‘t need to be fully resolved to enable IHDs to be added as an approved VEET activity, it is important from an ongoing customer satisfaction and scheme robustness perspective. As part of consultation it was noted that this was the first foray into the IHD space and artificially stimulating the market for poor products may reduce the ability to derive future benefits and negatively impact customer sentiment around IHD devices. To address this, the AP is required to offer an IHD warranty (refer to Section #7.3). This is recommended to be in conjunction with AP‘s providing after sales support to address the various scenarios for customers around ongoing usage of IHDs covered in this section.
We found in this investigation that there could be issues regarding the smart meter that were required to be resolved by the distributor. It is noted that this is an early stage of determining industry processes with respect to after-installation support, and there are a number of issues with respect to cost-recovery, escalation processes and support arrangements. We recommend that these be left for determination by AP‘s, retailers and distributors, and note that there are existing precedents for distributor services that are invoiced through retailers that could be re-used. We recommend that further work will be needed to agree the exact requirements of this scenario.
Issue Sub-Issue
Updating IHD Tariff Tariff requires updating when the customer changes tariff.
DB
1 2 3-4
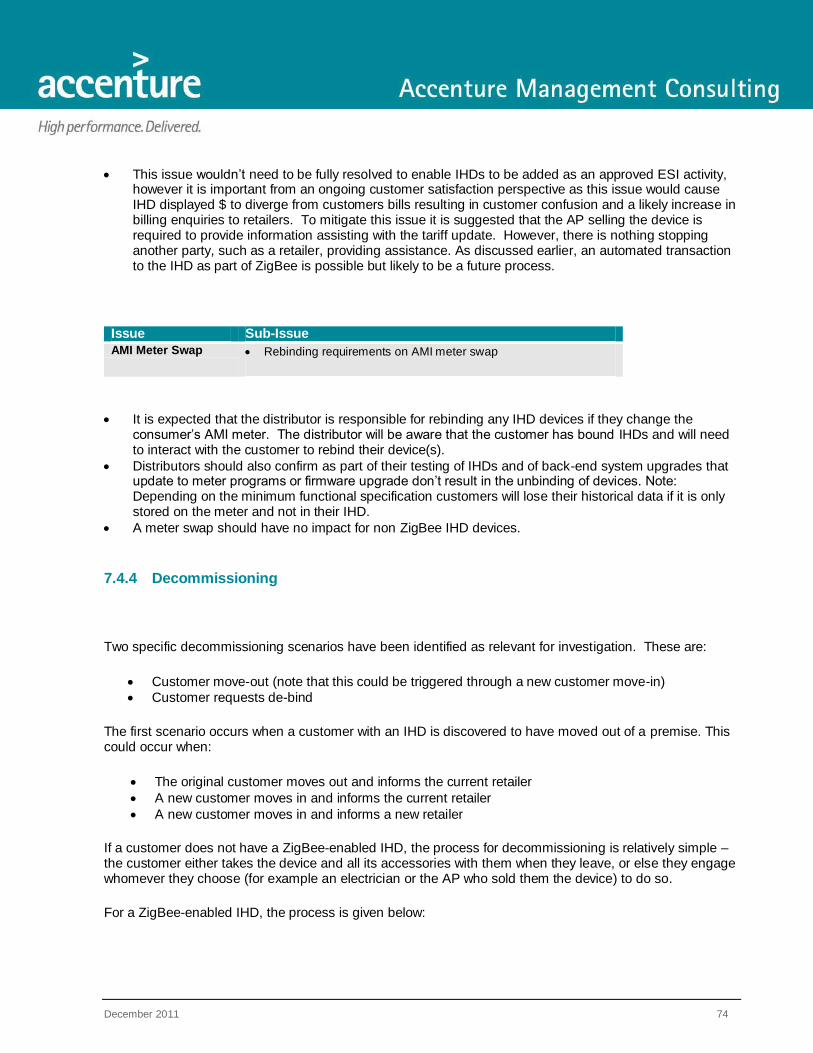
December 2011 74
This issue wouldn‘t need to be fully resolved to enable IHDs to be added as an approved ESI activity, however it is important from an ongoing customer satisfaction perspective as this issue would cause IHD displayed $ to diverge from customers bills resulting in customer confusion and a likely increase in billing enquiries to retailers. To mitigate this issue it is suggested that the AP selling the device is required to provide information assisting with the tariff update. However, there is nothing stopping another party, such as a retailer, providing assistance. As discussed earlier, an automated transaction to the IHD as part of ZigBee is possible but likely to be a future process.
Issue Sub-Issue
AMI Meter Swap Rebinding requirements on AMI meter swap
It is expected that the distributor is responsible for rebinding any IHD devices if they change the consumer‘s AMI meter. The distributor will be aware that the customer has bound IHDs and will need to interact with the customer to rebind their device(s).
Distributors should also confirm as part of their testing of IHDs and of back-end system upgrades that update to meter programs or firmware upgrade don‘t result in the unbinding of devices. Note: Depending on the minimum functional specification customers will lose their historical data if it is only stored on the meter and not in their IHD.
A meter swap should have no impact for non ZigBee IHD devices.
7.4.4 Decommissioning
Two specific decommissioning scenarios have been identified as relevant for investigation. These are:
Customer move-out (note that this could be triggered through a new customer move-in)
Customer requests de-bind
The first scenario occurs when a customer with an IHD is discovered to have moved out of a premise. This could occur when:
The original customer moves out and informs the current retailer
A new customer moves in and informs the current retailer
A new customer moves in and informs a new retailer
If a customer does not have a ZigBee-enabled IHD, the process for decommissioning is relatively simple – the customer either takes the device and all its accessories with them when they leave, or else they engage whomever they choose (for example an electrician or the AP who sold them the device) to do so.
For a ZigBee-enabled IHD, the process is given below:

December 2011 75
Table 24: Customer move-out (ZigBee)
1 Original customer initiates move-out or new customer initiates move-in
2 If the current retailer is informed of the move-out (either through the original customer initiating the move-out or a new customer initiating the move-in with the same retailer), the current retailer will inform the distributor of the move-out via AEMO B2B market transactions
3 If a new retailer wins the site, the new retailer will inform the market of this via a CR 1xxx CATS transaction
4 Distributor therefore is made aware of the customer move-out via direct retailer notification or a
CR 1xxx CATS transaction 5 Distributor de-binds all HAN
devices from the smart meter 6 Customer moves out and
(optionally) new customer moves in. The old customer‘s IHD cannot read the new customer‘s meter usage information, unless the new customer requests a re-bind
The second scenario occurs where a customer requests the de-binding of a HAN device from their smart meter. This might occur if a customer has reached the limit of devices allowed to be bound under the AMI minimum specification
119, or if a customer simply decides that they do not want the device any more.
119
Understood to be a minimum of 16 HAN devices allowed to be bound simultaneously, as per the AMI minimum specifications
1-3 4
6 5
OR
HANAppliances
OldIHD
NewRetailer

December 2011 76
Table 25: Customer requests de-binding (ZigBee)
1 Original customer requests de-bind of device from current retailer or AP
2 Current retailer or AP informs distributor of de-bind request
3 Distributor de-binds device from smart meter
Considerations
Issue Sub-Issue
Data Privacy How does the distributor know that a customer has moved out, in order to ensure that the customer‘s IHD is de-bound from the smart meter?
What happens if a customer leaves an IHD in the house after they leave? (for example they have affixed it to a house chattel)
Retailers, rather than distributors, are directly made aware of customer move-outs. Retailers then inform distributors of this scenario using a number of AEMO transactions
120. Where misidentification
of this scenario might occur, the onus would be on the customer to inform their retailer of this121
. The distributor would automatically perform the de-bind service whenever it became aware of a customer move-out.
There may be opportunity to streamline the AEMO industry processes to make it easier for distributors to infer a customer move-out.
We have specified in the minimum feature set of the IHD that the customer must be able to erase data. Therefore leaving an IHD at a home after moving out obligates the customer to protect their own data by erasing the IHD. AP‘s will also be expected to disclose to the customer for non ZigBee devices that the customer should take their device with them – this is of particular importance as the non ZigBee devices store history in the device, not on the meter.
We recognise an issue exists wherein IHDs may extract historical meter data from the smart meter that is the previous resident‘s. We consider this a significant issue and address it in Section #8.1, Privacy.
120
The ―De-energisation‖ and ―Special Read – move-out‖ service orders could be used in this circumstance, as could ―Customer Site Details Notification‖. 121
For example, if a customer changes name the consequent Customer Site Details notification might be misidentified by the distributor as a move-out.
EnergyRetailer
IHD
1 2 3

December 2011 77
Issue Sub-Issue
Cost recovery of the de-bind
How do the distributor and retailer cost recover the de-bind operation?
We would envisage that distributors would aggregate the de-bind and bind charges into one charge only, applied at the time of binding. This is due to there being no incentive for a customer to request a de-bind if they are moving out of a property (the impact of not performing the de-bind falls on the new customer). However this can reasonably be left up to the market to determine.
7.5 Stakeholders Engaged
The DPI and Accenture organised an industry forum to discuss streamlined procedures for IHDs, where Victorian distributors, retailers and regulators were involved. An industry briefing paper was developed and sent out for discussion. The following attendees were present:
Organisation Participants
Origin Dean van Gerrevink + Neil Bryden
AGL Stephanie Bashir + Maurice Amor
TRUenergy Andrew Schieffer
Simply Energy Dianne Shields
Red Energy Martin Exelby
SP Ausnet Patrick Murphy + Neil Webb
Citipower / Powercor Cheung Koo + Garry Tuckwell
Jemena Paul Greenwood
United Energy Nichole Chaplin + Verity Watson
ESC Rod Woolley + James Clinch
ENA Susan Streeter
DiUS Mark Anderson
SecureMeter Ian Levell
SilverSpring Networks Andrew Vlachiotis
Table 26: Industry Workshop Participants
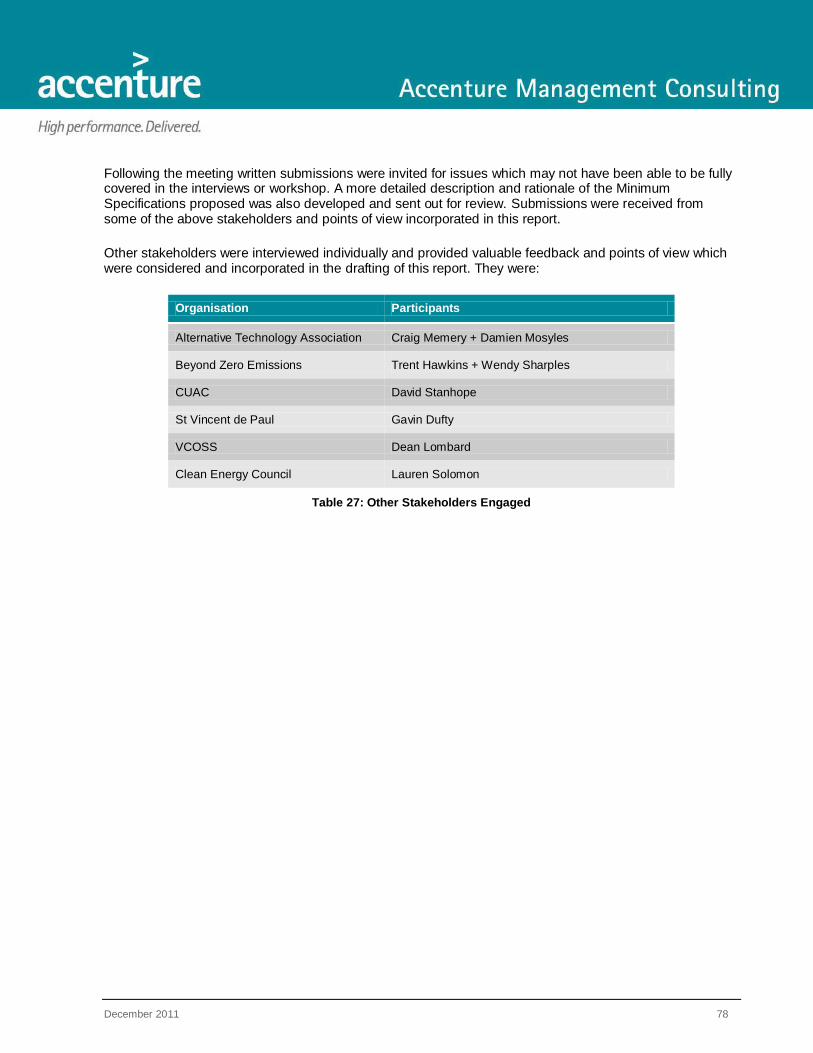
December 2011 78
Following the meeting written submissions were invited for issues which may not have been able to be fully covered in the interviews or workshop. A more detailed description and rationale of the Minimum Specifications proposed was also developed and sent out for review. Submissions were received from some of the above stakeholders and points of view incorporated in this report.
Other stakeholders were interviewed individually and provided valuable feedback and points of view which were considered and incorporated in the drafting of this report. They were:
Organisation Participants
Alternative Technology Association Craig Memery + Damien Mosyles
Beyond Zero Emissions Trent Hawkins + Wendy Sharples
CUAC David Stanhope
St Vincent de Paul Gavin Dufty
VCOSS Dean Lombard
Clean Energy Council Lauren Solomon
Table 27: Other Stakeholders Engaged

December 2011 79
8 Legislative and Regulatory Considerations
In this section we address the relevant legislative and regulatory considerations associated with the inclusion of IHDs in the ESI scheme. This report and any recommendations within do not constitute legal or regulatory advice. Our analysis has looked at the business processes and implications of inclusion of IHDs into the ESI scheme, and the information generally throughout this report regarding any issues of a legal or regulatory nature has been provided to us by stakeholders.
8.1 Privacy
IHDs will obtain and store consumption data from the meter and therefore will potentially be at risk of similar privacy issues as smart meters although there are some significant differences. These are mostly due to the fact that smart meters collect regular data for billing purposes and this data is stored in large repositories held by different organisations. However IHDs (and any HAN device) will be contained within the home and therefore the customer will have control over the device. The IHD will contain information ‗read‘ from the meter and also contain data entered by the consumer (such as tariff data). Privacy issues are therefore of most concern if customers are not fully aware of the data the device holds and/or access is obtained to the IHD by an external party.
What are the risks?
In terms of privacy it should be understood that, unlike the meter, an IHD will be the property of the home owner and usually contained within the home. These two qualifiers restrict the range of potential risks which the ESI program should be concerned with. The following list of privacy concerns are potentially the most relevant to IHDs -
Could reveal householders‘ behaviour patterns
Could reveal times of absence from the house,
May provide means for extra and unwanted direct marketing from electricity businesses or third parties;
May reveal other information to third parties such as the types of appliances in the home
Is the data held by the IHD personal data?
The Privacy Act 1988 (Cth) defines personal information as follows:
―personal information means information or an opinion (including information or an opinion forming part of a database), whether true or not, and whether recorded in a material form or not, about an individual whose identity is apparent, or can reasonably be ascertained, from the information or opinion.‖
By the definition of IHDs in this report IHDs will only contain aggregate household consumption information. There are views that because of this aggregation, personal behavioural information would be difficult to determine except where there is a single household occupant. This aggregation in some ways could be seen as adding to privacy protection because even if the IHD data was associated with the account holder‘s name, the usage data would not necessarily reflect an individual‘s energy usage. However the fact that the usage information contained on an IHD could be associated with an individual means that it should be

December 2011 80
treated as containing personal information and therefore they should be treated by outside organisations according to the National Privacy Principles.
Privacy risks from technology
The minimum specifications required for IHDs in this report (and the standards of the ZigBee protocol) mean that risks from hackers and snoopers are highly unlikely. This is covered more fully in Section #6.1. This means that in terms of inadvertent access to consumption data the point of failure is the IHD device itself. In effect the IHD would need to be physically accessible by an unauthorised third party for a potential breach to occur.
For devices that do not use the ZigBee protocol there are potentially greater risks. However the minimum specifications have addressed these issues. It is therefore highly unlikely for an IHD to be at risk of unauthorised access through technical or non physical means.
Processes which could compromise Personal Data
There are potential risks of metering data being read by an IHD which does not belong to the household. These risks have been dealt with through the binding and de-binding processes described in Section #7.4.
Another concern is the initial sale of the IHD by an AP. If metering data is to be defined as ‗personal information‘ and therefore subject to the National Privacy Principles, then it should be the registered account holder who will need to authorise the sale and registration of the IHD. AP‘s will need to validate that they have the informed consent of the registered account holder (or their delegate) – see Section #7.4.2.
Apart from the measures described above dealing with selling, registering and unbinding, it will mostly fall to the householders to ensure that their IHDs contents are not disclosed to unauthorised persons. As the IHD will be contained within the home and will be the householder‘s property we do not consider this to be unreasonable. As long as the relevant information (including risks) is conveyed to householders they should be in a position to manage the IHD in a manner which should minimise privacy concerns. However there is one issue which will be outside the householders control and that is preventing access to their consumption data after they have moved from their premises and the new resident installs an IHD (see below).
IHDs reading historical data from the meter that relates to previous residents
As part of the consultation process for this report the 5 distributors (in their response submission) highlighted the fact that ―there exists no solution today to prevent a Registered Device (e.g. IHD) from reading the historical data that exists in the meter. Further, the National Electricity Rules (Chapter 7.8.4) expressly prevent the cleanings of such historical data from the meter‖
[1]. This means that previous
residents of a premise may have their usage data accessed and read by new residents if they have an IHD which is capable of reading prior data from the meter (these types of IHDs do currently exist in the market place).
This issue is significant and has privacy implications for all IHDs and related devices regardless of the design of the ESI scheme. As such it is an issue which should be resolved to ensure the wider integrity of the industry regardless of IHD inclusion in the ESI scheme - and perhaps even before IHDs are included in the scheme.
[1]
DB‘s submission response dated 31st October 2011
December 2011 81
Potential solutions for IHDs reading historical data of previous residents
There are a number of options to prevent an IHD from accessing the data of previous residents. These include –
Requiring IHDs to only be able to read historical data from the meter from the date of binding to that meter. This could be included as a minimum specification. It is unclear at this point what the feasibility of this would be from IHD manufacturers‘ point of view.
Require IHDs to only be able pick up data from the meter in real time i.e. the IHD would be prevented from loading historical data from the meter. This would be a feature limitation as it would prevent the IHD from loading the historical consumer data in the event of a memory wipe or other event (such as signal interruption).
Require a ‗cleanse of data‘ from the meter after every move out. As stated above this would require a rule change in the NER.
Use ZigBee SEP 1.1 functionality which may address these issues – specifically utilising the Change of Tenant and Change of Supplier features.
Recommendations
1. The data contained within an IHD should be acknowledged and treated as ‗personal data‘ by all market participants. Any processes and procedures implemented to rollout and manage IHDs should explicitly acknowledge the potential existence of personal data within the devices.
2. AP‘s should explain the potential privacy considerations when selling and installing IHDs. These should include a description of the data that the IHD collects, the potential risks to the householder if the IHD and its data was accessible by unauthorised people.
3. AP‘s should receive the informed consent of the registered account holder (or a householder living at that address who acknowledges they have the informed consent of the registered account holder) to sell and register an IHD to a household.
4. Measures should be taken to make sure an IHD will not be able to ‗read‘ a meter that is not at the premises of the IHD owner
5. Measures should be taken to unbind an IHD when the consumer potentially vacates the premises 6. A solution should be investigated to prevent an IHD from reading historical data from the meter
from before the binding start date. More investigation with IHD manufacturers will be required to determine the feasibility of requiring IHD limitations on reading historical data from the meter.

December 2011 82
8.2 Health and Safety
Ensuring the health and safety of installers and users of IHDs has been considered in terms of the safety of IHDs themselves and the appropriate training requirements for their installation and use.
IHD Installation:
The health and safety requirements for installation depend on the type of IHD:
IHDs which bind to a smart meter via the ZigBee protocol are similar to a household appliance and do not require specialist installation. As they are standard household appliances, they are not expected to create specific health and safety concerns and as such we do not recommend any specific health and safety training is required.
Non-ZigBee IHDs which must be set up by applying a clamp/sensor to the electrical wires leading into the meter shouldbe installed by an Accredited Person (AP) complying with all requirements defined in ‗Explanatory Note – Guide to VEET Accreditation‘. We recommend that a mandatory safety training course/s delivered by a Registered Training Organisation (RTO) will need to be defined for the activity ‗IHD Installation‘. This would include electrical safety procedures to do with installing the clamp/sensor and should be developed in consultation with manufacturers.
We recommend the ESC will need to audit the AP‘s adherence to the training requirements.
Ongoing use of IHD:
The health and safety implications for ongoing use of IHDs have been considered across electromagnetic frequency and power output:
Electromagnetic Frequency:
ZigBee enabled devices reviewed operate on 915 MHz wireless transmission.
Non-ZigBee enabled devices reviewed operate on ~433MHz wireless transmission.
Both fall well within the radio wave range of the electromagnetic spectrum, and less than other technologies used in the home such as Wi-Fi which transmits at frequencies of 2.4 GHz or 5 GHz.
Power Output:
From the product specifications reviewed, power use of IHDs (ZigBee and non ZigBee) varies widely between a range of <0.1mW – 1W.
As a comparison, other devices used in the home such as wireless routers use ~1W of power.
The Australian Communications and Media Authority (ACMA)122
currently regulates all radiocommunications devices in Australia, based in part on the standards developed by ARPANSA
123.
Since IHDs operate within the radio frequency spectrum, they are subject to those standards already.
122
Refer to ACMA, RadioCommunications (Electromagnetic Radiation – Human Exposure) Standard 2003

December 2011 83
For both ZigBee and non-ZigBee IHDs, we do not envisage that consumers will have health or safety concerns with using the device.
8.3 Auditing and Administration of Program
The credibility of the ESI scheme is dependent on the premise that prescribed activities are resulting in real greenhouse gas savings. However, overly onerous auditing and compliance transactional costs would reduce the subsidy available to IHD owners.
The guiding principle that Accenture followed, following discussions with the ESC and other stakeholders, is that the processes and deeming methodology employed should be simple and easy to audit, therefore reducing those costs whilst still ensuring the credibility of the scheme.
A. Accreditation of Devices As described in Section #7 above, industry processes are required to ensure distributors are capable of handling the IHD with their systems in the event of a ZigBee-enabled IHD. The ESC will need to intervene in that process in the event of a dispute between APs and distributors to ensure that IHDs are tested correctly and in a timely manner.
B. Accreditation of AP‘s We have described in Section #7 above a set of minimum disclosure and ongoing service requirements for AP‘s in the sale of IHDs. The ESC will need to audit the AP‘s capacity to meet these service requirements.
C. Assignment of VEEC rights The process that has been developed (see Section #7.4.2) for the assignment of VEEC rights is deliberately designed to only assign the rights for the VEEC when the IHD is actually feeding near real-time electricity usage information to the customer. In the case of a ZigBee-compliant IHD this would be when the device has bound to the smart meter. In the case of a non-ZigBee-compliant IHD it requires the customer to agree that the IHD is connected and working.
D. Assessing the greenhouse gas abatement obtained
IHDs will be the first prescribed activity in the ESI that is a top-down model that applies to all electricity consumption, rather than a bottom-up approach built on the specifications of the products used. As described in Section #5, this posed complexity in terms of assigning the greenhouse gas abatement achieved, as necessarily a top-down approach that looked at pilots and trials around the world to ascertain the average electricity consumption reduction was used. It is recommended that the DPI re-evaluate the factors used in assigning VEECs for this activity after this phase of the ESI finishes (in 2014). This re-evaluation could utilise Victorian data obtained during this phase.
123
Refer to Australian Radiation Protection and Nuclear Safety Agency (ARPANSA), Radiation Protection Standard for Maximum Exposure Levels to Radiofrequency Fields – 3 kHz to 300 GHz, 2002

December 2011 84
8.4 Disposal and e-waste
E-waste is becoming more and more recognised as a serious environmental issue. E-waste in Australia is growing three times faster than any other type of waste
124, and this has been specifically highlighted in the
Australian Government National Waste Policy developed in 2010. We are not aware of any specifically hazardous materials contained in IHDs, however given the purpose of the IHD (and the ESI scheme) is an environmental one, we believe that consideration should be given to an environmentally sound disposal of the IHDs, rather than letting them end up in landfill.
There are a number of recycling programs endorsed by Sustainability Victoria that focus on the environmentally responsible recycling of electronic goods. In addition, the Accredited Persons (AP) requirements defined in ‗Explanatory Note – Guide to VEET Accreditation‘, describe the decommissioning practices that APs must receive ESC approval for when replacing products, with an emphasis on environmental responsibility and recycling. We recommend that a requirement be added to the ‗Guide to VEET Accreditation‘ that requires APs to inform consumers of their IHD disposal options – either via a Sustainability Victoria-endorsed recycling program or via the AP.
8.5 Contestability of the HAN market
The responsibilities of players and the functioning of the home area networks (HAN) have not yet been defined beyond the principle level in Australia‘s deregulated NEM. It is not within the scope of this report to define those market rules and responsibilities, and in any event such considerations should most likely be discussed at a national level with a much longer timeframe for resolution, given the complexity of the issues involved.
However the inclusion of IHDs in the ESI scheme will be the first time industry processes will be defined and may lay the foundation or be leveraged for the national HAN or beyond-the-meter market. It is therefore important that the processes defined in this report and are eventually adopted should permit a properly functioning market.
A properly functioning market requires, as far as possible, market participants to compete on the same basis (or at least not gain unfair advantage from use of market power).
This raises questions for the HAN market (and IHDs), given the pivotal role that distributors (regulated monopolies and current operators of the AMI infrastructure) will play in ensuring the IHDs are setup and become operational.
Distributors’ role in enabling a properly functioning market and fair provision of AMI IHD services
As the current regulated monopoly operators of the AMI communications network and metering infrastructure, distributors must be involved in the IHD market as service providers to enable IHDs to initially
124
As cited on the Department of Sustainability and the Environment‘s, E-Waste FAQs
http://www.environment.gov.au/settlements/waste/ewaste/faqs/index.html , [27 September 2011].

December 2011 85
bind to and communicate with the smart meter. Concerns have been raised125
that distributors could take advantage of their market power and regulated business which could result in:
using regulated revenue (i.e. network tariff charges) to subsidise some activities in the roll out IHDs
charging differential pricing to competing businesses to gain a market advantage
preventing market development through overcharging for services and/or lack of service levels
We have considered each of these issues in turn –
1) Use of unregulated revenue
The AER has advised126
that distributors using regulated revenue to fund unregulated activities is unlawful and is regulated by the AER under its yearly price determination of network tariffs. Therefore we believe the above concern is already sufficiently handled via existing regulations.
2) Gaining market advantage
If the IHD binding activity (which is currently unregulated) was to remain unregulated, the AER has advised that existing competition law is most likely sufficient to prevent a distributor with substantial market power taking advantage of that market power for a prohibited anti-competitive purpose.
In addition, the AER have advised that AP‘s would have recourse under existing competition law if distributors failed to provide a reasonable pricing for their services.
However if the activity was to become regulated (e.g. listed as an excluded service charge), there would be a great deal of control over the pricing that could be charged and the service levels that must be met.
Recommendation:
As the binding processes will effectively be partially subsidised through including IHDs in the ESI scheme, and given that the final impact will be felt by consumers, we recommend that the Victorian government be ready to provide formal statutory recognition of IHD-related services as a mandatory requirement of distributors, treating all AP‘s and retailers equally. This could result in IHD transactions such as binding and
de-binding becoming excluded service charges and the price of that service being subject to scrutiny by the AER.
Without knowledge of proposed distributor prices, it is difficult to forecast whether regulation would be beneficial in this area. However we point out that these HAN services should eventually be automated by distributors and as such should likely become free or very close to free. This takes into account the simple, remotely performed nature of the service.
Who can become an AP and gain VEECs through the installation of IHDs?
It was raised by some stakeholders that retailers are in the best position to deliver ongoing support and information to customers to maximise their ability to reduce their energy consumption through the use of an
125
By all retailers, for example Red Energy – Response to IHD inclusion in ESI – Industry Workshop Minutes 19 October 2011. However in final submissions to this discussion paper retailers argued against regulation until there was clear evidence of market
failure and overpricing. 126
Email from Chris Pattas, General Manager, Networks, AER, received 25 October 2011
December 2011 86
IHD. Retailers indeed have an ongoing relationship customers and have processes and capabilities that single transaction services provider may not (call centres, websites etc). Additionally energy retailers have to comply with the energy retail code which governs their marketing activities, service levels and customer complaint handling processes.
Consumer advocacy groups127
have indicated that there may be little recourse for a customer to obtain service about a device installation or usage of a device if the sale of IHDs is not subject to regulations. There is little incentive for AP‘s to continue to offer service to customers for a low-value sale after the sale has been made as they typically will not be aiming for repeat business.
Conversely, to obtain the maximum greenhouse gas abatement benefits, the ESI scheme should not unduly restrict the number of participants in the market. The ESI scheme has not previously restricted entrants in any other activity, and by encouraging market competition a reduction in prices to the end-consumer should be expected.
After careful evaluation of the above issues we have formed the view that some safeguards are implemented in the form of consumer protection conditions that an entity would need to show they could meet in order to become an Accredited Person for this activity. However we do not recommend that any business be specifically excluded from entering the market based on its current range of activities in the electricity industry.
8.6 Accessibility of electricity interval meter data
Providing an IHD to consumers enables them to access their electricity interval meter data consumption. A number of regulations are in place relating to the provision of interval meter data to consumers and under what circumstances this might occur. For example, the National Electricity Rules, the Victorian Energy Code and the National Privacy Principles all have provisions which may be relevant.
We recommend that the DPI investigate the clauses relating to the provision of interval meter data to consumers, and clarify with the relevant regulatory bodies their applicability to IHDs.
127
Stakeholder Interview with the Consumer Utilities Advocacy Centre (Victoria) 12 October 2011; Stakeholder Interview with the Clean Energy Council 20 October 2011.

December 2011 87
9 Potential Supplementary Measures
The ESI scheme is designed to put a value on energy efficiency activities. The intent of the scheme does not directly attempt to achieve wider goals. As part of our investigation into IHDs, a number of stakeholders identified a number of potential activities that sit outside of the ESI scheme but may be worthwhile considerations to complement the inclusion of IHDs in the scheme. Of particular interest to stakeholders were the following topics which we note below but, for scope reasons, are not discussed in this report –
The alignment of the goals of the AMI program with the ESI scheme and how IHDs may fit within this context.
The needs of low income and vulnerable groups and the social equity issues of the ESI program
Analysis of potential risks to the reputability of the AMI program and the ESI scheme in general from inclusion of IHDs.
The use of IHDs as a mechanism for reducing peak demand (as opposed to overall energy reduction)

December 2011 88
10 Selected References
Accenture, The New Energy World – The Consumer Perspective, 2010 [Available at http://www.accenture.com/SiteCollectionDocuments/PDF/Accenture_The_New_Energy_World_The_Consumer_Perspective.pdf]
Accenture, Revealing the Values of the New Energy Consumer, 2011 [Available at http://www.accenture.com/SiteCollectionDocuments/PDF/Resources/Accenture_Revealing_Values_New_Energy_Consumer.pdf]
Advanced Metering Infrastructure, Minimum AMI Functional Specification (Victorian) Release 1.1 , September 2008 [Available at http://dpi.vic.gov.au/__data/assets/pdf_file/0014/13109/Minimum-AMI-Functionality-Specification-Victoria.pdf] [Visited on 24 September 2011].
The American Council for an Energy Efficient Economy (ACEEE), Advanced Feedback Initiatives and Residential Feedback Programs: A Meta-Review for Household Electricity-Saving Opportunities, June 2010 [Available at http://aceee.org/research-report/e105] [Visited on 23 September 2011].
The American Council for an Energy Efficient Economy (ACEEE), Pilot Evaluation of Energy Savings and Persistence from Residential Energy Demand Feedback Devices in a Hot Climate, 2010 [Available at http://eec.ucdavis.edu/ACEEE/2010/data/papers/2117.pdf] [Visited on 6 October 2011].
Anderson, W. and White, V. Exploring Consumer Preferences for Home Energy Display Functionality, August 2009 [Available at http://www.cse.org.uk/pdf/consumer_preferences_for_home_energy_display.pdf] [Visited on 27 September 2011].
The Australian Communications and Media Authority (ACMA - Commonwealth), Radio Communications (Electromagnetic Radiation – Human Exposure) Standard, 2003 [Available at http://www.comlaw.gov.au/Details/F2011C00165] [Visited on 2 November 2011].
Australian Radiation Protection and Nuclear Safety Agency (ARPANSA - Commonwealth), Radiation Protection Standard for Maximum Exposure Levels to Radiofrequency Fields – 3 kHz to 300 GHz, 2002 [Available at http://www.arpansa.gov.au/pubs/rps/rps3.pdf] [Visited on 2 November 2011]
Australian Taxation Office, Taxation Ruling: Income Tax: Effective Life of Depreciating Assets (applicable from 1 July 2011), 2011 [Available at http://law.ato.gov.au/atolaw/view.htm?docid=TXR/TR20112/NAT/ATO/00001] [Visited on 31 October 2011].
The Brattle Group, BGE’s Smart Energy Pricing Pilot Summer 2008 Impact Evaluation, 2009.
The Brattle Group, The Impact of Informational Feedback on Energy Consumption – A Survey of The Experimental Evidence, 2009. [Available at http://www.brattle.com/_documents/uploadlibrary/upload772.pdf] [Visited 22 September 2011].

December 2011 89
Boyd, J. Keypad Meters: The Northern Ireland Experience, 2008 [Available at http://www.ukerc.ac.uk/Downloads/PDF/Meeting%20Place/Events/2008/05UKcanadademandred/Boyd,%20Jenny.pdf] [Visited 13 October 2011].
Centerpoint, 500 Unit In-Home Display Pilot – Mid Program Review, March 2011 [Available at http://www.smartgridinformation.info/pdf/3274_doc_1.pdf] [Visited on 17 November 2011].
Darby, S, The Effectiveness of Feedback on Energy Consumption, 2006 [Available ay http://www.eci.ox.ac.uk/research/energy/downloads/smart-metering-report.pdf] [Visited on 23 September 2011].
Darby, S. Literature Review for Energy Demand Research Project, 2010 [Available at http://www.ofgem.gov.uk/Sustainability/EDRP/Documents1/SD%20Ofgem%20literature%20review%20FINAL%20081210.pdf] [Visited on 27 September 2011].
Department of Climate Change and Energy Efficiency (Commonwealth), Solar Cities: Catalyst for Change Background Paper, October 2011 [Available at http://www.climatechange.gov.au/publications/solar-cities/catalyst-for-change.aspx] [Visited on 4 November 2011].
Department of Sustainability and the Environment (Victoria), E-Water FAQs, 2011 [Available at http://www.environment.gov.au/settlements/waste/ewaste/faqs/index.html] [Visited 26 October 2011].
Department of Sustainability and Environment, Residential Electricity and Gas Use Data by Statistical Local Area 2004 – 2007 [Available at www.climatechange.vic.gov.au/energyuse] [Visited on 11 November 2011].
Electric Power Research Institute (EPRI), Residential Electricity Use Feedback: A Research Synthesis and Economic Framework, 2009.
Essential Energy Intelligent Network Homepage, 2011[Available at http://www.intelligentnetwork.com.au/content/in-community-bega-valley3.aspx] [Visited on18 October 2011].
The Essential Services Commission (Victoria), Energy Retail Code Version 8, April 2011 [Available at http://www.esc.vic.gov.au/NR/rdonlyres/A20C8B53-B2FF-4750-8C94-87A3FCE26202/0/RIEnergyRetailCodeversion8April201120101101.pdf] [Visited on 26 October 2011]
National Electricity Amendment (Victorian Jurisdictional Derogation, Advanced Metering Infrastructure Roll Out) Rule No 2, 2009 [Available at http://www.aemc.gov.au/Media/docs/Rule%20as%20Made-7d3bdb0e-63da-41e3-a455-db063f3e104c-0.pdf] [Visited on 17 October 2011].
Oakley Greenwood, Benefits and Costs of the Victorian AMI Program, August 2010.

December 2011 90
The Office of Gas and Electricity Markets (OfGem – UK), Industry’s Draft Technical Specifications, August 2011 [Available at http://www.decc.gov.uk/assets/decc/11/tackling-climate-change/smart-meters/2393-smart-metering-industrys-draft-tech.pdf] [Visited on 17 October 2011].
The Office of Gas and Electricity Markets (OfGem – UK), Smart Metering Implementation Programme: In-Home Display, 2011 [Available at http://www.decc.gov.uk/assets/decc/consultations/smart-meter-imp-prospectus/233-smart-metering-imp-in-home.pdf] [Visited on 23 September 2011].
The Office of Gas and Electricity Markets (OfGem – UK), Smart Metering Implementation Programme: Response to Prospectus Consultation Overview Document, March 2011 [Available at http://www.ofgem.gov.uk/e-serve/sm/Documentation/Documents1/SM%20prospectus%20reponse%20overview.pdf] [Visited on 28 September 2011].
The Office of Gas and Electricity Markets (OfGem – UK), Smart Metering Implementation Programme: Response to Prospectus Consultation, Supporting Document 3/5, Design Requirements, 2011 [Available at http://www.decc.gov.uk/assets/decc/Consultations/smart-meter-imp-prospectus/1478-design-requirements.pdf] [Visited on 7 October 2011].
Onzo, Case Studies, 2011 [Available at http://onzo.com/case-studies/] [Visited on 7 November 2011].
OnWorld, Energy Smart Homes – Home Area Networks (HAN), 2009.
PA Consulting, Residential Smart Energy Monitoring Program: Final Report, March 2010 [Available at http://www.capelightcompact.org/library/2010/08/3.31.10-Residential-Smart-Home-Energy-Monitoring-Final-Evaluation-Report.pdf] [Visited on 11 October 2011].
Perth Solar Cities Initiative, In-Home Displays, 2011 [Available at http://www.perthsolarcity.com.au/get-involved/technical-trials/in-home-displays/] [Visited on 27 September 2011].
Pike Research, Home Energy Management, Web Dashboards and Mobile Applications: Market Analysis and Forecasts, 2011.
Queensland Climate Smart Home Initiative, Home Service [Available at http://www.climatesmarthome.com/booknow.html] [Visited on 8 November 2011].
Rossini, G. In-Home Real-Time Display, Customer Feedback from a 30,000 Unit Deployment, April 2009.
Sakry, T. Energy Wise Pilot Project Helps Customers Discover Ways to Save, ABC Newspapers, January 2011 [Available at http://acceleratedinnovationsllc.com/newsfiles/30/EnergyWise-pilot-project-helps-customers-discover-ways-to-save.aspx] [Visited on 12 October 2011].
SilverSpring Networks / Oklahoma Gas and Electricity, Positive Energy Together Results, 2011 [Available at http://www.silverspringnet.com/pdfs/SilverSpring-OGE-Results.pdf] [Visited on 17 October 2011].

December 2011 91
VaasaETT Empower, The Potential of Smart Meter Enabled Programs to Increase Energy and Systems Efficiency: A Mass Pilot Comparison, 2011 [Available at http://www.esmig.eu/press/filestor/empower-demand-report] [Visited on 19 October 2011].
Van Dam, S. S., Bakker, C. A. and Van Hal, J. D. M., Home Energy Monitors: Impact Over the Medium Term, 2010 [Available at http://www.biblioite.ethz.ch/downloads/Monitorin_Impact-medium-term.pdf] [Visited on 6 October 2011].
The Victorian Department of Primary Industry, Advanced Metering Infrastructure: Home Area Network (HAN) Functionality Guideline, 2008.

December 2011 92
11 Glossary
AER – Australian Energy Regulator
A Federal Australian regulatory body within the Australian Competition and Consumer Commission (ACCC). The AER regulates the wholesale electricity market and is responsible for the economic regulation of the electricity transmission and distribution networks nationally.
AP - Accredited Person
In the context of this report, a person or business who is accredited by a relevant authority to sell and install IHDs in customers‘ homes.
AMI - Advanced Metering Infrastructure
The hardware, software and associated systems which are active in measuring, collecting and analysing data from smart meters.
Binding
The process whereby an IHD is linked to a smart meter so that the IHD can draw accurate consumption data from the meter and display it to the customer.
DB - Distributor
In the Victorian context, the network operator that operates the electricity grid infrastructure that distributes generated electricity to customer premises. A distributor enters into agreements with electricity retailers (RBs) to provide electricity services to customers managed by the retailer.
DPI - Department of Primary Industry
A department of the Victorian government with state-wide responsibility for policies and programs relating to agriculture, fisheries, earth resources, energy and forestry.
ESC - Essential Services Commission
An independent Victorian economic regulator of essential services including electricity, gas and water amongst others. The ESC is responsible for developing and administering the ESI Scheme.
ESI - Energy Saver Incentive
A Victoria wide initiative established in the Victorian Energy Efficiency Target Act 2007 which incentivises those activities which result in green house gas abatement in Victoria, leading to the generation of Victorian Energy Efficiency Certificates (VEECs).

December 2011 93
Feedback
Any method of informing a customer of the amount of electricity, water or gas they have consumed over a period of time. Feedback mechanisms can be as simple as standard billing, or as advanced as a real-time, disaggregated breakdown of a resource used in the customer‘s home. An IHD is one type of feedback mechanism.
GHG - Green House Gas
An atmospheric gas which absorbs and emits radiation and are the fundamental cause of the greenhouse effect. Carbon Dioxide (CO2) is one type of green house gas that is produced by electricity generation.
IHD - In-Home Display
Any in-home feedback mechanism that provides whole of house energy consumption information in near real time and with historical comparisons, enabling a customer to better understand and manage their consumption of electricity, gas or water.
Home Area Network (HAN)
A residential local area network (LAN) used for communication between digital devices deployed in the home.
Meta-Study
A study which reviews and analyses the results of multiple energy feedback trials as opposed to a single trial or initiative.
Retailer (RB)
In the Victorian context, a retailer of electricity to residential and commercial customers. A enters into an agreement with a distributor (DB) to receive electricity, manages the customer and issues bills.
Smart Meter
A meter which records consumption of a resource such as electricity, gas or water in intervals of an hour or less and communicates that information back to the utility for monitoring and billing purposes. A smart meter enables two-way communication between the meter and utility.
Trial
A test of an energy feedback mechanism undertaken with real customers with results assessed over time.
December 2011 94
Victorian Energy Efficiency Certificate (VEEC)
A certificate with monetary value generated through the abatement of greenhouse gas emissions in Victoria by an action or initiative. One of the purposes of this report is to calculate the possible number of certificates generated by IHDs.
Victorian Energy Efficiency Target (VEET)
Refer to Energy Saver Incentive.
ZigBee
A specification for high level communication protocols, which transfers data wirelessly over a short range. IHDs may use the ZigBee protocol to communicate with a smart meter.

December 2011 95
12 Appendices
Appendix A1: Literature Review
Trial / Initiative Region
No. of Participants
Length of Trial
(Years)
Final Year of
Trial
Low Average Consumption reduction p.a.
High Average Consumption reduction p.a.
Mid-point Avg.
Abrahamse et al. Groningen Power Study
Europe and UK
189 <1 2007 5.1% 5.1% 5.1%
ACEEE Florida Household Trial
USA 17 <1 2009 7.0% 7.4% 7.2%
Battailo Texas Feedback Study
USA 107 <1 1979 11.0% 12.0% 11.5%
BC Hydro Power Pilot
Canada 68 1 to 2 2007 2.7% 2.7% 2.7%
BC Hydro Power Smart Program
Canada 2,000 <1 2008 8.6% 8.6% 8.6%
Benders et al. Netherlands Estimated Feedback Study
Europe and UK
190 <1 2006 8.5% 8.5% 8.5%
Bittle Illinois Academic Study (Part 1)
USA 30 <1 1979 4.0% 4.0% 4.0%
Bittle Illinois Academic Study (Part 2)
USA 353 <1 1980 9.6% 9.6% 9.6%
Brandon and Lewis feedback Study (UK)
Europe and UK
120 <1 1999 4.3% 12.0% 8.2%
California Utilities Estimated Feedback Trial
USA 270 <1 2006 0.1% 0.1% 0.1%
California Information Display Pilot
USA 61 <1 2004 0.1% 0.1% 0.1%
Carolina Light and Power Real Time Feedback trial
USA 101 <1 1979 12.0% 12.0% 12.0%
City of Anaheim Public Utilities
USA 123 <1 2005 12.0% 12.0% 12.0%

December 2011 96
Trial / Initiative Region
No. of Participants
Length of Trial
(Years)
Final Year of
Trial
Low Average Consumption reduction p.a.
High Average Consumption reduction p.a.
Mid-point Avg.
Connecticut Light and Power 'Plan-it Wisely' Initiative
USA 1,251 <1 2009 0.2% 0.2% 0.2%
Connexus and Energywise Pilot
USA 125 <1 2010 3.0% 5.0% 4.0%
Connexus and Opower Feedback Study
USA 78,492 1 to 2 2009 1.1% 1.9% 1.5%
Country Energy Home Energy Efficiency Trial
Australia 200 1 to 2 2005 8.0% 8.0% 8.0%
Danish Energy / AKF Enhanced Billing Trial
Europe and UK
1500 <1 1992 1.0% 8.0% 4.5%
Florida Solar Energy Centre Real-Time Feedback Study
USA 17 <1 2008 7.4% 7.4% 7.4%
Haakana Daily Feedback Trial Finland
Europe and UK
105 <1 1997 17.0% 21.0% 19.0%
HEMS (Home Energy Management System) Trials
Europe and UK
304 1 to 2 2010 7.8% 7.8% 7.8%
Hydro One Power-Cost Monitor Deployment
Canada 30,000 2+ 2009 5.2% 5.2% 5.2%
Hydro One Real-Time Feedback Pilot
Canada 382 <1 2005 6.5% 6.5% 6.5%
Hydro One Time-of-Use Pilot (IHD Only Pilot)
Canada 81 <1 2007 6.7% 6.7% 6.7%
Hydro One Time-of-Use Pilot (ToU and IHD Services Pilot)
Canada 153 <1 2007 7.6% 7.6% 7.6%
IBM Ontario Energy Board Smart Price Pilot
Canada 498 <1 2007 6.0% 6.0% 6.0%
Kantola Daily Feedback Trial
Australia 118 <1 1997 3.0% 14.0% 8.5%
Kyushu Electric Power Company Feedback Trial
Japan 113 <1 1998 -0.1% -0.1% -0.1%
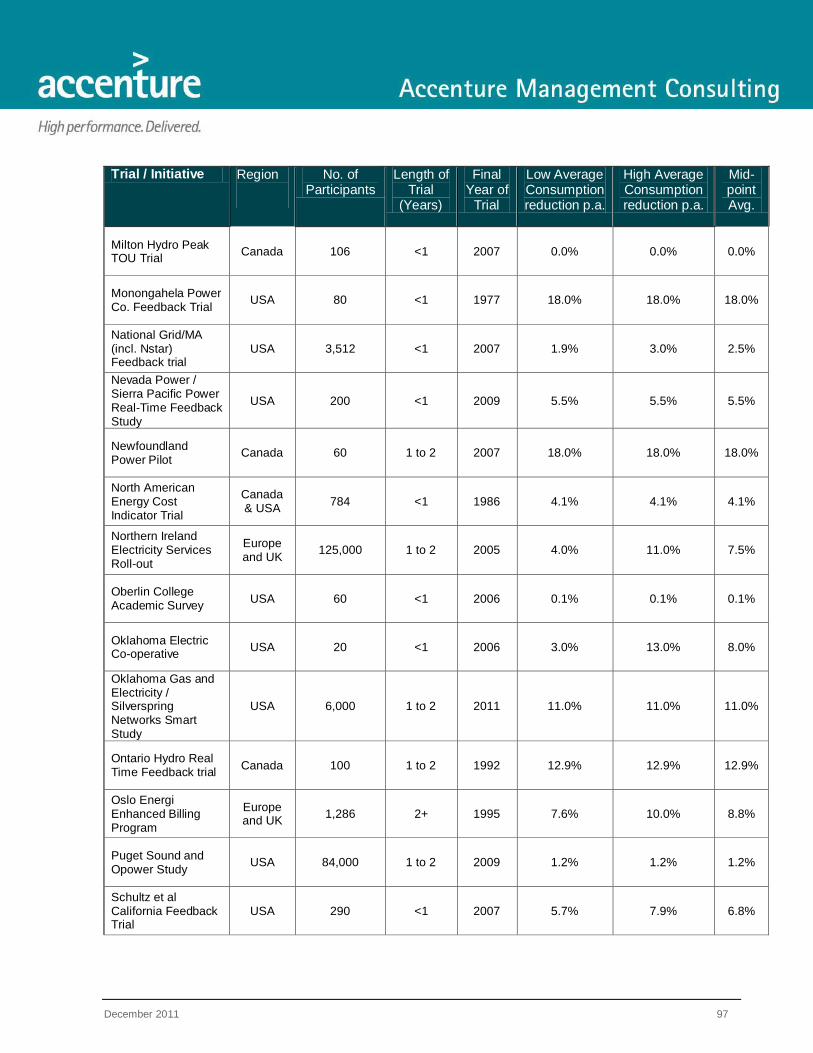
December 2011 97
Trial / Initiative Region
No. of Participants
Length of Trial
(Years)
Final Year of
Trial
Low Average Consumption reduction p.a.
High Average Consumption reduction p.a.
Mid-point Avg.
Milton Hydro Peak TOU Trial
Canada 106 <1 2007 0.0% 0.0% 0.0%
Monongahela Power Co. Feedback Trial
USA 80 <1 1977 18.0% 18.0% 18.0%
National Grid/MA (incl. Nstar) Feedback trial
USA 3,512 <1 2007 1.9% 3.0% 2.5%
Nevada Power / Sierra Pacific Power Real-Time Feedback Study
USA 200 <1 2009 5.5% 5.5% 5.5%
Newfoundland Power Pilot
Canada 60 1 to 2 2007 18.0% 18.0% 18.0%
North American Energy Cost Indicator Trial
Canada & USA
784 <1 1986 4.1% 4.1% 4.1%
Northern Ireland Electricity Services Roll-out
Europe and UK
125,000 1 to 2 2005 4.0% 11.0% 7.5%
Oberlin College Academic Survey
USA 60 <1 2006 0.1% 0.1% 0.1%
Oklahoma Electric Co-operative
USA 20 <1 2006 3.0% 13.0% 8.0%
Oklahoma Gas and Electricity / Silverspring Networks Smart Study
USA 6,000 1 to 2 2011 11.0% 11.0% 11.0%
Ontario Hydro Real Time Feedback trial
Canada 100 1 to 2 1992 12.9% 12.9% 12.9%
Oslo Energi Enhanced Billing Program
Europe and UK
1,286 2+ 1995 7.6% 10.0% 8.8%
Puget Sound and Opower Study
USA 84,000 1 to 2 2009 1.2% 1.2% 1.2%
Schultz et al California Feedback Trial
USA 290 <1 2007 5.7% 7.9% 6.8%
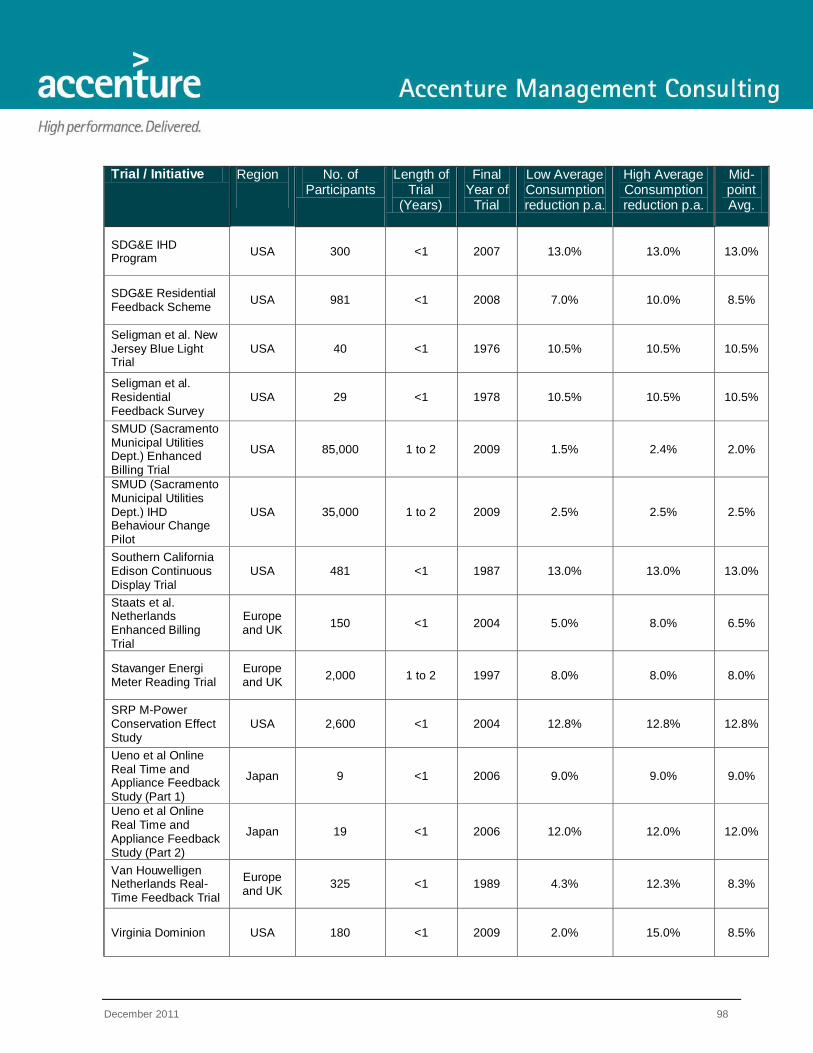
December 2011 98
Trial / Initiative Region
No. of Participants
Length of Trial
(Years)
Final Year of
Trial
Low Average Consumption reduction p.a.
High Average Consumption reduction p.a.
Mid-point Avg.
SDG&E IHD Program
USA 300 <1 2007 13.0% 13.0% 13.0%
SDG&E Residential Feedback Scheme
USA 981 <1 2008 7.0% 10.0% 8.5%
Seligman et al. New Jersey Blue Light Trial
USA 40 <1 1976 10.5% 10.5% 10.5%
Seligman et al. Residential Feedback Survey
USA 29 <1 1978 10.5% 10.5% 10.5%
SMUD (Sacramento Municipal Utilities Dept.) Enhanced Billing Trial
USA 85,000 1 to 2 2009 1.5% 2.4% 2.0%
SMUD (Sacramento Municipal Utilities Dept.) IHD Behaviour Change Pilot
USA 35,000 1 to 2 2009 2.5% 2.5% 2.5%
Southern California Edison Continuous Display Trial
USA 481 <1 1987 13.0% 13.0% 13.0%
Staats et al. Netherlands Enhanced Billing Trial
Europe and UK
150 <1 2004 5.0% 8.0% 6.5%
Stavanger Energi Meter Reading Trial
Europe and UK
2,000 1 to 2 1997 8.0% 8.0% 8.0%
SRP M-Power Conservation Effect Study
USA 2,600 <1 2004 12.8% 12.8% 12.8%
Ueno et al Online Real Time and Appliance Feedback Study (Part 1)
Japan 9 <1 2006 9.0% 9.0% 9.0%
Ueno et al Online Real Time and Appliance Feedback Study (Part 2)
Japan 19 <1 2006 12.0% 12.0% 12.0%
Van Houwelligen Netherlands Real-Time Feedback Trial
Europe and UK
325 <1 1989 4.3% 12.3% 8.3%
Virginia Dominion USA 180 <1 2009 2.0% 15.0% 8.5%
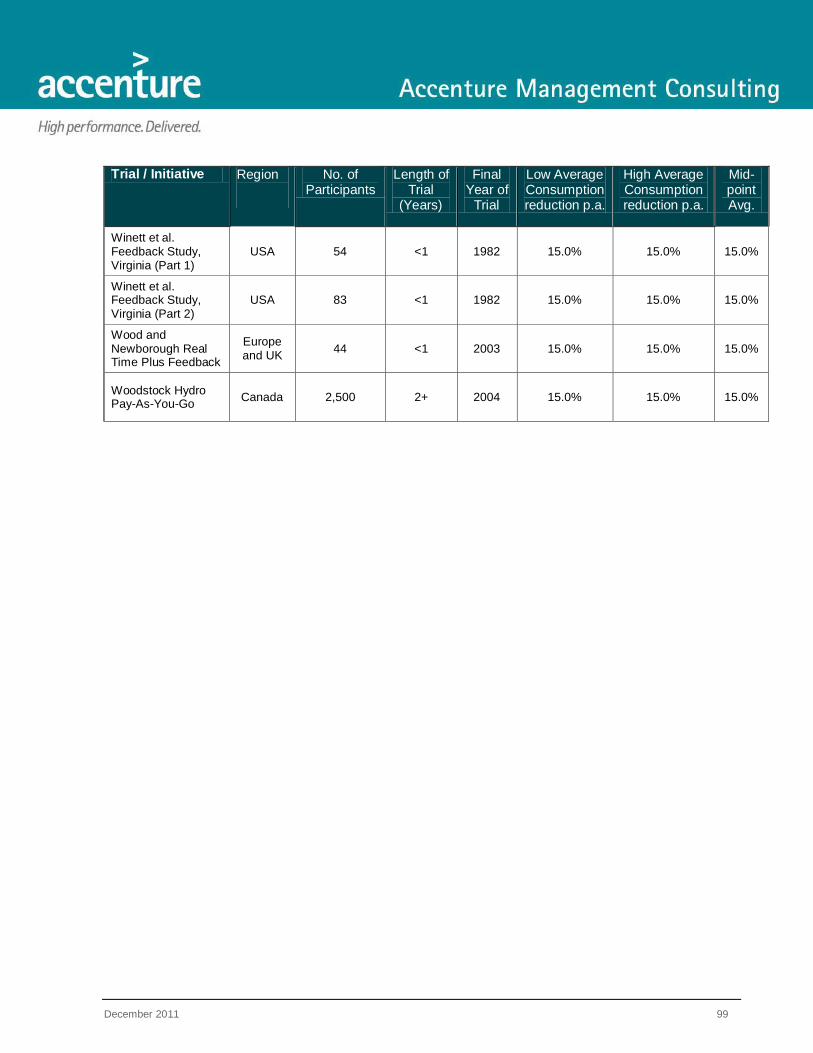
December 2011 99
Trial / Initiative Region
No. of Participants
Length of Trial
(Years)
Final Year of
Trial
Low Average Consumption reduction p.a.
High Average Consumption reduction p.a.
Mid-point Avg.
Winett et al. Feedback Study, Virginia (Part 1)
USA 54 <1 1982 15.0% 15.0% 15.0%
Winett et al. Feedback Study, Virginia (Part 2)
USA 83 <1 1982 15.0% 15.0% 15.0%
Wood and Newborough Real Time Plus Feedback
Europe and UK
44 <1 2003 15.0% 15.0% 15.0%
Woodstock Hydro Pay-As-You-Go
Canada 2,500 2+ 2004 15.0% 15.0% 15.0%

December 2011 100
Appendix A2: Trials Reviewed without Consumption Savings
Trial / Initiative Region No. of Participants
Length of Trial
(Years)
Final Year of Trial
Reason for Exclusion from Further Review
Adelaide Solar Cities Initiative
Australia Unknown 2+ Indefinite No consumption saving
data yet published.
Boulder, CO: Smart City Program
USA Unknown 1 to 2 2011 No consumption saving
data yet published.
Cape Light Residential Smart Energy Monitoring Scheme
USA 100 <1 2009
Unable to verify trial results.
(Note: Trial initially reported 9.3%
consumption saving).
Climate Smart Home Initiative
Australia 300,000
(currently) 2+ Indefinite
No consumption saving data yet published.
Edmond Municipal Electric Co. Enhanced Billing
USA 420 Unknown Unknown No results publically
available
Electricity Smart Customer Behaviour Trials
Europe and UK
3,958 <1 2011 No results publically
available
Essential Energy Intelligent Network Trial
Australia 2,000 2+ Indefinite No consumption saving
data yet published.
Integral / Energy Australia TOU Pilot
Australia 900 1 to 2 2012 No results publically
available.
LG&E Responsive Pricing / Smart Metering Program
USA 150 2+ 2011 No consumption saving
data yet published.
Perth Solar City Initiative
Australia Unknown 2+ 2015 No consumption saving
data yet published.
PowerCents DC Program
USA 900 <1 2010 No results publically
available
Ontario Energy Board Smart Price Pilot
Canada 375 <1 2007 No results publically
available
PSG&E MyPower Sense Pricing Segments Evaluation
USA 379 1-2 2007 No results publically
available.

December 2011 101
Trial / Initiative Region No. of Participants
Length of Trial
(Years)
Final Year of Trial
Reason for Exclusion from Further Review
Singapore HAN Pilot Program
Singapore 1,000 1 to 2 2011 No consumption saving
data yet published.
TXU Energy SureValue 24
USA 500 2+ Ongoing No consumption saving
data yet published.
WhirlPool WoodBridge Study
USA 4 Unknown Unknown No results publically
available

December 2011 102
Appendix B: Calculation of Trial relevance and Market relevance
Trial Relevance (TR) Calculation:
Trial relevance measured the applicability of the trial parameters to the Victorian context based on six criteria. The score out of six was made up of the following components:
• 1 point was awarded if the trial occurred in the past five years, to give greater weight to more recent trials as the technology underpinning IHDs is constantly evolving.
• 1 point was awarded if the trial lasted over 1 year in duration, giving greater weight to those trials which tested results over the four seasons.
• 1 point was awarded if the trial was opt-in (as opposed to opt-out) as any rollout of IHDs in Victoria is expected to be opt-in.
• 1 point was awarded if the number of trial participants was higher than 200, reflecting the tendency of trials to test a small number of participants and so giving greater weight to large trials with statistically significant numbers of participants.
128
• 1 point was awarded if the trial if the trial tested a real-time IHD as opposed to other feedback mechanism such as feedback provided at a set time daily.
• 1 point was awarded if the trial tested the IHDs impact in isolation as opposed to along with other incentives such as time-of-use pricing or pre-payment.
Each trial was given a TR score out of 6 in this manner.
Market Relevance (MR) Calculation:
Market relevance measured the applicability of realities of the market in which the trial was held to the Victorian context based on four criteria (e.g., if the trial was held in Japan, how analogous are the market and customer conditions in that particular region of Japan to Victoria). The score out of four was made up of the following components:
• 1 point was awarded if the climate in the trial‘s market was temperate and not subject to temperature extremes or lay within tropical climates.
129
• 1 point was awarded if the market structure in the trial‘s location similar to that in Victoria with regard to disaggregation of energy providers.
• 1 point was awarded if market in which the trial took place afforded similar levels of trust to their energy utilities, and were therefore as likely to act upon utility messages, as Australians.
130
128
VaasaETT found that larger trials with over 1000 participants were as successful in driving behaviour change as smaller trials, though very large trials of tens of thousands did experience slightly lower savings due possibly to these predominantly opt-out trials providing less information with their devices. See VaasaETT Empower, The Potential of Smart Meter Enabled Programs to Increase Energy and Systems Efficiency: A Mass Pilot Comparison, 2011, p. 65. 129
This criterion was interpreted generously reflecting the large number of trials concentrated in Europe and North America. Coastal or littoral climates in North America were considered to be temperate, while Scandinavian and Mid-Western American climates were
considered to be extreme. Some North American studies particularly had adjusted their results allowing for climate (e.g. electric heating was exempt from the study in colder months and in these cases the trial was awarded a point.
December 2011 103
• 1 point was awarded if customers in the trial‘s market placed a similar amount of value on receiving an ‗information display‘ as Australian customers.
131
Each trial was given a MR score out of 4 in this manner.
130
In this case, global Accenture research was used to assess how alike Australia the trial‘s market was. A market was deemed to be
‗similar‘ to Australia if the % of customers who trusted their utility lay within half a standard deviation of the 23% recorded in Australia in 2011. See Accenture, Revealing the Values of the New Energy Consumer, 2011, p. 14. 131
A market was deemed to be ‗similar‘ to Australia if the ‗importance‘ placed on this feature lay within half a standard deviation of the 7% it received in Australia (when compared with other features such as loyalty rewards, in 2011. See Ibid, p. 21.

December 2011 104
Appendix C: Retailer Issues raised during consultation process
Issue Sub-Issue Section Addressed
Need to maintain competitive neutrality / level playing field
DB may use regulated revenue to roll out IHDs and acquire VEECs
Section #8 – Regulatory and Legislative Considerations DBs may disadvantage retailers by charging them too
much for their services
APs should abide by same obligations as retailers with respect to IHD sales
Need to define robust processes / structures / specifications
The industry may not be able to inform and educate consumers correctly, leading to lost goodwill. This could occur if IHDs become available too quickly, or if third party AP‘s are involved (i.e the IHD rollout is not retailer led)
Section #9 Potential Supplementary Concerns
Future additional technology benefits may not be able to be realised if the existing rollout fails to adequately balance current and future needs.
Need to strike the appropriate balance between well defined specifications to enable service delivery, yet not too onerous to restrict the market operating effectively
Section #6 Minimum Specifications
Impost on retailers through new services
Retailers may have to do extra work – e.g. increased number of inbound calls due to pricing, devices not working, etc
Section #7.4.2 Sale and Registration
Table 28: Issues Raised by Retailers

December 2011 105
Appendix D: Deeming Calculation & VEET Activity Modelling
The following details the deeming and VEET activity modelling calculations for the installation of an IHD in a Victorian household. Separate calculations are show for households with access to reticulated gas, and households without access to reticulated gas. Detailed discussion of assumptions and methodology can be found in Section #5 above.
Details of recognised standards
At present there are no existing Australian Standards that apply to IHDs. Standards Australia are currently reviewing IHDs as part of their Smart Grid Working Group.
132
This activity is based on the installation of an IHD which meets the minimum specifications defined in Section #6:
Households with access to reticulated gas
Estimated annual and lifetime savings achieved
Input Data/Assumptions
Annual Household Electricity Consumption (kWh / yr) 5,882
Percentage Reduction in Household Consumption due to IHD (%) 6.6%
Average Lifetime of IHD (yrs) 5
Discount factor (% of benefit attributable to VEET) 100%
Calculation
Estimated electricity saving per annum (kWh / yr) for installing an IHD
= 5,882 x 6.6%
= 388.2
Estimated lifetime electricity savings (kWh)
= 388.2 x 5
= 1,941.1
Estimated lifetime electricity saving (kWh) taking into account the discount factor
132
From discussions with Rikki Pearce from Standards Australia, 25 October 2011

December 2011 106
= 1,941.1 x 100%
= 1,941.1
Estimated number of VEET certificates
Calculation
To calculate estimated lifetime greenhouse abatement, lifetime electricity savings are multiplied the standard VEET greenhouse coefficients.
Estimated lifetime greenhouse abatement
Electricity saving
(kWh) GHG
Coefficient GHG
saving (kg) VEECs Reg
Factor
Electricity – Vic average 1,941.1 0.963 1869 1.87*
Electricity – Melbourne 1,941.1 0.945 1834 1.83 0.98
Electricity - Regional Victoria 1,941.1 0.999 1939 1.94 1.04
Estimated lifetime greenhouse abatement, taking into account the discount factor
Electricity saving
(kWh) GHG
Coefficient GHG
saving (kg) VEECs Reg Factor
Electricity - Vic average 1,941.1 0.963 1869 1.87*
Electricity – Melbourne 1,941.1 0.945 1834 1.83 0.98
Electricity - Regional Victoria 1,941.1 0.999 1939 1.94 1.04
*In keeping with DPI practice, this number of VEECs will be rounded to the nearest whole (2) for further calculations.

December 2011 107
Estimated payback period (without VEET)
The following calculations were completed with an example IHD item cost of $150.
Input Data/Assumptions
Average Blended Electricity Price 2012 - 2014 ($/kWh)
0.25
Cost per IHD ($) – Example Cost Only 150.0
Installation Cost per IHD ($) 30.0
Installed Cost of IHD ($) 180.0
Electricity saving per annum (kWh/yr) 388.2
Calculation
Estimated dollar saving per annum ($ / yr) for installing an IHD
= 388.2 x 0.25
= 97.05
Estimated payback period without VEET (yrs)
= 180 / 97.05
= 1.85
Calculation of available certificate value
Input Data/Assumptions
Marginal certificate price ($/certificate) 35
ESC fee ($/certificate) 1
Certificate creator administrative overheads
(% of (marginal certificate price – ESC fee))
10%

December 2011 108
Calculation
Available certificate value = marginal certificate price - ESC fee - administrative overheads
= $35 - $1 – (10% x $35)
= $30.5
Calculation of incentive generated
Input Data/Assumptions
Installed Cost of IHD ($) 180
Rounded certificates generated for installation (certificates / unit) 2
Available certificate value ($) 30.5
Incentive generated = available certificate value x certificates/unit
= 30.5 x 2
= 61
Incentive generated over incentive costs
= 61 / 180.00
= 34%

December 2011 109
Households without access to reticulated gas
Estimated annual and lifetime savings achieved
Input Data/Assumptions
Annual Household Electricity Consumption (kWh / yr) 7,765
Percentage Reduction in Household Consumption due to IHD (%) 6.6%
Average Lifetime of IHD (yrs) 5
Discount factor (% of benefit attributable to VEET) 100%
Estimated base energy saving per annum (kWh / yr) for installing an IHD
= 7,765 x 6.6%
= 512.5
Estimated lifetime base energy savings (kWh)
= 512.5 x 5
= 2,562.5
Estimated lifetime base energy saving (kWh) taking into account the discount factor
= 2,562.5 x 100%
= 2,562.5
Estimated number of VEET certificates
To calculate estimated lifetime greenhouse abatement, lifetime electricity savings are multiplied the standard VEET greenhouse coefficients.

December 2011 110
Estimated lifetime greenhouse abatement
Electricity saving
(kWh) GHG
Coefficient GHG
saving (kg) VEECs Reg Factor
Electricity – Vic average 2,562.5 0.963 2468 2.47*
Electricity – Melbourne 2,562.5 0.945 2422 2.42 0.98
Electricity - Regional Victoria 2,562.5 0.999 2560 2.56 1.04
Estimated lifetime greenhouse abatement, taking into account the discount factor
Electricity saving (kWh)
GHG Coefficient
GHG saving (kg) VEECs Reg Factor
Electricity - Vic average 2,562.5 0.963 2468 2.47*
Electricity - Melbourne 2,562.5 0.945 2422 2.42 0.98
Electricity - Regional Victoria 2,562.5 0.999 2560 2.56 1.04
*In keeping with DPI practice, this number of VEECs will be rounded to the nearest whole (2 for Melbourne and 3 for regional Victoria) for further calculations.
Estimated payback period (without VEET)
The following calculations were completed with an example IHD item cost of $150.
Input Data/Assumptions
Average Blended Electricity Price 2012 - 2014 ($/kWh)
0.25
Cost per IHD ($) 150.0
Installation Cost per IHD ($) 30.0
Installed Cost of IHD ($) 180.0
Electricity saving per annum (kWh/yr) 512.5

December 2011 111
Estimated dollar saving per annum ($ / yr) for installing an IHD
= 512.5 x 0.25
= 128.12
Estimated payback period without VEET (yrs)
= 180 / 128.12
= 1.40
Calculation of available certificate value
Input Data/Assumptions
Marginal certificate price ($/certificate) 35
ESC fee ($/certificate) 1
Certificate creator administrative overheads
(% of (marginal certificate price – ESC fee))
10%
Calculation
Available certificate value = marginal certificate price - ESC fee - administrative overheads
= $35 - $1 – (10% x $35)
= $30.5
Calculation of incentive generated
Input Data/Assumptions
Installed Cost of IHD ($) 180
Rounded certificates generated for installation (certificates / unit) 2
Available certificate value ($) 30.5
December 2011 112
Incentive generated = available certificate value x certificates/unit
= 30.5 x 2
= 61
Incentive generated over incentive costs
= 61 / 180
= 34%

December 2011 113
Appendix E: Key Criteria for Certificate Calculation Methodology
Criteria How this is achieved
Simplicity
Employs a conventional approach, consistent with the methodology used for Regulation Impact Statements relating to energy efficiency activities. Energy savings are calculated in reference to a business-as-usual (BA) benchmark.
In general, the BAU energy benchmarks used as the basis for estimating savings remain constant during each VEET phase (the exception is when MEPS are introduced or upgraded mid-phase). Certificates are allocated on the basis of the energy savings achieved in reference to this benchmark, multiplied by the expected life of the activity.
In situations where a particular energy service is saved (eg shower rose create hot water saving; insulation and weather proofing create heating saving), the weighted average equipment stock is used as the basis for estimating greenhouse abatement, rather than specifying different abatement levels for different fuel/equipment types. (This approach has been taken to reduce the complexity and cost associated with verifying the equipment type in each home, and to reduce potential gaming.) Where appropriate, the calculations also recognise differences in the equipment stock between Melbourne and Regional Victoria.
The weighted average building stock is used as the basis for estimating savings from high efficiency heating and cooling systems.
Utilise recognised and reliable data
Published data on the typical life of appliances and equipment is used where available – eg BIS Shrapnel household appliance reports, Energy Efficient Strategies‘ residential baseline model, Regulation Impact Statements.
In situations where existing equipment is replaced with more efficient equipment, published data on the sales weighted average of new equipment sold is used as the basis for estimating the savings wherever possible.
Reputable: Certificates allocated for a particular activity provide a good estimate of the abatement achieved for the average household in which the activity is undertaken
In situations where a particular energy service is saved (eg hot water saving, insulation and weather proofing), the weighted average equipment stock is used as the basis for estimating greenhouse abatement, rather than specifying different abatement levels for different fuel/equipment types. Where appropriate (heating, cooling, water heating), the calculations also recognise differences in the equipment stock between Melbourne and Regional Victoria.
The weighted average building stock is used as the basis for estimating savings from high efficiency heating and cooling systems. Heating and cooling systems are classified into different capacity ranges (small, medium & large), and the savings

December 2011 114
are based the typical floor area which can be heated or cooled by each size range. Different locations in Victoria are allocated to three different climate zones – mild (eg Melbourne), cold (eg Ballarat) and hot (eg Mildura) – to take into account the impact of climate on the savings.
Average hot water consumption in existing homes is used as the basis for estimating savings from high efficiency or low greenhouse water heating systems. Where appropriate, a distinction is made between small and large households, to take into account the differences in the daily hot water task.
Sales weighted averages are used as the BAU benchmark when high efficiency equipment is replacing existing equipment.
Justify additionality and address free rider effects
Lifetime savings estimates are based on the average expected life of the energy efficiency activity. Where there is some uncertainty (eg insulation or double glazing) a conservative approach has been taken.
Sales weighted averages of new products are used as the basis for estimating the savings when high efficiency equipment is replacing existing equipment – this means that only equipment which is more efficient than the sales weighted average will generate certificates.
Minimum eligibility criteria have been specified for high efficiency appliances, and these are somewhat higher than the sales weighted average. This creates an ‗efficiency gap‘ which also helps to reduce free riders.
The ‗rebound effect‘ should be considered in calculations where relevant. For example in the existing low flow shower rose algorithm the length of showers is slightly increased after low flow shower roses are installed. This is based on available research data.
Incentivise innovation: Where appropriate and possible, certificate values should recognise higher efficiency and greater capacity products
Where an existing water heater is replaced by a solar or heat pump water heater, data from Australian Standards tests is used to estimate the savings for solar water heaters in relation to a reference water heater.
Calculations for energy efficient or low greenhouse water heaters replacing an existing system take into account the differences in hot water task for small and large households.
Calculations for high efficiency heating and cooling systems take into account the output capacity of the heating/cooling system. Heating/cooling equipment is grouped into three size ranges – small, medium and large – and the savings calculations are based on the typical floor area which can be heated or cooled by each size range.
Where possible (eg fridges and freezers), energy rating algorithms are to estimate
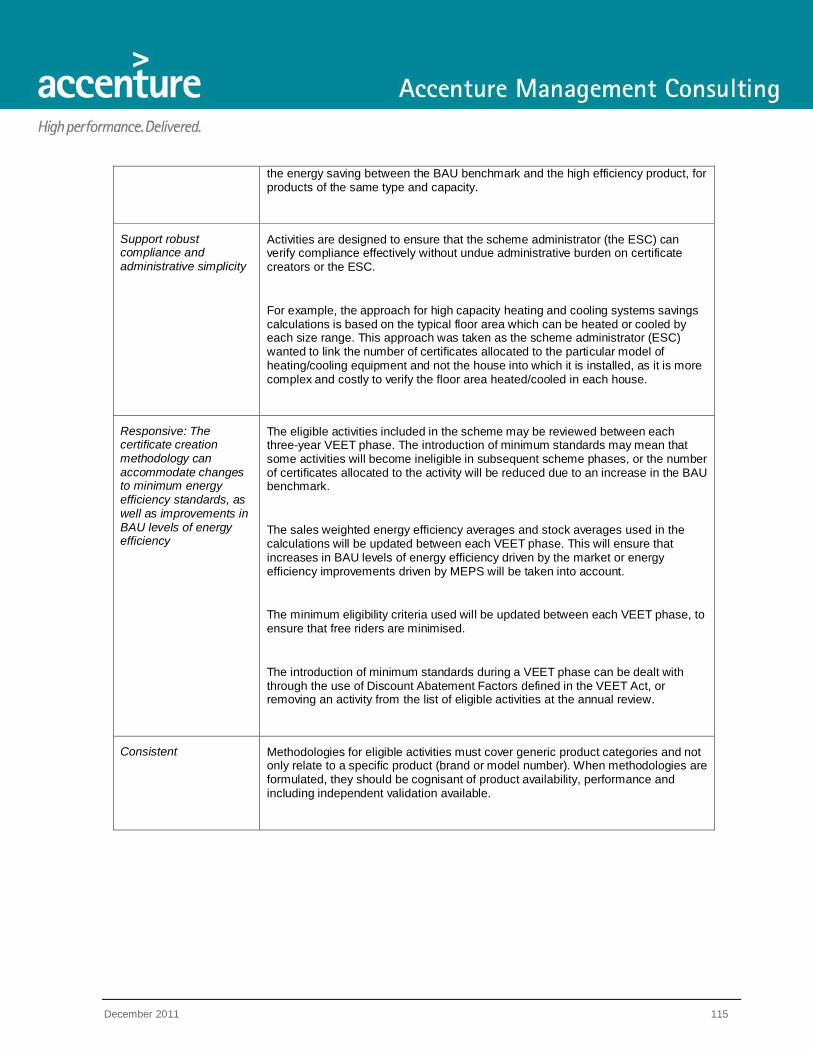
December 2011 115
the energy saving between the BAU benchmark and the high efficiency product, for products of the same type and capacity.
Support robust compliance and administrative simplicity
Activities are designed to ensure that the scheme administrator (the ESC) can verify compliance effectively without undue administrative burden on certificate creators or the ESC.
For example, the approach for high capacity heating and cooling systems savings calculations is based on the typical floor area which can be heated or cooled by each size range. This approach was taken as the scheme administrator (ESC) wanted to link the number of certificates allocated to the particular model of heating/cooling equipment and not the house into which it is installed, as it is more complex and costly to verify the floor area heated/cooled in each house.
Responsive: The certificate creation methodology can accommodate changes to minimum energy efficiency standards, as well as improvements in BAU levels of energy efficiency
The eligible activities included in the scheme may be reviewed between each three-year VEET phase. The introduction of minimum standards may mean that some activities will become ineligible in subsequent scheme phases, or the number of certificates allocated to the activity will be reduced due to an increase in the BAU benchmark.
The sales weighted energy efficiency averages and stock averages used in the calculations will be updated between each VEET phase. This will ensure that increases in BAU levels of energy efficiency driven by the market or energy efficiency improvements driven by MEPS will be taken into account.
The minimum eligibility criteria used will be updated between each VEET phase, to ensure that free riders are minimised.
The introduction of minimum standards during a VEET phase can be dealt with through the use of Discount Abatement Factors defined in the VEET Act, or removing an activity from the list of eligible activities at the annual review.
Consistent Methodologies for eligible activities must cover generic product categories and not only relate to a specific product (brand or model number). When methodologies are formulated, they should be cognisant of product availability, performance and including independent validation available.

December 2011 116
Appendix F: Summary of Submissions to Discussion Paper
Following a public presentation on 22nd
November 2011, public submissions were invited to comment on this discussion paper. A total of 14 submissions were received by the due date of 12
th December. These are
listed below:
All submissions supported the inclusion of IHDs into the Energy Saver Incentive scheme, and broadly
agreed with the conclusions reached in the discussion paper. The key themes from the submissions were:
A call for the DPI to consider other forms of information provision, particularly those from web
portals, as new activities
Detailed feedback on minimum specifications
The need for care to be taken to ensure a positive customer experience
Recommendation from retailers that HAN services provided by distributors should not be regulated
A discussion on privacy concerns and whether persons other than the registered electricity account
holder should be able to approve the purchase and binding of an IHD
Some submissions argued for Accredited Persons to participate in the Victorian Energy
Ombudsman scheme (EWOV)
This report was updated following a review of all submissions. Some suggestions (such as the addition of extra activities in the ESI scheme) were out of scope of this report and have been passed on to the DPI for consideration. Some suggestions were not accepted and the recommendations in the report remain as they are. The key changes made to this report arising from the submissions are summarised below:
Minimum Specifications
The majority of submissions approved of the minimum features and minimum specifications in this report. Some IHD manufacturers suggested that from initial inspection their products would meet these minimum specifications. However a number of suggestions were made and these changes have been made:
Secure Australasia Ptd Ltd Econol Pty Ltd
TRUenergy Pty Ltd Billcap Pty Ltd
AGL Energy Ltd Wattwatchers
Origin Energy Retail Ltd SmartNow (OzGram Pty Ltd)
Moreland Energy Foundation and Alternative Energy Association (joint submission) Energy Retailers Association of Australia
Graham Armstrong National Electrical and Communications Association (NECA)
Opower

December 2011 117
o Battery Life: In the event that an IHD requires a battery to operate, it was suggested that a
replacement battery life of at least 5 years be required. This refers to the time required
before the battery requires physical replacement, and so allows for rechargeable / cradle-
based devices.
o Power Draw: Clarification that power draw referred to the incremental power draw (that is,
the additional power draw over and above what an existing device might be using already,
if the IHD was attached to it).
o Accuracy: Clarification of the testing process for CT Clamp On IHDs.
Another suggestion was to relax the data security requirements for non-ZigBee IHDs, commensurate with the lesser consequences if that data security was breached compared to a ZigBee IHD. We evaluated this suggestion and felt that whilst the argument appeared to have some merit, the proposed alternative was too loosely worded and non-standards based. As such it would be difficult for the ESC to regulate. There were a number of other suggestions made that were deemed to be sufficiently and properly dealt with in the report already, or for which insufficient evidence was produced to justify changes.
Regulation of HAN services
Retailers argued in their submissions for no regulation to be placed on binding services until there was clear evidence of market failure and overcharging of services by distributors. Consumer advocacy groups argued for regulation as a preventative measure and put forward the view that historically services have been overcharged unless regulation was put in place. Accenture has highlighted this as an issue for the DPI and we have commented on the likely effort required by distributors when these services are further automated.
The proper authorising party for IHDs
Some retailers argued that only the registered account holder should be able to purchase and bind an IHD through the ESI scheme, to reduce the chance of unauthorised parties from gaining access to a customer‘s personal meter data information. Accenture believes this privacy issue is important, but also has recommended that excessive administrative processes should not be applied to this activity, which could reduce customer acceptance and take-up of IHDs. Accenture has recommended a potential way forward which balances these concerns, but recommends that this be reviewed during the life of the scheme.
Membership of the Victorian Energy Ombudsman Scheme
Retailers argued that Accredited Persons selling IHDs should participate in the Victorian Energy Ombudsman Scheme, in order to provide customers with recourse to an ombudsman in the event of identified issues. Accenture believes that our initial analysis still stands, and that consumers having recourse to standard consumer protection law, as well as the ESC having the ability to put pressure on and revoke the accreditation of APs in the event of improper AP conduct, provides sufficient protection for consumers. We have added a point of clarification into the report that the ESC has the ability to revoke or suspend AP‘s.
The role of ongoing energy education

December 2011 118
Some submissions argued against the finding that ongoing energy education had a ―negligible‖ impact on consumer behavioural change, and pointed out that some conflicting evidence was available. Accenture is still of the opinion that the finding (primarily drawn from the VassaETT meta-study)
133
is valid on the balance of probabilities, however acknowledges that there does exist some conflicting evidence. As such we have reworded that finding accordingly. Accenture also notes that some submissions misinterpreted this section of the report and were concerned that the report suggested that energy education had no part to play in consumer behavioural change. This is not the case. This report argues that we have found no significant evidence that ongoing energy education has any significant impact for assisting in overall consumption reduction when using IHDs. Initial education is necessary to assist customers when first using the IHD, however we found no convincing evidence that ongoing education is necessary. There is significant evidence (including in the VaasaETT meta-study) that ongoing education is required in pricing trials to enable the reduction of peak demand and assist customers when put on flexible pricing arrangements. Peak demand and pricing were not in scope for this report, and as such were not discussed.
Comments on the trials reviewed and the statistical accuracy of findings
One submission in particular from an energy feedback vendor commented on the trials reviewed and the statistical accuracy of findings. It was argued that the wide variation in results obtained in the global trials, and the lack of information available regarding the statistical rigour of each trial, made it desirable to conduct a Victorian trial following rigorous measurement and verification principles to ascertain the savings that could be made. Accenture disagrees with the necessity for this to occur prior to inclusion in the ESI scheme, although we do believe that the DPI should, in the next review of the program, take into account the results of this phase and then adjust the parameters as required. Whilst ideally a controlled statistically rigorous trial would be conducted, this has not been the approach of any other deemed registered activity in the ESI scheme to date. Regarding the potential lack of statistical rigour in some of the trials, we point out that this exercise was a desktop literature review and as such we were unable to investigate in detail the methodologies employed by each trial or pilot. However where obvious methodological flaws were discovered, that was taken into account in our scoring mechanism for trial relevance. A recent Irish trial
134 not included in our report was brought to our attention by one submission. We
evaluated the trial and found it did not materially affect the overall electricity consumption reduction finding. In particular, it did not affect the final VEECs assigned. As such we did not update the report to include it.
Other changes that were made to the report include:
Update of electricity prices to $0.25/kWh for purposes of payback period calculation
Correction of miscellaneous typographical errors
Minor re-wording of sections where submissions suggested that the meaning was unclear
133
VaasaETT Empower, The Potential of Smart Meter Enabled Programs to Increase Energy and Systems Efficiency: A Mass Pilot
Comparison, 2011, p. 38. 134
Commission for Energy Regulation, Electricity Smart Metering Customer Behaviour Trials (CBT) Findings Report, 2011

December 2011 119
Appendix G: Process Flows for Key IHD Lifecycle Processes
29/11/2010 v0.1
IHD Device Accreditation – Process Flow
Dis
trib
utio
n B
usin
ess
Accre
dita
ted
Pe
rso
ns
(AP
)
Esse
ntia
l S
erv
ice
s C
om
mis
sio
n
(ES
C)
Start
AP Applies For New
Device
30
40
Sufficient Evidence that
IHD Meets Minimum
Specification?
No
AP Informed of Non
Approved Device
80
50
Is the IHD Zigbee ?
AP Informed of
Approved Device
100
Device Added to
VEET Register of
Certified IHD‘s
90
DB informed of New
IHD Device
60
Run Zigbee IHD Trial
for New IHD Device
70
No
YesYes
End
AP identifies New IHD
10
AP Confirms Product
Meets Minimum
Specifications
(Incl. Zibee Cert.)
20

December 2011 120
IHD Registration – Process Flow
Cu
sto
me
rD
istr
ibu
tio
n B
usin
ess‘s
Re
gis
tere
d E
lectr
icia
nA
ccre
dita
ted
Pe
rso
ns
(AP
)
Esse
ntia
l S
erv
ice
s
Co
mm
issio
n
(ES
C)
Start
AP Sells Approved IHD
Devices
10
AP Collects Customer
Information & Confirms
Eligibility
20
AP Provides Customer
with Information to
comply with Minimum
Information Standards
30
80
Does Device Require
Binding ?
50
Does Device Require
REC for Installation?
REC Installs Device
and Provides
Paperwork to AP
70
AP Arranges
Electrician to Install
Device
60
Customer Purchases
IHD Devices
40
AP Sends Binding
Information to Relevant
DB
95
100
IHD Device Binds ?
AP Informed Of
Successful Bind
130
AP Informed Of
UnSuccessful Bind
110
Binding Exception
Process Initiated
120
AP Applies to
ESC for VEEC‘s
140
Provide list of
successful AP IHD
Bind Requests.
(Monthly)
150
ESC Confirms
Information
Requirements Met
160
VEEC‘s Issued
170
AP Receives VEEC‘s
180
Finish
Yes
No
Yes
No
Start
AP Confirms
Registered Account
Holder
90

December 2011 121
IHD Usage – Faulty IHD – Process Flow
Cu
sto
me
rA
ccre
dita
ted
Pe
rso
ns
(AP
)D
istr
ibu
tio
n B
usin
ess
Start
Informs customer of
payment if DB trip is
wasted
50
40
Determine If DB site
visit required
DB Visit
80
Executes
TroubleShooting
Process
30
60
Customer wants to
Proceed?
Inform AP of Outcome
90
Arrange Site Visit
70
AP Verifies Details
20
Customer Calls AP
10
100
Invoice Site Visit?
Pay DB Invoice
160
Invoice AP
110
Invoice Customer
120
Customer Receives
Invoice
130
Yes
Yes
Pay Invoice
140
Process Payment
150
Process Payment
170
Finish
Finish
No
Finish
No Finish
No

December 2011 122
IHD De-Registration – Process Flow
Cu
sto
me
rR
eta
iler
Dis
trib
utio
n B
usin
ess
Customer
Initiates Move
Out
10
Start
DB Informed of
Move Out
40
Retailer
Informed of
Move Out
20
DB De-Registers
All Devices
50
Finish
Inform
DB of Move Out
30
Customer Moves
Out
60
Finish


