49
Deposit Return Evidence Summary Prepared by: Zero Waste Scotland Date: June 2017
Deposit Return Evidence Summary Prepared by: Zero Waste Scotland Date: June 2017
Deposit Return Evidence Summary, June 2017
2
Contents 1 Background and Scope 4
2 Current recycling rates for targeted containers in Scotland 6
2.1 Summary 6
2.2 Why do we quote a range rather than a single figure? 6
2.3 What sources have we used to reach our estimate? 7
2.4 Estimated Recycling Rate for Plastic Bottles 8
2.5 Estimated Recycling Rate for Glass Bottles 9
2.6 Estimated Recycling Rate for Aluminium Cans 10
2.7 Estimated Recycling Rate for Steel Cans 11
3 Potential deposit return system on local authority kerbside collection costs 12
3.1 Introduction 12
3.2 Key Findings 12
3.3 Financial Implications of an Established Deposit Return System 13
3.4 Comparison to Third Party Studies 19
3.5 Financial and Logistical Implications of Transition 21
4 Potential anti-litter impacts of a deposit return system 23
4.1 Summary 23
4.2 What variables have to be considered in reaching an estimate? 23
4.3 How did we arrive at our estimate? 24
4.4 Adding it all up 26
5 Potential implications of a deposit return system for consumers 27
5.1 Summary 27
5.2 Valuing the public’s contribution 27
5.3 Other implications of a deposit return system for consumers 30
6 Potential implications of a deposit return system for manufacturers and retailers 31
6.1 Overview 31
6.2 Cost estimate breakdown 31
6.3 Hygiene considerations around deposit return system design 35
7 Potential implications of a deposit return systems for material prices and quality 36
7.1 Summary 36
7.2 Detailed discussion 36
Appendix 1: Detailed assumptions behind local authority collection cost modelling 39
Material Flows: How much of each material type is the targeted items? 39
Deposit Return Evidence Summary, June 2017
3
Material Flows: How much of each material and targeted item exists in the waste system? 40
Cost factors used 41
Appendix 2: Tables showing range of estimates achieved with different assumptions around litter costs 44
Appendix 3: Detailed calculation of the value of the public’s contribution to a deposit return system 45
Acknowledgements
Zero Waste Scotland would like to thank the wide range of stakeholders who have contributed to the evidence gathering process.

Deposit Return Evidence Summary, June 2017
4
1 Background and Scope A deposit return system is one where consumers pay a small amount of money in addition to the purchase price at point of sale; this money is then returned to them if they choose to return the item after use. In the case of drinks, the deposit is paid for the container, and redeemed when the empty container is returned for recycling to a designated collection point (typically a shop). Such schemes are in place in a number of European countries, and a range of Australian and US states, among others. The main benefits of deposit return schemes are typically identified as increasing recycling of targeted containers, and decreasing littering of targeted items.
In 2012-2013 Zero Waste Scotland piloted local “recycle and reward” schemes in a number of localised contexts across Scotland. Two of these schemes had a deposit element. These pilots provided useful insight into site-specific recycling solutions, and some of the technical requirements of operating automated takeback machines at site level. However, these context-specific local solutions do not provide direct insight into the likely performance of a national deposit return scheme.
In 2014, on behalf of Scottish Government, Zero Waste Scotland commissioned Eunomia Research and Consulting to explore how a deposit return system might operate in Scotland, and what key design choices might be relevant. The aim of this was to inform discussion about whether such a system might be suitable for Scotland, and how it might work. Parallel work by Valpak Consulting, and a submission from the Packaging Recycling Group Scotland, explored alternatives to deposit systems, including changes to the existing Packaging Recovery Note system (which targets packaging recycling more widely) and the options for a collaborative industry-led approach respectively. Both these reports were published in 20151.
Since these pieces of work were published there has been active discussion on the merits or otherwise of a deposit return system as part of Scotland’s approach to recycling, and the development of a circular economy more generally, including a formal call for evidence. Following the call for evidence Scottish Government identified a number of questions which it wanted to investigate in greater detail, and tasked Zero Waste Scotland with leading this process.
The questions asked by government at that point were:
• What amounts of potentially targeted material are placed on the Scottish market, and how much is currently recycled?
• What are the potential impacts of a deposit return system for local authorities? • What is the value of the public’s contribution for the purpose of any cost-benefit calculation? • What would be the costs for a) retailers (small and large) and b) producers / packagers of
targeted items? • What evidence exists for the policy choices made in other jurisdictions, and is this reasoning
relevant to Scotland? • What is the value any reduction in litter achieved by a deposit return system for the purpose of
any cost-benefit calculation? • What difference would any improvement in recyclate quality achieved by a deposit return
system make to the market value of the recyclate obtained? • Are there any hygiene issues raised by storage / backhauling of material via a deposit return
system? • Is there evidence of deposit return systems increasing consumer prices? • Is there any evidence of consumer behaviour change with a deposit return system?
The outcome of this additional investigation is contained in this report. This current document seeks to summarise the findings of those discussions, and includes the range of stakeholder evidence and views shared, which do not always match neatly to the questions listed above. We’ve structured the
1 See Eunomia, 2015, A Scottish Deposit Return Scheme, http://www.zerowastescotland.org.uk/sites/default/files/ZWS%20DRS%20Report_MAIN%20REPORT_Final_v2.pdf, and Valpak, 2015, Scottish Packaging Recovery Note Feasibility Study, http://www.zerowastescotland.org.uk/sites/default/files/SPRN_0.pdf
Deposit Return Evidence Summary, June 2017
5
current document thematically, to reflect the discussions that have taken place, and the evidence that has been presented, rather than the questions themselves, but all are covered within this document. The only question not addressed here is point five in the list above – after discussion with stakeholders it was agreed that the rationale for overseas decisions was not likely to be transparent, and nor would it provide learning that was directly transferable to the Scottish context. The other questions are all approached, but the level of available evidence, and the confidence with which we can draw conclusions, varies. This is highlighted where appropriate in the report.
There are passionate stakeholders on both sides of the deposit return systems debate. Zero Waste Scotland has sought to be neutral in summarising the evidence base for this report. For some issues we have carried out bespoke analysis (e.g. local authority kerbside cost analysis, potential anti-litter impacts), and in these cases, where possible we have sought to reflect stakeholder disagreements by exploring a range of options where views diverge (e.g. anti-litter impacts), or evidence is more limited than we would like (e.g. container specific recycling rates). In other cases, the available evidence has proved limited (e.g. consumer behaviour impacts; hygiene concerns), even after extensive discussion with stakeholders, and in these cases we have simply summarised the differing views expressed.
This document is not a comprehensive review of all evidence on deposit systems and their applicability for Scotland. It is explicitly focused on the key issues identified by government as needing further investigation.
Deposit Return Evidence Summary, June 2017
6
2 Current recycling rates for targeted containers in Scotland
2.1 Summary Our preferred estimates for recycling rates for specific container types in a notional year2 of 2013/14 are:
• Plastic drinks bottles are currently expected to have a recycling rate of 47% - 52% in Scotland. • Glass drinks bottles are currently expected to have a recycling rate of 70% - 90% in Scotland. • Aluminium drinks cans are currently expected to have a recycling rate between 40% and 60% in Scotland.
No unique estimate is made for steel drinks cans. Cans pose a problem in the waste data as the distinction between food and drink cans and aluminium and steel cans is frequently conflated. We suspect the recycling rate for steel drinks cans is broadly consistent with that for aluminium drinks cans, as, from a consumer perspective, the recycling behaviour is likely to be similar. We are also led to believe by industry that steel cans represent a rapidly declining market. These estimates were constructed using best available data in 2016 when we conducted this analysis, however most sources used relate to older data from 2013 and 2014. We would expect performance to have improved over time in line with Scotland’s overall recycling performance, so current performance is likely to be somewhat better than shown here.
2.2 Why do we quote a range rather than a single figure? A range of estimates exist for both material placed on market and captured for recycling, and this is not in directly comparable formats. Given these data constraints, we think offering a range of credible estimates is more robust, and helps us explore the sensitivities of any decision around a deposit system for Scotland. There is no single source of information for the amount of packaging that reaches the market in Scotland:
• All estimates of consumer packaging sold in Scotland rely on scaling from UK data to a greater or lesser extent. • All estimates of non-consumer packaging are directly dependent on scaling from UK data. • The categorisation of materials (e.g. glass), packaging type (e.g. glass bottles), and item type (e.g. glass drinks bottles, possibly excluding items
like milk which could be outwith a deposit system scope) is not consistent between studies, and typically not possible within the majority of datasets without further assumptions being made.
There is no single source of information for the proportion of items (i.e. glass drinks bottles) rather than material (i.e. glass) in national waste data:
2 We have combined evidence sources from across the two years, and use the term “notional year” to reflect this

Deposit Return Evidence Summary, June 2017
7
• All estimates of consumer recycling depend on Waste Data Flow (Scotland’s national reporting system), but there are serious limitations on this data for the detailed analysis required in this case, including
o The categories in this do not match the material/type/item data above. o Very large tonnages are collected comingled. Compositional data can be used to estimate splits in commingled streams, but this is a
significant source of uncertainty. o Waste Data Flow records tonnages collected, rather than amounts ultimately recycled – this will overstate the recycling rate to some
extent, due to contamination. This difference is usually referred to as “process losses” • There is limited data on non-consumer waste or recycling of the targeted items. • Data for consumer and non-consumer combined may be more accurate as PRN data is collected in this format. In the Valpak analysis referenced
below the way this total is calculated will remove some of the overestimates caused by process losses. At the same time, PRN data does not record any packaging reprocessed outwith the PRN system, which may underestimate recycling to some extent. All PRN data is only collected at a UK level in any case, so any Scottish results need to extrapolated from UK performance.
Given the above, it is highly unlikely different analyses will make identical assumptions, and thus a range of credible estimates for Scottish recycling levels exist. While some improvements to the picture could be obtained, it is unlikely it would ever be cost-effective to achieve absolute certainty at the level of detail of specific packaging types in the foreseeable future. To do so would require either an obligation on industry / retailers to report quantities of products sold or ongoing purchase of market data across all product ranges (both approaches might still miss some wholesale or non-consumer-facing transactions), and far more detailed compositional data collected on an ongoing basis within the waste management system (both for household and commercial waste). This summary does not therefore aim for a definitive answer, but does seek to bound the discussion by highlighting the range of credible estimates. In any future cost benefit analysis of Scottish policy options, this – or appropriate updates – would provide the range within which sensitivity analysis should be carried out. Compositional data from work undertaken with Scottish Local Authorities in 2013-2015 may provide some useful additional insight into material splits with comingled collections, however, as a means to estimate overall tonnages of targeted materials many of the same constraints as identified above still apply - i.e. categorisation is not specific to “drinks” containers, and the sampling and scaling method is unlikely to produce data that can be considered like-for-like with the other sources mentioned. This data will be available in mid-2017, but we do not expect it to revolutionise the picture presented here.
2.3 What sources have we used to reach our estimate? In 2015 Valpak undertook analysis of Scottish packaging flows, and shared this information with Zero Waste Scotland3. This provided estimates for packaging entering the Scottish market, and amounts recycled. For consumer packaging two approaches were undertaken to estimate amounts on the
3 Valpak, 2015, Scottish Packaging Market Assessment, unpublished. Note this is a separate report from their Scottish PRN feasibility study, also dated 2015. We refer to them in the text as the “market assessment” study and “feasibility study” respectively.

Deposit Return Evidence Summary, June 2017
8
market, with the former taking more direct Scottish information into account, but with both needing UK data to arrive at final estimates. Non-consumer packaging data was all derived from UK source data. We use this Valpak picture as a starting point below, and then discuss alternative analyses to arrive at a range of credible estimates. We also refer to Eunomia’s estimates for packaging entering the market in their deposit return feasibility study, Valpak’s earlier work on a Scottish PRN system4, confidential discussions with industry on specific product lines, and internal Zero Waste Scotland analysis arising from that, and where helpful, UK PRN data for comparison purposes.
2.4 Estimated Recycling Rate for Plastic Bottles The table shows the Valpak 2015 market assessment estimate (using 2013 data) for method 1, which is notionally the more “Scottish”, and method 2. Note the differing recycling rates even within this single study. We assume “consumer bottles” are all within scope for the deposit system discussion, though in practice this may include some products (e.g. shampoo, ketchup) which are not in scope, and others (e.g. milk) which may be out of scope in some deposit system designs. We assume conventional drink bottles are more, rather than less, likely to be recycled than other plastic bottles; so note that any inclusion of non-drinks bottles would probably have the effect of lowering the apparent recycling rate. It is unclear how much non-consumer packaging, or recycling, may be targeted items in any future deposit system in Scotland.
Table 3.1 Valpak Recycling Estimates for Plastics Packaging in Scotland
Unsurprisingly, Valpak’s 2015 feasibility study gave a figure within this range (52%). Recoup report a UK recycling rate for the same year of 58% - interestingly, although significantly up on the previous year, this was due to a change in how packaging placed on the market was estimated, not large changes in recycled amounts. Eunomia’s 2015 study estimated a much lower level of packaging placed on the market (39,000t, based on a straightforward split from UK data), which implies an even higher recycling rate using the figures above – in our view this recycling rate estimate is unlikely. There was no split of consumer / non-consumer in this Eunomia analysis.
4 Both as previously referenced.
Method 1 Method 22013 Packaging
Placed on Scottish Market
2013 Packaging Placed on Scottish
Market Plastics TOTAL 199,123 185,680 55,899 28.10% 30.10%
TOTAL CONSUMER 139,805 126,362 35,491 25.40% 28.10%Consumer Bottles 54,143 48,937 25,503 47.10% 52.10%
Consumer Pots, Tubs and Trays 47,873 43,270 8,582 17.90% 19.80%
Consumer Film 37,788 34,155 1,406 3.70% 4.10%
TOTAL NON-CONSUMER 59,318 59,318 20,408 34.40% 34.40%
Packaging Material Sector/Format Scottish Packaging Recycling
Recycling Rate - Method 1
Recycling Rate - Method 2

Deposit Return Evidence Summary, June 2017
9
This suggests a plastic bottle recycling rate for consumers of between 47% and 52% as shown in the Valpak 2015 market assessment is reasonable. In the context of the Waste (Scotland) Regulations, we might expect non-consumer behaviour for these items to be comparable, but there is as yet minimal evidence to support this claim one way or another.
2.5 Estimated Recycling Rate for Glass Bottles This table shows the Valpak 2015 market assessment estimate as above. Again, it can be questioned if all bottles would be within scope for a deposit system, and it is unclear how much of the non-consumer packaging may be within scope.
Table 3.2 Valpak Recycling Estimates for Glass Packaging in Scotland
Valpak’s 2015 feasibility study gave a figure slightly lower than this range (70%) but did explicitly state this was for drinks bottles. Eunomia’s 2015 report gives a figure of 165,000t of glass bottles on the market. There was no split of consumer/non-consumer waste. If that was all consumer side waste (unlikely in our view) this would give a lower apparent recycling rate (59%), but to the extent there are glass bottles in non-consumer waste, these figures would start to reconcile. In a report with WRAP, Valpak estimated 2012 UK PRN performance at 65%-68%, but this figure relates to all packaging glass. This suggests a wide range of estimates between 70% and 90% might be considered credible recycling rates for glass bottles by consumers. In the context of the Waste (Scotland) Regulations, we might expect non-consumer behaviour to be comparable, but there is as yet minimal evidence to support this claim one way or another; it may be towards the higher end as glass collections in some sectors, e.g. hospitality, are arguably well established.
Method 1 Method 22013 Packaging
Placed on Scottish Market
2013 Packaging Placed on Scottish
Market
Packaging Material Sector/Format Scottish Packaging Recycling
Recycling Rate - Method 1
Recycling Rate - Method 2
Glass TOTAL 195,710 229,218 118,644 60.60% 51.80%TOTAL CONSUMER 145,654 179,162 99,973 68.60% 55.80%
Bottles 110,663 136,122 96,974 87.60% 71.20%
Jars 34,541 42,488 2,999 8.70% 7.10%
Other 449 552 0 0.00% 0.00%
TOTAL NON-CONSUMER 50,056 50,056 18,671 37.30% 37.30%

Deposit Return Evidence Summary, June 2017
10
2.6 Estimated Recycling Rate for Aluminium Cans This table shows the Valpak 2015 market assessment estimate as above. We assume all aluminium cans are likely to be drinks cans. However it is unclear how much of the non-consumer packaging may be within scope.
Table 3.3 Valpak Recycling Estimates for Aluminium Packaging in Scotland
Valpak’s 2015 feasibility study gave a higher figure than this (62%) which is close to the Aluminium packaging industry’s estimate for the UK as a whole (61% when discussed in 2014). UK PRN data in 2011 suggested an overall aluminium recycling rate of 45% with industry estimating can recycling again as “over 60%”. Eunomia’s 2015 study estimated 8,900t of aluminium cans entering the market. Set against the recycled quantities above that would give a recycling rate of 42% if all of it was consumer packaging, or, if all non-consumer aluminium recycling was cans (an unlikely extreme case), a recycling rate of 56%. A Zero Waste Scotland analysis of industry estimates for amounts entering the Scottish market and SEPA’s recycling data suggested estimates of 40%-45% in that earlier period. We think the range of credible estimates here is broader than that suggested in the Valpak 2015 market assessment study alone, and suggest a broad range between 40% and 60% is credible. However we’d highlight that the high end estimates all come from very directly scaled UK data, and it may be there are differences in how this market is working in Scotland. Conversely, the low end estimates rely on older data. In the context of the Waste (Scotland) Regulations, we might expect non-consumer behaviour to be comparable, but there is as yet minimal evidence to support this claim one way or another.
Method 1 Method 22013 Packaging
Placed on Scottish Market
2013 Packaging Placed on Scottish
Market
Packaging Material Sector/Format Scottish Packaging Recycling
Recycling Rate - Method 1
Recycling Rate - Method 2
Aluminium TOTAL 14,993 13,458 4,945 33.00% 36.70%TOTAL CONSUMER 10,577 9,042 3,756 35.50% 41.50%
Cans 7,510 6,420 3,756 50.00% 58.50%
Aerosols 846 723 0 0.00% 0.00%
Foil Containers/Trays 317 271 0 0.00% 0.00%
Other (Inc Composites) 1,904 1,628 0 0.00% 0.00%
TOTAL NON-CONSUMER 4,416 4,416 1,190 26.90% 26.90%
Deposit Return Evidence Summary, June 2017
11
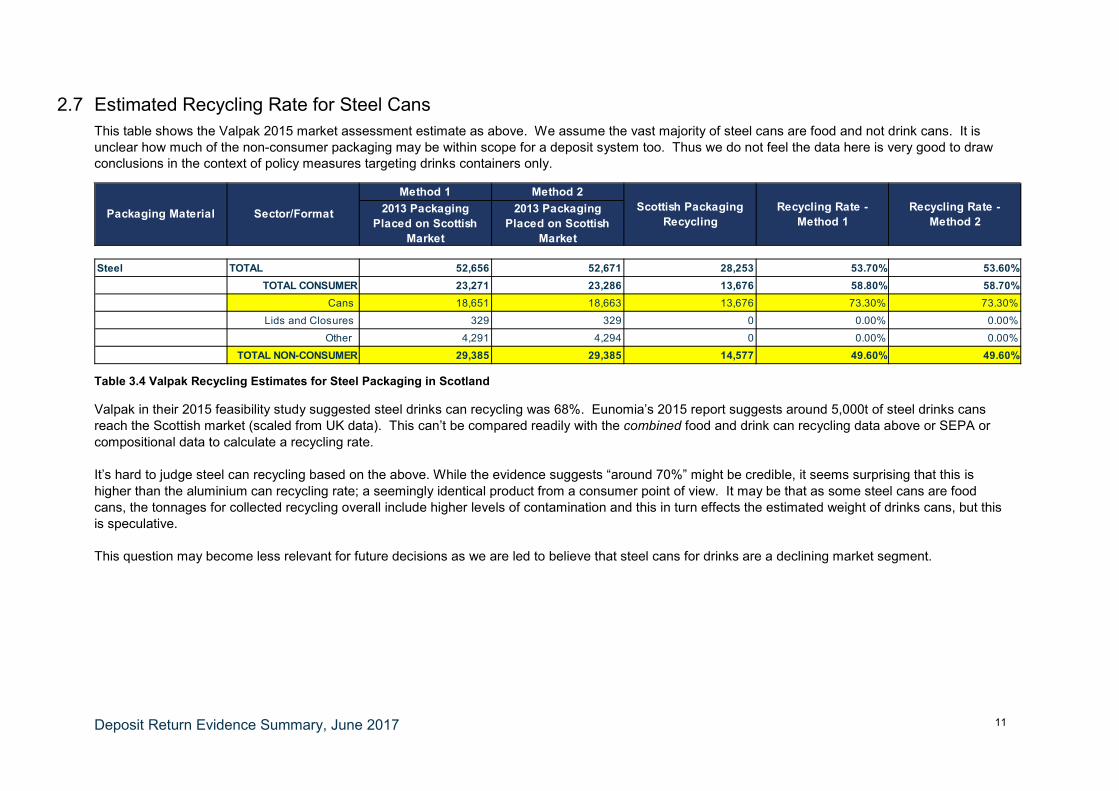
2.7 Estimated Recycling Rate for Steel Cans This table shows the Valpak 2015 market assessment estimate as above. We assume the vast majority of steel cans are food and not drink cans. It is unclear how much of the non-consumer packaging may be within scope for a deposit system too. Thus we do not feel the data here is very good to draw conclusions in the context of policy measures targeting drinks containers only.
Table 3.4 Valpak Recycling Estimates for Steel Packaging in Scotland
Valpak in their 2015 feasibility study suggested steel drinks can recycling was 68%. Eunomia’s 2015 report suggests around 5,000t of steel drinks cans reach the Scottish market (scaled from UK data). This can’t be compared readily with the combined food and drink can recycling data above or SEPA or compositional data to calculate a recycling rate. It’s hard to judge steel can recycling based on the above. While the evidence suggests “around 70%” might be credible, it seems surprising that this is higher than the aluminium can recycling rate; a seemingly identical product from a consumer point of view. It may be that as some steel cans are food cans, the tonnages for collected recycling overall include higher levels of contamination and this in turn effects the estimated weight of drinks cans, but this is speculative. This question may become less relevant for future decisions as we are led to believe that steel cans for drinks are a declining market segment.
Method 1 Method 22013 Packaging
Placed on Scottish Market
2013 Packaging Placed on Scottish
Market
Packaging Material Sector/Format Scottish Packaging Recycling
Recycling Rate - Method 1
Recycling Rate - Method 2
Steel TOTAL 52,656 52,671 28,253 53.70% 53.60%TOTAL CONSUMER 23,271 23,286 13,676 58.80% 58.70%
Cans 18,651 18,663 13,676 73.30% 73.30%
Lids and Closures 329 329 0 0.00% 0.00%
Other 4,291 4,294 0 0.00% 0.00%
TOTAL NON-CONSUMER 29,385 29,385 14,577 49.60% 49.60%

Deposit Return Evidence Summary, June 2017
12
3 Potential deposit return system on local authority kerbside collection costs
3.1 Introduction This analysis considers the possible implications of a deposit return system for local authority household collection recycling and residual waste collection services. It considers both the financial implications of an established deposit scheme, and, qualitatively, how the transition from current systems could be made, and any cost implications associated with this. The transition is considered in conjunction with current plans for standardising collection services from a householder perspective under the Household Recycling Charter and thus takes into account the direction of travel of household collections in Scotland.
A deposit system might have additional financial implications for local authorities, which are not considered here. These are:
• Reduced costs associated with street cleansing both from reduced litter picking and reduced servicing of public litter bins (which would be assumed to fill less quickly with common, high-volume items drawn into a deposit system)
• Any altered costs associated with business waste services managed by local authorities, or at local authority Household Waste Recycling Centres (HWRCs) and bring sites
• Potential income streams if local authorities were to be involved in managing the material collected via the deposit system
• Potential income streams if local authorities were able to extract unredeemed containers from residual waste or kerbside recyclate and reclaim deposits themselves
• Changes to recycling behaviour for other material streams if a deposit system made people either more or less likely to recycle other items at the kerbside
This analysis, which was undertaken in 2016, therefore proceeds in three stages. Firstly we investigate the potential costs and benefits to local authority services quantitatively. We apply the projected material split at kerbside if a deposit system was operational in Scotland to a material flow and cost model developed by Zero Waste Scotland to inform planning discussions around the Household Recycling Charter. The focus is on the management costs and revenue streams of dealing with this material – we do not count any efficiency savings in collection processes (e.g. if fewer vehicles were needed), and these might represent additional savings in some cases. These results are then compared with third party modelling of local authority costs and benefits in a deposit system. Finally we consider qualitatively whether there would be any transition costs to local authorities from optimising services to meet the changed material collection volumes under a deposit system most cost-effectively. This discussion also aims to account for planned changes to collection services in the next few years to meet the aims of the Household Recycling Charter. Detail on model assumptions is included as an appendix to the report.
3.2 Key Findings The analysis we conducted gives quantified financial savings, but as the exact performance and design parameters of a deposit system in Scotland are not known, in this summary we focus on overall messages, rather than the numbers themselves, which may differ depending on how and when any deposit system was to be introduced.
In the aggregate local authorities’ kerbside services benefited financially from a deposit return system in all the scenarios we modelled.
In the modelling all local authorities make disposal savings for residual waste (as some tonnages are diverted direct to a deposit system, and do not have to be dealt with by local authorities) in all cases.
Deposit Return Evidence Summary, June 2017
13
The only exceptions in practice might be where current disposal/management contracts are not linked to actual tonnages disposed, and thus a benefit for a marginal decrease would not be immediately realised. This saving is obviously sensitive to the number of targeted containers currently assumed to be in the residual stream.
Typically local authorities also make savings for passing on recyclate in deposit system scenarios. Where there is a net cost per tonne to local authorities currently, reduced tonnages are financially beneficial. Some local authorities that separate recyclate for direct sale to reprocessors, or receive a net payment for other reasons, may see some financial losses on this part of their operation. This is frequently more than offset by savings elsewhere (primarily residual waste disposal savings identified above). However in some scenarios (those with low return rates, or where recyclate reprocessing costs are assumed to rise), some individual local authorities appear to lose out financially.
There are also minor savings from reduced haulage of residual waste and recyclate for all local authorities.
We do not see a need (or a large opportunity) for local authorities to reconfigure services on financial grounds in a post-deposit return system environment. We assume that any optimisation that takes place would be aligned with future pre-planned service changes, and thus there is no transition cost. Optimisation might lead to small cost savings for collection services, but we do not think these will be significant. Local authorities are likely to need to offer the current range of collection services (albeit managing smaller amounts of material) as packaging other than drinks containers is not assumed to be targeted under the deposit system investigated here.
The better deposit return system performance is (i.e. the higher the capture rate) the better the financial implications for local authorities.
The higher the amount of targeted material we assume to be disposed of via kerbside services prior to a deposit return system, the more financially beneficial the introduction of a deposit return system is for local authorities. This also strongly implies that the broader the coverage of a deposit return system (in terms of targeted containers) the better it is financially for a local authority.
The weaker the negative impact of a deposit return system on fees payable for passing on remaining recyclate by local authorities, the better this is financially for local authorities. We only modelled “no change”, and a selection of adverse fee impacts in our model. In contrast overseas studies have suggested that a deposit return system could decrease fees payable to Material Recovery Facilities5 (MRFs) – in this case, this is obviously financially beneficial for local authorities.
The conclusions are sensitive to material prices / revenues and gate fees, which will change independently of a deposit return system in future. Current material prices, and current price trends, are poor from a local authority perspective. This makes a deposit return system more financially beneficial than it would be in a period of high material prices / revenues. Most analysts do not foresee increases in material prices / revenues in the medium term. It would be possible to calculate the point at which material price changes might shift the economics of a deposit return system towards a net loss for local authorities, but we have not done so in this study.
The general direction of findings is comparable to other studies we have looked at, which all suggest local authority kerbside services can gain in the aggregate.
3.3 Financial Implications of an Established Deposit Return System
3.3.1 What financial factors are considered in our approach?
Financial implications for local authorities can come from a number of factors. These include:
5 These sorting facilities are frequently the next step in the recycling chain, intermediate between local authorities and reprocessors, for collected recyclate currently.
Deposit Return Evidence Summary, June 2017
14
• A fall in residual waste volumes should generate cost savings. Disposal costs fall, and collection costs may fall if this creates either time efficiencies within existing services or service efficiencies overall.
• A fall in recyclate volumes is more complicated. Collection costs may change as above, but the costs of passing the material on are more dependent on the value of the material mix, and how this is separated – this can theoretically be either a net cost or a net revenue stream for local authorities, though current material prices mean it is very often a net cost.
In practice the balance of these factors may vary by context.
It is also possible that in a post-deposit return system context local authorities may find it cost-effective to sort recyclate for deposit-bearing items householders have chosen not to recycle, and redeem the deposits themselves. The cost of such separation, and whether containers would always be in a condition to redeem the deposit (e.g. with still readable barcodes), mean it is not clear whether this potential revenue stream will be worth exploiting at this time, and so we have not modelled this in our analysis.
Overseas cost-benefit analyses undertaken to predict the impact of a deposit return system in Australia (discussed in more detail later) assume that MRFs could perform this separation (and reclaim up to 100% of deposits as a result). We are not so optimistic about retrieval, and it may not be cost-effective to do so – however, this would improve the economics of the remaining recyclate (and even residual waste) for MRFs and / or local authorities over and above what we model here by helping maintain, or even increase, the fees paid for tonnages of remaining kerbside recyclate.
3.3.2 Using the Household Recycling Charter Model to look at changes in costs from a deposit return system
The Household Recycling Charter Model is essentially a material flow and management cost model. We initially explored a number of changes to material flows under a deposit system, and to recyclate disposal costs and incomes. These are detailed in an appendix, but in brief:
• There is some uncertainty around exact volumes of targeted items in the household waste stream. We therefore tested “low”, “medium”, and “high” assumptions for the weight of targeted materials currently managed at kerbside. Our “low” scenario is noticeably more extreme than the other two, as we both assume a sizeable reduction in kerbside material relative to the other cases (with the remainder assumed to be managed at HWRCs) and more optimistic assumptions about current recycling rates for targeted materials than is suggested in Scottish compositional data currently.
• We have only sought to isolate “drinks” containers, without consideration of whether all drinks containers would in fact be in scope for a deposit system. Seeing how costs change with this basic tonnage assumption, and the low-medium-high test cases above, was expected to give an indication of whether (and in which direction) costs and benefits change for local authorities based on how much targeted material is assumed to be in the waste stream. This could then inform the value of exploring more sophisticated scenarios in the model.
• If the amount of material actually targeted by a deposit system is less than modelled (which is very possible, as we have here taken a maximalist approach) changes in costs will also be less. But the direction of change, positive or negative, will be the same.
• The capture rates of deposit systems overseas vary. We therefore modelled return rates of 70%, 80%, and 90%. Again, seeing how local authority costs change within these three scenarios (and in which direction) was expected to inform a decision on the value of exploring more sophisticated scenarios. We assumed the effect of a deposit system was felt equally on both residual and recycling collections.
• As fees paid or received for recyclate are a significant part of the overall cost benefit calculation, we explored three scenarios around cost – one with no change in disposal fees for recyclate, and a more and less pessimistic assumption on the impact on MRF gate fees of removing a large proportion of targeted items (PET Plastic and Aluminium in particular are high value items once separated, and may impact the overall price a MRF is willing to pay for

Deposit Return Evidence Summary, June 2017
15
a tonne of mixed material). However we caution that material prices, and thus fees, are likely to change significantly for a wide range of reasons in future. Rather than necessarily showing a “realistic” future price prediction, the main value of this analysis is to see if overall costs and benefits for local authorities from a deposit system are significantly impacted by changing prices. We have not modelled a scenario where a deposit system pushes up values for remaining recyclate, though we note some overseas studies believe this could happen where MRFs have the ability to extract unredeemed targeted containers and reclaim the deposit. In this case we would expect the direction of change to match the patterns identified in our analysis.
The model cannot automatically calculate savings from collection efficiencies in the context of a deposit system (e.g. if reduced tonnages mean fewer vehicles are required overall), and we have not done this in the current analysis. Such savings are therefore assumed to be zero by the model, which may be unduly conservative. However, we expect such savings will be marginal compared to the costs that are covered.
We therefore modelled the following initial scenarios, making for 27 scenarios in all, plus a base case (i.e. current costs with no diversion of material to a deposit system).
No Material Fee Changes
Deposit System Performance Variations
70% 80% 90%
Tonn
age
Varia
tions
Low A1 A4 A7
Medium A2 A5 A8
High A3 A6 A9
Adverse, but smaller Material Fee Changes
Deposit System Performance Variations
70% 80% 90%
Tonn
age
Varia
tions
Low B1 B4 B7
Medium B2 B5 B8
High B3 B6 B9
Adverse, larger Material Fee Changes
Deposit System Performance Variations
70% 80% 90%
Tonn
age
Varia
tions
Low C1 C4 C7
Medium C2 C5 C8
High C3 C6 C9
Table 4.1 Tables showing the range of scenarios modelled, and their reference numbers in the analysis.

Deposit Return Evidence Summary, June 2017
16
3.3.3 Findings from the modelling The Base Case Waste management is a significant cost for local authorities. Collection services for both waste and recycling currently cost in the region of £155 million across Scotland’s 32 local authorities, with management and disposal costs accounting for a further £133 million. Current recycling services typically save local authorities money in terms of management and disposal rather than collection – with per tonne costs for passing on recycled materials much lower than per tonne costs for landfill disposal or other residual waste treatments. In some cases passing on recycled material can be a revenue stream (where local authorities are paid for the material by reprocessors) but overall it remains a net cost with current collection systems, material prices, and disposal fees across Scottish local authorities in the aggregate, albeit a smaller one per tonne than landfill disposal. This cost is usually associated with charges for additional sorting by MRFs, and these fees also reflect the costs of removing non-target materials that can contaminate the recyclate stream. The impact of reduced volumes of targeted materials in local authority collections In our modelling scenarios, local authorities in the aggregate see reductions in their disposal costs for residual waste in all cases. The higher the amount of targeted materials assumed to be in the residual waste, and/or the higher the effectiveness of a deposit system is assumed to be, the greater the savings. Residual disposal savings modelled were between £2.6 million and £6.2 million (scenarios A1 and A9 respectively). A similar reduction pattern is seen (assuming no changes to fees / income for passing on dry recyclate) for recycled materials. Again, assuming higher volumes targeted by a deposit system, or a higher performing deposit system, increases the potential savings. Recyclate savings costs modelled were between £2.8 million and £3 million if we assume no change in gate fees or material revenue (scenarios A1 and A9 respectively). Overall, if we assume no change in gate fees, we see aggregated treatment and management costs for local authorities reduce by between £5.3 million and £9.2 million in the scenarios we modelled (scenarios A1 and A9 respectively). Actual savings would be less if the scope of a deposit system was more limited than the broad parameters initially modelled here. These savings do not however account for potential changes in market prices for dry recyclate in a post deposit system environment. The impact of changing material prices in a post deposit return system environment Recyclate prices are unpredictable. They fluctuate based on global market conditions. They vary significantly based on the relative negotiating powers of local authorities, different management routes, and reprocessors. And they also vary depending on when contracts were set and for what period.
3.3.4 What the modelled scenarios tell us
By modelling a wide range of scenarios, we can also answer some more generalised questions.
How might future material/disposal prices change? We do not seek to predict future material prices here. However, we do assume in our modelling to date that if a deposit system reduces the volume of high-value material (metal cans, plastic bottles) in mixed recyclate this will increase the cost associated with passing this material stream on. Conversely, we assume that in cases where glass is reduced in some comingled collections, this will reduce costs (as separating glass is expensive, and glass fragments can be a significant contribution to MRF wear and tear and thus maintenance costs). We combined these two factors into a “less pessimistic” and a “more pessimistic” scenario – with the former seeing smaller cost increases for local
Deposit Return Evidence Summary, June 2017
17
authorities, and the latter larger cost increases. We position both scenarios against current prices rather than any future price projections. Modelling optimistic scenarios for the impact of a deposit system on MRF gate fees is less analytically interesting – this clearly is good financially for local authorities. Unsurprisingly, increased costs for remaining residual had the effect of reducing the savings from a deposit system identified above. However, under both scenarios, a deposit system remained cost positive for local authorities in the aggregate. In the less pessimistic scenario we saw savings between £3.8 million and £7.7 million (scenarios B1 and B9 respectively). In the more pessimistic scenario we saw savings between £1.3 million and £5.2 million (scenarios C1 and C9 respectively). Could local authorities get a better price under a deposit return system than we have modelled? We have not modelled the revenue potential for either local authorities or MRFs in extracting unredeemed containers from either the waste or recyclate stream. The proportion of containers in a redeemable condition (e.g. not significantly crushed/with readable barcodes) would depend both on collection and separation systems and the deposit system redemption criteria. However, if such redemption is possible – and some studies assume this is so6 – this could increase the value of a tonne of recyclate in a deposit system context, and thus counter or even reverse our starting assumption that prices to pass on remaining recyclate would rise. Different deposit system management structures might make this more or less likely – for example if a handling fee was offered as well as the redeemed deposit itself (handling fees are often offered to retailers managing material flows within deposit systems overseas), this would make the economics of additional separation more appealing. Under what, if any, circumstances could local authorities lose out in the aggregate? Although we did not formally model this, based on this analysis it seems that a deposit system could only produce a net cost increase for local authorities if either:
• Cost increases for passing on dry recyclate in a post-deposit system environment were sufficiently large that these outweighed cost savings from both reduced recyclate volumes and reduced residual volumes. Further analysis could explore where the critical point for prices was – we have not reached it in our scenarios modelled here which include some quite pessimistic assumptions, and assume a deposit system is unlikely in itself to have such a large negative impact on prices.
Or: • Material prices rise sufficiently high in future that local authorities would receive a net revenue
for passing on recyclate, even to MRFs. This is not in line with current market trends, with most analysts pessimistic (in terms of valuing material) about prices for the foreseeable future.
For individual local authorities the picture is a little more complex, and this is discussed below. Do individual local authorities all fare the same? Our Household Recycling Charter model does not fully reflect actual costs for individual local authorities, as a single set of national cost factors is applied for material pricing, which will not reflect local contracting arrangements. For this reason we do not identify any individual local authorities in this analysis. We can however see if different kinds of local authorities can see similar or different financial outcomes based on their current service delivery. All local authorities benefit from reduced residual waste disposal in the model, and from reduced haulage. In practice, if a contracting arrangement is in place that means a local authority does not benefit financially from a marginal decrease in residual tonnages, this benefit might be lost in a specific case, at least in the short term. 6 Informally, we have been told of cases where this does occur in both Canada and Australia, though we have not investigated more systematically.
Deposit Return Evidence Summary, June 2017
18
Local authorities that currently separate some of their kerbside collected material in such a way they are selling the material directly, rather than paying a MRF (or those who receive payment from a MRF for taking some material) do not automatically benefit from reduced recyclate tonnages. The balance between these factors varied across our scenarios for some local authorities. In cases where individual local authorities might lose out, some general trends could be identified from our modelling:
• The better the deposit system performs in terms of capture rate, the better this is financially for local authorities.
• The higher the assumed starting tonnage of target materials in the system, the better this is financially for local authorities.
• The greater the upwards pressure on MRF costs payable in a deposit system environment, the worse for these local authorities.
All these factors are true for LAs in the aggregate too – it is simply the point where financial impacts switch from positive to negative that varies by local authority. Assuming no price changes for material, the financial losers from scenario A1 (low starting tonnage, 70% capture) were five local authorities losing £81,000 per year collectively, or £16,000 on average per authority. For the negatively affected individual local authorities the impact was less than 1% of their total modelled service costs in every case (between 0.01% and 0.73%). This falls marginally in scenario A7 (low starting tonnage, 90% capture) to four local authorities, losing £69,000 collectively, or £17,000 each on average (again, the impact was always less than 1% of modelled service costs). If larger tonnages of material are in fact in the system to start with, for example in scenario A2 (medium starting tonnage, 70% capture rate), just two authorities share a loss of only £16,000 (or £8000 on average), while in scenario A9 (high starting tonnage, 90% capture rate) no authority loses financially. If material prices changed adversely for these authorities, losses are greater, though similar patterns are seen. In scenarios B1 to B9 we see between ten and zero local authorities negatively impacted with potential losses for those affected between £230,000 collectively (or £23,000 each) and £0. In the worst case (B1), again all losses are under 1% of modelled spend for every affected local authority. In scenarios C1 to C9 we see between twenty two and six local authorities negatively impacted, with potential losses for those affected between £1.7 million (or £77,000 each) and £280,000 (or £47,000 each). In the worst case (C1), all losses are under 2% of modelled spend for individual affected local authorities (between 0.01% and 1.92%). In all these cases benefits for those that make a financial gain outweigh losses for those who lose out. We recognise that deposit system governance could potentially be designed to compensate for any losses of this nature, but finding a suitable mechanism to do so, and the value of this, would be a governance or design choice. Does the amount of material targeted by a deposit return system make a significant difference to cost savings? Based on the trends seen across our different scenarios, we can predict some wider implications of different assumptions on local authority costs. The following factors would reduce available savings compared to the scenarios we have modelled to date:

Deposit Return Evidence Summary, June 2017
19
• If there is less targeted material in the residual waste stream currently than assumed in any of our scenarios.
• If there is less targeted material in the dry recyclate stream currently than assumed in our scenarios (though this may vary for some local authorities, depending on whether they receive a fee or make a payment for passing the material on).
• If an actual deposit system targets a narrower range of materials than assumed in this modelling. This is the case in operational deposit system models elsewhere (which exclude various items for differing rationales), whereas for this initial analysis we have assumed a maximal material reach.
However, none of these factors would be expected to make deposit system running costs cost-negative for local authorities in the aggregate based on our analysis so far.
Are these findings applicable to all local authorities? We have not split costs between rural, urban, and mixed local authorities (a common distinction in studies of this type) at this stage. However, we observe:
• As savings largely arise from residual disposal costs and the costs of passing on recyclate, these will not necessarily be related to local authority type. The main reason for variation between local authorities is down to their current (and future) contracting arrangements in this regard.
• Some savings relate to reduced haulage costs for dry recyclate (this is transportation costs after the material has been bulked from collection rounds, but before it reaches a treatment facility). Different local authorities may experience this saving differently, depending on their logistics. The same is true for residual waste haulage costs, but the sums at stake are much smaller.
• Third party modelling suggests some marginal savings may be available in terms of collection costs for urban local authorities. This is commented on in the next section.
Overall, it is the first factor that will be most significant in determining differential costs.
3.4 Comparison to Third Party Studies The Eunomia 2015 Study In 2015 Eunomia Consulting undertook a study looking at how a deposit system might work in Scotland, and what some of the key design considerations might be7. Part of this study considered cost implications for local authorities. Eunomia analysed costs using their proprietorial “Hermes” model, which has been used extensively for local authority modelling across the UK, both for designing service changes and to inform waste management procurement exercises.
The Eunomia analysis differs from the in-house Zero Waste Scotland analysis above in three ways. Firstly, the assumptions around what baseline service provision will be in future may differ slightly. Secondly, as we don’t have access to the Hermes model itself, the output formats are not the same as our own modelling, and cannot be directly compared. And thirdly, slightly different assumptions are made around the composition of a post-deposit system material stream in local authority collections – our analysis draws on a number of sources, of which the Eunomia study is just one.
Notwithstanding these differences, it is notable that the central findings are comparable in terms of the overall message. The table below shows per household costs for different local authority types, and different service elements, as per the Eunomia study, and we can see that these are positive in all the circumstances they analysed. The key conclusions in the Eunomia report were that:
• Cost savings from collection were only realised in an urban setting (as travel time, rather than fill rates are the key determinants of how long collection routes can be in a non-urban setting).
7 Eunomia for Zero Waste Scotland, 2015, A Scottish Deposit Refund Scheme, Eunomia
Deposit Return Evidence Summary, June 2017
20
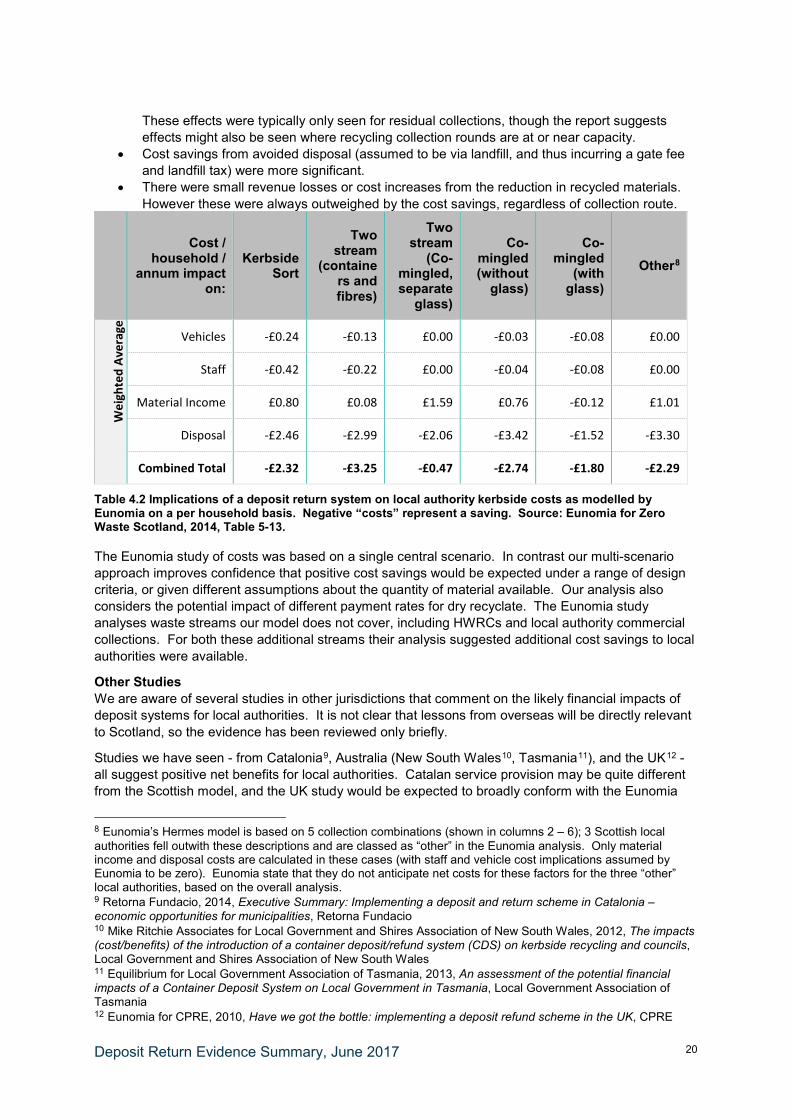
These effects were typically only seen for residual collections, though the report suggests effects might also be seen where recycling collection rounds are at or near capacity.
• Cost savings from avoided disposal (assumed to be via landfill, and thus incurring a gate fee and landfill tax) were more significant.
• There were small revenue losses or cost increases from the reduction in recycled materials. However these were always outweighed by the cost savings, regardless of collection route.
Cost / household /
annum impact on:
Kerbside Sort
Two stream
(containers and fibres)
Two stream
(Co-mingled, separate
glass)
Co-mingled (without
glass)
Co-mingled
(with glass)
Other8
Wei
ghte
d Av
erag
e
Vehicles -£0.24 -£0.13 £0.00 -£0.03 -£0.08 £0.00
Staff -£0.42 -£0.22 £0.00 -£0.04 -£0.08 £0.00
Material Income £0.80 £0.08 £1.59 £0.76 -£0.12 £1.01
Disposal -£2.46 -£2.99 -£2.06 -£3.42 -£1.52 -£3.30
Combined Total -£2.32 -£3.25 -£0.47 -£2.74 -£1.80 -£2.29
Table 4.2 Implications of a deposit return system on local authority kerbside costs as modelled by Eunomia on a per household basis. Negative “costs” represent a saving. Source: Eunomia for Zero Waste Scotland, 2014, Table 5-13.
The Eunomia study of costs was based on a single central scenario. In contrast our multi-scenario approach improves confidence that positive cost savings would be expected under a range of design criteria, or given different assumptions about the quantity of material available. Our analysis also considers the potential impact of different payment rates for dry recyclate. The Eunomia study analyses waste streams our model does not cover, including HWRCs and local authority commercial collections. For both these additional streams their analysis suggested additional cost savings to local authorities were available.
Other Studies We are aware of several studies in other jurisdictions that comment on the likely financial impacts of deposit systems for local authorities. It is not clear that lessons from overseas will be directly relevant to Scotland, so the evidence has been reviewed only briefly.
Studies we have seen - from Catalonia9, Australia (New South Wales10, Tasmania11), and the UK12 - all suggest positive net benefits for local authorities. Catalan service provision may be quite different from the Scottish model, and the UK study would be expected to broadly conform with the Eunomia
8 Eunomia’s Hermes model is based on 5 collection combinations (shown in columns 2 – 6); 3 Scottish local authorities fell outwith these descriptions and are classed as “other” in the Eunomia analysis. Only material income and disposal costs are calculated in these cases (with staff and vehicle cost implications assumed by Eunomia to be zero). Eunomia state that they do not anticipate net costs for these factors for the three “other” local authorities, based on the overall analysis. 9 Retorna Fundacio, 2014, Executive Summary: Implementing a deposit and return scheme in Catalonia – economic opportunities for municipalities, Retorna Fundacio 10 Mike Ritchie Associates for Local Government and Shires Association of New South Wales, 2012, The impacts (cost/benefits) of the introduction of a container deposit/refund system (CDS) on kerbside recycling and councils, Local Government and Shires Association of New South Wales 11 Equilibrium for Local Government Association of Tasmania, 2013, An assessment of the potential financial impacts of a Container Deposit System on Local Government in Tasmania, Local Government Association of Tasmania 12 Eunomia for CPRE, 2010, Have we got the bottle: implementing a deposit refund scheme in the UK, CPRE

Deposit Return Evidence Summary, June 2017
21
modelling for Scotland (discussed above) as the method is the same. Australian services, superficially, look somewhat similar to the Scottish approach, and it is noteworthy that studies for both more densely populated areas (NSW) and more sparsely populated and remote ones (Tasmania) reach broadly similar conclusions, and both studies calculate local authorities make a net gain from a deposit system. These appear to be higher savings on a per capita basis than we see in our own Scottish analysis. Both Australian studies assume MRFs can increase revenue from unredeemed deposits, whereas our analysis does not factor this in currently. The Australian studies are also noteworthy for being commissioned by associations of municipalities – i.e. the actors that stand to directly gain or lose financially in the context of the question asked.
In June 2016 Eunomia presented at conference in Brussels, and circulated a list of studies looking at local authority costs around the world. This included some additional studies not referred to above. Eunomia’s interpretation of this evidence was that all showed the potential for positive financial savings for local authorities. We have not analysed the additional studies ourselves, except in one case, where the evidence referred to included retrospective financial information on an implemented deposit system (all other evidence of which we are aware is prospective modelling).
This retrospective evidence related to the experience of Toronto, and required contractual changes in the financial arrangement between the local authority and their MRF operators. In the submission to the council to authorise changes, the waste management team identified that the extension of a deposit system to wine and spirits: a) had reduced tonnages for targeted material (glass); b) that MRF operators wanted higher per tonne fees to compensate for loss of material and a greater requirement for manual sorting (the latter specifically relevant to the glass only change); but that c) reduced overall tonnages lowered the total contracted value for the local authority, resulting in a net saving on MRF fees. The Toronto picture is however complicated by a loss of council revenues from a previous producer responsibility fee regime for these same items13.
3.5 Financial and Logistical Implications of Transition The modelling above considers running costs of local authority services after a deposit return system has been introduced. We have also qualitatively considered if there may be transition costs for local authorities in adapting their current services to a post deposit return system environment.
Transition costs are more likely to be significant if conducted in isolation. In practice, local authorities review and optimise their services periodically in any case, and we anticipate this will occur in future years in the context of the Household Recycling Charter.
It is possible that local authorities will be able to optimise routes, or storage space on collection vehicles, if significantly lower tonnages of deposit system targeted materials are seen. This would be expected to reduce collection costs (or else it would not be done). We assume this would be done in line with pre-planned service adjustments and thus the transition would impose no additional costs unique to optimising for a deposit system. Overall however we do not think this will be a significant effect.
Local authority collection and disposal contracts are often in place for prolonged periods of time. We do not think collection contracts will be significantly affected for kerbside services in most cases for reasons outlined above. One exception might be those Local Authorities with a dedicated glass collection, where contracts and services might require a prompt reappraisal to maximise value in a post-deposit system environment. In the long run the impact of renegotiating disposal contracts will be reflected in the price modelling already undertaken. In the short run some contracting arrangements 13 Prior to the extension of the deposit system to wine and spirits (at regional level), producers of these items had paid a levy (“steward fees”) per tonne of packaging placed on market, with payments then covering 50% of local authorities’ collection costs. With the introduction of a deposit system, these producers were removed from the steward fee system, which resulted in a significant revenue drop for local authorities, that was not sufficiently offset by tonnage drops from a deposit system. This would not currently be a consideration in Scotland, though it does show that the financial impacts of a deposit system may be linked to the wider landscape of producer responsibility.

Deposit Return Evidence Summary, June 2017
22
might see renegotiations triggered by changed circumstances, and this would require careful management by local authorities.
There may be cost reduction / revenue enhancing options for local authorities in the context of a deposit system but aside from kerbside services. The most obvious might relate to HWRC and bring site management of the targeted materials. This is not considered here.

Deposit Return Evidence Summary, June 2017
23
4 Potential anti-litter impacts of a deposit return system
4.1 Summary Stakeholder agreement on the underlying assumptions behind this question is limited. We have explored credible estimates taking into account a broad range of stakeholder preferences, but acknowledge some actors may prefer estimates that fall outwith this range.
On balance we think direct savings on litter clearance to local authorities following the introduction of a deposit system would probably be between £3m and £6m. We assume weight of the targeted items (22% of the total litter stream) is the key determinant for apportioning costs to the target items for this question.
We believe the wider reduction in the costs litter pollution places on society from a deposit system probably fall between £10m and £40m. This would be an alternative to, not additive to, the local authority cost savings above. All estimates above this range depend on very high estimates for wider social costs. It’s not unreasonable to argue this, but the evidence is dependent on a single study. Estimates below this range tend to depend on the lowest item count assumption. Given our estimate for reduced clearance costs above, this tends to support a “minimum” estimate in this region also.
4.2 What variables have to be considered in reaching an estimate? There are a number of critical variables necessary to answer this question:
• The first of these is the proportion of the litter stream represented by drinks containers. Estimates range from 5% (in item counts) to 40% (by volume). Weight estimates fall between these two points (22%) as do item counts excluding small items like cigarette ends and chewing gum (31%). Different stakeholders hold very different views on which of different estimates within this range are most relevant to this discussion. Zero Waste Scotland suggest that the most applicable figure to use is likely to depend on the challenge we are addressing, rather than preferring any single figure.
• The second is the extent to which a deposit system would reduce the amount of targeted items littered. We assume this would match the overall system capture rate, and assume this would be between 70% and 90% based on system performance overseas.
• The third is the cost of litter. Local authority clearance costs for litter are around £36m a year. Clearance costs for other actors are poorly evidenced, but are non-zero, and potentially significant. Evidence on the wider costs of litter is less robust. Zero Waste Scotland in 2013 suggested estimates of £25m per year for costs already internalised within our economy, and perhaps £100m if wider disamenity costs are counted14. However, estimates as high as £361m can be calculated for the latter (see below – this is a little lower than estimates quoted in the 2013 research). Conversely, some stakeholders prefer to stick solely with local authority clearance costs given uncertainties around the other figures.
• The fourth is how costs might respond to reductions in the amount of litter, and there is no actual evidence on this. We however suggest this relationship may not be linear, and is highly unlikely to be proportional – i.e. we do not expect a 50% reduction in litter would automatically lead to a 50% reduction in costs. We therefore modelled scenarios where the relationship was sensitive to this as well as a straightforward linear relationship.
Zero Waste Scotland have explored various combinations of the above factors, to place upper and lower limits on the likely reduction in the costs litter pollution places on society
14 Zero Waste Scotland, 2013, Scotland’s Litter Problem, http://www.zerowastescotland.org.uk/sites/default/files/Scotland%27s%20Litter%20Problem%20-%20Full%20Final%20Report.pdf
Deposit Return Evidence Summary, June 2017
24
4.3 How did we arrive at our estimate?
4.3.1 How much could a deposit return system reduce litter?
The performance parameters of a deposit system may vary, and the overall capture rate may or may not be reflected in the litter stream. In modelling household waste and recycling collection impacts from a deposit system we modelled system capture rates of 70%, 80%, and 90%. We assume here similar reductions would be seen in the number of targeted items dropped as litter, and that even if this reduction in “drop” rates was not completely achieved, there would be an increase in individual “pick-up” rates (as passers-by could redeem deposits). Three different ways of measuring litter amounts have been suggested in the context of the current debate.
By weight, targeted containers account for an estimated 22% of the litter stream. In other work a discount is made for the proportion of containers that are not drinks (e.g. non-drink plastic bottles, non-drink glass bottles and jars). This may not be a necessary adjustment in the context of litter as these other items are very unlikely to arise out-of-home, an assumption supported by Incpen/KSB litter counts where non-drink items of this type were negligible15. (If this adjustment is made in the same way as for modelling a deposit system impact on household collections, it would suggest targeted containers’ share of litter stream weight would drop to 16%). Taking the higher figure, in this case a 70-90% reduction in targeted containers littered would give a 17-19% reduction in litter weight.
By volume, targeted containers are estimated to account for approximately 40% of the litter stream, though there is less evidence to go on16. In this case a 70-90% reduction in targeted containers littered would give a 28-36% reduction in litter volumes.
Item count data presented by Incpen/KSB suggests targeted items account for ~5% of all items (NB: includes cartons), though the data shows this is 31% if very small items like smoking and chewing gum litter are excluded17. In the first case a 70-90% reduction in targeted items would give an approximately 3% to 4% drop in litter overall; in the latter case a 70-90% reduction would give a reduction of between 17% and 22%.
Zero Waste Scotland believe weight measures are probably the best proxy for local authority clearance costs, though we acknowledge some small high frequency items (like chewing gum) can be disproportionately expensive to cleanse when this is undertaken, and there are also fixed overheads. The best proxy for indirect costs in contested by stakeholders – see discussion below.
4.3.2 How much does litter cost us?
The discussion in this section relates to the cost of all litter – the extent to which drinks container litter is responsible for these costs is an additional adjustment.
Direct cleansing costs There is a strong level of consensus that litter cleansing costs local authorities ~£36m a year, as reported in Zero Waste Scotland’s 2013 report, Scotland’s Litter Problem. We exclude non-cleansing
15 See for example, Keep Scotland Beautiful, 2016, Composition of Litter in Scotland, http://www.incpen.org/resource/data/incpen1/docs/KSBLitterCount2016.pdf 16 Eunomia, 2015, as previously referenced 17 Note these calculations are based on 2014 KSB/Incpen data, not the 2016 data referenced above. The overall picture is broadly comparable.
Deposit Return Evidence Summary, June 2017
25
costs (education and enforcement) for the current calculation, as these might not change at all if littering fell.
We also know from the 2013 work that cleansing costs other actors in Scotland at least £1m a year and this is likely to be a huge underestimate. Only very selective private sector costs have ever been obtained for illustration, and there is no solid grounds on which to scale this to Scotland robustly.
We would expect cleansing costs to reduce if fewer items are littered, though this may not be proportional to the actual drop in littering (e.g. overheads, or specific service frequencies might need to be maintained).
Internalised indirect costs These are costs that are currently borne financially by society as a result of litter – items such as injuries or accidents, fires, or crime or health impacts from poor environmental quality. The £25m low-mid range estimate for indirect costs in the Zero Waste Scotland 2013 research is credible as a proxy for these costs – while this is not the lowest possible estimate that could be derived from this study, given some of the known exclusions, £25m was considered easily defensible at the time. There is however no reason to think this would change proportionally to changes in the amount of litter. Some costs are proportional to the physical amount of waste (e.g. punctures or injuries from broken glass) but others may not be (e.g. any impact on house prices would be related to overall perception which may or may not change in direct relationship to changed litter levels). Externalised indirect costs These are costs that do not have a direct financial implication – estimates for the social disamenity of litter are broad, but the correct figure to value this impact is potentially very high. The range of estimates for neighbourhood disamenity identified in the 2013 research ranged from £73m to £770m. For beach littering alone, a single study suggested a range of £50m to £100m. Overall the Zero Waste Scotland 2013 study suggested £100m was a readily defensible figure; our consultants (Eunomia) preferred £513m. Subsequent analysis by Zero Waste Scotland in 2016 suggests the high end figure of £770m relies on a very generous scaling assumption (it takes stated willingness to pay by individuals and scales this to Scotland). Given the nature of the source study, which was based on willingness to pay council tax, we believe a more conservative scaling assumption would be household numbers, which implies a figure of £361m. In turn, this might be considered to make the Eunomia preferred figure of £513m somewhat high. Regardless of the figure used, if externalised costs are chosen to calculate the potential savings for society from a deposit system, this should not necessarily be added to internalised costs as it is assumed this boundary is likely to be blurred in the methodologies and approaches of some of the studies reviewed. There is no reason to think these costs would change proportionally to changes in the amount of litter as almost all are dependent on a perceptual element.
4.3.3 How will litter costs respond to a reduction in litter amounts?
There is no reliable evidence on this. However, as indicated above we do not expect the reduction to be directly matched (e.g. a 50% reduction in litter will not lead to a 50% reduction in costs), and indeed it may be wholly non-linear. While in theory this relationship could be positive for society (with cost reductions greater than reductions in amounts) it seems more credible to explore options where cost reductions are less than reductions in amounts – where overheads are involved this makes sense,

Deposit Return Evidence Summary, June 2017
26
and where perceptions are involved, anecdotally 100% cleanliness is rated much higher than marginal improvements by the public.
In this paper we simply explore three possible relationships – a drop in litter is assumed to give a matching drop in costs, a drop in litter is assumed to give a drop in costs that is 25% less, and a drop in litter is assumed to give a drop in costs that is 50% less. This helps establish a range of possible cost savings but does not predict which scenario is more credible.
4.4 Adding it all up In an appendix we present a table for direct cleansing costs and internalised costs in line with the discussion above. We then present a table that attempts to consider externalised costs. The low end estimate here matches the cleansing and internalised cost figures (i.e. £62m), the medium figure was that ultimately preferred by Zero Waste Scotland in our 2013 research (i.e. £100m), and the high end figure was that preferred by the consultants in 2013, as amended (i.e. £361m).
We then explore these numbers in relation to the different estimates for the extent to which drinks containers are responsible for litter overall, different levels of reduction in litter as a result of deposit system performance, and different levels of relationship between litter and costs. The full tables for this are reproduced in an appendix, while a descriptive summary is below
Impact on local authority direct clearance costs Using weight as a preferred proxy for what may be in scope for local authority cleansing savings, suggests they would save between £5.5m and £7.1m if savings are directly proportional to litter reduction. However we think savings will not be directly proportional – if they were as much as 50% less, then the savings seen would be between £2.8m and £3.6m.
However, local authorities would see additional savings in a deposit system environment from a slower fill (and thus less frequent servicing rate) on public bins – savings here would be likely to relate to waste volumes, and thus be proportionally higher than for cleansing. So qualitatively we think suggesting local authority savings of between £3m and £6m per year seems reasonable.
We judge using item count as a proxy in this context to be unduly conservative. However if this is used, it suggests savings for local authorities between £0.6 and £1.6m from street cleansing. We do not believe savings would be less than this. Similarly, if volume is used as a proxy, which we consider to be unduly generous in this context, it would suggest savings of between £5m and £13m. We do not believe any estimates higher than this would be credible.
Impact on wider costs We’d highlight that some estimates of wider costs – especially those at the high end, should be considered alternatives to, rather than additional to, the local authority direct savings above. We have presented them this way in summary.
Taking a conservative view of all costs - including local authority and known private sector direct cleansing (with the latter known to be a large under-estimate), plus a figure of £25m for wider social costs - the potential savings from a deposit system range from £1.1m (70% return rate, benefits assumed to be proportional to item count, benefits assumed to be 50% less than actual reduction in litter) to £22.3m (90% return rate, benefits assumed to be proportional to volume, benefits assumed to directly match the actual reduction in litter).
Taking a maximal view of all costs (we’ve put a ceiling of £361m as identified above, which is a little lower than some previous high end estimates) the potential savings from a deposit system range from £6.3m (70% return rate, benefits assumed to be proportional to item count, benefits assumed to be 50% less than actual reduction in litter) to £130.0m (90% return rate, benefits assumed to be proportional to volume, benefits assumed to directly match the actual reduction in litter).
Qualitatively, only scenarios assuming very high end starting costs for litter on society see overall benefits estimated to exceed £40m. This is not to say these estimates are wrong, but the evidence for
Deposit Return Evidence Summary, June 2017
27
some of these large intangible costs probably needs to be strengthened to make a compelling case for some audiences. .
At the low end, Zero Waste Scotland is inclined to believe that overall estimates falling below our preferred local authority direct cost savings range (of £3m to £6m) seem very low, given these costs are potentially relatively tangible, and will be bolstered by a (not calculated) additional saving to public bin servicing.
Qualitatively, Zero Waste Scotland finds the argument that litter volume will be a key factor is the social costs of litter to be persuasive – given perception of local environmental quality is likely to be largely visual – though we note other factors (such as disgust, or perceived danger) will also play a key role18. However, glass bottles, or more specifically broken glass, may in fact be in the category of items that is viewed particularly adversely. Estimates for savings based on litter volume range from £8.7m to £130.0m, with almost all falling above £10m, and we have thus selected this as a floor value.
Qualitatively we therefore suggest that the cost benefits of reduced litter for society resulting from a deposit system (including cleansing costs, but excluding any monetised value for carbon from recycling) probably fall between £10m and £40m. Figures above £40m are also credible, but depend on a high assumed social disamenity estimate.
5 Potential implications of a deposit return system for consumers
5.1 Summary We have investigated two areas in relation to consumers. The first relates to placing a value on consumers’ contribution to a deposit system, in terms of time and effort required to participate. This is an area where stakeholder consensus is limited. We have pursued one analytical option – based on a “rational actor” model of economic analysis – but highlight its limitations here as well. The rational actor model suggests the value of the public’s contribution may be in the region of £23m - £38m, but Zero Waste Scotland is inclined to see this as a top-end estimate, given the methodologies employed.
The second aspect we have sought to investigate is around evidence a deposit system might influence consumer behaviour more widely (for example shopping habits, product choice, or other recycling behaviour). Whilst a number of hypotheses for how a deposit system might influence these factors have been advanced, there is little robust evidence available. In this section we briefly outline discussions that have taken place. One area where stakeholders did often agree was that public surveys can have limited value in anticipating how the public will react to a deposit system in future – at present this is a hypothetical question about an unknown system, and responses appear to be heavily influenced by how the questions are asked. We have therefore drawn very little on the (often divergent) survey evidence we have seen in this section.
5.2 Valuing the public’s contribution
5.2.1 Overview There is a value to the public’s contribution to a deposit system, but little stakeholder consensus on what it should be.
After discussion with the social research team and economists at Scottish Government, Zero Waste Scotland applied a rational actor model of economic analysis to the problem. In this approach we assume people’s willingness to make the effort to reclaim their deposit, or not to bother, is, in relation 18 Though not directly designed to answer this question, for an insight into how the public views litter, and what they care most about, see Brook Lyndhurst for Zero Waste Scotland, 2015, Public perceptions and concerns around litter: qualitative insight research, http://www.zerowastescotland.org.uk/sites/default/files/Public%20Perceptions%20and%20Concerns%20around%20Litter%20report.pdf

Deposit Return Evidence Summary, June 2017
28
to the size of the deposit, a good proxy for value. In other words, if you are willing to return a container for a 10p deposit, then the costs of participating in the process for you must be 10p or less. Willingness to pay can then be theoretically mapped against varied deposit levels and return rates overseas.
This approach suggests the value of the public’s time is between £23m and £38m. We believe this estimate may overstate the value of the public’s contribution for a number of reasons. A weakness in this analysis is that overseas systems show surprisingly little variation in return rates by size of deposit. Qualitative evidence suggests system design and convenience may be much more significant than the deposit in encouraging participation.
In addition, some members of the public may derive net benefits from recycling (e.g. a sense of satisfaction), and the fact that as people become habituated to the new model, their willingness to recycle this way regardless of the incentive would become more established. Based on the experience of carrier bag charging, we also suspect that placing a value on an item may change people’s perception of its importance far more than the amount assigned to it might in itself justify – i.e. it sends a value signal that society values a particular behaviour.
One industry study took an alternative analytical approach, assigning a value to the amount of time they believed it would take members of the public to participate in the system. This gave a higher estimate of £66m.
This analysis covers only the potential value of the public’s direct participation and does not reflect the extent to which wider costs and benefits of the system might be passed on to the public as either consumers, residents, or taxpayers.
5.2.2 Summary of assumptions and considerations
A deposit system is dependent on public engagement and participation – and this contribution has a value. Putting a price on that value is more contentious, and Eunomia chose not to do so in their 2015 report, as they felt the evidence was too weak.
Although participation is often seen as a cost alone (either in terms of time, or inconvenience) there may also be satisfaction derived from opportunities to recycle; as is indicated in many household recycling surveys on motivations to recycle. Thus here we try to focus on the net value of the public’s contribution, rather than a simple “inconvenience” or time cost. Different approaches can be suggested, which give different estimates. Essentially the decision on how to value the public’s contribution is a subjective one.
To tackle the question, we asked the Scottish Government research team if they had a preferred approach that would stand scrutiny in a Business and Regulatory Impact Assessment (BRIA). They suggested a preliminary estimate should be made in line with a “rational actor” model of economic behaviour. This assumes that each individual weighs the personal costs and benefits to themselves before choosing to recycle, or not recycle, a container. In theory this decision should take into account all pertinent factors for an individual. Under this approach the amount of the deposit can then be used to measure value – i.e. if you are willing to return a container for a 10p deposit, then the costs of participating in the process for you must be 10p or less.
The modelling approach used is detailed below, but suggests the public’s contribution could be valued at €32-€52m (approximately £23m-£38m)19. This assumes 25% of containers would be recycled anyway (i.e. with a return-to-retail model, but no deposit), and an 85% return rate for a deposit system.
Our confidence in this number is low. However we suggest this is likely to be the upper end of the range of credible estimates.
One reason for thinking this is a high end estimate is that it excludes the potential of net benefits from recycling to some consumers. This benefit could arise where people would still recycle under a return 19 Our underlying analysis is in Euros, reflecting the majority of the source data; conversion to pounds introduces some additional uncertainty (the exchange rate has changed significantly since we first undertook this analysis in 2016), but we do not think this significantly affects the overall conclusions.

Deposit Return Evidence Summary, June 2017
29
to retail recycling scheme even without a deposit, and thus for them there is no net cost – indeed their satisfaction at having recycled may even imply a net benefit. The potential reduction in the value of the public’s contribution this might entail is analysed in the appendix, where a range of scenarios and assumptions are explored. Note that the analysis is in Euros, reflecting the majority of the source data.
Another reason for viewing this as a high end estimate is that over time a new recycling model (return to retail) will become habituated – this effectively raises the point at which people would recycle regardless of the size of the deposit that is redeemed, and thus reduces the “cost” of their contribution. Tentatively we suggest the value of the public’s contribution might therefore fall in subsequent years – e.g. if new habits led to an increase in the level of return that would be seen in the absence of a deposit (say by 5 percentage points), then this would reduce the cost attributable to the public (in this example by €2-€3m - approximately £1m-£2m). The true scale of the reduction in costs could be greater or smaller than this.
One limitation of this approach in valuing the public’s contribution is that return rates and deposit size overseas do not vary all that much in relation to each other20. Some studies have suggested a more important variable than deposit size in influencing return rates is the frequency and convenience of collection points. Sufficient data to explore this quantitatively is not available, however qualitatively it suggests that the perceived convenience (and perceived social value) of a deposit system in Scotland might make a significant difference to how the public valued their own contribution, and their willingness to take part, in practice21.
At a more theoretical level, the rational actor model can be (fairly) criticised on a number of grounds: • Individuals do not in fact make all our decisions based on a full calculation of costs and
benefits (many other factors influence our behaviour in practice), and how we perceive costs and benefits can also change over time. A very pertinent example of the latter would be if the deposit sends a “value signal” (by showing society values the material) which may encourage people to take recycling more seriously regardless of the direct financial incentive22.
• This analysis accounts poorly for income inequalities as the richer you are the easier it is to forgo the deposit, and your time and effort is effectively valued more highly than that of someone more price sensitive. This may mean inconvenience is overpriced for some and underpriced for others, compared to a more equitable society.
There is also a data limitation here as there is relatively little variation of deposit levels in overseas schemes, and evidence for likely behaviour at low levels of deposit (which would impact the result significantly) is weak, as is evidence of the likely level of recycling in Scotland (or elsewhere) with a return to retail model, but no deposit (also an important assumption). However, we believe this approach would be considered robust enough for a BRIA, though formalising the source data and re-running the calculation might make it more robust in that case. This analysis of costs to the public does not consider the price the public already pay (through purchase price or taxation) for dealing with targeted containers, nor how this might change, positively or negatively, under a deposit system regime.
20 The evidence used in our own analysis supports this, with apparent price insensitivity between €0.06 and €0.30 in achieving return rates of over 90%. 21 In considering convenience it might be the case that the public would see this differently in a country (like Scotland) where kerbside services were also already available. Most overseas schemes were introduced prior to widespread kerbside recycling. 22 As an example of a value signal, carrier bag charging has seen large reductions in bag use in countries where it is introduced, but the charge is typically small as an actual deterrent. It is credible to suppose much of the drop comes from prompting people to (re)consider their action, with the price sending a signal bag use is undesirable.

Deposit Return Evidence Summary, June 2017
30
5.3 Other implications of a deposit return system for consumers Three hypotheses for changed consumer purchasing behaviour have been advanced: that consumers will shop more or less in larger or smaller shops, depending on whether take back is available; that consumers will make more shopping trips; or that consumers may make different purchase decisions.
The most satisfactory way to answer these questions would be by examination of overseas sales data in relation to the introduction of a deposit system23. Such information is not available, and disaggregating the impact of a deposit system from other drivers would potentially be impossible in any case. However, the lack of information overseas does incline us to think that deposit system impacts in this regard are not large – otherwise they would be more visible. An exception to this is evidence from overseas relating to changed preferences for single use and multiple use containers, though this may have been driven as much by manufacturer preferences as consumer preferences. We do not believe this insight is relevant to Scotland – the Scottish market is overwhelmingly single use containers at present, and we do not think a deposit system would incentivise significant changes24.
No convincing evidence has been seen suggesting changed choice of shopping venue should be expected, though participation in a deposit system for smaller stores may be desirable to ensure that consumer convenience is maintained.
Likewise, there is no convincing evidence a deposit system will distort product choice. Theoretically it should not – the deposit itself is refundable, and the per item cost implication is very small, as discussed in the next section. There is though a theoretical risk the deposit could distort consumer choice if its refundable nature is not understood and non-deposit bearing substitute items are available.
Whether consumers would make additional shopping trips (motivated by a desire to reclaim deposits) is contested. We might anticipate return behaviour would be integrated into existing shopping routines, provided the system is equally convenient. However, some stakeholders believe additional trips would be made (driven perhaps by a desire to release money held in deposits sooner) and that this could have an adverse environmental impact (for example if trips are made by car). Any adverse environmental impacts of this nature would need to be offset against the environmental benefits of a deposit system.
Zero Waste Scotland believe good communication and transparency in how the system operates, as well as convenience, are probably the key factors in ensuring a deposit system works for, and is accepted by consumers. Clear labelling is often identified as primarily an anti-fraud measure, but would also significantly aid consumer understanding – especially in any system where some items were in scope and some were not, which could cause frustration if consumers tried to return ineligible items.
23 An alternative route is to assume that the full costs of a deposit system will be passed to consumers in the price paid – even at the high end of available cost estimates the per container marginal cost increase is minimal, and would certainly be invisible to market price analysis. 24 We note that the rationale for some overseas systems was to explicitly protect or encourage multiple use containers, and this is reflected in the design choices made. However, the Scottish market is in a very different starting position to countries where this rationale was applied.

Deposit Return Evidence Summary, June 2017
31
6 Potential implications of a deposit return system for manufacturers and retailers
6.1 Overview Zero Waste Scotland have summarised different estimates regarding manufacturing / business costs primarily from two different sources: the Eunomia scoping study, and a PRGS submission. We have also seen statements on industry costs in Germany supplied by PRGS, and have seen a presentation on costs in Lithuania presented (in a pro-deposit system forum). Without taking specialist sector advice we are not in a position to judge the relative validity of the claims made. Narrowing the range of available estimates is only likely to be possible in relation to specific system design considerations. PRGS estimate costs for the soft drink sector alone would be £92m in the first year (including set up) and £74m a year thereafter. This assumes a “gold standard” in terms of system design. It also includes an assumed decrease in sales, which may be a significant slice of the total (no breakdown is provided). Costs in Germany, as provided by industry and extrapolated on a per capita basis to Scotland, were for set up costs £40.7m (in this case borne by retailers) and per annum costs equivalent to £44.5m (for the packagers). Lithuanian costs for set up appear similar (£41m). We have not sought out costs estimates for overseas schemes systematically, and have, for the moment, relied on examples shared with us by others. The per capita scaling used here is crude, and does not account for contextual differences or overheads versus marginal costs. It is also dependent on the exchange rates at the time of calculation. Eunomia’s estimated costs in their 2015 study covered all drinks. They suggested set up costs would be £22m, but that £17m of this would relate to changes in stock warehousing levels and would ultimately be redeemed. They suggested running costs would be between £15.6m and £26.9m, depending on the size of the “producer fee” needed to cover system management. They also highlighted running costs could be lower again if fewer anti-fraud measures were required on packaging. These estimates are broken down, where possible, in the next section, and qualitative feedback on where costs may arise is also discussed. Additionally, manufacturers and retailers have raised concerns about hygiene considerations - and their logistical impact – in a deposit system. These are discussed in the final part of this section.
6.2 Cost estimate breakdown PRGS Estimates
The Packaging Recycling Group Scotland submitted cost estimates for a scheme covering all soft drinks. This is summarised below:
For soft drink manufacturers who are PRGS members25 = £57m in year one (set up and running costs)
= £46m in running costs thereafter 25 As context in considering sector costs, the UK soft drink sector (which counts most non-alcoholic, non-milk drinks) sold 13.3 billion litres in 2015, for a sales revenue of £13.95 billion - See http://www.britishsoftdrinks.com/write/MediaUploads/Publications/Revised_BSDA_Annual_Report_2014.pdf and http://www.britishsoftdrinks.com/write/MediaUploads/Publications/BSDA_Annual_report_2016.pdf. On a per capita basis that gives a Scottish sector of 1.1 billion litres and £1.2 billion in sales.

Deposit Return Evidence Summary, June 2017
32
For all soft drinks if sector costs are proportional to PRGS members’ market share = £92m in year one (set up and running
costs) = £74m in running costs thereafter
For all products in scope – no formal estimate can be made but assumed to be higher. The above costs include:
• Expected loss in sales, “SKU rationalisation”26, • Additional printing costs, • Additional security, • Additional line changeovers, • Increased delivery loads, • Additional employee hours for the above.
No breakdown of costs against individual headers is provided. The above costs explicitly exclude:
• “Anti-fraud” inks27. • One-off joining fee for deposit system governance / central system. PRGS quote Eunomia’s
estimate of £15m for set up. This figure is acknowledged to be uncertain. (The Eunomia report also does not specify who would pay this).
• Producer fee28. This is estimated to be between £1.7m and £4.9m per annum, but would vary based on system performance.
With no breakdown it is hard to say how much of this overall estimate comprises of system costs per se and how much from assumed sales impacts (which at this stage are hypothetical – evidence of negative sales impacts has not been seen during the wider evidence gathering process). The logic of a deposit should not depress sales – as it is returned to the consumer – provided consumer understanding is good. However industry might suggest sales impacts if perceived inconvenience puts off consumers; specific SKUs are withdrawn; or if the costs to industry of a deposit system are passed to consumers as higher prices. It also appears industry assume provision of a “gold standard” system. This accurately reflects the design of the highest performing European schemes, but it should be noted that some cheaper US systems do not have such rigorous labelling and security requirements. The requirements of system design – and the cost implications – would be key factors to consider in any actual implementation of a deposit system in Scotland. These figures are high compared with all the other estimates presented here. Differences relate to both scope and assigned costs for specific items. German Deposit Return System Estimates
26 SKUs are Stock Keeping Units and represent the number of product lines available. Rationalising product lines would be expected to generate process savings, so this appears to be for loss of sales where a product line is withdrawn as maintaining separate SKUs post-deposit system (i.e. if Scotland required a new product line due to labelling requirements) means they are no longer economic to sell in the market. 27 Industry quote Eunomia as saying these cost 0.25p per container. If Scotland accounts for a per capita share of UK soft drink sales (8.3% of 13.3 billion litres in 2015, giving 1.1 billion litres) then this amount would be £8.2m (if everything was sold in small 330ml containers requiring the technology). We think actual number of units is significantly lower than this (reflecting sales of larger containers) based on data implicit in the PRGS submission and that costs might be £1.7m. 28 Producers are assumed to cover any shortfall in system management in the Eunomia model. The value of this fee is therefore dependent on system performance – and will be higher the better the system performs (as there will be fewer unredeemed deposits as a revenue source).

Deposit Return Evidence Summary, June 2017
33
German figures on costs were share by PRGS and were: • Initial set up of the system retailers (€726m); and • Annual running costs for the bottling industry (€793m).
These can be scaled to Scotland on a per capita basis, and current exchange rates29. Actual costs may or may not be proportional in this way, but this does provide an interesting external reference point. In particular, the per capita scaling used here is crude, and does not account for contextual differences or overheads versus marginal costs. This approach suggests set up costs equivalent to £40.7m and per annum costs equivalent to £44.5m. Whilst these relate to an actual system, this may not be a good proxy for any future Scottish system, and as with the other estimates here, what is counted in, and counted out, may not be consistent. Potentially one difference in Germany is that the market will have had a large number of unique German product lines already (whereas Scotland is a subset of the UK market in product line terms). Exchange rate differences may not be insignificant in this calculation, even if per capita scaling is reasonable. Lithuania Deposit Return System Estimates Zero Waste Scotland saw a presentation on the Lithuanian system, presented by a representative of the Lithuanian Retailers’ Association in Edinburgh in 2016, to a pro-deposit system audience. In summary, this identified:
• Lithuania’s system launched in 2016. • Set-up of the system was quoted as €30m, plus retailer costs – but the majority of retailers
paid nothing with equipment installation paid for by the machine providers with financing coming from the usage fee.
• Some breakdown costs were €22m for Reverse Vending Machines (RVM) machines (though it was implied much of this financing came from machine providers), and €7.5m for counting centres and central administration.
• The scheme was presented as having created 100 administrator jobs and 1,000 servicing/support jobs.
This can be scaled to Scotland on a per capita basis at current exchange rates. Taking the €30m figure, this suggests a set up cost in the region of £41m. Similar caveats apply here as they do to the Germany example above. However it is also worth noting that the spread of who paid what is potentially quite different in the Lithuanian system, with the business model around the take-back machines ownership and financing avoiding many upfront costs for retailers. Eunomia 2015 Estimates Eunomia estimated costs assuming all drinks might be in scope for a system (i.e. a much broader coverage than the soft drink figures calculated by PRGS) as part of their 2014 study on how a deposit system might work in Scotland. Eunomia’s costs include: Set up / one-off:
• £4.8m one-off cost to redesign labels • £17m stock keeping costs30 (to up standing reserve of product) – though this product will
ultimately be sold
29 Exchange rate calculation made in early 2016 30 If two SKUs (instead of one as currently) are in place in the UK market, meaning supply and demand can only be balanced from within a smaller subset of product, Eunomia believe overall stocks would need to be higher to ensure there were no localised shortfalls in stock.
Deposit Return Evidence Summary, June 2017
34
Ongoing per annum costs: • £6.9m cost for anti-fraud inks (if required) • £1.2m ongoing sock keeping costs • “Minimal” administrative costs (registration, new SKUs etc.) • £5.7 - £17m in producer fees • £1.8m retailer time costs31
There are no explicit exclusions. Despite the broader scope of their analysis (all drinks, not just soft drinks) Eunomia’s estimates for costs are much lower than PRGS’s. Industry count some factors Eunomia do not, as well as assigning quite different values to some specific components. There is not stakeholder consensus around either of these issues. Eunomia’s report is generally more “optimistic” about the requirement for individual SKUs and labelling post-deposit system – suggesting scope for fraud is limited, thus negating the need for some packaging features designed to counteract this, and highlighting schemes where these requirements are minimal. Qualitative manufacturer feedback Feedback from manufacturers suggests they would see additional costs in the following areas of their process:
• Increased number of SKUs (assumed to double, as Scotland/rest of UK split is made) meaning significantly more down time on the production line at changeover points, and decreased efficiency at restart. The former was the largest single cost identified.
• Distribution / warehousing changes to manage separate SKUs – though these will depend on specific circumstances and may cancel out
• Stockholding costs (as a larger amount of storage space will be needed to maintain minimum stocking levels for all individual SKUs)
• Administration costs in terms of more complex stock management and need to record information for deposit system compliance
• Producer fees and relabelling. This was the second largest cost identified. • Concern about any impact on sales growth – with an acknowledgement this impact is not
known.
Costs were shared for the above on a confidential basis so no figures are presented here. However, if the assumed additional costs are correct, they are large as a proportion of this business’s reported profit margin. This feedback was insightful as it gives concrete evidence of where within operations costs may be incurred. Many of the points raised here are implicit in the other analyses presented so these are not additional to other estimates submitted. We have not sought to scale from this individual submission to the wider market both to protect confidentiality and because the costs quoted may be business unique. The extent to which these costs might apply – and how large they would in fact be, might be significantly influenced by system design. Qualitative Retailer Feedback Retailer concerns are reflected in the above to some extent, but unique concerns were also raised.
31 Eunomia assume most retailer costs (space, machines, etc.) are generally offset by handling fees, and that support could be made available for initial set up. This cost therefore relates to any handling requirement on small retailers if they accept take back (Eunomia propose they could be allowed to opt out).
Deposit Return Evidence Summary, June 2017
35
Space requirements in store (either for takeback equipment or container storage) were commonly mentioned, with smaller retailers most concerned about the impact. Concerns relate not just to the absolute availability of space, but also to the loss of space available for retail activity. The requirements on staff to support returns of containers (and the extent to which they would be providing quality control in manual takeback contexts) were also raised.
The other major concern from this sector concerned logistics. Some deposit system models assume containers would be “backhauled” (i.e. returned in the same vehicles that have delivered goods to the store). The extent to which this is feasible, and / or might require compartmentalisation of vehicles to separate product and empty containers was raised by retailers of all sizes – in some cases this would be an “in-house” operation, and in others might relate to third party suppliers. This concern is also relevant to the hygiene discussion below. If additional transportation is required, this would have a cost and carbon impact.
In contrast, supporters of a system highlight the deposit systems operate in a number of very different contexts in Europe, and that retailers of all sizes participate; indeed, in a deposit system environment, retailers have a potential interest in being a return point, as returns by consumers are likely to be undertaken as part of a shopping trip. It is also the case that overseas systems provide a “handling fee” (usually a small, per container micropayment) for take back operations. The exact way in which this was structured would be a very significant consideration in the economics of a deposit system for retailers. In some countries, operators of take back points also gain ownership of the material collected – this too is a potential income stream.
Other considerations in the industry costs discussion All assumptions around cost are heavily dependent on system design and (if not mandated) the extent to which companies choose to create distinctive SKUs and labelling. We note that reducing these requirements might have the effect of increasing opportunities for fraud or cross-border flows, which might in turn generate other costs. High performing European schemes do typically appear to incorporate these features. The relationship between a deposit system and the existing PRN (or other) regulations is worth consideration in this context. If the PRN is replaced for these actors by a deposit system this would involve some reduced costs. It’s notable Lithuanian and German set up costs look similar on a per capita basis (and sit midway between PRGS and Eunomia estimates). This could be further explored in relation to overseas schemes, though Scottish costs would depend on Scottish design. Who pays what, and when, in system set up and operation varies significantly across schemes, and it may be helpful to consider not just “costs to industry” but who pays what in discussion. It is hard to move the discussion on manufacturer and retailer costs forwards without a clearer understanding of system governance and design options, which could have very significant impacts on the answers to these questions. Zero Waste Scotland note that to date we have not had discussions with the hospitality sector around the implications of a deposit system for their sector – hospitality outlets are potentially significant consumers of targeted containers.
6.3 Hygiene considerations around deposit return system design Specific concerns were raised by manufacturer and retailer representatives around hygiene, in terms of storing returned containers on retail premises, during backhauling operations, or as part of online shopping delivery services. Retailer representatives suggested they would compartmentalise vehicles for backhauling and online shopping, both to address these concerns, and because they believe
Deposit Return Evidence Summary, June 2017
36
customers would expect this. Compartmentalisation is assumed to have a negative cost and efficiency32 impact on logistics operations in this scenario. Online shopping is a larger part of the UK retail scene than in most other European countries with deposit systems.
Supporters of deposit systems highlighted that deposit systems already run around the world, in different contexts and climates, and that hygiene concerns are not apparent from actual operational systems.
Zero Waste Scotland note that the relevance of some of these points is likely to be heavily dependent on system design. What materials are in scope (specific concerns were raised around empty milk containers by manufacturers), how items are consolidated and transported, and the extent to which any additional costs are reimbursed, would all depend on system governance and design considerations.
7 Potential implications of a deposit return systems for material prices and quality
7.1 Summary Future material prices will be determined by much wider contextual factors in what is essentially a global marketplace. For this reason we make no quantified projections for future prices. However, it is reasonable to reach conclusions on the potential impact of a deposit system on material quality, and to suggest the likely implications of this for the reprocessing sector. As with some other elements of this analysis, the exact governance and design of a deposit system in Scotland would influence how costs and benefits were distributed among actors in the collection, sorting, and reprocessing sectors.
Overall, we believe a deposit system would provide high-quality, very low contamination material streams without further treatment, and that this would be higher quality than obtained from current collection systems (though comparable quality can be achieved, at a price via current sorting operations).
Reprocessors are willing to pay a premium for higher quality material, but this premium depends on wider market conditions, volumes, and the perceived difference in quality. The negotiating power of collectors, sorters, and reprocessors also fundamentally shapes contracted prices and fees. High quality material from a deposit system may find a different route through the market to current practice (e.g. bypassing some elements of the current recycling chain, and / or via a larger or smaller number of suppliers / aggregators).
A deposit system might also alter costs, prices, and material quality in other ways, with a further impact on price, but this is hard to predict. Conflicting views have been advanced – one argues prices for other recyclate will fall, as high-quality material will have been taken out, lowering the average value, while others argue it may rise, because processors who can extract targeted containers will be able to claim the additional deposit value.
7.2 Detailed discussion It is hard to obtain a meaningful quantified estimate for this given wide variation in material quality and pricing currently, plus long term volatility in material prices. We do not think valid quantified estimates of future material prices in a post-deposit system environment can therefore be made.
While the scale of the effect is hard to quantify, qualitative consultation with Zero Waste Scotland experts has highlighted the following conclusion about the likely direction and nature of effects on material prices and quality from a deposit system.
32 In turn, reduced efficiency in logistics networks might mean more vehicles or more vehicle miles, with an associated carbon impact.
Deposit Return Evidence Summary, June 2017
37
A deposit system would provide high-quality, very low contamination material streams, without further treatment. When operating properly, the take back point (whether machine or manual) rejects contamination at source, unlike any existing systems. Errors are still possible, but are likely to be a tiny proportion of the overall material flow, especially if clear product labelling facilitates accuracy in manual take back contexts. In fact the risks around contamination and rejection in a deposit system appears to tilt the other way, with the possibility that recyclable items are incorrectly rejected, as happened at times during Scotland’s Recycle and Reward pilots.
Excellent material quality was seen at almost all sites during the Recycle and Reward pilots in Scotland. The exceptions typically were older machines; once optimised we believe these still outperformed other collection systems on contamination, but incorrect rejection was sometimes harder to resolve.
Contamination may be lowest in machines that separate all materials for in-machine storage, though twin-material storage also has little or no contamination from untargeted material, and is more easily separated later than most alternative co-mingled streams for this reason.
Unlike in the Recycle and Reward pilots, the collection system built around a national deposit system would ensure these pre-separated streams were dealt with optimally further down the collection / reprocessing chain; whereas in the Recycle and Reward pilots, existing waste management contracts, and relatively small volumes, meant economic benefits from material quality improvements were not realised. Overseas deposit systems provide high quality and exceptionally low contamination material streams.
Current collection systems do not typically achieve this level of quality. Both kerbside and non-kerbside collections vary significantly in material quality. Some kerbside schemes in some areas do achieve high levels of quality, but other areas are more challenged. Even if large numbers of householders recycle perfectly, a small number of households can add significant contamination to the system. Kerbside sort may achieve very high levels of purity, given high levels of staff/equipment performance, but is a minority of the collection system in Scotland currently. Similarly, some bring sites / HWRCs for some material streams achieve high quality in some contexts. However non-kerbside routes like Recycle-on-the-Go face significant quality problems in some contexts.
We have less information on material quality for targeted items in commercial collections. Where large volumes are generated through a manual staff-led process (e.g. glass collections in a hospitality context) quality is likely to be very high and may match quality from a deposit system. However, where systems are more incidental to the business, or dependent on customer participation, they are likely to face similar quality challenges to household collections or Recycle-on-the-Go contexts.
Current sorting processes may achieve comparable levels of quality, at a price. Experts highlight that MRFs (Materials Recovery Facilities, where mixed recyclate is separated) can achieve progressively higher quality by rerunning material through their process. Clearly this comes with increasing costs, and is also more likely if the MRF has spare capacity at any given time, and the value of this is still somewhat dependent on the quality of the starting material. Generally we do not think MRFs achieve a comparable material quality to a deposit system for the targeted materials currently.
Reprocessors are willing to pay a premium for higher quality material. This premium depends on wider market conditions, volumes, and the perceived difference in quality. The negotiating power of collectors, sorters, and reprocessors also fundamentally shapes contracted prices and fees – there is not necessarily a meaningful single price point for the “market” as a whole currently. A deposit system might provide greater certainty on volumes and perceptions of quality compared to current practice. Depending how material ownership was managed in the deposit system governance arrangement, this might also shift negotiating power positively or negatively in terms of achieving highest prices.

Deposit Return Evidence Summary, June 2017
38
A deposit system might also alter costs, prices, and material quality in other ways, with a further impact on price, but this is hard to predict. Two contrasting theories have been advanced for the likely impact of a deposit system on the value of mixed recyclate from other sources. As two high value streams (plastics and cans) will be significantly reduced in mixed recyclate, this would exert a downward pressure on prices. In contrast, if sorters could redeem containers they were able to extract from mixed recyclate, this might push prices up.
MRFs will still need to separate targeted items from mixed recyclate in some way to maintain material quality, as the deposit system will not capture all items. The fact that the volumes are much smaller may impact the economics of doing so.
Currently loads that are too contaminated are rejected by MRFs. Improved overall quality would potentially reduce the number of non-compliant loads, increasing overall recycling. However, including these more marginal loads in sorting processes, while representing a volume improvement in recycling, might dilute some of the quality improvements that could otherwise be seen in non-deposit system recyclate.
Reduced glass content in mixed recyclate would be a positive for sorters as glass inflicts significant wear and tear and thus maintenance costs on MRF processes.
The ability / willingness of sorters to pass on these factors to collectors or reprocessors in pricing terms would depend on market conditions.
High quality material from a deposit system may find a different route through the market to current practice (e.g. bypassing sorters, and / or via a larger or smaller number of suppliers / aggregators). Any change in market structure and thus negotiating power would undoubtedly impact price. Without a clear deposit system management model in mind, we have not considered the implications of this at the current time. This would relate to who “owns” material in the system and who receives handling fees / picks up management costs.
We assume that while reprocessors will pay higher prices for higher quality material, they will also obtain higher prices for the recycled material they then sell on, with no net additional financial cost/benefit effect on their operations.
A deposit system might lead to additional household and consumer behaviour changes around contamination and thus quality. Reduced volumes of targeted containers might also reduce contamination in remaining mixed streams, both because there will be fewer items, and because communications around a deposit system could also be leveraged to improve confidence about recycling options for non-target materials. Overall, this impact would be positive for quality and thus price of non-target material.
More speculatively, the fact a deposit system brings people face to face with their own contamination for targeted materials (as rejects are passed back to customers) may improve the public’s overall awareness of the importance of material contamination and quality, with beneficial impacts for behaviour in relation to other collection routes.

Deposit Return Evidence Summary, June 2017
39
Appendix 1: Detailed assumptions behind local authority collection cost modelling This section sets out the assumptions on material volumes and prices that underpin the modelling described in this report. The model itself is too large to present in anything other than its original spreadsheet formats.
Material Flows: How much of each material type is the targeted items? Waste and recycling data does not typically record item type. So while we have good estimates for “material” (e.g. glass) volumes, we do not have direct waste data below this level (e.g. drinks bottles versus food jars). We therefore made the following assumptions:
• Plastic Bottles: We assumed 75% were drinks bottles, based on an estimate in the Valpak market assessment and feasibility reports in 2015. This is assumed in the preliminary analysis to cover all drinks, including milk (which is in practice often excluded from coverage in deposit system overseas). We assumed this split was equal in both recyclate and residual waste streams but acknowledge drinks bottles may be more likely to be recycled than other bottles.
• Glass Bottles: We assumed these represented 76% of all glass, based on estimates in Valpak’s 2015 reports. Valpak further estimated 90% of bottles were drinks bottles, meaning drinks bottles would account for 68% of all glass. This is assumed in the preliminary analysis to cover all drinks, including wine (which is in practice often excluded from coverage in deposit systems overseas). We assumed this split was equal in both recyclate and residual waste streams but acknowledge drinks bottles may be more likely to be recycled than other bottles.
• Cans: Steel and aluminium cans and food and drink cans are not always well-distinguished in compositional studies and estimates. In particular, while the majority of drinks cans are aluminium, some are steel (and these may be heavier per item), however “steel”/”food” and “aluminium”/”drinks” are often used interchangeably in compositional studies, introducing some ambiguity. For our model we assumed:
o Steel cans represented 71-74% of the can total, based on Valpak estimates in 2015. Of the remainder, Valpak assumed 93% of aluminium cans were drinks cans. This suggests 24-27% of all cans are aluminium drinks cans. However, compositional studies in Scotland consistently show aluminium can tonnages greater than this when waste data is analysed.
o We believe this is because all drinks cans (including steel) are often classed as “aluminium” in many studies. Therefore we believe the tonnages shown in compositional data for “aluminium” cans is in fact representative of “drinks cans” (and estimates in the Eunomia 2015 deposit system feasibility study – which does estimate steel drinks cans reaching the Scottish market – give some support to this interpretation).
o For this reason, we do not add an allowance for “steel” drinks cans to the method used above. As a result, while we would be over-estimating the “aluminium” fraction by our method, we do not believe we are overestimating the overall “drinks” fraction which is the focus of this study.
Material flows in an actual deposit system might diverge from the tonnage assumptions above. However, combined with the scenario analysis, we believe these figures should give an indication of how a deposit system may impact local authority collections. Developing more sophisticated scenarios is then an option.
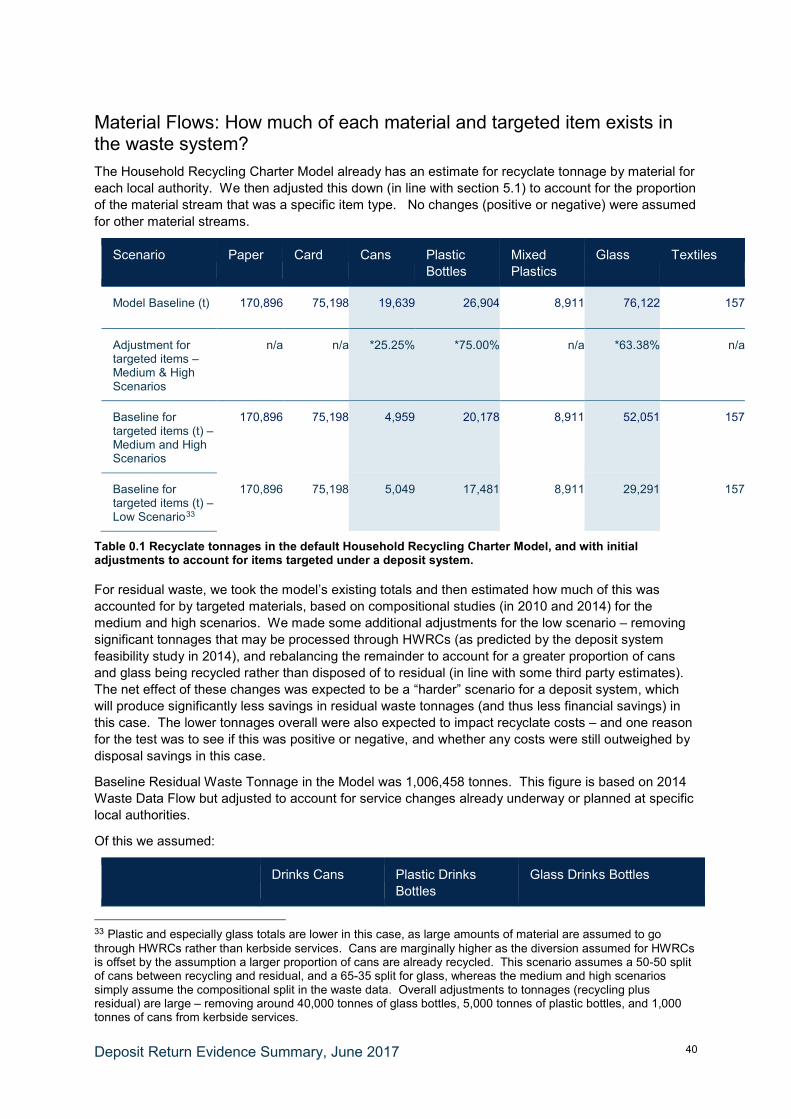
Deposit Return Evidence Summary, June 2017
40
Material Flows: How much of each material and targeted item exists in the waste system? The Household Recycling Charter Model already has an estimate for recyclate tonnage by material for each local authority. We then adjusted this down (in line with section 5.1) to account for the proportion of the material stream that was a specific item type. No changes (positive or negative) were assumed for other material streams.
Scenario Paper Card Cans Plastic Bottles
Mixed Plastics
Glass Textiles
Model Baseline (t) 170,896 75,198 19,639 26,904 8,911 76,122 157
Adjustment for targeted items – Medium & High Scenarios
n/a n/a *25.25% *75.00% n/a *63.38% n/a
Baseline for targeted items (t) – Medium and High Scenarios
170,896 75,198 4,959 20,178 8,911 52,051 157
Baseline for targeted items (t) – Low Scenario33
170,896 75,198 5,049 17,481 8,911 29,291 157
Table 0.1 Recyclate tonnages in the default Household Recycling Charter Model, and with initial adjustments to account for items targeted under a deposit system.
For residual waste, we took the model’s existing totals and then estimated how much of this was accounted for by targeted materials, based on compositional studies (in 2010 and 2014) for the medium and high scenarios. We made some additional adjustments for the low scenario – removing significant tonnages that may be processed through HWRCs (as predicted by the deposit system feasibility study in 2014), and rebalancing the remainder to account for a greater proportion of cans and glass being recycled rather than disposed of to residual (in line with some third party estimates). The net effect of these changes was expected to be a “harder” scenario for a deposit system, which will produce significantly less savings in residual waste tonnages (and thus less financial savings) in this case. The lower tonnages overall were also expected to impact recyclate costs – and one reason for the test was to see if this was positive or negative, and whether any costs were still outweighed by disposal savings in this case.
Baseline Residual Waste Tonnage in the Model was 1,006,458 tonnes. This figure is based on 2014 Waste Data Flow but adjusted to account for service changes already underway or planned at specific local authorities.
Of this we assumed:
Drinks Cans Plastic Drinks Bottles
Glass Drinks Bottles
33 Plastic and especially glass totals are lower in this case, as large amounts of material are assumed to go through HWRCs rather than kerbside services. Cans are marginally higher as the diversion assumed for HWRCs is offset by the assumption a larger proportion of cans are already recycled. This scenario assumes a 50-50 split of cans between recycling and residual, and a 65-35 split for glass, whereas the medium and high scenarios simply assume the compositional split in the waste data. Overall adjustments to tonnages (recycling plus residual) are large – removing around 40,000 tonnes of glass bottles, 5,000 tonnes of plastic bottles, and 1,000 tonnes of cans from kerbside services.
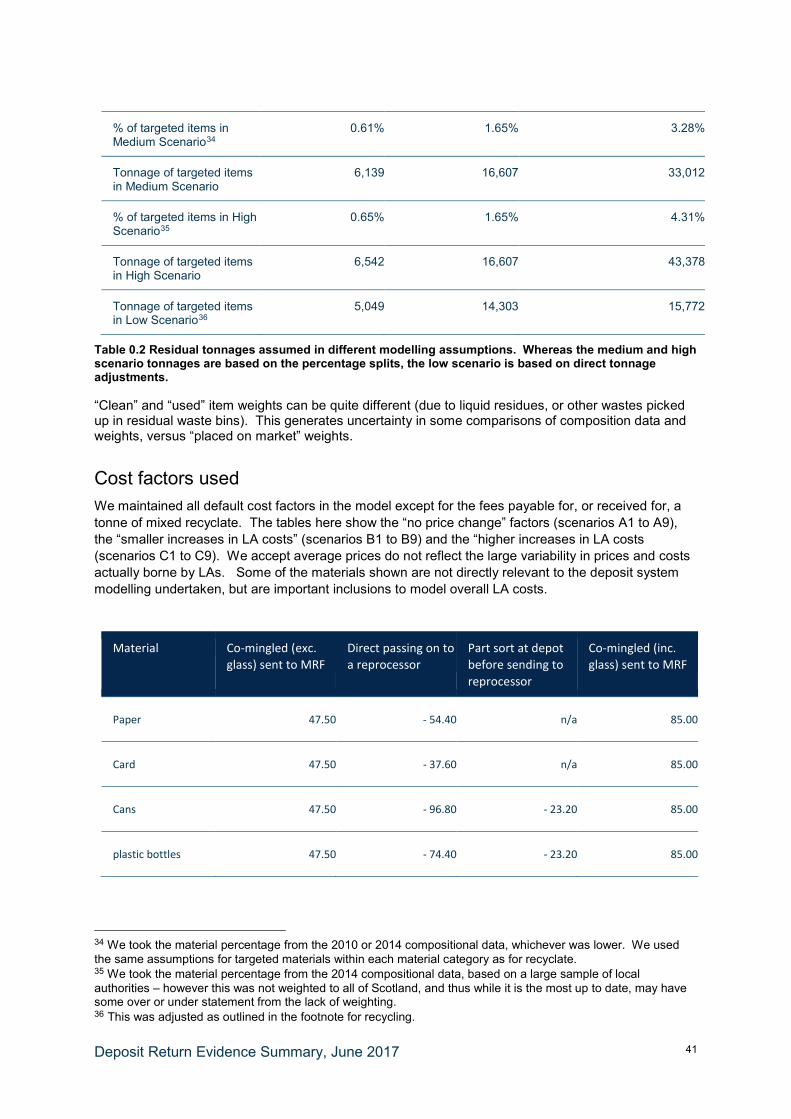
Deposit Return Evidence Summary, June 2017
41
% of targeted items in Medium Scenario34
0.61% 1.65% 3.28%
Tonnage of targeted items in Medium Scenario
6,139 16,607 33,012
% of targeted items in High Scenario35
0.65% 1.65% 4.31%
Tonnage of targeted items in High Scenario
6,542 16,607 43,378
Tonnage of targeted items in Low Scenario36
5,049 14,303 15,772
Table 0.2 Residual tonnages assumed in different modelling assumptions. Whereas the medium and high scenario tonnages are based on the percentage splits, the low scenario is based on direct tonnage adjustments.
“Clean” and “used” item weights can be quite different (due to liquid residues, or other wastes picked up in residual waste bins). This generates uncertainty in some comparisons of composition data and weights, versus “placed on market” weights.
Cost factors used We maintained all default cost factors in the model except for the fees payable for, or received for, a tonne of mixed recyclate. The tables here show the “no price change” factors (scenarios A1 to A9), the “smaller increases in LA costs” (scenarios B1 to B9) and the “higher increases in LA costs (scenarios C1 to C9). We accept average prices do not reflect the large variability in prices and costs actually borne by LAs. Some of the materials shown are not directly relevant to the deposit system modelling undertaken, but are important inclusions to model overall LA costs.
Material Co-mingled (exc. glass) sent to MRF
Direct passing on to a reprocessor
Part sort at depot before sending to reprocessor
Co-mingled (inc. glass) sent to MRF
Paper 47.50 - 54.40 n/a 85.00
Card 47.50 - 37.60 n/a 85.00
Cans 47.50 - 96.80 - 23.20 85.00
plastic bottles 47.50 - 74.40 - 23.20 85.00
34 We took the material percentage from the 2010 or 2014 compositional data, whichever was lower. We used the same assumptions for targeted materials within each material category as for recyclate. 35 We took the material percentage from the 2014 compositional data, based on a large sample of local authorities – however this was not weighted to all of Scotland, and thus while it is the most up to date, may have some over or under statement from the lack of weighting. 36 This was adjusted as outlined in the footnote for recycling.

Deposit Return Evidence Summary, June 2017
42
mixed plastics 47.50 - 60.00 - 23.20 85.00
glass mixed n/a - 15.20 n/a 85.00
Textiles 47.50 - 216.00 n/a 85.00
glass separate n/a - 18.40 n/a n/a
mixed fibres n/a - 22.40 n/a n/a
Table 0.3 Assumed average costs (£) to a local authority of passing on a tonne of material from different collection and management routes. Negative “costs” represent an assumed income. These costs factors were used in scenarios A1 to A9.
Cost factors for A1 to A9 were slightly adjusted from previous work using the Recycling Charter model, to reflect adverse changes in material costs since earlier work was undertaken.
Material Co-mingled (exc. glass) sent to MRF
Direct passing on to a reprocessor
Part sort at depot before sending to reprocessor
Co-mingled (inc. glass) sent to MRF
Paper 59.38 -54.40 n/a 68.00
Card 59.38 -37.60 n/a 68.00
cans 59.38 -96.80 -23.20 68.00
plastic bottles 59.38 -74.40 -23.20 68.00
mixed plastics 59.38 -60.00 -23.20 68.00
glass mixed n/a -15.20 n/a 68.00
textiles 59.38 -216.00 n/a 68.00
glass separate n/a -18.40 n/a n/a
mixed fibres n/a -22.40 n/a n/a
Table 0.4 Assumed average costs (£) to a local authority of passing on a tonne of material from different collection and management routes. Negative “costs” represent an assumed income. These costs factors were used in scenarios B1 to B9.

Deposit Return Evidence Summary, June 2017
43
Cost factors for scenarios B1 to B9 were adjusted as follows from the base costs: 25% increase in MRF fees (exc. glass) and 20% reduction in MRF fees (inc. glass).
Material Co-mingled (exc. glass) sent to MRF
Direct passing on to a reprocessor
Part sort at depot before sending to reprocessor
Co-mingled (inc. glass) sent to MRF
Paper 71.25 -54.40 n/a 76.50
Card 71.25 -37.60 n/a 76.50
Cans 71.25 -96.80 -23.20 76.50
plastic bottles 71.25 -74.40 -23.20 76.50
mixed plastics 71.25 -60.00 -23.20 76.50
glass mixed n/a -15.20 n/a 76.50
textiles 71.25 -216.00 n/a 76.50
glass separate n/a -18.40 n/a n/a
mixed fibres n/a -22.40 n/a n/a
Table 0.5 Assumed average costs (£) to a local authority of passing on a tonne of material from different collection and management routes. Negative “costs” represent an assumed income. These costs factors were used in scenarios C1 to C9.
Cost factors for scenarios C1 to C9 were adjusted as follows from the base costs: 50% increase in MRF fees (exc. glass) and 10% reduction in MRF fees (inc. glass).

Deposit Return Evidence Summary, June 2017
44
Appendix 2: Tables showing range of estimates achieved with different assumptions around litter costs Analysis focused on internalised costs, including a split for clearance. Note that “known other cleansing” is based on extremely limited data and is almost certainly many times higher than shown.
Table 0.6 Internalised costs analysis, including direct clearance costs for local authorities.
Holistic approach to costs. The “high” scenario takes £361m as discussed above. The “medium” scenario takes £100m (Zero Waste Scotland’s preferred estimate in 2013). The “low” scenario takes £62m (matching the total figure from the analysis above).
Table 0.7 Externalised costs analysis
Possible future cost if cost reductions are…
70% reduction
80% reduction
90% reduction
70% reduction
80% reduction
90% reduction
70% reduction
80% reduction
90% reduction
70% reduction
80% reduction
90% reduction
Local Authority Cleansing £36,000,000 £1,260,000 £1,440,000 £1,620,000 £5,544,000 £6,336,000 £7,128,000 £7,812,000 £8,928,000 £10,044,000 £10,080,000 £11,520,000 £12,960,000Known Other Cleansing £1,000,000 £35,000 £40,000 £45,000 £154,000 £176,000 £198,000 £217,000 £248,000 £279,000 £280,000 £320,000 £360,000Indirect internalised costs (low-mid estimate) £25,000,000 £875,000 £1,000,000 £1,125,000 £3,850,000 £4,400,000 £4,950,000 £5,425,000 £6,200,000 £6,975,000 £7,000,000 £8,000,000 £9,000,000TOTAL £62,000,000 £2,170,000 £2,480,000 £2,790,000 £9,548,000 £10,912,000 £12,276,000 £13,454,000 £15,376,000 £17,298,000 £17,360,000 £19,840,000 £22,320,000Local Authority Cleansing £36,000,000 £945,000 £1,080,000 £1,215,000 £4,158,000 £4,752,000 £5,346,000 £5,859,000 £6,696,000 £7,533,000 £7,560,000 £8,640,000 £9,720,000Known Other Cleansing £1,000,000 £26,250 £30,000 £33,750 £115,500 £132,000 £148,500 £162,750 £186,000 £209,250 £210,000 £240,000 £270,000Indirect internalised costs (low-mid estimate) £25,000,000 £656,250 £750,000 £843,750 £2,887,500 £3,300,000 £3,712,500 £4,068,750 £4,650,000 £5,231,250 £5,250,000 £6,000,000 £6,750,000TOTAL £62,000,000 £1,627,500 £1,860,000 £2,092,500 £7,161,000 £8,184,000 £9,207,000 £10,090,500 £11,532,000 £12,973,500 £13,020,000 £14,880,000 £16,740,000Local Authority Cleansing £36,000,000 £630,000 £720,000 £810,000 £2,772,000 £3,168,000 £3,564,000 £3,906,000 £4,464,000 £5,022,000 £5,040,000 £5,760,000 £6,480,000Known Other Cleansing £1,000,000 £17,500 £20,000 £22,500 £77,000 £88,000 £99,000 £108,500 £124,000 £139,500 £140,000 £160,000 £180,000Indirect internalised costs (low-mid estimate) £25,000,000 £437,500 £500,000 £562,500 £1,925,000 £2,200,000 £2,475,000 £2,712,500 £3,100,000 £3,487,500 £3,500,000 £4,000,000 £4,500,000TOTAL £62,000,000 £1,085,000 £1,240,000 £1,395,000 £4,774,000 £5,456,000 £6,138,000 £6,727,000 £7,688,000 £8,649,000 £8,680,000 £9,920,000 £11,160,000
Linked to count of all items (5% in scope) Linked to weight (22% in scope) Linked to count of selected items (31% in Linked to volume (~40% in scope)
Direct relationship
Direct relationship, less
25%
Direct relationship, less
50%
Possible future cost if cost reductions are…
Current cost 70% reduction
80% reduction
90% reduction
70% reduction
80% reduction
90% reduction
70% reduction
80% reduction
90% reduction
70% reduction
80% reduction
90% reduction
High £361,000,000 £12,635,000 £14,440,000 £16,245,000 £55,594,000 £63,536,000 £71,478,000 £78,337,000 £89,528,000 £100,719,000 £101,080,000 £115,520,000 £129,960,000Medium £100,000,000 £3,500,000 £4,000,000 £4,500,000 £15,400,000 £17,600,000 £19,800,000 £21,700,000 £24,800,000 £27,900,000 £28,000,000 £32,000,000 £36,000,000Low £62,000,000 £2,170,000 £2,480,000 £2,790,000 £9,548,000 £10,912,000 £12,276,000 £13,454,000 £15,376,000 £17,298,000 £17,360,000 £19,840,000 £22,320,000High £361,000,000 £9,476,250 £10,830,000 £12,183,750 £41,695,500 £47,652,000 £53,608,500 £58,752,750 £67,146,000 £75,539,250 £75,810,000 £86,640,000 £97,470,000Medium £100,000,000 £2,625,000 £3,000,000 £3,375,000 £11,550,000 £13,200,000 £14,850,000 £16,275,000 £18,600,000 £20,925,000 £21,000,000 £24,000,000 £27,000,000Low £62,000,000 £1,627,500 £1,860,000 £2,092,500 £7,161,000 £8,184,000 £9,207,000 £10,090,500 £11,532,000 £12,973,500 £13,020,000 £14,880,000 £16,740,000High £361,000,000 £6,317,500 £7,220,000 £8,122,500 £27,797,000 £31,768,000 £35,739,000 £39,168,500 £44,764,000 £50,359,500 £50,540,000 £57,760,000 £64,980,000Medium £100,000,000 £1,750,000 £2,000,000 £2,250,000 £7,700,000 £8,800,000 £9,900,000 £10,850,000 £12,400,000 £13,950,000 £14,000,000 £16,000,000 £18,000,000Low £62,000,000 £1,085,000 £1,240,000 £1,395,000 £4,774,000 £5,456,000 £6,138,000 £6,727,000 £7,688,000 £8,649,000 £8,680,000 £9,920,000 £11,160,000
Linked to volume (~40% in scope)
Direct relationship, less
50%
Linked to count of all items (5% in scope) Linked to weight (22% in scope) Linked to count of selected items (31% in scope)
Direct relationship
Direct relationship, less
25%
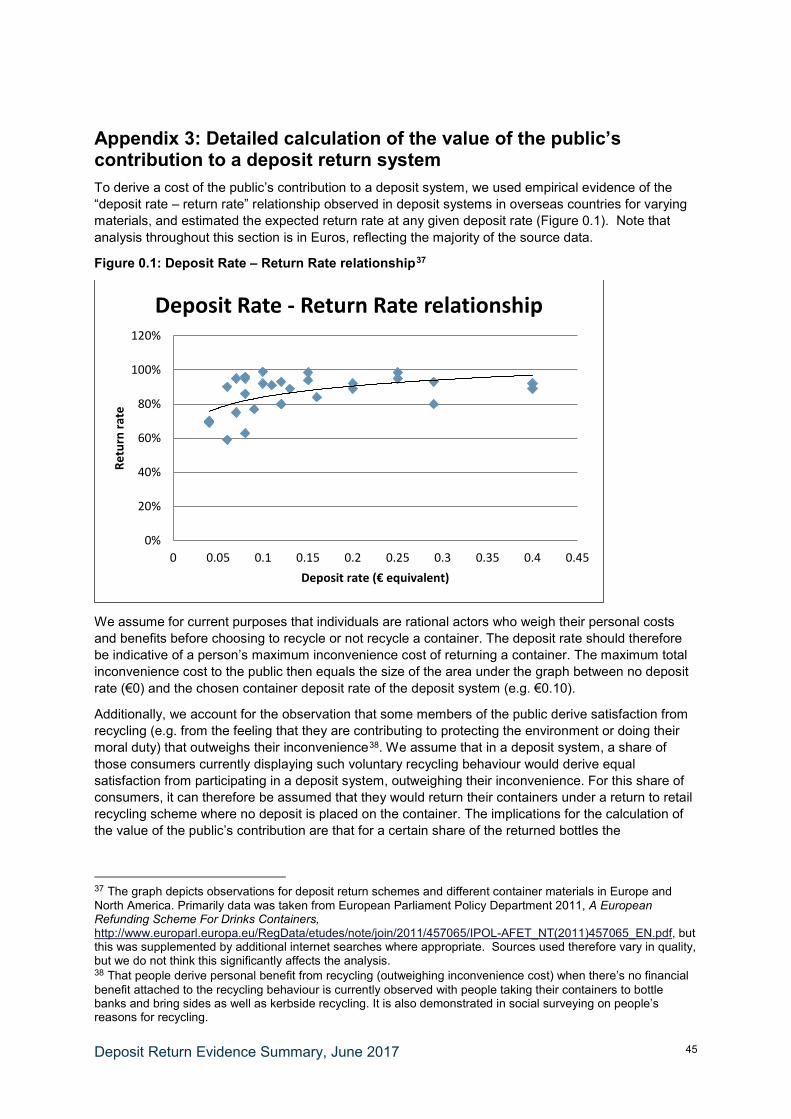
Deposit Return Evidence Summary, June 2017
45
Appendix 3: Detailed calculation of the value of the public’s contribution to a deposit return system To derive a cost of the public’s contribution to a deposit system, we used empirical evidence of the “deposit rate – return rate” relationship observed in deposit systems in overseas countries for varying materials, and estimated the expected return rate at any given deposit rate (Figure 0.1). Note that analysis throughout this section is in Euros, reflecting the majority of the source data.
Figure 0.1: Deposit Rate – Return Rate relationship37
We assume for current purposes that individuals are rational actors who weigh their personal costs and benefits before choosing to recycle or not recycle a container. The deposit rate should therefore be indicative of a person’s maximum inconvenience cost of returning a container. The maximum total inconvenience cost to the public then equals the size of the area under the graph between no deposit rate (€0) and the chosen container deposit rate of the deposit system (e.g. €0.10).
Additionally, we account for the observation that some members of the public derive satisfaction from recycling (e.g. from the feeling that they are contributing to protecting the environment or doing their moral duty) that outweighs their inconvenience38. We assume that in a deposit system, a share of those consumers currently displaying such voluntary recycling behaviour would derive equal satisfaction from participating in a deposit system, outweighing their inconvenience. For this share of consumers, it can therefore be assumed that they would return their containers under a return to retail recycling scheme where no deposit is placed on the container. The implications for the calculation of the value of the public’s contribution are that for a certain share of the returned bottles the
37 The graph depicts observations for deposit return schemes and different container materials in Europe and North America. Primarily data was taken from European Parliament Policy Department 2011, A European Refunding Scheme For Drinks Containers, http://www.europarl.europa.eu/RegData/etudes/note/join/2011/457065/IPOL-AFET_NT(2011)457065_EN.pdf, but this was supplemented by additional internet searches where appropriate. Sources used therefore vary in quality, but we do not think this significantly affects the analysis. 38 That people derive personal benefit from recycling (outweighing inconvenience cost) when there’s no financial benefit attached to the recycling behaviour is currently observed with people taking their containers to bottle banks and bring sides as well as kerbside recycling. It is also demonstrated in social surveying on people’s reasons for recycling.
0%
20%
40%
60%
80%
100%
120%
0 0.05 0.1 0.15 0.2 0.25 0.3 0.35 0.4 0.45
Retu
rn ra
te
Deposit rate (€ equivalent)
Deposit Rate - Return Rate relationship
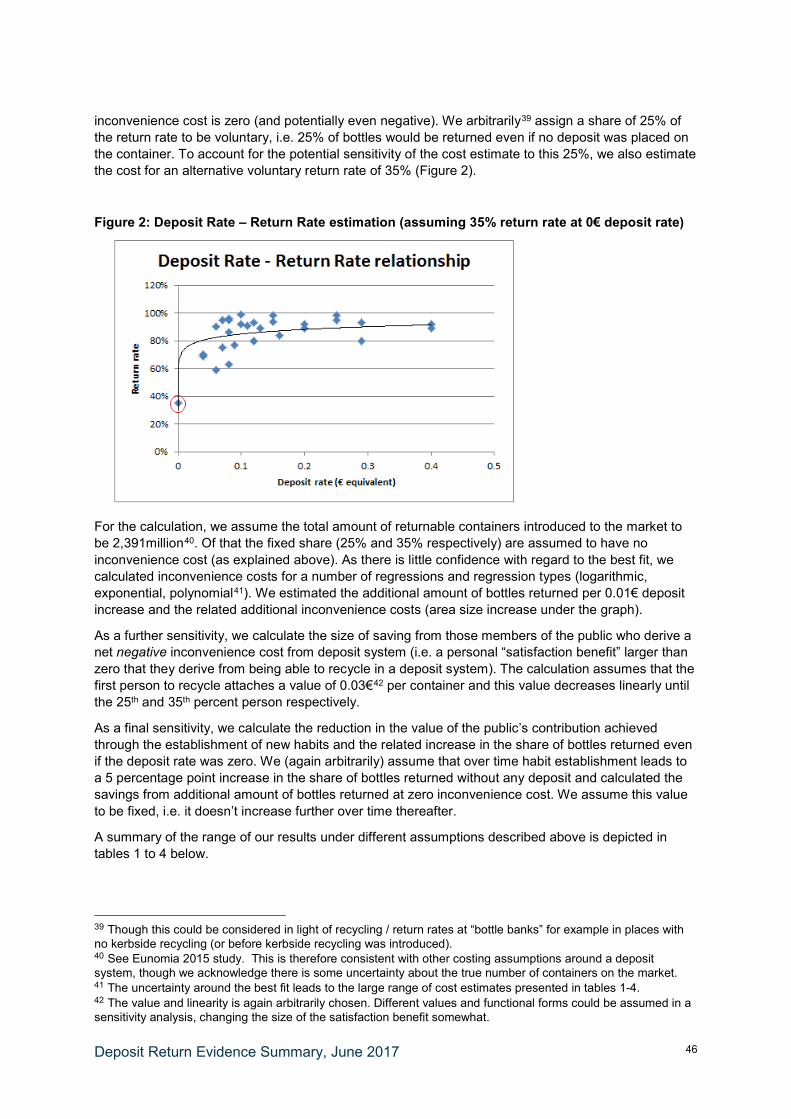
Deposit Return Evidence Summary, June 2017
46
inconvenience cost is zero (and potentially even negative). We arbitrarily39 assign a share of 25% of the return rate to be voluntary, i.e. 25% of bottles would be returned even if no deposit was placed on the container. To account for the potential sensitivity of the cost estimate to this 25%, we also estimate the cost for an alternative voluntary return rate of 35% (Figure 2).
Figure 2: Deposit Rate – Return Rate estimation (assuming 35% return rate at 0€ deposit rate)
For the calculation, we assume the total amount of returnable containers introduced to the market to be 2,391million40. Of that the fixed share (25% and 35% respectively) are assumed to have no inconvenience cost (as explained above). As there is little confidence with regard to the best fit, we calculated inconvenience costs for a number of regressions and regression types (logarithmic, exponential, polynomial41). We estimated the additional amount of bottles returned per 0.01€ deposit increase and the related additional inconvenience costs (area size increase under the graph).
As a further sensitivity, we calculate the size of saving from those members of the public who derive a net negative inconvenience cost from deposit system (i.e. a personal “satisfaction benefit” larger than zero that they derive from being able to recycle in a deposit system). The calculation assumes that the first person to recycle attaches a value of 0.03€42 per container and this value decreases linearly until the 25th and 35th percent person respectively.
As a final sensitivity, we calculate the reduction in the value of the public’s contribution achieved through the establishment of new habits and the related increase in the share of bottles returned even if the deposit rate was zero. We (again arbitrarily) assume that over time habit establishment leads to a 5 percentage point increase in the share of bottles returned without any deposit and calculated the savings from additional amount of bottles returned at zero inconvenience cost. We assume this value to be fixed, i.e. it doesn’t increase further over time thereafter.
A summary of the range of our results under different assumptions described above is depicted in tables 1 to 4 below.
39 Though this could be considered in light of recycling / return rates at “bottle banks” for example in places with no kerbside recycling (or before kerbside recycling was introduced). 40 See Eunomia 2015 study. This is therefore consistent with other costing assumptions around a deposit system, though we acknowledge there is some uncertainty about the true number of containers on the market. 41 The uncertainty around the best fit leads to the large range of cost estimates presented in tables 1-4. 42 The value and linearity is again arbitrarily chosen. Different values and functional forms could be assumed in a sensitivity analysis, changing the size of the satisfaction benefit somewhat.

Deposit Return Evidence Summary, June 2017
47
Total
(no adjustment for any potential savings)
Cost reduction acknowledging net benefit from recycling
Cost reduction acknowledging habit establishment
Total (Including benefits from recycling and habit establishment)
32m – 52m
-9m
- 2.6m 20m – 41m
Table 0.8: Value of the public’s contribution in € (at a return rate of 85%, assuming 25% voluntary return rate)
Total
(no adjustment for any potential savings)
Cost reduction acknowledging net benefit from recycling
Cost reduction acknowledging habit establishment
Total (Including benefits from recycling and habit establishment)
50m – 80m
-9m
- 2.6m 38m – 69m
Table 0.9: Value of the public’s contribution in € (at a return rate of 90%, assuming 25% voluntary return rate)
Total
(no adjustment for any potential savings)
Cost reduction acknowledging net benefit from recycling
Cost reduction acknowledging habit establishment
Total (Including benefits from recycling and habit establishment)
28m – 45m
-13m
- 2.5m 12m – 60m
Table 0.10: Value of the public’s contribution in € (at a return rate of 85%, assuming 35% voluntary return rate)
Total
(no adjustment for any potential savings)
Cost reduction acknowledging net benefit from recycling
Cost reduction acknowledging habit establishment
Total (Including benefits from recycling and habit establishment)
47m – 75m
-13m
- 2.5m 31m – 30m
Table 0.11: Value of the public’s contribution in € (at a return rate of 90%, assuming 35% voluntary return rate)

Deposit Return Evidence Summary, June 2017
48

Deposit Return Evidence Summary, June 2017
49


