Page 1
Describing the firmness, springiness and rubberiness of food1
gels using fractional calculus. Part I: Theoretical framework.2
T.J. Fabera,b,1,∗, A. Jaishankarc, G.H. McKinleyc3
aFrieslandCampina, PO box 1551, 3800 BN Amersfoort, The Netherlands4bPolymer Technology, Eindhoven University of Technology, PO Box 513 ,5600 MB Eindhoven, The Netherlands5
cDepartment of Mechanical Engineering, Massachusetts Institute of Technology,6
77 Massachusetts Avenue, Cambridge - MA 02139, USA7
Abstract8
Constitutive models for soft solids that quantitatively relate the state of the stress in the mate-
rial to the deformation history have the potential to be used in a structure-texture engineering
context, but successful examples are scarce. In the present work we define equations for the
firmness F, springiness S , and rubberiness R, of semi-soft food gels such as cheeses that ex-
hibit broad power-law stress relaxation over a wide range of timescales. The equations contain
only two material properties, which have their origin in the food microstructure: a fractional
exponent, which quantifies the frequency and temporal response and secondly a scale factor
or “quasi-property”, which sets the magnitude of the stress in the material. Together they form
a constitutive element, known as the ‘springpot’ or Scott Blair element which can accurately
capture the viscoelastic properties of food gels such as semi-hard cheeses. Using this model
it becomes possible to provide clear and unambiguous definitions of textural parameters such
as firmness, springiness and rubberiness, and to quantify their time- and interpendency. The
magnitude of the firmness and springiness are inversely related through the fractional con-
stitutive model. Our FSR-equations can be used in a texture engineering context to guide
effective product reformulation of soft-solid, hydrocolloidal gels.
Keywords: rational reformulation, food gels structure-texture engineering, constitutive9
model, fractional calculus, Scott Blair10
1. Introduction11
Product reformulation is a major theme in the food industry, which is driven by raw ma-12
terial costs, carbon footprint, or health incentives (Norton et al., 2006; Almeida-Rivera et al.,13
2007; Foegeding and Davis, 2011; Renard et al., 2006). However, when replacing or removing14
ingredients, sensory texture, shelf life and processability can be negatively affected (Renard15
et al., 2006). It is the task of the food product engineer to deliver solutions that overcome16
∗corresponding authorEmail address: [email protected] (T.J. Faber)
Preprint submitted to Food Hydrocolloids May 16, 2016
Page 2
these trade-offs. Macro-scale food properties such as sensory texture are, to a large extent, de-17
termined by the microstructure of the food (Aguilera, 2005; Lucey et al., 2003). A wealth of18
engineering solutions are available to modify food microstructure based on insights from soft19
matter and colloidal science (Van der Sman and Van der Goot, 2009; Mezzenga et al., 2005;20
Stokes and Frith, 2008; Mezzenga and Fischer, 2013; Dickinson, 2012; Ubbink et al., 2008;21
Norton and Frith, 2001) as well as from process technology (Foegeding and Davis, 2011;22
Jousse, 2008; Almeida-Rivera et al., 2007). Transitioning between the micro- and the macro-23
scale and dealing with a multitude of constraints requires a rational and integrated product and24
process design approach (Norton et al., 2006; Almeida-Rivera et al., 2007), using models that25
can quantitatively relate food formulation and structure to processing and sensory texture.26
The fields of rheology and soft matter science have the potential to deliver such mod-27
els (Bourne, 2002a; Scott Blair, 1958; Mohsenin, 1970; Foegeding et al., 2003) especially28
when expressed in the form of a general frame-invariant constitutive relationship (Gallegos29
et al., 2004) for the essential rheological properties (Reiner, 1971) describing the material30
response to deformation. For non-food materials (e.g. in the polymer processing industry),31
application of rheological models to improve process throughput and product performance32
has now become standard; however, successful examples in the texture engineering field are33
scarce. Probable causes are the additional non-rheological factors that contribute to sensory34
judgment, such as phase transformations (Bourne, 1978), interaction with saliva (Kapsalis35
and Moskowitz, 1978; Choi et al., 2014) and repeated macroscopic fracture while the food36
material is orally processsed (Bourne, 1975; Chen, 2009).37
The firmness F, springiness S , and rubberiness R, of food gels, are examples of what38
Reiner (1971) called ‘technological properties’ rather than true material properties and these39
texture attributes are typically assessed solely by pressing and depressing the material by hand40
(Fig. 1) (Szczesniak and Bourne, 1969; Goh et al., 2003; Foegeding and Drake, 2007). Such41
manually-evaluated texture attributes can also be measured instrumentally using bulk rheolog-42
ical testing (Stokes et al., 2013) which makes these texture attributes excellent candidates for43
a quantitative structure-texture model which is based on analysis of the imposed kinematics44
using appropriate constitutive equations (or equations of state) for the material. These con-45
stitutive relationships should also then predict how well the product performs under handling46
conditions other than those of sensory texture assessment (Scott Blair and Coppen, 1940c),47
such as whether the product retains its intended shape when stacked and stored (Bourne, 1975)48
(Fig. 1), as well as provide insight into possible product reformulation strategies.49
Firmness is one of the most researched texture attributes for a wide variety of foods50
(Szczesniak and Bourne, 1969). The most common route to enhance the firmness of a food51
2
Page 3
product is by transforming one or more of the hydrocolloidal food constituents into a gel.52
A second important function of gelation is to keep water and fat in the product, implying53
that firmness and composition are intrinsically related (Foegeding and Davis, 2011). Exam-54
ples of gelled foods are numerous and include yoghurt, cheese, starch puddings (Sala et al.,55
2008), hotdogs and sausages (Sala et al., 2008; Salvador et al., 2009), seafood analogues56
(Herranz et al., 2012) and tofu (Sato, 2003). When consumed, these food gels are masti-57
cated into smaller pieces and mixed with saliva to form a bolus that can be swallowed (Chen,58
2009; Hutchings and Lillford, 1988). The sensations arising when the product is touched59
and squeezed are good predictors for the sensations perceived in the first steps of mastication60
(Barrangou et al., 2006; Drake et al., 1999).61
Firmness (F) is determined while the food material is being pressed, whereas the texture62
attribute of springiness (S ) is measured after depressing the piece of food (Szczesniak, 1963a;63
van Vliet, 1991; Foegeding and Drake, 2007; Barrangou et al., 2006; Cakir et al., 2012). In64
former days, craftsmen in cheese production used to assess both the firmness as well as the65
‘spring’ of the cheese curds to determine if this precursor in the cheese-making process was66
ready to proceed to the next stage of processing (Scott Blair and Coppen, 1940a,b). For67
bread, springiness is a desired property (Matos et al., 2014) and this texture attribute is used68
as a measure for being fresh or stale (Purhagen et al., 2011). Springiness and rubberiness69
are two texture attributes that are often intertwined (Jowitt, 1974) and for both terms the70
synonym elasticity is sometimes used (Davis, 1937; Scott Blair, 1973; Hayakawa et al., 2014;71
Devezeaux de Lavergne et al., 2015; Brenner et al., 2015). Rubbery, springy, or elastic food72
gels are very popular in Japan (Brenner et al., 2015); however, they are also linked to eating73
difficulties (Funami et al., 2012; Hayakawa et al., 2014). In cheese, a Muenster type is allowed74
to be springy, whereas a Parmesan is not (Foegeding and Drake, 2007). ‘Rubbery’ has been75
used as a negative descriptor for cheese that has reduced fat content (Yates and Drake, 2007).76
George William Scott Blair, who is considered by many to be the founding father of food77
rheology (Szczesniak, 2002; Bourne, 2002b), had a special interest in the subjective aspects78
of firmness, which led to ground breaking panel studies (Scott Blair and Coppen, 1940c). He79
laid the foundations of a special branch of rheology called psychorheology (Scott Blair, 1947),80
which later evolved into the field of texture studies (Scott Blair, 1974). His central question81
was: What material property gives rise to key texture properties like the ‘body’ of dough82
and the ‘firmness’ of cheese? His approach was as simple as it was effective: ask panels to83
squeeze two graspable complex materials with known material constants and which are purely84
viscous (bitumen), purely elastic (rubber) or viscoelastic (cheese, unvulcanized rubber). He85
asked the panelist to judge which of the two materials they squeezed was softest with the86
3
Page 4
restriction that the two objects were pressed at the same time, and for a well defined period.87
The conclusions were threefold. First human touch is very sensitive in discriminating between88
softer and firmer objects, even if one is purely elastic and the other purely viscous. Second,89
firmness is a time-dependent property and is judged dynamically, which is in line with the90
notion that the perception of sensory texture is the result of measuring a dynamic process91
rather than measuring a final state (Hutchings and Lillford, 1988; Devezeaux de Lavergne92
et al., 2015). Finally Scott Blair demonstrated that the time-dependence of the firmness for93
many of the complex materials he studied has the form of a power-law in time.94
Thus in rheological terms the firmness, springiness, and rubberiness of food gels can be95
considered as viscoelastic texture attributes. This suggests the use of constitutive models that96
correlate these attributes to true linear viscoelastic (LVE) material parameters characterizing97
the materials of interest. Various models have been fitted to material property data of cheese98
obtained from rheometry in the LVE region to correlate composition and processing condi-99
tions to cheese material properties. The most popular model is the generalized Maxwell model100
(Tschoegl, 1989), that has been applied by numerous authors (Hort and Le Grys, 2000; Sad-101
owska et al., 2009; Subramanian and Gunasekaran, 1997; Muliawan and Hatzikiriakos, 2007;102
Campanella and Peleg, 1997; Subramanian et al., 2006; Li Yuet Hee et al., 2008; Bertola et al.,103
2000; Venugopal and Muthukumarappan, 2001). To describe measured LVE behavior accu-104
rately over two decades of time, at least three relaxation modes (with six model parameters)105
are typically needed, from which it is hard to derive insight into structure-texture relations.106
Furthermore the fitted results are not valid outside the domain of measurement making ex-107
trapolation difficult and thus the extracted model parameters lack a strong physical underpin-108
ning (Kollmannsberger and Fabry, 2011; Jaishankar and McKinley, 2013) which is essential109
for a connection to the underpinning microstructure. One approach to reduce the number of110
parameters in the mechanical model is to fit a continuous spectrum of relaxation times to the111
material functions determined in the LVE regime (Winter and Mours, 1997; Del Nobile et al.,112
2007; Sadowska et al., 2009; Lorenzo et al., 2013). Again the spectral distribution parameters113
that are obtained lack physical meaning.114
When a creep / recovery test is performed to measure the temporal response of a food gel115
to deformation, the Burgers model is widely used to interpret the material properties that are116
measured (Scott Blair and Burnett, 1959; de Faria et al., 2013; Dolz et al., 2008; Harrington117
and Morris, 2009; Korus et al., 2009; Lorenzo et al., 2013; Meng et al., 2014; Moreira et al.,118
2011; Olivares et al., 2009). This four-parameter model is capable of describing viscoelas-119
tic deformation and the unrecoverable strain at the end of recovery (Scott Blair and Burnett,120
1959). It comprises of a spring and dashpot in series (Maxwell model) attached to a spring and121
4
Page 5
dashpot in parallel (Kelvin-Voigt model). Scott Blair (1973) proposed to measure springiness122
S , by a dimensionless number composed from the characteristic relaxation time τr, and retar-123
dation time τret in the Burger model, S = τr/τret. However he also concluded that to capture124
more complex relaxation behaviour, the addition of an extra Kelvin-Voigt body is necessary,125
which makes the modeling increasing phenomenological in nature (Scott Blair and Burnett,126
1959).127
Various authors have independently recognized the power-law relaxation characteristics128
in food gels when performing Small Amplitude Oscillatory Shear (SAOS) tests and they have129
fitted emperical models of the form G′(ω) = Aωb and G′′(ω) = Cωd (where G′(ω) and G′′(ω)130
are the storage and loss modulus, respectively) to the measured frequency data. Here A, b,131
C and d are constants and ω the imposed oscillatory frequency. (Subramanian et al., 2006;132
Korus et al., 2009; Moreira et al., 2011; Ronda et al., 2013). Zhou and Mulvaney (1998) and133
Gabriele et al. (2001) further reduced the number of constitutive fitting parameters from four134
to two by fitting a similar model to the magnitude of the complex modulus |G∗(ω)|. In all these135
papers no attempt was made to represent these functional forms in the form of a constitutive136
model that could be applied in a predictive form to describe other deformations.137
Scott Blair (1947) was the first to focus on developing constitutive equations where the138
stress σ(t) is related to the strain γ(t) or strain rate γ(t) in the form of a power-law. He started139
with the Nutting equation (Nutting, 1921; Scott Blair and Coppen, 1942), Ψ = σβγ−1tk, where140
t is the time, β and k are constants and Ψ a “firmness intensity” (Scott Blair, 1943). From his141
experiments he concluded that the number of parameters in this equation could be reduced142
by writing the stress in terms of a fractional differential equation σ = Ψ(dβγ/dtβ). He called143
attention to two novel rheological concepts, the use of a fractional derivative with a fractional144
exponent (β), and the existence of a ‘quasi-property’ Ψ (Scott Blair et al., 1947). Scott Blair145
argued that such a quasi-property is intermediate between a shear modulus G and a viscosity146
η and is a measure of the dynamic relaxation processes within a material rather than of an147
equilibrium state. The magnitude of this quasi-property (here a “firmness intensity”) sets148
the scale of the stress in the material, whilst the fractional exponent quantifies the frequency149
and temporal response. The fractional constitutive framework was further developed in the150
1980’s by Bagley and Torvik (1983b,a) and Koeller (1984). The latter introduced a new151
mechanical element, the springpot, also referred to as the Scott Blair element (Mainardi and152
Spada, 2011), which is quantified by two material parameters; the quasi-property and the153
fractional exponent.154
Successful fitting of a fractional constitutive model to measured linear viscoelastic re-155
sponses can be found for red blood cells (Craiem and Magin, 2010), lung tissues (Suki et al.,156
5
Page 6
1994) and arteries (Craiem and Armentano, 2007). A selective number of other examples can157
be found for describing food ingredients like gums (Jaishankar and McKinley, 2013) emul-158
sifiers (Ma and Barbosa-Canovas, 1996; Chen and Kim, 2004) and melon (Xu and Chen,159
2013). Bagley and Torvik (1983b) proved that at sufficiently high frequencies, the Rouse the-160
ory for polymer melts can also be compactly expressed in terms of an equivalent fractional161
constitutive equation containing a springpot with exponent β = 1/2. Several works (Heymans162
and Bauwens, 1994; Schiessel et al., 1995) have built constitutive models by hierarchically163
ordering springs and dashpots in self-similar structures, like those encountered in biological164
materials, and showed that the hierarchical model asymptotically approaches a springpot.165
The microstructural origins of the power-law relaxation commonly observed in complex166
materials can also be found in the distribution of lengths in dangling chains in imperfectly167
cross-linked elastomers (Curro and Pincus, 1983), the distribution of energy wells around168
the interacting elements that form soft glassy materials (Sollich et al., 1997; Jaishankar and169
McKinley, 2013) and in the continuous distribution of waiting times for a particle that diffuses170
in a heterogeneous structure (Bouchaud and Georges, 1990; Amblard et al., 1996). Tracking171
the trajectory of such a particle, as it diffuses through the heterogeneous structure, is a form172
of micro-rheology. Caggioni et al. (2007) used this technique in combination with shear173
rheology to characterize gellan gum micro gels. They showed that both bulk- and micro-174
rheological measurements displayed power-law frequency sweeps with identical slopes, and175
that this power-law slope changed when the microstructure was altered.176
In the remainder of the paper we build on the efforts of Davis and Scott Blair to link cheese177
texture attributes to essential rheological properties that can be extracted from rheometry and178
we proceed through the steps of building a structure-texture model based on a fractional con-179
stitutive framework. First we introduce the main mathematical relations that are required to180
construct this framework. We show that from these parameter values we can correctly pre-181
dict the evolution of both the relaxation modulus G(t) and creep compliance J(t). We next182
introduce exact definitions of the firmness F, springiness S , and rubberiness R, of food gels183
in terms of specific points on the creep / recovery curve. Using the tools of fractional calculus184
this allows us to derive expressions for the material’ firmness, springiness, and rubberiness in185
terms of the quasi-property and the power-law exponent that characterize the cheese. We show186
that we can quantitatively predict springiness and rubberiness from the measured /fitted creep187
curve which demonstrates that firmness, springiness, and rubberiness are interrelated and all188
governed by the two material parameters we determine in the linear viscoelastic regime. We189
finally outline how our equations can be used in the context of structure-texture design. In part190
II of this work we extend these texture engineering ideas to characterizing a full-fat, reduced-191
6
Page 7
fat, and zero-fat cheese products over a wide range of temperatures and water / protein ratios.192
We also quantify the effect of large loadings that exceed the linear viscoelastic limit, common193
in oral processing (Goh et al., 2003), on the measured magnitude of firmness, springiness and194
rubberiness.195
2. Fractional constitutive framework196
To construct fractional constitutive equations in an identical fashion as classical constitu-197
tive models (e.g. the Maxwell model), Koeller (1984) defined a rheological element whose198
stress is proportional to the fractional derivative of the strain. He called this two-parameter199
viscoelastic element the ‘springpot’:200
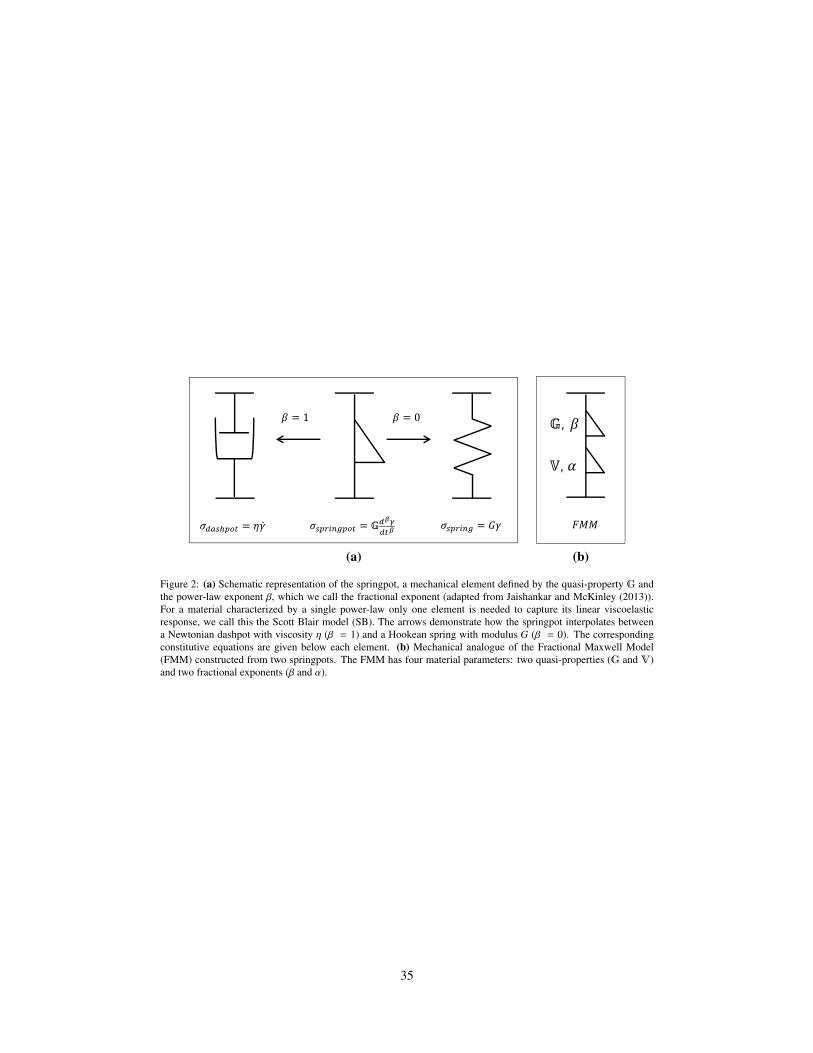
σspingpot = Gdβγdtβ
(1)
This constitutive response is a generalization of the classical dashpot and spring: for β = 1,201
the springpot behaves as a dashpot, whereas for β = 0 it describes a linear elastic spring, as202
depicted in Figure 2(a). The front factor, denoted G, is equivalent to Scott Blair’s quasi-203
property (originally denoted Ψ) and has units of Pa sβ. The exponent β is a measure of the204
frequency or temporal dependence of the material response, as well as the relative degree of205
viscoelasticity, and, as such is related to the phase angle, tan(δ) in the material. The latter206
parameter is more commonly used to describe the solid- or liquid- like nature of semi-solid207
food gels such as cheese (Foegeding et al., 2011). Various material responses can be described208
with constitutive models derived from mechanical analogues that are constructed with the209
springpot, and comprehensive reviews can be found in Schiessel et al. (1995) and Friedrich210
et al. (1999) .211
The fractional constitutive framework builds on ideas from fractional calculus, that incor-212
porate integrals and derivatives of arbitrary order (Podlubny, 1999; Mainardi, 2010; Jaishankar213
and McKinley, 2014). For compactness these derivatives are called fractional derivatives and214
we give models, expressions and parameters derived from these derivatives the adjective ’frac-215
tional’ as well as materials that can be mechanically described by these entities.216
There are several alternative definitions for the fractional operator generically indicated by217
Eq. (1). To conform to the initial condition for appropriate rheological tests of γ|t=0 = 0, we218
use the Caputo derivative, which reformulates the fractional derivative into a fractional integral219
through integro-differentiation (Surguladze, 2002). The derivative in Eq.(1) with order 0 <220
7
Page 8
β < 1 is then defined as :221
Gdβγdtβ≡
G
Γ(1 − β)
t∫0
(t − t′)−βγ(t′)dt′ (2)
The constitutive response of the springpot (Koeller, 1984; Torvik and Bagley, 1984) is thus222
equivalent to a Boltzmann memory integral with a power-law relaxation kernel, rather than223
the more familiar Maxwell-Debye exponential form (or sum of exponentials) commonly used224
in viscoelastic models (Ferry, 1980). The Caputo derivative has a Laplace transform, which225
for 0 < β < 1 is defined as (Podlubny, 1999; Surguladze, 2002):226
L
{dβ
dtβγ(t); s
}= sβγ(s) (3)
This enables us to derive analytical expressions for two standard linear viscoelastic shear227
material functions (Bird et al., 1987): the relaxation modulus G(t) and the creep compliance228
J(t). In a stress relaxation experiment, a sudden step in shear strain γ(t) = γ0H(t) is imposed229
(where H(t) is the Heaviside step function (Abramowitz and Stegun, 1964)), and the resulting230
evolution of the stress σ(t) in the material is measured. This provides the relaxation modulus231
G(t) ≡ σ(t)/γ0 for the material. By analogy the creep compliance, J(t) ≡ γ(t)/σ0 is obtained,232
by imposing a step in the shear stress acting on the sample, σ(t) = σ0H(t), and following the233
evolution of the strain γ(t) in the material over time.234
Other standard linear viscoelastic shear material functions, such as the storage and loss235
moduli {G′(ω), G′′(ω)}, are obtained by harmonic excitations in shear, also denoted as small236
amplitude oscillatory shear (SAOS) experiments. To find the appropriate fractional expression237
for these functions we use the Fourier transform of the Caputo derivative of the function γ(t),238
which is given by (Schiessel et al., 1995)239
F
{dβ
dtβγ(t);ω
}= (iω)βγ(ω) (4)
where γ(ω) = F {γ(t);ω}.240
Equations (2), (3) and (4) provide the mathematical framework to build fractional consti-241
tutive equations from mechanical analogues and solve them analytically. In this paper we will242
use fractional models consisting of a single springpot, (i.e. the canonical Scott Blair model243
(SB)) as well as two springpots arranged in series, which we call the Fractional Maxwell244
model (FMM). In the latter four-parameter model each element is described by a quasi-245
property (which we denote V or G) and an exponent (α or β), where we take α > β with-246
out loss of generality. This constitutive model is schematically depicted in Fig. 2(b). In the247
Maxwell model the stresses in each element are equal (σ = σ1 = σ2) and the strains are248
8
Page 9
additive (γ = γ1 + γ2). With the constitutive relation for each springpot (Eq.(1) and Fig. 2(b))249
this gives the fractional Maxwell model (FMM):250
σ(t) +V
G
dα−βσ(t)dtα−β
= Vdαγ(t)
dtα(5)
where 0 ≤ β ≤ α ≤ 1.251
Materials that are described by a single power-law (e.g. Eq. (2)), have no characteristic252
timescale that can be identified. A discrete spectral representation of the power-law kernel253
in Eq. (2), requires an infinitely broad spectrum of time constants (Ng and McKinley, 2008).254
However for a material displaying two power-law regimes, as described by the FMM, we can255
unambiguously define one single characteristic timescale τc by the parameter combination:256
τc = (V/G)1/(α−β) (6)
This time corresponds to the characteristic time (or frequency ωc = 1/τc) at which the local257
power-law in the material response, transitions from one exponent (α) to the other (β). This258
expression also reduces to the expected value for the limit of a classical Maxwell model for259
which V → η, G→ G, α→ 1 and β→ 0, so that τc = η/G.260
3. Results261
3.1. Rheological definitions of firmness, springiness, and rubberiness262
There is no consensus on a unique definition of the firmness, springiness, and rubberiness263
of food gels such as cheese, nor its method of assessment (Foegeding and Drake, 2007), which264
hampers correlation of these texture attributes to essential material properties. The firmness F,265
can be judged while deforming a piece of cheese with the mouth (tongue and palate, incisors,266
front teeth or molars) or by hand (Fig. 1(a)). During the assessment, the cheese can be slightly267
pressed or completely bitten through (Drake, 2007). When choosing a method of assessment,268
panelists tend to make a choice that depends on the level of firmness itself (Szczesniak and269
Bourne, 1969).270
Correlative studies between panel test results and instrumental measurements do not pro-271
vide additional clarity on how firmness should be defined. It has been correlated to rheologi-272
cal properties covering the regimes of linear to non-linear rheology up to fracture (Foegeding273
et al., 2003; van Vliet, 1991). Since the development of the Texturometer (Friedman et al.,274
1963) and the entrance of the Instron Universal Testing Machine in texture measurements275
(Bourne, 1968), the uniaxial compression experiment has become very popular to assess firm-276
ness and is still deployed regularly (e.g. Liu et al. (2015); Cakir et al. (2012)). In this ex-277
periment (Fig. 1(b)), a cylindrical sample is crushed between two parallel plates either at a278
9
Page 10
constant rate of displacement (Friedman et al., 1963; Bourne, 1968) or at constant strain rate279
(Luyten, 1988; Goh et al., 2003). In an alternative configuration, firmness is determined with280
a penetration test, where the upper plate is replaced by an indenter and the test material is left281
to rest in the cup or beaker in which it was prepared (e.g. Li Yuet Hee et al. (2008); Oliver282
et al. (2015); Bot et al. (2014)). Such indentation tests deform the material locally and are of283
specific relevance when the materials with the lowest firmness are too weak to hold their own284
weight. When using maximal force as a measurement for firmness, it appears that the relative285
firmness of two types of cheese depends both on the rate and the degree (or extent) of com-286
pression (Shama and Sherman, 1973; Bourne and Comstock, 1981). This gives an indication287
that when measured instrumentally, firmness has both a viscoelastic as well as a plastic (or288
flow) component.289
Firmness is often intertwined with hardness (Jowitt, 1974; Peleg, 1980; van Vliet, 1991).290
Jowitt (1974) prefers the term firm over hard and defines it as ’high resistance to deforma-291
tion’. Reiner and Scott Blair (1967) define hardness as a ’resistance to penetration’, i.e. the292
resistance to a specific type of deformation, which can be instrumentally quantified with the293
indentation test described above. They use ‘suppleness’ as an antonym for ‘hardness’ whereas294
‘soft’ is the antonym for ‘firm’ (Jowitt, 1974). Van Vliet (1991) proposes the use of firmness295
for recoverable viscoelastic deformations only and hardness for non-recoverable plastic de-296
formations. This is in line with Scott Blair’s findings that firmness is a time-dependent texture297
attribute.298
Two alternative studies indicate that firmness can indeed be measured with loading con-299
ditions that remain within the linear viscoelastic regime of the food material. The first is a300
series of comparative experiments on Monterey Jack and Mozarella cheese between an ex-301
pert panel and rheometry. Brown et al. (2003) showed that the maximum compliance, Jmax =302
max {J(t)}, determined in a 600 s creep test (Fig. 1(c)) in the linear viscoelastic region had303
a strong negative correlation with both hand- and mouth-evaluated firmness. Ewoldt (2013)304
demonstrated that by plotting the creep compliance J(t), the best discrimination between a305
soft and firm grade of therapy putty could be made. Ewoldt also showed that firmness is a306
sensory texture attribute that cannot only be measured with tactile senses but also by vision307
(Bourne, 2002b) as long as one probes the property over long time-scales. A soft material308
will lose shape rapidly over time, an undesirable feature for a cheese that needs to be sliced309
(Fig. 1(a)).310
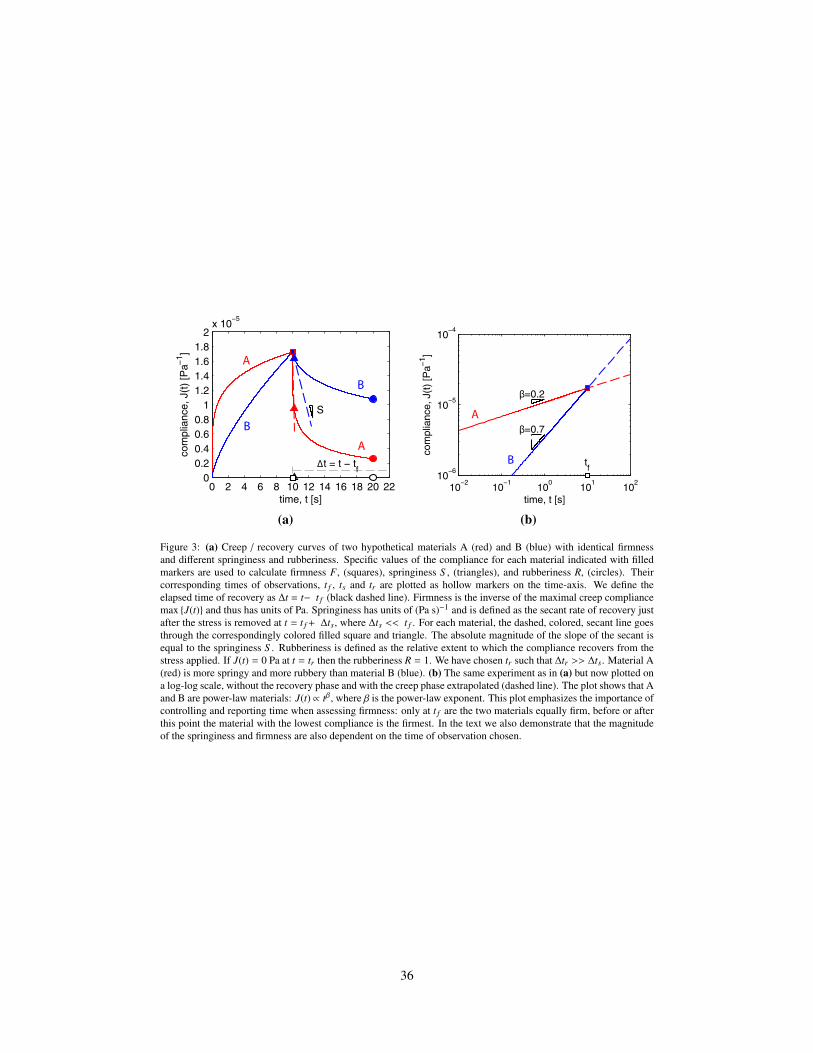
In Fig. 3 we have summarized the findings from Scott Blair and Coppen (1940c); Scott Blair311
(1947), Brown et al. (2003) and Ewoldt (2013). In Fig. 3(a) we plot the compliance against312
time for a creep / recovery experiment (see also Fig. 1(c)) on two hypothetical materials.313
10
Page 11
Firmness F, is defined as a resistance to creep, and can be expressed by the inverse of the314
maximum compliance J(t) measured at the end of the creep phase. The time at which we315
measure a texture attribute is generically called the time of observation to. For firmness this316
time is denoted as t f = to. Thus the firmness F is defined as317
F ≡ 1/max{J(t)} = 1/J(t f ) (7)
and has units of Pa. The datapoints that are used to calculate the firmness F, of materials318
A and B are indicated by the filled, colored square on the creep / recovery curve in Fig. 3.319
The corresponding time of observation t f is indicated by the hollow square on the time-axis.320
The two hypothetical materials A and B are equally firm at the time of observation t f = 10 s,321
however the two creep curves approach J(t f ) ≡ max {J(t)} differently. In Fig. 3(b) we have322
plotted the creep phase of the same experiment on a double logarithmic scale and extrapolated323
the curves beyond the time of observation t f (dashed line). It shows that the two materials each324
have the form of a power-law with different slopes β. The plot also emphasizes the importance325
of the time of observation in measuring firmness. If we had chosen a smaller observation time,326
material A would have been considered firmer than B and vice versa at longer times.327
The term ‘elastic’ is often used as a synonym for ‘springy’ (Davis, 1937; Devezeaux de328
Lavergne et al., 2015; Scott Blair, 1973). The word ‘elasticity’ was taken up in the list of329
primary parameters in the Texture Profile Analysis (TPA) (Szczesniak, 1963a). Davis (1937)330
pointed out that the use of ‘elasticity’ is not correct and that should be reserved for the as-331
sessment of a modulus by hand. More recently ‘elasticity’ has been replaced by ‘springiness’332
(Szczesniak, 2002) in Texture Profile Analysis and it is defined in TPA as ‘the rate at which a333
deformed material goes back to its undeformed condition after the deforming force has been334
removed’ (Szczesniak, 1963a). Davis and Blair argued that springiness is related to a time335
of relaxation (Davis, 1937; Scott Blair, 1973) and that the sensation involved is an amount336
of recovery instead of a rate. Based on the graphical definition of springiness in Friedman337
et al. (1963), van Vliet (1991) concluded that the springiness S indeed should be defined as338
an ‘extent’ to which a deformed material returns to its undeformed state. In their review of339
texture definitions, Foegeding and Drake (2007) identify authors that speak of ‘a rate at which340
sample “springs” back’, as well as those who speak of an ’extent of recovery’.341
Van Vliet (1991) combines both rate and extent of deformation in one definition by propos-342
ing ‘the tendency to instantaneously and completely recover from a large deformation after343
removal of the deforming force’, however he prefers to use the term rubberiness instead of344
springiness. Foegeding and Drake (2007) link rubberiness to springiness by defining it as ”the345
degree of rubberiness experienced when biting in a sample”. We propose that from a rheolog-346
11
Page 12
ical perspective and based on the competing definitions above, it is justifiable and necessary347
to have two separate, distinct definitions for the springiness S and rubberiness R. Intuitively348
the word ‘springiness’ deals with sudden responses that are evaluated over a short period of349
time and thus the use of a rate is appropriate. As a consequence the term ‘rubberiness’ is used350
to relate to the total extent of strain that is recovered at the end of the creep / recovery exper-351
iment. In polymeric theories, rubbery materials are assumed to be purely elastic or perfectly352
cross-linked; in other words any applied deformation is reversed upon cessation of the appli-353
cation. By analogy, the term ‘rubberiness’ is used to relate to the amount of strain recovered354
at the end of a creep-recovery experiment.355
Our precise, rheological definitions for the springiness S and rubberiness R, follow from356
the location of the three markers on each creep / recovery curve in Fig. 3(a). For convenience357
we define the elapsed time of recovery as ∆t= t − t f (denoted by the dashed, horizontal black358
line in Fig. 3(a)). The springiness S is defined as the absolute secant rate of recovery just after359
the stress is released and is judged at a time of observation ts =t f + ∆ts. The springiness is360
thus unambiguously and mathematically defined as:361
S ≡
∣∣∣∣∣∣ J(ts) − J(t f )ts − t f
∣∣∣∣∣∣ =
∣∣∣J(t f + ∆ts) − J(t f )∣∣∣
∆ts(8)
and has units of 1 / Pa s, which is equal to the inverse of the units of viscosity. In practice one362
judges the springiness of a material such as cheese, by looking at the instantaneous response363
when the stress is released. It is thus logical to take ∆ts<< t f . We will use ∆ts= 0.1 s364
when we report values for springiness in the remainder of this paper, which is a time close365
to the response time of a modern rheometer at the time of publication. The location of the366
time of observation for measuring springiness is denoted on the time-axis is indicated by the367
hollow triangle in Fig. 3(a), which visually overlaps with the hollow square representing t f ,368
indicating that the elapsed time of recovery is very small. Note, that although the recovery369
time is short, the creep compliance of Material A (red triangle) has decreased considerably.370
This is reminiscent of a very springy material and is expressed by a secant (red dashed line)371
that is more steeply negatively sloped than the secant of material B (blue dashed line). Thus372
the materials A and B are equally firm, but not equally springy for a fixed time of observation373
t f .374
The rubberiness R, is defined as the extent to which a cheese returns to its original shape375
during the interval (t f , tr], where tr is the time we take for measuring rubberiness. If the strain376
is fully recovered at the time t = tr, then R = 1. If there is no strain recovery at t = tr , then377
the rubberiness R = 0. Thus R is mathematically defined as:378
12
Page 13
R ≡J(t f ) − J(tr)
J(t f )= 1 −
J(t f + ∆tr)J(t f )
= 1 − F(t f )J(t f + ∆tr) (9)
which is a dimensionless quantity, and where ∆tr is the elapsed time of recovery for measuring379
rubberiness. In this paper we will use values of ∆tr= 10 seconds (hollow circle on the time axis380
in Fig. 3(a)) and ∆tr= 100 seconds, a time convenient to measure in the rheometer and which381
corresponds to practical times of judging the attribute. By choosing ∆tr>>∆ts we distinguish382
between the key features of the short and intermediate time response of power-law materials383
and make springiness and rubberiness two distinct attributes.384
To conclude, we want to address the suggestion that the definition of an antonym of a385
texture attribute (Jowitt, 1974) or the definition of an inverse of a rheological property (Reiner386
and Scott Blair, 1967) helps the comprehension of the differences between terms used. We387
propose to follow Jowitt (1974) and call a food gel with a low level of firmness ‘soft’. Foeged-388
ing and Drake (2007) defines ‘softness’ as easily ‘moldable’, we propose to use the latter term389
as an antonym for the rubberiness R. For the springiness S Jowitt (1974) proposes to use the390
antonym ‘plastic’, but this is a synonym for ‘moldable’ and has no sense of rate. We suggest391
the use of ‘squishy’ instead (Yates and Drake, 2007).392
In this section we have given precise rheological definitions of firmness, springiness, and393
rubberiness both in words as well as in terms of specific points on the creep compliance curve,394
J(t), of a creep / recovery experiment (Fig. 3). We will now use these rheological definitions to395
derive expressions for firmness, springiness, and rubberiness using the fractional constitutive396
framework. We subsequently refer to these definitions as the FSR-equations.397
3.2. Fractional equations for firmness, springiness, and rubberiness (FSR)398
For the analytical expressions of the creep compliance J(t), Laplace transformation (Eq. (3))399
of the constitutive equation for the springpot (Eq. (1)) is performed with a step shear stress as400
the input and then solving for the strain γ(t) by inverse Laplace transformation. For the Scott401
Blair model this gives the following expression for the compliance (Jaishankar and McKinley,402
2013):403
J(t) ≡γ(t)σ0
=1G
tβ
Γ(1 + β)(10)
and for the fractional Maxwell model404
J(t) =
(1V
tα
Γ(1 + α)+
1G
tβ
Γ(1 + β)
)(11)
As before V and Gare quasi-properties, and 0 ≤ β ≤ α ≤ 1 are the fractional exponents.405
For materials probed at strains within the linear viscoelastic limit which can be described406
by a single power-law, or springpot element, the compliance is given by Eq. (10). Using the407
13
Page 14
definition of firmness in Eq. (7) the fractional equation for the firmness F of a Scott Blair408
element becomes409
F(t f ) =1
J(t f )= GΓ(1 + β)t−βf (12)
This expression for firmness is in line with Scott Blair’s observations (Scott Blair et al.,410
1947): it is a time-dependent texture attribute that depends on two material properties, the411
quasi-property G and the power-law exponent β, as well as on the time of observation t f . We412
have defined the firmness F, as being independent of the stress applied, which also corre-413
sponds to Scott Blair’s findings: although the stresses applied by panelists varied by a factor414
two, it did not affect their judgments of differences in firmness. Since the time of observation415
is essential for quantifying numerical values of the firmness, any measurement should always416
be provided together with the observation time t f and the characteristic power-law exponent417
β, to enable extrapolation to practical situations. The time dependency of the firmness F(t f ),418
favours a stress-controlled creep measurement (Fig. 1(c)) over the more common practice of419
reporting a modulus from a strain-rate-controlled compression experiment (Fig. 1(b)); the for-420
mer experiment naturally exposes time effects and allows us to interconnect the firmness to421
situations where stressess are applied for short times, such as sensory texture measurement,422
or for long times, such as in storing cheese (Fig. 1(a)) .423
The definition of the springiness S is given in Eq. (8). The point J(t f ) lies at the end of424
the creep curve and is given by the inverse of Eq. (12). The point J(ts) lies on the recovery425
curve and requires an appropriate fractional calculus expression for this part of the creep-426
recoil experiment, which is derived by Jaishankar and McKinley (2014) for the Scott Blair427
element:428
J(t) =tβ − (t − t f )β
GΓ(1 + β), for t > t f (13)
When we divide both nominator and numerator in Eq. (13) by tβf and substitute the equa-429
tion for firmness , Eq. (12), and our definition for the recovery time, ∆t= t - t f , we get430
J(t) =t−βf (tβ − ∆tβ)
F(t f ), for t > t f (14)
To derive an expression for the springiness S , we first define the elapsed recovery time at431
which we measure as ∆ts= ts − t f . The numerator of Eq. (8) is then expressed as432
J(ts) − J(t f ) =t−βf (tβs − ∆tβs )
F(t f )−
1F(t f )
, for ts > t f (15)
Substituting this in Eq. (8) and writing out ts = t f + ∆ts gives433
14
Page 15
S =
∣∣∣(1 + ∆ts/t f )β − (∆ts/t f )β − 1∣∣∣
F(t f )∆ts(16)
The springiness equation reveals that this attribute is indeed inversely related to firmness.434
The time dependency of a springiness measurement is two-fold, it depends on the duration435
t f of the creep phase and the time ∆ts over which the secant rate is measured. We have436
depicted this two-fold time dependency in Fig. 4 where we have plotted springiness for the437
two hypothetical materials A and B from the previous section (Fig. 3). Recall that at a time438
t f = 10 s these two materials were equally firm, and that material A (with the smaller fractional439
power-law exponent) was the most springy. This is in line with what we read out from the440
solid lines in Fig. 4(a) when we take ∆ts= 0.1 seconds (for the elapsed time at which we441
measure springiness). However if we increase the value of the elapsed time ∆ts, we arrive at442
a point where we measure approximately equal springiness for both materials. For t f > 10 s443
even a crossover point appears as shown by the dashed lines for t f = 106 s. This crossover444
point shifts towards smaller time with increasing t f (data not shown). For small values of the445
elapsed recovery time ∆t = t− t f the springiness becomes independent of the total creep time446
t f . If we substitute the expression for firmness from Eq. (12) in Eq. (16) for times ∆ts that are447
small compared to the time of measuring firmness, t f , the latter time indeed cancels out:448
S ≈
∣∣∣∣∣∣∣∣ −(∆ts/t f )β
GΓ(1 + β)t−βf ∆ts
∣∣∣∣∣∣∣∣ =
∣∣∣∣∣∣ −∆tβ−1s
GΓ(1 + β)
∣∣∣∣∣∣ , for ∆ts << t f (17)
To derive an expression for the rubberiness R of the Scott Blair element, we begin with449
the definition given in Eq. (9). Substituting the time tr in Eq. (14) and subsequently defining450
this time in terms of elapsed recovery time, using tr = t f +∆tr gives:451
J(tr) =t−βf
((t f + ∆tr)β − ∆trβ
)F(t f )
, for t > t f (18)
When we substitute this equation for the compliance at the time at which we measure452
rubberiness, J(tr), into the mathematical definition of rubberiness, given by Eq. (9), we obtain453
the following expression:454
R = 1 − t−βf
((t f + ∆tr)β − ∆trβ
)(19)
It thus appears that rubberiness is not a function of the quasi-property G of the material455
directly, but of the two times ∆tr and t f , and the fractional exponent only. This two-fold time456
dependency is reflected in Fig. 4(b) where we have plotted the rubberiness R, for the same457
materials A and B as in Fig. 3 and Fig. 4(a). For rubberiness we do not observe a cross-over458
15
Page 16
point of the two materials. However the plots of the rubberiness reveal another remarkable459
feature of this texture attribute: all power-law materials probed in the linear viscoelastic region460
will ultimately show a rubberiness approaching unity. Distinctions between the two materials461
only comes from differences in the fractional time exponent and the combination of values462
of t f and ∆tr chosen. In rheological terminology this means that the long term compliance463
of the recovery phase, modeled with a single springpot, will approach zero, so that all of the464
imposed strain is recovered elastically. Jaishankar and McKinley (2014) showed that this long465
term behaviour for J(t), Eq. (13), is approximated by466
J(t) ≈tβf
GΓ(β)
(tt f
)β−1
(20)
Since β < 1, the compliance thus monotonically approaches zero, which confirms the467
response in Fig. 4(b). The full elastic recovery of strain after a small applied deformation468
within the linear viscoelastic regime is a hallmark of protein gels (Leocmach et al., 2014).469
Our FSR-equations consist of only these material parameters and a specification of the470
time of measurement. This suggests that we may perform a a single firmness measurement471
(i.e. a creep test), determine the quasi-property G and fractional exponent β, and then obtain472
values for both springiness and rubberiness as long as we stay within the linear viscoelastic473
region; a separate recovery measurement is not required.474
Using fractional calculus, we have developed equations that enable the texture attributes of475
firmness, springiness, and rubberiness to be defined in terms of two constitutive material pa-476
rameters, which can be extended to four parameters if an even more accurate description over477
a much wider time scale is necessary. The FSR-equations show that in the linear viscoelastic478
regime these three texture attributes all time-dependent and coupled (to an extent that depends479
on the total experiment duration). From a single measurement of the linear viscoelastic creep480
compliance function J(t) we can accurately determine the magnitudes of the quasi-propertyG481
and fractional exponent β describing the material, and then predict values of the firmness, the482
springiness and the rubberiness. The firmness and springiness of a sample are anti-correlated483
through the magnitude of the quasi-property G, which sets the scale of the stresses in the484
material. By contrast, the rubberiness is not a function of the quasi-property, but only of the485
fractional exponent β. Note that if equal test times are used to measure firmness during creep,486
and to measure rubberiness during recovery, i.e. so that t f = ∆tr, Eq. (19) gives487
R = 2 − 2β (21)
and the rubberiness becomes time-independent.488
16
Page 17
We emphasize that the FSR-equations (12),(16),(19) allow us to quantify the three texture489
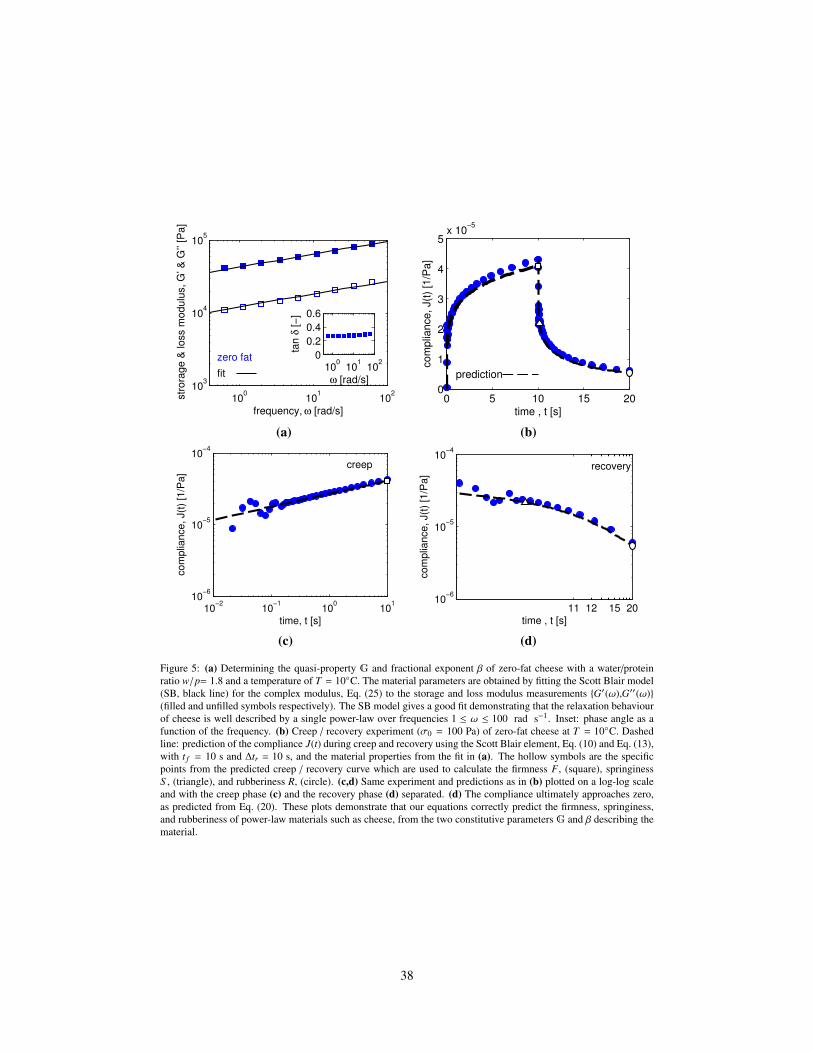
attributes from any of the standard linear viscoelastic material functions, as we demonstrate490
in Fig. 5(a). Here we display a frequency sweep performed on zero-fat Gouda cheese, a soft-491
solid, hydrocolloidal gel, at a temperature of T = 10◦C and water/protein ratio of w/p = 1.8.492
The linear viscoelastic properties of the cheese show the typical power-law behaviour of a493
critical gel (Winter and Mours, 1997): a line of constant slope on a log-log plot over a wide494
range of frequencies for both the storage and loss modulus, {G′(ω),G′′(ω)}, with both curves495
nearly parallel. To retrieve the quasi-properties and exponents from these plots, we need an496
expression for the storage and loss modulus for the Scott Blair model. The complex modulus497
is obtained by Fourier transforming the constitutive equation for the springpot, Eq. (1), which498
results in:499
G∗(ω) = G(iω)β (22)
Following the procedure for separating out the real and the imaginary part, outlined by Friedrich500
et al. (1999) and Schiessel et al. (1995), one can readily find for the storage modulus501
G′(ω) = Gωβ cos (πβ/2) (23)
and for the loss modulus502
G′′(ω) = Gωβ sin (πβ/2) . (24)
The magnitude of the complex modulus, |G∗(ω)|, can be calculated from503
|G∗(ω)| =√(Gωβ cos (πβ/2)
)2+
(Gωβ sin (πβ/2)
)2= Gωβ. (25)
This set of equations shows that G′(ω) can be predicted from G′′(ω) and vice versa and that504
we can either fit equations (23), (24) or (25) to our dataset of G′(ω), G′′(ω), or |G∗(ω)| re-505
spectively. We choose Eq. (25) in combination with a least square optimisation procedure to506
obtain G and β, since it gives the least bias towards either the G′(ω) or G′′(ω) data points.507
The reconstituted curve of the SB model, using magnitudes of G = 4 × 10⁵ Pa sβand β=0.18,508
is depicted by the solid lines in Fig. 5(a). It shows that the model gives a good fit for both509
the elastic and storage moduli, with only the two constitutive parameters, the quasi-property510
G and the fractional exponent β.511
The inset in Fig. 5(a) demonstrates that the phase angle is independent of the frequency512
ω, which is a second typical feature of critical gels. This corresponds to what the Scott Blair513
model predicts:514
tan(δ) =G′′(ω)G′(ω)
= tan (πβ/2) (26)
i.e. the phase angle is a function of the fractional exponent β only.515
17
Page 18
In Fig. 5(b) we show the creep / recovery curve of a sample from the same zero-fat cheese516
(blue circles) as used in Fig. 5(a), at the same temperature of T = 10◦C. The dashed line517
denotes the prediction of the compliance J(t), which is obtained by substituting the acquired518
material parameters (from the SB fit to the data for the complex modulus depicted in Fig. 5(a),)519
into the SB model expressions for J(t) in the creep phase, Eq. (10), and in the recovery phase,520
Eq. (13), respectively. The hollow symbols in Fig. 5(b), and in the log-log representation521
of the creep phase in Fig. 5(c) and the recovery phase in Fig. 5(d), show that we accurately522
predict the evolution of J(t), from which we can then calculate the firmness F (circle), springi-523
ness S (triangle), and rubberiness R (circles) of zero-fat cheese. Both measured responses in524
Fig. 5(c) and Fig. 5(d) show some ‘creep ringing’ at very short times due to coupling of525
the elasticity with the moment of inertia of the instrument. Fig. 5(d) demonstrates that the526
compliance ultimately approaches zero, as predicted from Eq. (20).527
3.3. Texture engineering528
We have demonstrated how a framework based on fractional equations can be used to529
characterize and quantify the linear viscoelastic (LVE) response of hydrocolloidal gels. This530
framework is compact and effective and only one constitutive element, the two-parameter531
springpot or Scott Blair element (Eq. (1)) (Koeller, 1984), is required to describe the LVE532
material functions of cheese over a broad range of frequencies or times. The springpot is533
characterized by the quasi-property, G, and the fractional exponent, β, both introduced to534
rheology by Scott Blair et al. (1947). The quasi-property can be viewed as an ‘intermediate’535
material property that is appropriate for characterizing soft materials and which sets the scale536
of the stress in the material. It smoothly interpolates between an elastic shear modulus G537
and a Newtonian viscosity η. The fractional exponent quantifies the frequency and temporal538
response of the material and ranges from purely elastic (β = 0), to purely viscous (β = 1).539
Our measurements show that its magnitude is related to the underlying microstructure and540
composition of the material.541
From the descriptions of the manipulations and observations required to evaluate the firm-542
ness, springiness, and rubberiness of cheese from textural analysis (Szczesniak, 1963b; Davis,543
1937; Foegeding and Drake, 2007; van Vliet, 1991) we have deduced that the rheological544
analogues of these attributes are all defined by specific points on the creep / recovery curve545
(Fig. 3). We have demonstrated that the fractional constitutive framework allows us to ob-546
tain quantitative descriptions of this rheological experiment that can be expressed explicitly547
in terms of the quasi-property and the fractional exponent of the model. By substituting the548
appropriate timescales of observations we are able to predict the textural measures of firmness549
18
Page 19
F, springiness S , and rubberiness R, from the material properties G and β. We refer to our550
predictive equations based on essential material properties as the FSR-equations (Eq. (12),551
(16), (19) respectively). They guide the effective reformulation of semi-soft food gels such as552
cheese, while keeping the product at a desired level of firmness, springiness, and rubberiness.553
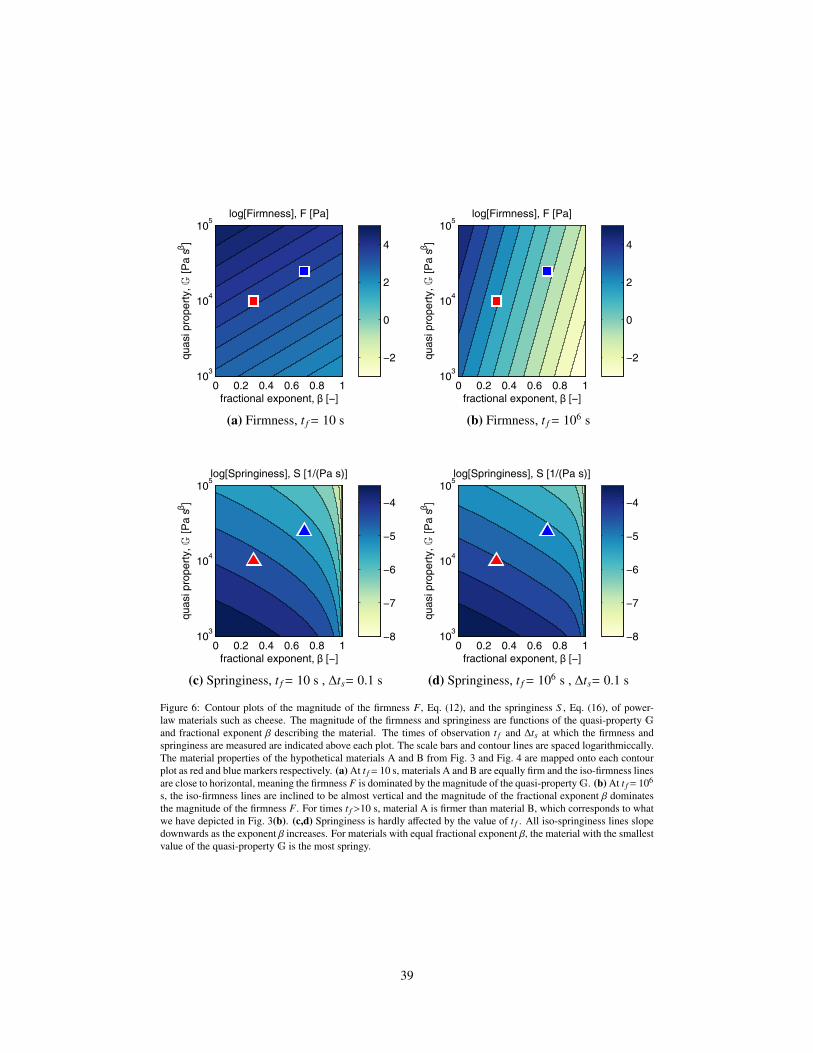
In Fig. 6 we sketch out one example of our FSR-equations being used as a design tool.554
The markers in Fig. 6(a) represent two sets of material parameters {G, β}A and {G, β}B . These555
sets describe the hypothetical materials A and B from Fig. 3 and are mapped onto firmness556
contours, which are calculated with Eq. (12) and plotted on a logarithmic scale. In Fig. 6(a)557
we take the same time of observation t f = 10 s as in Fig. 3, which results in the materials558
A and B being equally firm, i.e. FA = FB. The markers in Fig. 6(a) thus lie on the same559
iso-firmness line, and we take the magnitude of F = 6 × 10⁴ Pa at t f = 10 s represented by560
these markers, as our desired level of firmness.561
When we increase the time of observation in Fig. 6(b) from t f = 10 s to t f = 106 s, the iso-562
firmness lines rotate counterclockwise, from a more horizontal to more vertical orientation.563
This tells us that at short times, the magnitude of the quasi-property G dominates firmness564
assessment, whereas at long times of observation it is dominated by the fractional exponent β565
of the material. This results in material A being the firmer of the two materials at t f = 106 s.566
It has the lowest quasi-property but also the lowest fractional exponent giving FA = 6 × 103567
Pa as compared to FB = 2× 101 Pa at t f = 106 s. If retaining shape after long times of loading568
(e.g. during storage) is a product requirement, material A is preferred over material B.569
In Fig. 6(c) we map these same two materials A and B onto a springiness contour plot. This570
figure shows that a more elastic material with a low value of the quasi-property is the most571
springy. Fig. 6(d) demonstrates that there is no significant effect of the observation time t f on572
the magnitude of springiness assessed in the material, provided that we use small values for the573
elapsed recovery time ∆ts � t f . This corresponds to our analysis of the springiness equation574
in section 3.2, the bulk of the elastic strain energy stored in the material is accumulated (and575
returned) at short time scales. For values of the fractional exponent β > 0.8, the springiness576
rapidly drops and the material becomes very ’squishy’. If low springiness is preferred over577
retaining shape, than we chose material B. For rubberiness, similar plots to those shown in578
Fig. 6(a)-(d) can also be created. If we take equal times of observations for firmness and579
rubberiness, t f = ∆tr, then equation (21) applies and all iso-rubberiness lines are vertical: the580
magnitude of the rubberiness is independent of the magnitude of the quasi-property G. The581
most rubbery material will be material A, which has the lowest fractional exponent.582
Design plots such as Fig. 6 reflect graphical representations of how rheology can, and583
should, be used in the context of structure-texture engineering. The foundations for this ap-584
19
Page 20
proach were laid more than 60 years ago by Davis (1937) and Scott Blair (1947; 1959), two585
pioneers in food rheology. They both combined well-defined deformations of food-stuffs with586
a central question: which essential material property gives rise to a specific texture attribute.587
We favour their approach over the more undirected approach of statistically correlating large588
amounts of rheological data to the results from Quantitative Descriptive Analysis (QDA) of589
multiple texture attributes. Our reservations to the latter approach are for two reasons. First590
the deformations and observations in QDA that lead to the texture judgment are ill-defined591
and may vary from panel to panel. This a priori weakens correlations with the measurements592
obtained from the carefully designed rheological experiment. Our second argument to favour593
the Scott Blair / Davis approach, is that material properties are intrinsic properties whereas594
texture attributes are extrinsic in nature (Reiner, 1971). This essential difference is clearly595
demonstrated by the plots in Fig. 6. Whereas the coordinates of the markers that indicate the596
material properties of materials A and B do not change from plot (a)-(d), the grade and orien-597
tation of the contours that represent texture vary, depending on the attribute of interest and the598
timescale of observation chosen. The extrinsic nature of such sensory texture attributes makes599
it very hard, if not impossible, to make an unambiguous connection from a panel judgment to600
material models representing the food microstructure, when a purely statistical model is used601
as an intermediate. Once dynamic and quantitative relations between texture and the essential602
material properties are established (such as the FSR-equations developed in this study), one603
can build on the long track record of quantitative rheological testing for probing structure-604
property relations.605
4. Conclusion606
We have created a structure-texture engineering model which can help guide the ratio-607
nal reformulation of semi-soft food gels while maintaining reference levels of firmness F,608
springiness S , and rubberiness R. The central features of the model are rheological definitions609
of these texture attributes in the linear viscoelastic regime. Firmness is defined as the inverse610
of the compliance at the end of the creep regime, springiness as the secant rate of change of the611
compliance during the first 0.1 seconds of recovery, and rubberiness as the relative amount of612
strain recovered at the end of the creep recovery period. The firmness, springiness, and rubber-613
iness (FSR) equations are constructed using a fractional constitutive framework, which can be614
visualized pictorially in terms of a mechanical element known as a springpot (Koeller, 1984).615
This framework compactly and effectively captures the predominant power-law relaxation and616
retardation of complex multi-scale materials such as cheese.617
20
Page 21
The FSR-equations contain only two material parameters, the quasi-property G, and the618
fractional exponent β (Scott Blair, 1947), and the resulting stress or strain in the material619
depends on an experimental time of observation to. These two material parameters can be620
extracted from measurements of any of the standard linear viscoelastic material functions:621
the complex modulus, G∗(ω)= G′(ω) + i G′′(ω), the relaxation modulus, G(t), or the creep622
compliance, J(t).623
Our FSR-equations are derived from linear viscoelastic theory and predict time-dependent624
responses for the firmness (as demonstrated by Scott Blair et al. (1947)) and also for the625
springiness and rubberiness assessed for a material. Firmness is linearly related to the quasi-626
propertyG, whereas springiness is inversely related toG. This rationalizes the anti-correlation627
between the two texture attributes commonly found experimentally. We have chosen to mea-628
sure springiness at very short times of observation after the imposed shear stress is released,629
which results in a texture attribute that is independent of the time of observation for measur-630
ing firmness, t f . Rubberiness is not a function of the quasi-property (i.e. the magnitude of the631
stress in the material), but only of the fractional exponent β, t f , and the elapsed recovery time632
for measuring rubberiness, ∆tr. For the specific case where both times are equal, t f = ∆tr, time633
cancels out and rubberiness is merely a function of the fractional exponent β that characterizes634
the timescale of the material response.635
The viscoelastic nature of the firmness implies that for specific pairs of power-law ma-636
terials, the experimental conditions of creep and recovery can be chosen such that different637
materials appear to be equally firm. For values of the creep times that are common in judging638
cheese texture, one material can be assessed as the firmest, whereas for creep times relevant639
to storage the same material may be regarded as the softest. If one waits for the materials to640
recover from the imposed stress for long times, both power-law materials will fully recover641
from the applied stress and will be judged to be completely rubbery, however at shorter times642
the sample will appear to have different rubberiness. For all three examples of viscoelastic643
time-dependency outlined above, our FSR-equations can calculate if and when these transi-644
tions occur, provided the material parameters G and β of each material are known. The food645
engineer must be keenly aware of the temporal dependencies in these textural attributes before646
performing a rheological test.647
Although there has been a long standing promise for rheology to deliver quantitative648
structure-texture relations for foods, successful examples are rare. In this paper we have im-649
plicitly formulated three prerequisites for a successful structure-texture model for food gels,650
based on shear rheometry. The first is selecting texture attributes that can be measured with651
bulk rheology and thus are assessed at first touch or bite (before mastication disrupts sample652
21
Page 22
homogeneity). This holds for all three of the attributes firmness F, springiness S , and rub-653
beriness R, defined here. The second is to have rheological definitions that leave no room654
for selective interpretation and can be directly evaluated from well-defined rheological exper-655
iments. We have done so by defining realistic observation times and by revisiting the early656
creep / recovery experiments performed by Davis (1937) and argue that J(t) should be the657
standard rheological curve for measuring and defining firmness, springiness, and rubberiness.658
The third prerequisite is to have a constitutive model which accurately describes the mate-659
rials response to a deformation with as few material parameters as possible and from which660
the creep / recovery curve can be reconstituted. The model parameters should be intrinsic661
material constants and thus be obtainable from an independent rheological experiment, e.g.662
small amplitude oscillatory shear (SAOS). Fractional constitutive equations, such as the Scott663
Blair and fractional Maxwell model, based on the ideas of fractional calculus meet these re-664
quirements. The key to a successful structure-rheology-texture model is to determine material665
parameters that predict complex, time-dependent (and often subjectively-defined) properties666
such as texture which are founded in the material structure; Scott Blair’s (1947) original ideas667
of quasi-properties and fractional exponents do just that.668
In Part II of this paper (Faber et al., 2016), we will show that the FSR-equations ((12), (16),669
(19)) will also quantify the firmness, springiness, and rubberiness in the viscoelastic regime670
from a measurement of the relaxation modulus G(t). We also address the over-prediction by671
the Scott Blair model of the rate of recovery of cheese subjected to loadings that exceeds the672
linear viscoelastic limit and which therefore result in irreversible plastic flow events occurring.673
Acknowledgments674
The authors thank Prof. H. Meijer, Dr. L. Van Breemen, and Dr. H. Luyten for guidance,675
and Anne van de Pijpekamp for technical assistance. We also thank FrieslandCampina for676
funding this research.677
References678
Abramowitz, M. and Stegun, A. (1964). Handbook of Mathematical Functions. U.S. National679
Bureau of Standards, Washington.680
Aguilera, J. M. (2005). Why food micro structure? Journal of Food Engineering, 67(1-2):3–681
11.682
22
Page 23
Almeida-Rivera, C., Jain, P., Bruin, S., and Bongers, P. (2007). Integrated product and process683
design approach for rationalization of food products. Computer Aided Chemical Engineer-684
ing, 24:449–454.685
Amblard, F., Maggs, A. C., Yurke, B., Pargellis, A. N., and Leibler, S. (1996). Subdif-686
fusion and anomalous local viscoelasticity in actin networks. Physical Review Letters,687
77(21):4470–4473.688
Bagley, R. L. and Torvik, P. J. (1983a). Fractional calculus - a different approach to the689
analysis of viscoelastically damped structures. AIAA journal, 21(5):741–748.690
Bagley, R. L. and Torvik, P. J. (1983b). Theoretical basis for the application of fractional691
calculus to viscoelasticity. Journal of Rheology, 27(3):201–210.692
Barrangou, L. M., Drake, M. A., Daubert, C. R., and Foegeding, E. A. (2006). Textural693
properties of agarose gels. II. Relationships between rheological properties and sensory694
texture. Food Hydrocolloids, 20(2-3 spec. iss.):196–203.695
Bertola, N. C., Califano, A. N., Bevilacqua, A. E., and Zaritzky, N. E. (2000). Effects of696
ripening conditions on the texture of Gouda cheese. International Journal of Food Science697
and Technology, 35(2):207–214.698
Bird, R. B., Armstrong, R. C., and Hassager, O. (1987). Dynamics of Polymeric Liquids,699
volume 1. John Wiley & Sons Inc, second edition.700
Bot, A., Foster, T. J., and Lundin, L. (2014). Modelling acidified emulsion gels as Matryoshka701
composites: Firmness and syneresis. Food Hydrocolloids, 34:88–97.702
Bouchaud, J.-P. and Georges, A. (1990). Anomalous diffusion in disordered media: Statistical703
mechanisms, models and physical applications. Physics Report, 195(4-5):127–293.704
Bourne, M. C. (1968). Texture profile of ripening pears. Journal of Food Science, 33(2):223–705
226.706
Bourne, M. C. (1975). Is rheology enough for food texture measurement? Journal of Texture707
Studies, 6(2):259–262.708
Bourne, M. C. (1978). Limitations of rheology in food texture measurement. Journal of709
Rheology, 22(4):427.710
Bourne, M. C. (2002a). Food Texture and Viscosity: Concept and Measurement, pages 293 –711
323. Food Science and Technology. Academic Press, London, second edition.712
Bourne, M. C. (2002b). Food Texture and Viscosity: Concept and Measurement, pages 1 –32.713
Food Science and Technology. Academic Press, London, second edition.714
Bourne, M. C. and Comstock, S. H. (1981). Effect of degree of compression on texture profile715
parameters. Journal of Texture Studies, 12(2):201–216.716
Brenner, T., Tuvikene, R., Fang, Y., Matsukawa, S., and Nishinari, K. (2015). Rheology of717
23
Page 24
highly elastic iota-carrageenan/kappa-carrageenan/xanthan/konjac glucomannan gels. Food718
Hydrocolloids, 44:136–144.719
Brown, J. A., Foegeding, E. A., Daubert, C. R., Drake, M. A., and Gumpertz, M. (2003).720
Relationships among rheological and sensorial properties of young cheeses. Journal of721
Dairy Science, 86(10):3054–3067.722
Caggioni, M., Spicer, P. T., Blair, D. L., Lindberg, S. E., and Weitz, D. A. (2007). Rheology723
and microrheology of a microstructured fluid: The gellan gum case. Journal of Rheology,724
51(5):851–865.725
Campanella, O. H. and Peleg, M. (1997). On the tan(delta)-frequency relationship of foods726
and agricultural commodities. Journal of Texture Studies, 28(5):585–592.727
Cakir, E., Daubert, C. R., Drake, M. A., Vinyard, C. J., Essick, G., and Foegeding, E. A.728
(2012). The effect of microstructure on the sensory perception and textural characteristics729
of whey protein/κ-carrageenan mixed gels. Food Hydrocolloids, 26(1):33–43.730
Chen, J. (2009). Food oral processing-a review. Food Hydrocolloids, 23(1):1–25.731
Chen, J. C. and Kim, A. S. (2004). Brownian dynamics, molecular dynamics, and monte carlo732
modeling of colloidal systems. Advances in Colloid and Interface Science, 112(1-3):159–733
173.734
Choi, H., Mitchell, J. R., Gaddipati, S. R., Hill, S. E., and Wolf, B. (2014). Shear rheology735
and filament stretching behaviour of xanthan gum and carboxymethyl cellulose solution in736
presence of saliva. Food Hydrocolloids, 40:71–75.737
Craiem, D. and Armentano, R. L. (2007). A fractional derivative model to describe arterial738
viscoelasticity. Biorheology, 44(4):251–263.739
Craiem, D. and Magin, R. L. (2010). Fractional order models of viscoelasticity as an alter-740
native in the analysis of red blood cell (RBC) membrane mechanics. Physical Biology,741
7(1):1–3.742
Curro, J. G. and Pincus, P. (1983). A theoretical basis for viscoelastic relaxation of elastomers743
in the long-time limit. Macromolecules, 16(4):559–562.744
Davis, J. G. (1937). 162. The rheology of cheese, butter and other milk products. (the mea-745
surement of “body” and “texture”). Journal of Dairy Research, 8:245–264.746
de Faria, J. T., Minim, V. P. R., and Minim, L. A. (2013). Evaluating the effect of protein747
composition on gelation and viscoelastic characteristics of acid-induced whey protein gels.748
Food Hydrocolloids, 32(1):64–71.749
Del Nobile, M. A., Chillo, S., Mentana, A., and Baiano, A. (2007). Use of the generalized750
Maxwell model for describing the stress relaxation behavior of solid-like foods. Journal of751
Food Engineering, 78(3):978–983.752
24
Page 25
Devezeaux de Lavergne, M., van Delft, M., van de Velde, F., van Boekel, M. A. J. S., and753
Stieger, M. (2015). Dynamic texture perception and oral processing of semi-solid food gels:754
Part 1: Comparison between QDA, progressive profiling and TDS. Food Hydrocolloids,755
43:207–217.756
Dickinson, E. (2012). Emulsion gels: The structuring of soft solids with protein-stabilized oil757
droplets. Food Hydrocolloids, 28(1):224–241.758
Dolz, M., Hernandez, M. J., and Delegido, J. (2008). Creep and recovery experimental inves-759
tigation of low oil content food emulsions. Food Hydrocolloids, 22(3):421–427.760
Drake, M. A. (2007). Invited review: Sensory analysis of dairy foods. Journal of Dairy761
Science, 90(11):4925–4937.762
Drake, M. A., Gerard, P. D., and Civille, G. V. (1999). Ability of hand evaluation versus mouth763
evaluation to differentiate texture of cheese. Journal of Sensory Studies, 14(4):425–441.764
Ewoldt, R. H. (2013). Extremely soft: Design with rheologically complex fluids. Soft765
Robotics, 1(1):12–20.766
Faber, T. J., Jaishankar, A., and McKinley, G. H. (2016). Describing the firmness, springiness767
and rubberiness of food gels using fractional calculus. Part II: Measurements on semi-hard768
cheese. submitted to Food Hydrocolloids.769
Ferry, J. D. (1980). Viscoelastic properties of polymers. Wiley, New York.770
Foegeding, E. A., Brown, J., Drake, M., and Daubert, C. R. (2003). Sensory and mechanical771
aspects of cheese texture. International Dairy Journal, 13(8):585–591.772
Foegeding, E. A. and Davis, J. P. (2011). Food protein functionality: A comprehensive ap-773
proach. Food Hydrocolloids, 25(8):1853–1864.774
Foegeding, E. A. and Drake, M. A. (2007). Invited review: Sensory and mechanical properties775
of cheese texture. Journal of Dairy Science, 90(4):1611–1624.776
Foegeding, E. A., Vardhanabhuti, B., and Yang, X. (2011). Dairy systems. In Norton, I.,777
Pyropoulos, F., and Cox, P., editors, Practical Food Rheology: An Interpretive Approach,778
pages 133–172. Wiley-Blackwell.779
Friedman, H. H., Whitney, J. E., and Szczesniak, A. S. (1963). The texturometer - a new780
instrument for objective texture measurement. Journal of Food Science, 28(4):390–396.781
Friedrich, C., Schiessel, H., and Blumen, A. (1999). Constitutive behavior modeling and782
fractional derivatives. In Siginer, D. A., Kee De, D., and Chhabra, R. P., editors, Advances783
in the Flow and Rheology of NonNewtonian Fluids, volume 8 of Rheology Series, pages784
429–466. Elsevier.785
Funami, T., Ishihara, S., Nakauma, M., Kohyama, K., and Nishinari, K. (2012). Texture786
design for products using food hydrocolloids. Food Hydrocolloids, 26(2):412 – 420.787
25
Page 26
Gabriele, D., De Cindio, B., and D’Antona, P. (2001). A weak gel model for foods. Rheolog-788
ica Acta, 40(2):120–127.789
Gallegos, C., Franco, M. F., and Partal, P. (2004). Rheology of food dispersions. Rheology790
Reviews (British Society of Rheology), pages 19–65.791
Goh, S. M., Charalambides, M. N., and Williams, J. G. (2003). Mechanical properties and792
sensory texture assessment of cheeses. Journal of Texture Studies, 34(2):181–201.793
Harrington, J. C. and Morris, E. R. (2009). An unusual manifestation of phase separation in794
mixtures of disordered gelatin with konjac glucomannan. Food Hydrocolloids, 23(2):460–795
467.796
Hayakawa, F., Kazami, Y., Ishihara, S., Nakao, S., Nakauma, M., Funami, T., Nishinari, K.,797
and Kohyama, K. (2014). Characterization of eating difficulty by sensory evaluation of798
hydrocolloid gels. Food Hydrocolloids, 38:95–103.799
Herranz, B., Tovar, C. A., Solo-de Zaldvar, B., and Borderias, A. J. (2012). Effect of alkalis800
on konjac glucomannan gels for use as potential gelling agents in restructured seafood801
products. Food Hydrocolloids, 27(1):145–153.802
Heymans, N. and Bauwens, J.-C. (1994). Fractal rheological models and fractional differential803
equations for viscoelastic behavior. Rheologica Acta, 33(3):210–219.804
Hort, J. and Le Grys, G. (2000). Rheological models of cheddar cheese texture and their805
application to maturation. Journal of Texture Studies, 31(1):1–24.806
Hutchings, J. B. and Lillford, P. J. (1988). The perception of food texture - the philosophy of807
the breakdown path. Journal of Texture Studies, 19(2):103–115.808
Jaishankar, A. and McKinley, G. H. (2013). Power-law rheology in the bulk and at the in-809
terface: Quasi-properties and fractional constitutive equations. Proceedings of the Royal810
Society A: Mathematical, Physical and Engineering Sciences, 469(2149).811
Jaishankar, A. and McKinley, G. H. (2014). A fractional K-BKZ constitutive formulation812
for describing the nonlinear rheology of multiscale complex fluids. Journal of Rheology,813
58(6):1751–1788.814
Jousse, F. (2008). Modeling to improve the efficiency of product and process development.815
Comprehensive Reviews in Food Science and Food Safety, 7(1):175–181.816
Jowitt, R. (1974). The terminology of food texture. Journal of Texture Studies, 5(3):351–358.817
Kapsalis, J. G. and Moskowitz, H. R. (1978). Views on relating instrumental tests to sensory818
assessment of food texture - applications to product development and improvement. Journal819
of Texture Studies, 9(4):371–393.820
Koeller, R. C. (1984). Applications of fractional calculus to the theory of viscoelasticity.821
Journal of Applied Mechanics, Transactions ASME, 51(2):299–307.822
26
Page 27
Kollmannsberger, P. and Fabry, B. (2011). Linear and nonlinear rheology of living cells.823
Annual Review of Materials Research, 41:75–97.824
Korus, J., Witczak, M., Ziobro, R., and Juszczak, L. (2009). The impact of resistant starch on825
characteristics of gluten-free dough and bread. Food Hydrocolloids, 23(3):988–995.826
Leocmach, M., Perge, C., Divoux, T., and Manneville, S. (2014). Creep and fracture of a827
protein gel under stress. Physical Review Letters, 113:038303.828
Li Yuet Hee, L., Jacquot, M., Hardy, J., and Desobry, S. (2008). Formulating polymeric gels829
simulating soft cheeses’ texture. Food Hydrocolloids, 22(5):925–933.830
Liu, K., Stieger, M., van der Linden, E., and van de Velde, F. (2015). Fat droplet characteristics831
affect rheological, tribological and sensory properties of food gels. Food Hydrocolloids,832
44:244–259.833
Lorenzo, G., Zaritzky, N., and Califano, A. (2013). Rheological analysis of emulsion-filled834
gels based on high acyl gellan gum. Food Hydrocolloids, 30(2):672 – 680.835
Lucey, J. A., Johnson, M. E., and Horne, D. S. (2003). Perspectives on the basis of rheology836
and texture of cheese. Journal of Dairy Science, 86:2725–43.837
Luyten, H. (1988). The rheological and fracture properties of Gouda cheese. PhD thesis,838
Dairy Science, Wageningen University.839
Ma, L. and Barbosa-Canovas, G. V. (1996). Simulating viscoelastic properties of selected food840
gums and gum mixtures using a fractional derivative model. Journal of Texture Studies,841
27(3):307–325.842
Mainardi, F. (2010). Fractional Calculus and Waves in Linear Viscoelasticity: an Introduction843
to Mathematical Models. World Scientific Press.844
Mainardi, F. and Spada, G. (2011). Creep, relaxation and viscosity properties for basic frac-845
tional models in rheology. European Physical Journal: Special Topics, 193(1):133–160.846
Matos, M. E., Sanz, T., and Rosell, C. M. (2014). Establishing the function of proteins on the847
rheological and quality properties of rice based gluten free muffins. Food Hydrocolloids,848
35:150–158.849
Meng, Y. . C., Sun, M. . H., Fang, S., Chen, J., and Li, Y. . H. (2014). Effect of sucrose fatty850
acid esters on pasting, rheological properties and freeze-thaw stability of rice flour. Food851
Hydrocolloids, 40:64–70.852
Mezzenga, R. and Fischer, P. (2013). The self-assembly, aggregation and phase transitions of853
food protein systems in one, two and three dimensions. Reports on Progress in Physics,854
76(4).855
Mezzenga, R., Schurtenberger, P., Burbidge, A. S., and Michel, M. (2005). Understanding856
foods as soft materials. Nature Materials, 4(10):729–740.857
27
Page 28
Mohsenin, N. N. (1970). Application of engineering techniques to evaluation of texture of858
solid food materials. Journal of Texture Studies, 1(2):133–154.859
Moreira, R., Chenlo, F., and Torres, M. D. (2011). Rheology of commercial chestnut flour860
doughs incorporated with gelling agents. Food Hydrocolloids, 25(5):1361–1371.861
Muliawan, E. B. and Hatzikiriakos, S. G. (2007). Rheology of mozzarella cheese. Interna-862
tional Dairy Journal, 17(9):1063–1072.863
Ng, T. S.-K. and McKinley, G. H. (2008). Power law gels at finite strains: The nonlinear864
rheology of gluten gels. Journal of Rheology, 52(2):417–449.865
Norton, I. T. and Frith, W. J. (2001). Microstructure design in mixed biopolymer composites.866
Food Hydrocolloids, 15(4-6):543–553.867
Norton, I. T., Fryer, P., and Moore, S. (2006). Product/process integration in food manufac-868
ture: Engineering sustained health. AIChE Journal, 52(5):1632–1640.869
Nutting, P. G. (1921). A new general law of deformation. Journal of the Franklin Institute,870
191(5):679–685.871
Olivares, M. L., Zorrilla, S. E., and Rubiolo, A. C. (2009). Rheological properties of moz-872
zarella cheese determined by creep/recovery tests: Effect of sampling direction, test tem-873
perature and ripening time. Journal of Texture Studies, 40(3):300–318.874
Oliver, L., Scholten, E., and van Aken, G. A. (2015). Effect of fat hardness on large deforma-875
tion rheology of emulsion-filled gels. Food Hydrocolloids, 43:299–310.876
Peleg, M. (1980). Theoretical analysis of the relationship between mechanical hardness and877
its sensory assessment. Journal of Food Science, 45(5):1156–1160.878
Podlubny, I. (1999). Fractional Differential Equations. Academic Press.879
Purhagen, J. K., Sj, M. E., and Eliasson, A. . C. (2011). Starch affecting anti-staling agents and880
their function in freestanding and pan-baked bread. Food Hydrocolloids, 25(7):1656–1666.881
Reiner, M. (1971). Advanced Rheology. Lewis, London.882
Reiner, M. and Scott Blair, G. W. (1967). Rheological terminology. In Eirich, F. R., editor,883
Rheology - Theory and Application, volume 4, pages 461–488. Academic Press, New York.884
Renard, D., van de Velde, F., and Visschers, R. W. (2006). The gap between food gel structure,885
texture and perception. Food Hydrocolloids, 20(4):423–431.886
Ronda, F., Prez-Quirce, S., Angioloni, A., and Collar, C. (2013). Impact of viscous dietary887
fibres on the viscoelastic behaviour of gluten-free formulated rice doughs: A fundamental888
and empirical rheological approach. Food Hydrocolloids, 32(2):252–262.889
Sadowska, J., Bialobrzewski, I., Jelinski, T., and Markowski, M. (2009). Effect of fat con-890
tent and storage time on the rheological properties of Dutch-type cheese. Journal of Food891
Engineering, 94(3-4):254–259.892
28
Page 29
Sala, G., de Wijk, R., van de Velde, F., and van Aken, G. A. (2008). Matrix properties affect893
the sensory perception of emulsion-filled gels. Food Hydrocolloids, 22(3):353–363.894
Salvador, P., Toldra, M., Saguer, E., Carretero, C., and Pars, D. (2009). Microstructure-895
function relationships of heat-induced gels of porcine haemoglobin. Food Hydrocolloids,896
23(7):1654–1659.897
Sato, E. (2003). Effects of different kind of sesame materials on the physical properties of898
gomatofu (sesame tofu). Food Hydrocolloids, 17(6):901–906.899
Schiessel, H., Metzler, R., Blumen, A., and Nonnenmacher, T. F. (1995). Generalized vis-900
coelastic models: Their fractional equations with solutions. Journal of Physics A: General901
Physics, 28(23):6567–6584.902
Scott Blair, G. W. (1943). A new criterion for expressing the ‘intensity of firmness’ of soft903
bodies. Nature, 152(3858):412.904
Scott Blair, G. W. (1947). The role of psychophysics in rheology. Journal of Colloid Science,905
2(1):21–32.906
Scott Blair, G. W. (1958). Rheology in food research. Advances in Food Research, 8(C):1–61.907
Scott Blair, G. W. (1973). An extension of Reiner’s “Deborah Number” concept to a wide908
field of rheological investigations. Rheologica Acta, 12(2):319–320.909
Scott Blair, G. W. (1974). Psychorheology: Links between the past and the present. Journal910
of Texture Studies, 5(1):3–12.911
Scott Blair, G. W. and Burnett, J. (1959). On the creep, recovery, relaxation and elastic912
memory of some renneted milk gels. British Journal of Applied Physics, 10(1):15–20.913
Scott Blair, G. W. and Coppen, F. M. V. (1940a). 260. an objective measure of the consistency914
of cheese curd at the pitching point. Journal of Dairy Research, 11:187–195.915
Scott Blair, G. W. and Coppen, F. M. V. (1940b). 273. the consistency of cheese curd at the916
pitching point and its bearing on the firmness and quality of the finished cheese. Journal of917
Dairy Research, 12:44–54.918
Scott Blair, G. W. and Coppen, F. M. V. (1940c). Subjective judgments of ‘firmness’ in elastic919
and viscous materials. Nature, 145(3672):425–426.920
Scott Blair, G. W. and Coppen, F. M. V. (1942). The subjective conception of the firmness of921
soft materials. American Journal of Psychology, 55:215–229.922
Scott Blair, G. W., Veinoglou, B. C., and Caffyn, J. E. (1947). Limitations of the Newtonian923
time scale in relation to non-equilibrium rheological states and a theory of quasi-properties.924
Proceedings of the Royal Society of London. Series A, Mathematical and physical sciences,925
189(1016):69–87.926
Shama, F. and Sherman, P. (1973). Evaluation of some textural properties of foods with the927
29
Page 30
Instron universal testing machine. Journal of Texture Studies, 4(3):344–352.928
Sollich, P., Lequeux, F., Hbraud, P., and Cates, M. E. (1997). Rheology of soft glassy materi-929
als. Physical Review Letters, 78(10):2020–2023.930
Stokes, J. R., Boehm, M. W., and Baier, S. K. (2013). Oral processing, texture and mouthfeel:931
From rheology to tribology and beyond. Current Opinion in Colloid and Interface Science,932
18(4):349–359.933
Stokes, J. R. and Frith, W. J. (2008). Rheology of gelling and yielding soft matter systems.934
Soft Matter, 4(6):1133–1140.935
Subramanian, R. and Gunasekaran, S. (1997). Small amplitude oscillatory shear studies on936
mozzarella cheese part II. Relaxation spectrum. Journal of Texture Studies, 28(6):643–656.937
Subramanian, R., Muthukumarappan, K., and Gunasekaran, S. (2006). Linear viscoelastic938
properties of regular- and reduced-fat pasteurized process cheese during heating and cool-939
ing. International Journal of Food Properties, 9(3):377–393.940
Suki, B., Barabasi, A. . L., and Lutchen, K. R. (1994). Lung tissue viscoelasticity: A math-941
ematical framework and its molecular basis. Journal of Applied Physiology, 76(6):2749–942
2759.943
Surguladze, T. A. (2002). On certain applications of fractional calculus to viscoelasticity.944
Journal of Mathematical Sciences, 112(5):4517–4557.945
Szczesniak, A. S. (1963a). Classification of textural characteristics. Journal of Food Science,946
28(4):385–389.947
Szczesniak, A. S. (1963b). Objective measurements of food texture. Journal of Food Science,948
28(4):410–420.949
Szczesniak, A. S. (2002). Texture is a sensory property. Food Quality and Preference,950
13(4):215–225.951
Szczesniak, A. S. and Bourne, M. C. (1969). Sensory evaluation of food firmness. Journal of952
Texture Studies, 1(1):52–64.953
Torvik, P. J. and Bagley, R. L. (1984). On the appearance of the fractional derivative in the954
behavior of real materials. Journal of Applied Mechanics, Transactions ASME, 51(2):294–955
298.956
Tschoegl, N. W. (1989). The Phenomenological Theory of Linear Viscoelastic Behavior.957
Springer-Verlag.958
Ubbink, J., Burbidge, A., and Mezzenga, R. (2008). Food structure and functionality: A soft959
matter perspective. Soft Matter, 4(8):1569–1581.960
Van der Sman, R. G. M. and Van der Goot, A. J. (2009). The science of food structuring. Soft961
Matter, 5(3):501–510.962
30
Page 31
van Vliet, T. (1991). Terminology to be used in cheese rheology. In Walstra, P. and van Vliet,963
T., editors, Bulletin of the International Dairy Federation, pages 5–15. International Dairy964
Federation.965
Venugopal, V. and Muthukumarappan, K. (2001). Stress relaxation characteristics of cheddar966
cheese. International Journal of Food Properties, 4(3):469–484.967
Winter, H. H. and Mours, M. (1997). Rheology of polymers near liquid-solid transitions.968
Advances in Polymer Science, 134:164–234.969
Xu, Z. and Chen, W. (2013). A fractional-order model on new experiments of linear viscoelas-970
tic creep of Hami Melon. Computers and Mathematics with Applications, 66(5):677–681.971
Yates, M. D. and Drake, M. A. (2007). Texture properties of Gouda cheese. Journal of Sensory972
Studies, 22(5):493–506.973
Zhou, N. and Mulvaney, S. J. (1998). The effect of milk fat, the ratio of casein to water, and974
temperature on the viscoelastic properties of rennet casein gels. Journal of Dairy Science,975
81(10):2561–2571.976
31
Page 32
List of Figures977
1 Three methods of assessing the firmness, springiness, and rubberiness of cheese:978
(a) with human senses using touch (mouth or hands) or sight (eyes) or (b,c)979
with rheological measurements. (b) Monotonic uniaxial compression is the980
most commonly used test protocol but involves complex kinematics: non-981
linear viscoelastoplasticity and fracture. In this paper we use (c) creep / recovery982
in simple shear to quantify firmness springiness, and rubberiness in the linear983
viscoelastic limit. . . . . . . . . . . . . . . . . . . . . . . . . . . . . . . . . 34984
2 (a) Schematic representation of the springpot, a mechanical element defined985
by the quasi-property G and the power-law exponent β, which we call the986
fractional exponent (adapted from Jaishankar and McKinley (2013)). For a987
material characterized by a single power-law only one element is needed to988
capture its linear viscoelastic response, we call this the Scott Blair model (SB).989
The arrows demonstrate how the springpot interpolates between a Newtonian990
dashpot with viscosity η (β = 1) and a Hookean spring with modulus G991
(β = 0). The corresponding constitutive equations are given below each992
element. (b) Mechanical analogue of the Fractional Maxwell Model (FMM)993
constructed from two springpots. The FMM has four material parameters:994
two quasi-properties (G and V) and two fractional exponents (β and α). . . . 35995
3 (a) Creep / recovery curves of two hypothetical materials A (red) and B (blue)996
with identical firmness and different springiness and rubberiness. Specific val-997
ues of the compliance for each material indicated with filled markers are used998
to calculate firmness F, (squares), springiness S , (triangles), and rubberiness999
R, (circles). Their corresponding times of observations, t f , ts and tr are plotted1000
as hollow markers on the time-axis. We define the elapsed time of recovery as1001
∆t = t− t f (black dashed line). Firmness is the inverse of the maximal creep1002
compliance max {J(t)} and thus has units of Pa. Springiness has units of (Pa1003
s)−1 and is defined as the secant rate of recovery just after the stress is removed1004
at t = t f + ∆ts, where ∆ts << t f . For each material, the dashed, colored, se-1005
cant line goes through the correspondingly colored filled square and triangle.1006
The absolute magnitude of the slope of the secant is equal to the springiness1007
S . Rubberiness is defined as the relative extent to which the compliance re-1008
covers from the stress applied. If J(t) = 0 Pa at t = tr then the rubberiness1009
R = 1. We have chosen tr such that ∆tr >> ∆ts. Material A (red) is more1010
springy and more rubbery than material B (blue). (b) The same experiment as1011
in (a) but now plotted on a log-log scale, without the recovery phase and with1012
the creep phase extrapolated (dashed line). The plot shows that A and B are1013
power-law materials: J(t) ∝ tβ, where β is the power-law exponent. This plot1014
emphasizes the importance of controlling and reporting time when assessing1015
firmness: only at t f are the two materials equally firm, before or after this1016
point the material with the lowest compliance is the firmest. In the text we1017
also demonstrate that the magnitude of the springiness and firmness are also1018
dependent on the time of observation chosen. . . . . . . . . . . . . . . . . . 361019
32
Page 33
4 Effect of measurement time on the values of (a) springiness and (b) rubberi-1020
ness. The colors represent the two hypothetical materials A (red) and B (blue)1021
from Fig. 3. The solid and dashed line represent a time t f for measuring firm-1022
ness of t f = 10 s and t f = 106 s respectively. The springiness S and rubberiness1023
R, are functions of both t f , and the elapsed time of recovery ∆t at which we1024
calculate S and R. The markers denote the elapsed recovery times we have1025
chosen to calculate springiness, ∆ts= 0.1 s (triangles in (a)) and rubberiness,1026
∆tr= 10 s (circles in (b) ). Our choice of ∆ts<< t f makes the springiness S1027
independent of the time for measuring firmness t f . Our choice of ∆ts<< ∆tr1028
makes springiness and rubberiness two distinct properties. . . . . . . . . . . 371029
5 (a) Determining the quasi-property G and fractional exponent β of zero-fat1030
cheese with a water/protein ratio w/p= 1.8 and a temperature of T = 10◦C.1031
The material parameters are obtained by fitting the Scott Blair model (SB,1032
black line) for the complex modulus, Eq. (25) to the storage and loss mod-1033
ulus measurements {G′(ω),G′′(ω)} (filled and unfilled symbols respectively).1034
The SB model gives a good fit demonstrating that the relaxation behaviour1035
of cheese is well described by a single power-law over frequencies 1 ≤ ω ≤1036
100 rad s−1. Inset: phase angle as a function of the frequency. (b) Creep /1037
recovery experiment (σ0 = 100 Pa) of zero-fat cheese at T = 10◦C. Dashed1038
line: prediction of the compliance J(t) during creep and recovery using the1039
Scott Blair element, Eq. (10) and Eq. (13), with t f = 10 s and ∆tr = 10 s, and1040
the material properties from the fit in (a). The hollow symbols are the specific1041
points from the predicted creep / recovery curve which are used to calculate1042
the firmness F, (square), springiness S , (triangle), and rubberiness R, (circle).1043
(c,d) Same experiment and predictions as in (b) plotted on a log-log scale and1044
with the creep phase (c) and the recovery phase (d) separated. (d) The com-1045
pliance ultimately approaches zero, as predicted from Eq. (20). These plots1046
demonstrate that our equations correctly predict the firmness, springiness, and1047
rubberiness of power-law materials such as cheese, from the two constitutive1048
parameters G and β describing the material. . . . . . . . . . . . . . . . . . . 381049
6 Contour plots of the magnitude of the firmness F, Eq. (12), and the springi-1050
ness S , Eq. (16), of power-law materials such as cheese. The magnitude of1051
the firmness and springiness are functions of the quasi-property G and frac-1052
tional exponent β describing the material. The times of observation t f and ∆ts1053
at which the firmness and springiness are measured are indicated above each1054
plot. The scale bars and contour lines are spaced logarithmiccally. The ma-1055
terial properties of the hypothetical materials A and B from Fig. 3 and Fig. 41056
are mapped onto each contour plot as red and blue markers respectively. (a)1057
At t f = 10 s, materials A and B are equally firm and the iso-firmness lines are1058
close to horizontal, meaning the firmness F is dominated by the magnitude of1059
the quasi-property G. (b) At t f = 106 s, the iso-firmness lines are inclined to1060
be almost vertical and the magnitude of the fractional exponent β dominates1061
the magnitude of the firmness F. For times t f>10 s, material A is firmer than1062
material B, which corresponds to what we have depicted in Fig. 3(b). (c,d)1063
Springiness is hardly affected by the value of t f . All iso-springiness lines1064
slope downwards as the exponent β increases. For materials with equal frac-1065
tional exponent β, the material with the smallest value of the quasi-property1066
G is the most springy. . . . . . . . . . . . . . . . . . . . . . . . . . . . . . . 391067
33
Page 34
At rest, t<0 At rest, t<0
Shear stress suddenly removed
Constant shear stress applied
(b) Uniaxial compression (c) Simple Shear (a) Human senses
σt = σ0
σ = 0
Creep, 0 < t < tcreep
Recovery, tcreep < t < trecover
γ = 0
γt= xt / y0
γt = (xtcreep-xt) / y0
σt = 0x
x
y0
y0
y0
x0
Touch - hands
Sight - eyes
Constant neg. strain rate appliedLoad, 0 < t < tload
y
εt = -ln(x/x0)
σt = NF / (πy2) x
Constant pos. strain rate appliedUnload, tload < t < tunload
ε=ε0• •
y0
x0
ε=0, NF=0•
y
εt = -ln(x/x0) = ε0t σt = -NF / (πy2)
•
x
ε=-ε0••
Touch - mouth
Figure 1: Three methods of assessing the firmness, springiness, and rubberiness of cheese: (a) with human sensesusing touch (mouth or hands) or sight (eyes) or (b,c) with rheological measurements. (b) Monotonic uniaxial com-pression is the most commonly used test protocol but involves complex kinematics: non-linear viscoelastoplasticityand fracture. In this paper we use (c) creep / recovery in simple shear to quantify firmness springiness, and rubberi-ness in the linear viscoelastic limit.
34
Page 35
1 0 ,
,
1 0 ,
,
(a) (b)
Figure 2: (a) Schematic representation of the springpot, a mechanical element defined by the quasi-property G andthe power-law exponent β, which we call the fractional exponent (adapted from Jaishankar and McKinley (2013)).For a material characterized by a single power-law only one element is needed to capture its linear viscoelasticresponse, we call this the Scott Blair model (SB). The arrows demonstrate how the springpot interpolates betweena Newtonian dashpot with viscosity η (β = 1) and a Hookean spring with modulus G (β = 0). The correspondingconstitutive equations are given below each element. (b) Mechanical analogue of the Fractional Maxwell Model(FMM) constructed from two springpots. The FMM has four material parameters: two quasi-properties (G and V)and two fractional exponents (β and α).
35
Page 36
0 2 4 6 8 10 12 14 16 18 20 220
0.20.40.60.8
11.21.41.61.8
2x 10
−5
∆t = t − tf
S
time, t [s]
com
plia
nce,
J(t
) [P
a−1 ]
B
B
A
A
10−2
10−1
100
101
102
10−6
10−5
10−4
β=0.2
β=0.7
tf
time, t [s]
com
plia
nce,
J(t
) [P
a−1 ]
A
B
(a) (b)
Figure 3: (a) Creep / recovery curves of two hypothetical materials A (red) and B (blue) with identical firmnessand different springiness and rubberiness. Specific values of the compliance for each material indicated with filledmarkers are used to calculate firmness F, (squares), springiness S , (triangles), and rubberiness R, (circles). Theircorresponding times of observations, t f , ts and tr are plotted as hollow markers on the time-axis. We define theelapsed time of recovery as ∆t = t− t f (black dashed line). Firmness is the inverse of the maximal creep compliancemax {J(t)} and thus has units of Pa. Springiness has units of (Pa s)−1 and is defined as the secant rate of recovery justafter the stress is removed at t = t f + ∆ts, where ∆ts << t f . For each material, the dashed, colored, secant line goesthrough the correspondingly colored filled square and triangle. The absolute magnitude of the slope of the secant isequal to the springiness S . Rubberiness is defined as the relative extent to which the compliance recovers from thestress applied. If J(t) = 0 Pa at t = tr then the rubberiness R = 1. We have chosen tr such that ∆tr >> ∆ts. Material A(red) is more springy and more rubbery than material B (blue). (b) The same experiment as in (a) but now plotted ona log-log scale, without the recovery phase and with the creep phase extrapolated (dashed line). The plot shows that Aand B are power-law materials: J(t) ∝ tβ, where β is the power-law exponent. This plot emphasizes the importance ofcontrolling and reporting time when assessing firmness: only at t f are the two materials equally firm, before or afterthis point the material with the lowest compliance is the firmest. In the text we also demonstrate that the magnitudeof the springiness and firmness are also dependent on the time of observation chosen.
36
Page 37
10−3
10−2
10−1
100
101
102
103
104
10−9
10−8
10−7
10−6
10−5
10−4
10−3
recovery time, ∆t [s]
sprin
gine
ss, S
[1/(
Pa
s)] A
B
10−3
10−2
10−1
100
101
102
103
104
00.10.20.30.40.50.60.70.80.9
1
recovery time, ∆t [s]
rubb
erin
ess,
R [−
]
A
AB
B
(a) Springiness (b) Rubberiness
Figure 4: Effect of measurement time on the values of (a) springiness and (b) rubberiness. The colors representthe two hypothetical materials A (red) and B (blue) from Fig. 3. The solid and dashed line represent a time t f formeasuring firmness of t f = 10 s and t f = 106 s respectively. The springiness S and rubberiness R, are functions ofboth t f , and the elapsed time of recovery ∆t at which we calculate S and R. The markers denote the elapsed recoverytimes we have chosen to calculate springiness, ∆ts= 0.1 s (triangles in (a)) and rubberiness, ∆tr= 10 s (circles in (b)). Our choice of ∆ts<< t f makes the springiness S independent of the time for measuring firmness t f . Our choice of∆ts<< ∆tr makes springiness and rubberiness two distinct properties.
37
Page 38
100
101
102
103
104
105
frequency, ω [rad/s]
str
ora
ge
& lo
ss m
od
ulu
s,
G’ &
G’’
[Pa
]
zero fat
fit10
010
110
20
0.2
0.4
0.6
ω [rad/s]
tan
δ [
−]
0 5 10 15 200
1
2
3
4
5x 10
−5
time , t [s]
com
plia
nce, J(t
) [1
/Pa]
prediction
(a) (b)
10−2
10−1
100
101
10−6
10−5
10−4
time, t [s]
co
mp
lian
ce
, J(t
) [1
/Pa
]
creep
11 12 15 2010
−6
10−5
10−4
time , t [s]
com
plia
nce, J(t
) [1
/Pa]
recovery
(c) (d)
Figure 5: (a) Determining the quasi-property G and fractional exponent β of zero-fat cheese with a water/proteinratio w/p= 1.8 and a temperature of T = 10◦C. The material parameters are obtained by fitting the Scott Blair model(SB, black line) for the complex modulus, Eq. (25) to the storage and loss modulus measurements {G′(ω),G′′(ω)}(filled and unfilled symbols respectively). The SB model gives a good fit demonstrating that the relaxation behaviourof cheese is well described by a single power-law over frequencies 1 ≤ ω ≤ 100 rad s−1. Inset: phase angle as afunction of the frequency. (b) Creep / recovery experiment (σ0 = 100 Pa) of zero-fat cheese at T = 10◦C. Dashedline: prediction of the compliance J(t) during creep and recovery using the Scott Blair element, Eq. (10) and Eq. (13),with t f = 10 s and ∆tr = 10 s, and the material properties from the fit in (a). The hollow symbols are the specificpoints from the predicted creep / recovery curve which are used to calculate the firmness F, (square), springinessS , (triangle), and rubberiness R, (circle). (c,d) Same experiment and predictions as in (b) plotted on a log-log scaleand with the creep phase (c) and the recovery phase (d) separated. (d) The compliance ultimately approaches zero,as predicted from Eq. (20). These plots demonstrate that our equations correctly predict the firmness, springiness,and rubberiness of power-law materials such as cheese, from the two constitutive parameters G and β describing thematerial.
38
Page 39
0 0.2 0.4 0.6 0.8 110
3
104
105
fractional exponent, β [−]
quas
i pro
pert
y,
[Pa
sβ]
log[Firmness], F [Pa]
−2
0
2
4
0 0.2 0.4 0.6 0.8 110
3
104
105
fractional exponent, β [−]
quas
i pro
pert
y,
[Pa
sβ]
log[Firmness], F [Pa]
−2
0
2
4
(a) Firmness, t f = 10 s (b) Firmness, t f = 106 s
0 0.2 0.4 0.6 0.8 110
3
104
105
fractional exponent, β [−]
quas
i pro
pert
y,
[Pa
sβ]
log[Springiness], S [1/(Pa s)]
−8
−7
−6
−5
−4
0 0.2 0.4 0.6 0.8 110
3
104
105
fractional exponent, β [−]
quas
i pro
pert
y,
[Pa
sβ]
log[Springiness], S [1/(Pa s)]
−8
−7
−6
−5
−4
(c) Springiness, t f = 10 s , ∆ts= 0.1 s (d) Springiness, t f = 106 s , ∆ts= 0.1 s
Figure 6: Contour plots of the magnitude of the firmness F, Eq. (12), and the springiness S , Eq. (16), of power-law materials such as cheese. The magnitude of the firmness and springiness are functions of the quasi-property Gand fractional exponent β describing the material. The times of observation t f and ∆ts at which the firmness andspringiness are measured are indicated above each plot. The scale bars and contour lines are spaced logarithmiccally.The material properties of the hypothetical materials A and B from Fig. 3 and Fig. 4 are mapped onto each contourplot as red and blue markers respectively. (a) At t f = 10 s, materials A and B are equally firm and the iso-firmness linesare close to horizontal, meaning the firmness F is dominated by the magnitude of the quasi-propertyG. (b) At t f = 106
s, the iso-firmness lines are inclined to be almost vertical and the magnitude of the fractional exponent β dominatesthe magnitude of the firmness F. For times t f>10 s, material A is firmer than material B, which corresponds to whatwe have depicted in Fig. 3(b). (c,d) Springiness is hardly affected by the value of t f . All iso-springiness lines slopedownwards as the exponent β increases. For materials with equal fractional exponent β, the material with the smallestvalue of the quasi-property G is the most springy.
39