Desertification and land degradation and their impact on natural ecosystems and food security Barron Joseph Orr Lead Scientist First meeting of the Structured Expert Dialogue Second Periodic Review (Session 2) 4 June 2021 | 16:00 – 18:00 (CET) SED2
Transcript
1
Desertification and land degradation and their impact on natural ecosystems
and food security
Barron Joseph OrrLead Scientist
First meeting of the Structured Expert Dialogue
Second Periodic Review (Session 2)
4 June 2021 | 16:00 – 18:00 (CET)
SED2
We are days away from the launch of the UN Decade on Ecosystem Restoration
2021-2030What has been committed by countries so far?
Global total of country restoration commitments:
› 765 million –1 billion hectares
› 115 countries
How many hectares?
3
The IPBES Global Assessment (2019) and the IPCC Special Report on Climate Change and Land (2019)
report that as much as 75% of the land area is
very significantly altered.
This is typically for agriculture and urban expansion (i.e., conversions to farmland and settlements).
(Slide: Courtesy , Prof. Dr.
Josef Settele, co-chair of
the Global IPBES
assessment)
Land transformation
(Slide: Courtesy, Prof. Dr. Josef Settele, co-chair of the Global IPBES assessment)
❑ Meeting the demand for food, feed, fibre and energy
❑ More food, energy and materials than ever before are now being supplied to people across distant regions
❑ Forests, wetlands and grasslands and savannas are paying the price
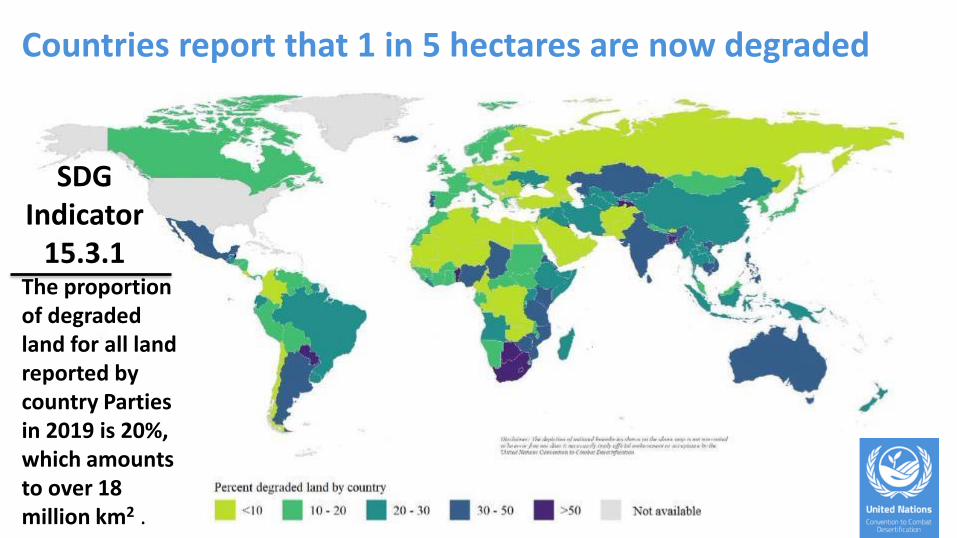
Countries report that 1 in 5 hectares are now degraded
The proportion of degraded land for all land reported by country Parties in 2019 is 20%, which amounts to over 18 million km2 .
SDG Indicator
15.3.1
The environmental emergencies are
intertwined
(Slide: Courtesy, Sir Robert Watson)
Climate Change and Land• Climate change exacerbates land degradation• Land degradation is a driver of climate change
through emissions of GHGs and reduced uptake of carbon
• Gross emissions from Agriculture, Forestry and Other Land Use make up 1/3 of total global emissions
• Land accounts for 61% of anthropogenic methane emissions.
• 50% of the nitrogen applied to agricultural land is not taken up by the crop, resulting in nitrous oxide emissions
https://www.ipcc.ch/report/srccl/
(Slide: Courtesy, Dr. Jim Skea, IPCC)
The impact is monumental• Wellbeing of over 3.2 billion people
undermined by land degradation• Biodiversity loss to reach 38–46%
by 2050. • The cost of ecosystem services lost
through land degradation is estimated at approximately 6 trillion USD per year or ar loss of more than 10% of the annual global gross product.
IPBES LDRA 2018 & ELD 2015
The tradeoffs• 1 million species are
threatened by extinction largely because 75% of the land surface has been altered
• These (negative) transformational changesare creating the conditions for a biological evolution so rapid, it is visible just over a few years.
IPBES 2019 Global Assessment Report on
Biodiversity and Ecosystem Services https://ipbes.net/global-assessment
Consumption eats land
“High and rising per capita consumption, amplified by continued population growth in many parts of the world, can drive unsustainable levels of agricultural expansion, natural resource and mineral extraction, and urbanization –typically leading to greater levels of land degradation,” (IPBES 2018)
Cre
dit
: Adri
ano
Gam
bar
ini/
WW
F B
razi
l
Source of data: WWF Living Planet Report 2020
Infographic: UNCCD Boosting Nature-Positive Production Action Guide 2021
Acute food insecurity soars to five-year high in 2020
An increase of 20 million people from last year, continuing the relentless rise in acute food insecurity since 2017.
The growingland footprint of cities
• More than 60% of the world’s irrigated croplands located near urban areas
• Urban expansion will consume 1.8-2.4% of global croplands by 2030
• Africa and Asia to experience 80% of the global cropland loss due to urban area expansion
• Slum settlements often located in areas of high environmental risk ; while worsening env. conditions in rural areas can increase unplanned peri-urban development
Source of text: Bren d’Amour et al. 2017
By
map
pin
g ci
tie
s la
rge
r th
an 3
00
,00
0 a
gain
st a
rid
ity
tre
nd
s, it
be
com
es
cle
ar t
hat
man
y o
f th
em
get
dri
er,
im
pac
tin
g 7
0%
of
the
wo
rld
’s u
rban
po
pu
lati
on
.
So
urc
e:
Fen
g a
nd
Fu
2013 a
nd
Rey
nold
s et
al.
2018
The world is getting drier where many people live – or will live
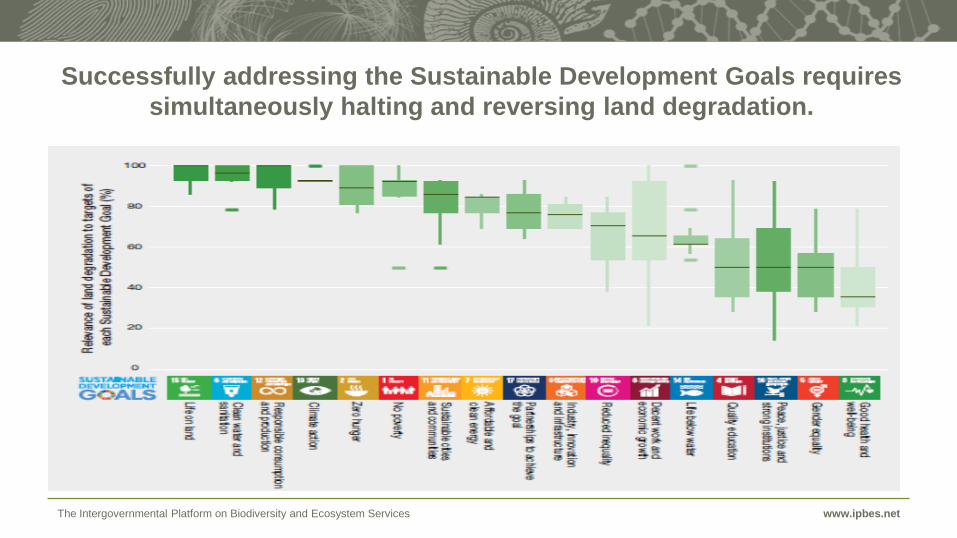
The Intergovernmental Platform on Biodiversity and Ecosystem Services www.ipbes.net
Successfully addressing the Sustainable Development Goals requires
simultaneously halting and reversing land degradation.
How do we build back better?
We need a positive
transformation, a
positive change in
the fundamental
attributes of natural
and human systems.
A balanced approach is needed.
• One that anticipates new degradation even as we plan to reverse past degradation
• One that considers tradeoffs among competing interests across the landscape
LDN provides the framework for this.
“A state whereby the amount and quality of land resources necessary to support ecosystem functions and services and enhance food security remain stable or increase within specified temporal and spatial scales and ecosystems”
UNCCD COP12 October 2015
Land Degradation Neutrality (LDN)
• LDN seeks to maintain natural capital and the ecosystem services that flow from it;
• LDN is about keeping land in balance;
• Keeping land in balance provides the basis for keeping food, water, carbon and biodiversity in balance as well;
• LDN is about achieving multiple benefits;
• LDN provides a framework with multiple entry points which facilitate optimizing the synergies among the Rio Conventions (Climate Change, Biodiversity, Land Degradation).
LDN planning (from target setting to territorial / spatial planning to integrated landscape management) involves anticipating where degradation is likely and modelling the tradeoffs among competing demands on land resources, location by location, so that the optimal mix of interventions across the landscape to achieve neutrality can be pursued.
Integrated land use
planning
Land Degradation Neutrality is about doing the right things in the right places at the right scale
Prevention is better than cure
Response Hierarchy
127 countries have
committed to set
LDN targets so far
104 of these have
completed setting
their LDN targets
70 of these have had
their targets formally
adopted by government
LDN targets set since 2017
450 M ha of ambition so far…
How can LDN and land restoration boost nature-positive food production?
Sneak preview to an action guide that will be launched at the upcoming Food Systems Summit.
27
28
LDN response actions for food security and sustainable agriculture
Pla
ce-b
ase
d a
pp
roac
h
The
rest
ora
tio
n p
ath
way
s to
a g
ree
n r
eco
very
Restoration scenario to estimate the potential global and regional benefits of large-scale restoration and prevention of further degradation
Stefan van der Esch, Elke Stehfest, Annelies Sewell, Jonathan Doelman, Michel Bakkenes, Ben ten Brink (all PBL), Luuk Fleskens, Jetse Stoorvogel (Wageningen University)
Can restoration deliver?Sneak preview of the PBL contribution to the forthcoming 2nd Edition of the Global Land Outlook
• For multiple functions: water, agriculture, biodiversity, carbon sequestration• In light of future changes to land use, land degradation and climate• Compared to current global and national ambitions for restoration
Expand to assumed Post2020 target of 30% plus effective
Conservation agriculture On degrading land / all cropland
Agriculture on slopes No agriculture expansion on slopes over x% incline
Agroforestry (cropland) On cropland in tropical and subtropicalzones with yields at <50% of max potential
Peatland protection No conversion of peatlands Agroforestry (livestock) On rangeland/pasture in tropical andsubtropical zones
Water-towers Areas with relatively high contribution to water regulation
Improved grazing On all rangeland/pasture
REDD / high carbon forests
No conversion of forests withcarbon stock > 100t/ha
Grassland improvement On pastures outside tropical andsubtropical zones
Riparian zones Areas close to rivers/streams Cross-slope barriers On cropland on slopes over x% incline
Reforestation and forest restoration
Degraded forests, reforestation
3535
Management (prevention and restoration):
• Agroforestry• Conservation
agriculture• Grazing and
grassland management
• Reforestation• Cross-slope barriers• Water management
Protect key areas:
• Biodiversity areas• High carbon forests• Peatlands• Water towers• Vulnerable
soils/slopes (high erosion risk)
• Riparian zones
Crop production
Grass and livestock
Carbon storage
Water
Biodiversity
Baseline: estimates on past and future changes
Restoration: Measures to protect areas for key functions and to improve land management
700 to 950 M ha total of current national ambitions, but where?
36
-
50,000,000
100,000,000
150,000,000
200,000,000
250,000,000
300,000,000
Hecta
res (
Ha)
Highest commitment per country
280 million ha
13 million ha
Mostly in developing countries
To what extent can we restore past loss of soil organic carbon and prevent future loss?
37
Situation in 2010
Projected change to 2050
Historic loss: most losses in agricultural production areas -> also most potential for restoration?
Changes in carbon stocks in vegetation and soil, 2015 - 2050
38
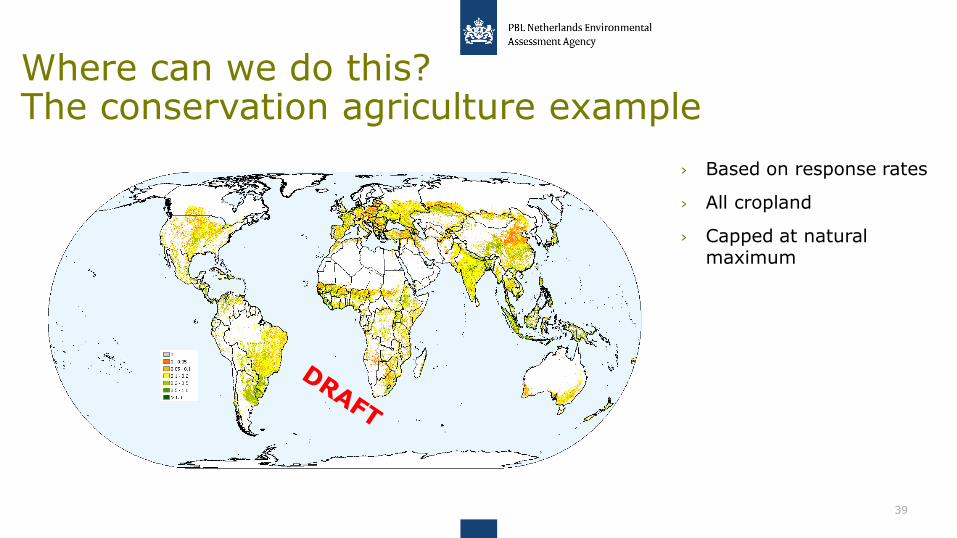
Where can we do this? The conservation agriculture example
39
› Based on response rates
› All cropland
› Capped at natural maximum
› The baseline scenario leads to a loss of about 60-70 Gt between 2015 and 2050, roughly equally divided between vegetation (27) and soils (32) and continued peatland emissions (10). This equals some 16% of current annual emissions.
› Compared against 2015, restoration leads to a 17 Gt increase by 2050. This is the effect of gains in soil carbon and reduced losses in vegetation carbon.
› This is why it is so important it is to include prevention when talking about restoration. If restoration prevents future loss, its real effect in carbon stored in soil and vegetation is much higher than 17 Gt.
Some take home messages the PBL work
40
Initiatives such as Land Degradation Neutrality, Nationally Determined Contributions (NDCs –Paris Agreement), National Biodiversity Strategies and Action Plans (NBSAPs) and the Bonn Challenge add up to global restoration commitments of 1 billion hectares.
Preventing, halting and reversing the
degradation of ecosystems worldwide.
Join #GenerationRestoration
The G20 Global Initiative on Reducing Land Degradation
and Enhancing Conservation of Terrestrial Ecosystems
• Launched by the G20 Leaders at the G20 Riyadh Summit, 21-22
November 2020 – discussed and developed in the Environment
Deputies meeting
• Aims to support existing efforts to prevent, halt, and reverse land
degradation and habitat loss
• Building on existing initiatives, G20 leaders share the ambition to
achieve a 50 percent reduction of degraded land by 2040, on a