6.1 Summary of the findings............................................................................................. 33
6.2 Is Council decision-making efficient? ........................................................................ 356.3 What would the Constitutional Treaty change?.......................................................... 36
6.4 Remaining issues to be explored in future research.................................................... 39
after the 2004 EnlargementSara Hagemann and Julia De Clerck-Sachsse*
1. Introduction
Each year the daily lives of European citizens are directly affected by several hundred pieces of
legislation adopted at the level of the European Union (EU). Of the three EU legislative actors –
the Council of Ministers, the European Commission and the European Parliament – it is the
former1
that acts as the main decision-making body and is often referred to as the ‘government
of the EU’. Due to the complexity and secrecy surrounding the decision-making processes of this institution, however, they have until recently been largely neglected as an area of rigorous
research within the field of EU politics. The last decade has seen an effort to create a more
transparent EU political system, including the decision to make voting records and minutes from
the Council meetings publicly available. It is therefore now possible for researchers to more
deeply analyse Council decision-making and to account more accurately for both its general
working processes and individual policy proposals.
This report analyses the impact of the 2004 enlargement on the functioning of the Council.
There are two reasons for why such a study is now particularly timely. First, enough time has
passed since the 1st
of May 2004 to allow us to have collected a sufficient body of quantitative
data on which to base evaluations, and thereby draw conclusions about not only individual
occurrences, but also about the general consequences of the expansion of the EU from 15 to 25(and now 27) member states. Drawing on an extensive data set and a large number of interviews
with senior officials, diplomats and other practitioners, this report investigates the 32 months
leading up to and following the enlargement, i.e. from September 2001 through December 2006.
The material collected for the analysis covers each piece of legislation adopted in the Council
over a period of more than 5 years. The aim is to provide a body of quantitative data that
illustrates some of the key changes that have occurred, and describe and analyse these findings
while also taking into account insights gleaned from interviews with the EU practitioners.
Although some consequences of the enlargement may only become apparent once more time
has passed, the data covering the elapsed time already allow for an in-depth analysis of many
important aspects of Council decision-making. At the same time, they can provide useful
indications of future developments.
Second, the evaluation undertaken in this report is relevant in the context of the revived debateon the need for institutional reform, most prominently expressed in relation to the proposed
Constitutional Treaty.2
A key argument in favour of the Constitutional Treaty in the conceptual
phase as well during the ongoing ratification process was – and still is – that without
* Sara Hagemann and Julia De Clerck-Sachsse are Associate Research Fellows at CEPS. Ms. De Clerck-
Sachsse also holds a research fellowship awarded by the Philippe Wiener-Maurice Anspach Foundation at
the Université Libre de Bruxelles (ULB), in the framework of her doctoral studies at Oxford University.1 Hereinafter referred to as ‘the Council’.2 In her speech to the European Parliament on 17 .January 2007, German Chancellor Angela Merkel
presented a working programme for the next 18 months, under the German, Portuguese and Slovenian
‘presidency trio’. The programme expresses an intention to find an answer to the constitutional impasse in
time for the summit on 21-22 June 2007.
8/7/2019 desicion-making in EU Council after enlargement
institutional reforms, an EU of 25 (and now 27) would face great difficulty in carrying out its
daily functions. However, contrary to these arguments, recent analyses by the European
Commission and external experts3
have found that the much-feared policy deadlock has not
occurred in the absence of extensive institutional reform. Legislation is still being adopted at arelatively impressive speed. But does this really mean that the Council is able to continue under
its current institutional set-up? This report examines the functioning of the Council before and
after the enlargement and suggests that certain issues need to be addressed. The results make it
clear that closer scrutiny of the actual work process at large, and of individual policy areas, is
necessary in order to provide an accurate and more nuanced account of the effects of the
enlargement.
1.1 Structure of the report
The report is divided into five sections. Following this introduction, the decision-making
processes in the Council are briefly outlined in section 2. Sections 3, 4 and 5 are more analytical
in nature and present the findings from our extensive data set and interviews and draw
conclusions. The sections are organised in the following manner: Having described the formal
decision rules and procedures, section 2 provides a brief discussion of the main findings from
the current literature regarding the implications of this formal setting for the actors involved.
Section 3 offers a comprehensive analysis of the general changes that can be observed in
Council decision-making in the years immediately leading up to and following the 2004
enlargement. Section 4 identifies and compares the behaviour of individual governments and
apparent coalition formations from the period before the enlargement to the years after. Section
5 investigates how specific policy areas have been affected by the enlargement. Each of the
sections consists of a number of sub-sections and the detailed outline for each of these is as
follows:
From section 2 it becomes evident that there is a pressing need for further analysis of decision-making processes in the Council, and that further quantitative material in particular is required
to advance the sparse knowledge about both the formal and informal internal processes.
Although a few valuable contributions have started to emerge from the current literature, issues
such as the implications of the institutional rules and procedures as well as major changes like
the 2004 enlargement have not yet been rigorously analysed based on statistical information.
This section summarises some of the existing findings and expectations found in the literature
with regard to who dominates decision-making in the Council, and why.
In section 3, which investigates some of the most general changes in the Council since the
enlargement, the results from both the quantitative analysis and the interviews with practitioners
make it clear that decision-making in a Union of 25 (and now 27) is not just a question of new
member states adapting. All member states have had to become accustomed to a new logic of negotiations as the working procedures have become more formalised and encompass a larger
and more heterogeneous set of interests. Reaching a consensus has become more cumbersome
since the enlargement and all governments have to come to terms with the fact that their
preferences over policy issues may in most cases not be fully satisfied as legislation is now
based on a different common denominator than was the case before enlargement. This part of
the analysis also draws on a large set of statistical information showing the changes in terms of
– amongst other issues – the amount of legislation adopted each year, the level of recorded
disagreement and the use of formal rules in adopting legislation. The data is analysed and
elaborated upon by extensive descriptions and explanations provided by the interviewees
directly involved in Council decision-making.
3 See European Commission (2006) and Mattila (2006).
8/7/2019 desicion-making in EU Council after enlargement
DECISION-MAKING IN THE COUNCIL OF MINISTERS AFTER THE 2004 ENLARGEMENT | 3
Section 4 reports on the level of disagreement recorded per individual member state and takes
into consideration not only whether there is a difference in patterns of behaviour between old
and new member states, but also whether the size of the population (big, medium and small
member states), the geographical location (North versus South, East versus West), or the factthat member states are either contributors or recipients of funds from the EU budget have an
impact on their behaviour in decision-making. In addition to identifying any such possible
patterns, the intention is to establish whether any changes occurred with regard to these issues
before or after the enlargement.
The fifth and final section of the report presents a range of descriptive statistics related to the
adoption of legislation within each policy field and how individual governments have used
voting, abstentions or formal statements to voice their disagreement with a policy proposal. This
section reports that there is great variance in the adoption rates and amount of recorded
disagreement across the policy areas, both in absolute and relative terms. It is also found that the
frequency with which the governments oppose a policy proposal varies from one policy area to
another. This latter point may seem rather obvious, but the findings make it clear that, forexample, although Germany and the UK are often thought to oppose the majority in the Council
on a relatively frequent basis, this tendency is only apparent in some policy areas and cannot be
detected in others at all. Hence, the results hence stress the need to distinguish between policy
areas when investigating both the general decision-making processes in the Council as well as
an individual government’s behaviour. Lastly, comparing the 32 months before and after the
enlargement, it becomes apparent that the enlargement has affected the different policy areas to
varying degrees. For example, those areas falling under QMV seem to be less affected with
regard to the quantity of legislation passed than those that remain under unanimity. Such results
clearly suggest that both normative/political and more ‘objective’ analyses of Council decision-
making have to consider the differences in content and quantity between policy areas; those
differences have important implications for both the pace of future integration as well as for the
question of whether a reform of the decision procedures is needed.
1.2 Methodology
The research behind this report has, as mentioned above, been conducted by combining
qualitative and quantitative analyses of the Council’s procedures. The quantitative material
consists of an extensive data set obtained from minutes from Council meetings and containing
information on all legislation adopted. The collection, coding and descriptive statistics of the
data set are discussed in detail in Appendix I. A range of advanced statistical methods and
geometrical scaling techniques are used for analysing this data. Although the models behind
these analytical tools have important implications for how the analysis is carried out, space
constraints prevent us from providing detailed explanations of the methods used in this report.
Short descriptions of the logic behind the models are provided where necessary, however, andclear references to full accounts of the models are cited for the interested reader.
As for the qualitative part of the analysis, we base our findings on 52 in-depth semi-structured
interviews with key figures in the European institutions, the permanent representations of the
member states (both old and new) as well as external policy experts. All of the interviews help
to clarify the explanations for some of the statistical results and have provided useful insights
into issues such as the differences in working methods and voting behaviour between the level
of the various working groups and that of COREPER, and between COREPER and the
ministerial level. Many issues related to ‘atmospheric changes’ since the enlargement – which
cannot be measured statistically – have also been elucidated by these sources, all of whom were
assured anonymity. No extensive conclusions are drawn exclusively on the basis of these
8/7/2019 desicion-making in EU Council after enlargement
DECISION-MAKING IN THE COUNCIL OF MINISTERS AFTER THE 2004 ENLARGEMENT | 5
2. Decision-Making in the Council: How is it done?
Decision-making in the Council is a complicated matter. This section outlines the main features
of the legislative processes in order to provide a general overview of the institutional framework within which the Council members act. Having described the institutional framework in this
section, a presentation and analysis of the results from the quantitative and qualitative
investigations not only become easier in the following sections, it also allows for a more
rigorous discussion of the findings without having to provide basic descriptions of the formal
set-up of the institution.
2.1 The Council formations
Following the Seville Conclusions in June 2002, the number of sectoral councils in the
European Council was reduced from 21 to 9.4
The reduction in Council formations has not led
to a similar reduction in policy areas or ministerial seats, and the Council meetings are still held
according to policy specialisation such that, for example, the ministers of environment meetindependently of ministers from other policy areas.
5The current Council formations are now
divided according to the following subjects:
• General Affairs and External Relations
• Economic and Financial Affairs
• Justice and Home Affairs
• Employment, Social Policy, Health and Consumer Affairs
• Competitiveness
• Transport, Telecommunications and Energy
• Agriculture and Fisheries
• Environment
• Education, Youth and Culture
Each Council formation has to adopt legislation according to a set of rules depending on the
legal basis of the policy proposal in question (see section 2.2 on Decision rules and procedures).
The Commission settles which of the decision-making procedures apply to a proposal before
presenting it to the Council for negotiations, based on the legal framework for the specific
policy field as stipulated in the treaties. When a policy proposal has been initiated and presented
to the Council, it is usually first discussed in specialised working groups where officials from
the member states and the Commission meet. Gradually, proposals advance through the
preparatory bodies closer to the Council. The most senior of the preparatory committees are the
Committees of Permanent Representatives (COREPER I and II) which send proposals to theCouncil as either ‘A’ or ‘B’ agenda points. In descriptions of Council decision-making (e.g.
Dinan, 1999; Hayes-Renshaw & Wallace, 2006; Sherrington, 2000; Van Schendelen, 1998) it
has been explained that at this stage ‘A’ points have normally already been agreed upon and are
4 The Trumpf & Piris (1999) report from the Council’s legal service formed the basis for what became the
Helsinki Conclusions of December 1999 and the Seville Conclusions of 2002. The conclusions stipulated
a number of ways to make the Council’s organisational structures more efficient, including the reduction
in the number of Council formations.5 For a recent analysis of the division into sectoral councils and the changes made since 2004, please
refer to Van Schaik et al. (2006).
8/7/2019 desicion-making in EU Council after enlargement
DECISION-MAKING IN THE COUNCIL OF MINISTERS AFTER THE 2004 ENLARGEMENT | 7
There are four different procedures under which legislation can be adopted in the EU. The main
procedure, which is called ‘co-decision’, stipulates that both the European Parliament and the
Council must agree on an identical text before a proposal can be adopted. Secondly, there is the
‘cooperation’ procedure, in which the European Parliament votes on proposed legislation andcan propose amendments, although the Parliament can also be overruled if the Council votes
unanimously to adopt a proposal. Thirdly, there is the ‘consultation’ procedure by which the
European Parliament can express its position on proposed legislation, but the Council is not
obliged to take its views into account. Finally, there is the ‘assent’ procedure, in which the EP
can accept or reject a proposal, but cannot propose any amendments. The latter is reserved for
issues concerning economic and social cohesion and Union membership.
Depending on which of these legislative procedures is followed, the Council may be presented
with a proposal and its various amendments several times during the process that leads to its
final adoption or rejection. For example, in the co-decision procedure, the Council may adopt a
common position before the proposal goes to the European Parliament7
for a next reading after
which it may return to the Council once again.8
The cooperation and consultation proceduresmay similarly include a few rounds of negotiations on the same proposal if an agreement is not
reached immediately. However, the extensive work undertaken by the preparatory bodies makes
this scenario rather rare.
Despite the complex voting system reflected in Table 1, the Council does not always vote in the
formal sense of raising hands. A proposal can be adopted by the chairperson when she or he
knows that there is a sufficient majority or unanimity in the Council. If the Council is not
unanimous, the chairperson takes into account the member states’ positions and simply counts
whether enough member states are on board to meet the threshold. In this way, it can be argued
that although the votes are not explicitly cast, decisions are still made in ‘the shadow of the
vote’ (Golub, 1999). One important difference between the unanimity and QMV systems must
be pointed out, however. When the decision rule is unanimity, abstentions are not counted as
‘no’ votes. This means that decisions can be made with few countries actually voting for the
proposal, if none of the countries actively opposes it. The opposite is true for QMV, where the
high threshold makes abstentions have the same effect as ‘no’ votes in practice. Furthermore, if
a proposal is accepted, members who wish to oppose, abstain or who have serious concerns
about the decision can record their views officially by making formal statements. Formal
statements are usually made immediately after a decision has been adopted, and are either
included directly in the minutes from the meetings or posted separately on the Council website.9
2.3 Implications of the formal rules and procedures for decision-makingin the Council
Almost every study of Council decision-making begins with the complaint that the large amountof legislation adopted by unanimity makes it difficult for outsiders to get a proper handle on the
institution. When a decision is adopted by unanimity, it is rare for any differences in interests or
positions in the Council to be recorded. Given that between 70 to 95% of all legislation adopted
by the Council is done so by unanimity (see Hayes-Renshaw & Wallace, 2006; Mattila, 2004),
the criticism is well grounded. However, as shown in the presentation of our results in the
following sections, more detailed information is increasingly included in the Council minutes,
7 Hereafter referred to as the ‘Parliament’.8 Please refer to http://www.consilium.europa.eu/uedocs/cmsUpload/code_EN.pdf for the formal
description of the co-decision procedure and to e.g. Hix (2005) for an explanation of the implications of
the co-decision procedure for the institutional balance in the EU.9 http://europa.eu/documents/eu_council/index_en.htm (accessed January 2007).
8/7/2019 desicion-making in EU Council after enlargement
and it is now possible to investigate several important aspects of the implications of the formal
rules and procedures for decision-making.
Three basic schools of thought can be found in the literature regarding the consequences of these formal structures for adopting legislation. The first of these is the view that the formal
rules lead to a dominant position by the big member states due to their greater voting power and,
hence, their political weight in negotiations (see e.g. Felsenthal & Machover, 1998, 2001). The
branch of researchers behind this argument often relies on voting power indices (Banzhaf, 1965;
Penrose, 1946; Shapley & Shubik, 1954), which are used to consider and calculate the
frequency with which each member state is in a pivotal position in voting outcomes across all
logically possible combinations of votes. A classic example that illustrates the importance of
applying considerations of voting power can be drawn from the first phase of the Council’s
history when Luxembourg with its one vote turns out to have had absolutely no formal influence
on decision-making. Since the threshold required to reach a decision was 12 votes during this
period, it was mathematically impossible for Luxembourg’s one vote to be decisive, despite the
disproportional representation of its population.10
No matter how the five other countries voted,their combined total would never be equal to 11 (cf. Brams & Affuso, 1985; Leech, 2002).
Similar situations are still possible, although perhaps in more complex versions, and politicians
and Council officials have paid much attention to the voting power indices when the distribution
of votes has been up for debate. The current German Presidency has even launched a ‘majority
calculator’, which can help to make quick estimations of various coalitions based on the voting
distribution.11
Still, little empirical evidence has been provided to test whether such calculations
also hold true in the actual negotiations.
Second, another branch of analysis that focuses on Council politics acknowledges the formal
rules and procedures as a constraining framework within which the Council members act.
However, they ascribe greater importance to the individual member states’ preferences and
policy positions when a majority has to be found. The argument is, in short, that a legislator will
only be willing to accept a policy change that moves the current policy to a point closer to her
preference point; any change that will satisfy the legislator’s preferences to a lesser degree than
the current policy position will make her worse off, and is hence unacceptable. In terms of the
decision process, this means that governments with similar preferences will join forces and seek
to manipulate a policy outcome that is acceptable to all members of the ‘coalition’. The
construction of a majority is indifferent to whether the possible coalition members are small,
medium or big member states, or share other characteristics. What is important is simply that
the members have similar preferences and can meet the majority threshold.
Third, a last group of analysts have emphasised the phenomenon of ‘corridor bargaining’ and
describe decision-making in the Council as an informal, yet still tough, negotiation process.
Some empirical findings have been provided by this group of scholars, and their main
conclusions have been that explicit voting on agreed decisions at ministerial level is rather rareand that when dissent is expressed, this is usually only by a single member state (Hayes-
Renshaw & Wallace, 2006:284). Ministers generally endorse collective decisions by consensus,
even in those cases where they could invoke qualified majority voting. Furthermore, when
disagreement does arise, it occurs in nearly half the cases related to ‘technical’ decisions, rather
than political issues. And to the extent that voting takes place, even this occurs implicitly rather
than explicitly, operates mostly at the level of officials rather than ministers and the result is not
recorded in any detailed or easily accessible form (Hayes-Renshaw & Wallace, 2006;
10 Luxembourg had one vote for all of its 310,000 citizens, whereas, for example, West Germany had one
vote for every 13,572,500 people.11 See http://www.bmwi.de/English/Navigation/EU-Council-Presidency/majority-calculator.html.
8/7/2019 desicion-making in EU Council after enlargement
DECISION-MAKING IN THE COUNCIL OF MINISTERS AFTER THE 2004 ENLARGEMENT | 9
Heisenberg, 2005). Therefore, it is argued, the Council can be understood only by analysing its
informal as well as its formal operations, and the over-simplification by many theoretical
accounts results in a neglect of the very reason why the complex Council system is even able to
function: ‘corridor bargaining’, dynamics within working groups and committees as well as theimportance of actors’ experience and personal negotiation skills must be qualitatively accounted
for.
The reality in the Council is probably a combination of all of the points above. The findings
presented in the next sections will address several of the issues, and we return to a discussion of
these at various points in the report. However, based on this very simplified and brief
description of the current debate, there is one underlying argument we wish to stress before
turning to the actual reporting and analysis of our findings. In our opinion, no one single
research approach can do justice to the extremely complex decision-making processes found in
the Council. No matter how much experience a practitioner placed in the Council may draw
upon in expressing his views and no matter how correctly collected and summarised a data set
may be, neither of these sources can separately provide an adequate and exhaustive account of the institution. In our view, that can only be achieved by a combination of qualitative and
quantitative methods. Inevitably, there are also limitations to studies that combine quantitative
and qualitative material, and we are far from arguing that we can present – or have the ambition
to present – a complete analysis of the Council’s current state of affairs. Rather, the intention is
merely to present data on selected key aspects of Council decision-making, and to analyse these
objective facts by also making comparisons with the explanations given in the interviews.
8/7/2019 desicion-making in EU Council after enlargement
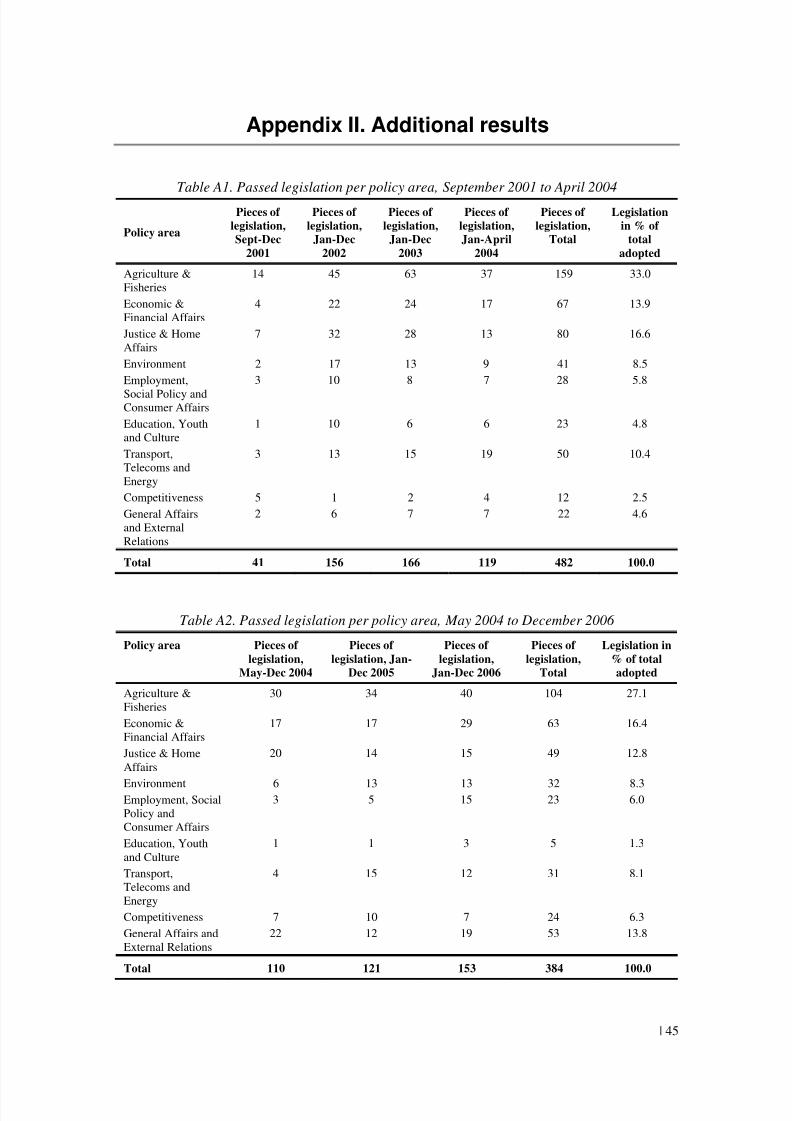
The table shows that the total amount of legislation passed each year saw a considerable
decrease in the (almost) two years immediately following the enlargement (May-December
2004 and January-December 2005). In 2006, however, the total adoption rate was almost ‘back to normal’ as it included 153 pieces of passed legislation, and hence reached nearly the same
level as in 2002 and 2003. Still, of the total of 872 pieces of legislation passed from September
2001 to December 2006, the largest proportion of these (512 acts) was adopted in the period
prior to the enlargement.
The year of the enlargement (2004) has been broken up in the table into two periods in order to
distinguish between the months before and after enlargement. While it appears that there was a
considerable amount of legislation passed just prior to May 2004, significantly less legislation
was passed in the remainder of the year, despite it being longer by several months. There are a
12 See section 2 for definitions. The distinction between the two is also discussed in more detail in this
same section below.
8/7/2019 desicion-making in EU Council after enlargement
DECISION-MAKING IN THE COUNCIL OF MINISTERS AFTER THE 2004 ENLARGEMENT | 11
number of possible explanations for this. First, it was argued in the interviews that logistical
considerations made it attractive to pass as much uncontroversial legislation as possible before
the enlargement in order to avoid the legal requirement of producing legislation in nine
additional languages. Second, and conversely to the previous argument, it has been suggestedthat a certain degree of legislative ‘preparation’ had to be done before the new member states
gained rights to exercise their legal influence. We return to this point in section 5 where we
investigate the enlargement’s impact on specific policy areas. However, the data does suggest
that the increased activity rate in the months leading up to the enlargement indeed falls within
areas such as Agriculture & Fisheries and Internal Market, in which the old members may have
had a particular interest in passing legislation due to the redistributive and economic nature of
these areas. Similarly, it should be noted that of the total of 360 proposals adopted in the years
after the enlargement, 43 of these entailed the reintroduction of existing legislation that needed
to be re-adopted in order to accommodate the new member states. A reduction in the total
adoption rate by 152 pieces (29.7%) can hence be observed between the 32 months before and
the 32 months after May 2004.
With regard to the legislative procedures, Table 2 shows a variation across the years in the
percentage of legislation passed under either the co-decision procedure or under other legislative
procedures (labelled ‘Not co-decision’ in the table). Whereas the period before the enlargement
has a relatively stable recorded percentage of between 32.4% and 36.2%, the years following
the enlargement jumps from 25.6% to 33.9% and then even further to include 40.5% as co-
decision legislation in 2006. Curiously, several interviewees voiced the assumption that co-
decision legislation accounts for around 50% of the legislation adopted by the Council each
year, although the figures in Table 2 do not fully correspond with these accounts. One
explanation may be that the interviewees’ experience is related to the fact that co-decision
legislation can at times require more work and more negotiation rounds. Still, what is interesting
from the results in the table is that the decrease in co-decision legislation immediately following
the enlargement has now developed into an increase that even exceeds the years prior to theenlargement. It will be interesting to see if this trend continues, and if it is related to the fact that
the passing of legislation becomes considerably easier under QMV than under unanimity in the
enlarged EU.
Closely related to the above point, Table 2 also reports on the application of either the
unanimity decision rule or QMV in the 2001-06 period. Legislation passed under unanimity saw
a considerable increase in the years 2003-05, and particularly so for 2003 and the first half of
2004. In 2006, however, the numbers decreased considerably compared to the preceding years,
and even though still a little higher than for the years 2001 and 2002, it now seems to be
approaching the former scale again. Evidently, an inverse development can be observed for
legislation adopted under QMV. The use of QMV decreased considerably in the years 2003 and
the first half of 2004, while gradually increasing to a level in 2006 that was only slightly lowerthan in the years 2001 and 2002. A number of interviewees have raised the point that decision-
making in areas falling under unanimity has been more affected by enlargement than in areas
where QMV is the rule. The observations from Table 2 regarding the use of the two decision
rules may therefore indicate that unanimity has been applied in the Council in the period
immediately following the enlargement due to the specific circumstances; the gradual increase
to a more frequent use of QMV may be more indicative of the future level of legislation adopted
by QMV.
There has been considerable debate in the current literature regarding the Council’s distinction
between ‘A’ and ‘B’ agenda points (e.g. Dinan, 1999; Hayes-Renshaw & Wallace, 2006;
Sherrington, 2000; Van Schendelen, 1998). As explained in section 2, ‘A’ agenda points are
usually presented as the less controversial items which have been prepared and agreed upon in
the preparatory bodies. They are therefore accepted without much discussion in the Council,
8/7/2019 desicion-making in EU Council after enlargement
whereas the more controversial agenda items are categorised as ‘B’ points (Moberg, 2002). The
current literature often points to this categorisation as evidence that Council decision-making is
now institutionalised to such a high level that officials and other representatives have become
agreement brokers, playing an equally important role as the ministers themselves. As aconsequence, it is argued, this leads to a lack of transparency and the Council is often presented
as a ‘Council of consensus’ rather than a ‘Council of conflict’ as the ministers always seem to
come to agreements with a super majority of members on board. Furthermore, some researchers
have interpreted the consistently low level of ‘B’ agenda points as a sign that there has been
little controversy in the Council after enlargement.
We wish to point out, however, that the records of ‘A’ and ‘B’ points on the Council’s agenda
do not in any way reflect the level of disagreement or bargaining at the ministerial level.
Although it is true that the intention behind the ‘A’ and ‘B’ points is to ease the workload at the
ministerial level and lower the need for bargaining and formal voting at the last stage of the
legislative process, one important aspect is missing from most analysis of this issue: ‘B’ points
are rarely adopted even when agreement has been achieved, and hence they are also notrecorded in the Council’s decision records. Rather, they are sent back for ministerial
negotiations after which they return to the table for adoption as ‘A’ points. Hence, the fact that
the results in Table 2 show an extremely low level of adoption of ‘B’ points throughout the
years (distinction between ‘A’ and ‘B’ accounting for 10% or less in most years) does not seem
to correspond with the importance ascribed to the points in the literature. What is more
surprising from the table is the fact that ‘B’ points have been adopted at all. Interestingly, a
number of interviewees suggested that one explanation may be an increasing appearance of
‘false’ ‘A’ and ‘B’ points. ‘A’ points may at times be more controversial than ‘B’ points, but are
still presented as ‘A’ points in order to avoid extensive discussions in the meetings (see section
4). As a result, the interviewees noted that the distinction in some cases becomes somewhat
counter-productive, as confusion arises with regard to which topics require the closest scrutiny.
3.2 Formalisation of meetings
Our findings from the interviews also portray a number of interesting changes regarding the
work processes of the Council which cannot be expressed by the statistical data. Of these
findings, ‘atmospheric’ changes received the most emphasis by the interviewees. On several
occasions it was explained that there is less of a ‘familiar’ tone both in COREPER and around
the ministerial table and that representatives often feel they have less latitude to negotiate due to
the formalisation of the meetings. In fact, many observed a decrease in the frequency of
negotiations, and one observer from the Council administration actually described the situation
as a “move towards an UN-style system”. A tendency towards reading out statements and
keeping to the formal procedures of negotiations has prevailed. As shown in section 4, these
changes to the procedural ‘codes’ are also reflected in the quantitative data on Councilmembers’ voting behaviour and the recorded levels of disagreement.
In support of the interpretation of the data in Table 2, all interviewees agreed that there was no
general crisis or breakdown of the Council’s decision-making processes. Legislation is still
adopted at an acceptable speed even after the significant increase in the number of
representatives around the table. This observation was voiced at the same time as it was noted
that the presence of more states with an ‘Anglo-Saxon’ way of thinking meant a presumption in
favour of less legislation and less regulation. As also explained above, together with the
Commission’s decision to introduce less legislation in order to devote more attention to
individual proposals, this could serve as a partial explanation to the decrease in legislation
observed for the years following May 2004. However, what is interesting about the figures in
Table 2 is that although the amount of legislation has in fact declined since May 2004, all of the
8/7/2019 desicion-making in EU Council after enlargement
DECISION-MAKING IN THE COUNCIL OF MINISTERS AFTER THE 2004 ENLARGEMENT | 13
practitioners interviewed from the old member states agreed that the workload has in fact
increased. It was stressed that this holds true for both the working group level of the decision-
making process all the way to the ministerial negotiations. For example, it was explained by an
official from a country that then held the presidency, that the construction of either a majority ora blocking minority has become harder simply because negotiations need to include more
member states. Both the Council meetings and those of the preparatory bodies also tend to last
considerably longer since the enlargement. This observation is confirmed in both the data and a
large number of the interviewees. These latter explained, however, that the most difficult point
in the process is usually not the working groups or the COREPER level, but rather the
ministerial negotiation table itself. Whereas the administration has indeed seen an increase in
the work load in many different respects, most of the interviewees found that the most difficult
task was not in the administrative part but rather in finding agreement between the political
representatives.
Additionally, several interviewees stated that finding a common position in a more
heterogeneous Council has led to a lower common denominator in terms of the level of regulation. The details of legislation have been affected due to the fact that more interests have
to be accommodated. Also, the larger number of people around the negotiation table means that
there is now less time to spend on individual policies. Such assertions are of course quite
controversial and difficult to support by quantitative material; still, it was explained that
although the adoption rate has declined, not even the current levels shown in Table 2 would
have been possible had there not been a general decrease in the degree of regulation in proposed
policies.
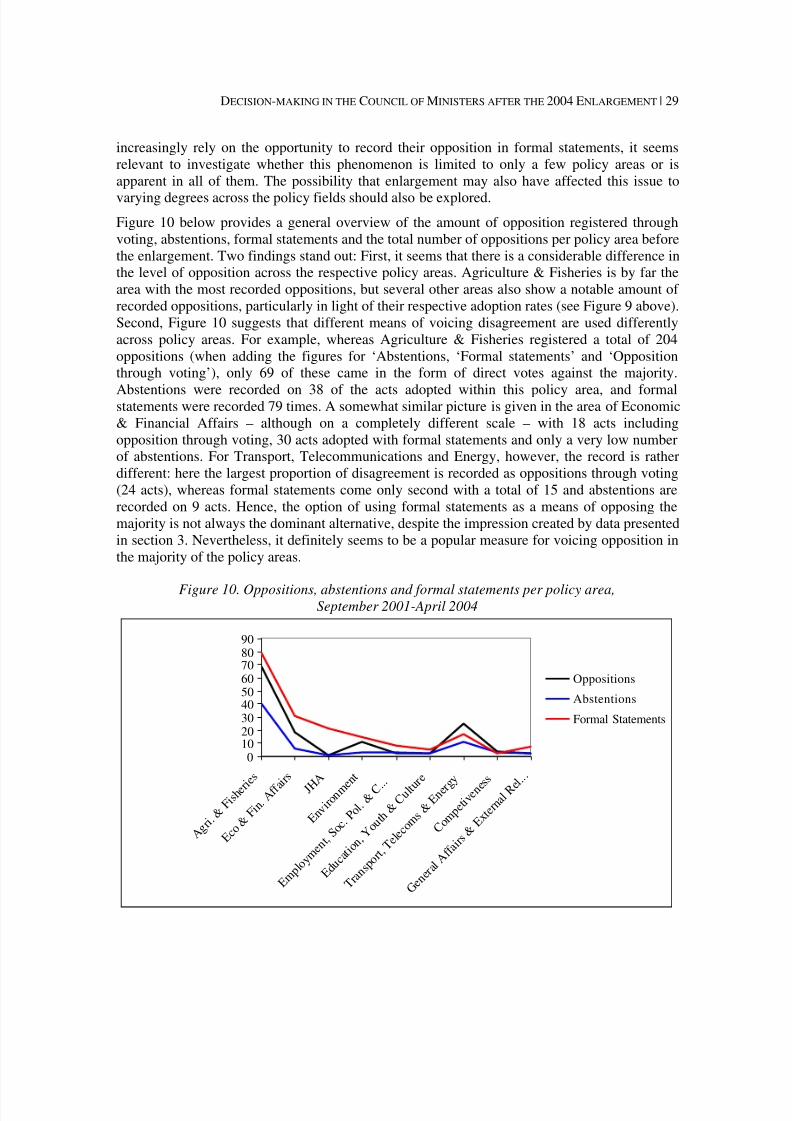
3.3 Changes in voting and recorded disagreement
Although the Council is famously known for its ‘culture of consensus’, the obvious challenges
with getting a 25-member Council to come to agreement could suggest that this may havechanged since May 2004. Also, the results above showed a steady increase in the use of QMV
after the enlargement. Since this enables a government to also voice its opposition in explicit
voting, it may well be that the level of recorded disagreement has changed dramatically. Table 3
presents the figures for the level of discord in the years prior to and following May 2004.
Table 3. Oppositions, abstentions and formal statements per year
Sept-Dec
2001
Jan-Dec
2002
Jan-Dec
2003
Jan-April
2004
May-Dec
2004
Jan-Dec
2005
Jan-Dec
2006
Total leg. passed 46 164 163 139 86 121 153
Contested 1a 16 29 36 11 9 13 34
%b
34.8 17.7 22.1 7.9 10.5 10.7 22.2Contested 2
c 14 53 69 46 19 52 69
%b 30.4 32.3 42.3 33.1 22.1 43.0 45.1
a Disagreement voiced through voting.b Percentage of legislation per year.c Disagreement voiced either through voting or formal statements; formal statements are included in the minutes
following the adoption of a proposal.
Interestingly, despite the major increase in the number of actors, Table 3 shows that the
recorded level of opposing votes has not increased at all since the enlargement. In fact, the part
of 2004 which included the 10 new member states (May-December 2004) and all of 2005 saw a
considerably lower percentage of legislation passed with opposing votes than any of the years
prior to enlargement (‘Contested 1’). In the 2004-05 period, the level was just below 11%,
8/7/2019 desicion-making in EU Council after enlargement
whereas 2001 had a recorded percentage of 26.8%, 2002 had a level of 18% and 2003 22%. So
although disagreement in the last year following the enlargement (2006) has increased to the
same level as it was prior to May 2004, the total level of recorded oppositions for all the years
since May 2004 is notably lower.
One important issue arising from the data, however, was also elaborated upon by some of the
interviewees and involves the possibility for Council members to make a formal statement
following the adoption of a proposal. These formal statements often consist of a country’s
explicit disagreement or reservation with regard to a policy. Formal statements are included in
the minutes of the Council meetings and allow the member states to make clear to internal and
external actors their opposition to either a small aspect or the full proposal. This may be done
even in cases when the country decided not to oppose the act through voting. It obviously
requires some explanation why governments would choose to record their position in this
manner but do not exercise their legal rights to oppose a given policy through voting. Hence, the
formal statements are taken into account in the row ‘Contested 2’.
The figures in the ‘Contested 2’ category suggest that the low level of opposition in voting afterthe enlargement may be attributable to an increased reliance on recorded positions in the form
of formal statements. The discrepancy between the level of disagreement voiced through voting
(‘Contested 1’) and the level taking into account both these voting and formal statements
(‘Contested 2’) has increased steadily since 2001, going from a difference of around 7
percentage points between the ‘Contested 1’ and Contested 2’ categories to more than a
doubling of the difference between the two in 2006. Or, to put it differently, Council members
have used formal statements to the same extent as voting to express their disagreement since the
enlargement. This finding, and the great importance we attribute to it, has been confirmed by
many interviewees, who see the origins of these changes in the difficulties with reaching
agreement in a 25-member Council. The formalised tone and structure that now characterise the
meetings and work culture have led to an emphasis on the formal statements instead of merely
voicing either concerns or opposition on a more casual basis. By relying on formal statements to
register their opposition instead of voting ‘no’, governments are also able to affect a sense of the
old culture of consensus without at the same time sending a political signal of having deviated
from their initial policy preferences.
While such behaviour may be an effective way to avoid policy gridlock through contested
voting, the use of formal statements in this manner also raises some important issues concerning
the transparency of the decision-making process as it becomes harder to identify where an
individual state stands on an issue. Nevertheless, it certainly appears from the data that
important changes have occurred not only with regard to how the ‘brokering’ of agreements
takes place, but also with how the member states choose to voice their position. The next section
further investigates how each individual government has behaved in the 2001-06 period on this
latter issue.
3.4 Individual government’s behaviour
Two different views have emanated from the interviews regarding the individual governments’
decisions to voice their position when a policy proposal is passed. One group of interviewees
argued that everything has mainly continued as ‘business as usual’, and that the new member
states are still adapting to the work in the institution. When this statement was further explored,
several of the practitioners explained that they expected the newer members to eventually begin
to act along the same lines as the ‘old’ 15. Conversely, another group of the interviewees stated
that, because of the significant changes in both the number of representatives, the working
environment and the general processes, all member states “have to learn a new game”. It was
8/7/2019 desicion-making in EU Council after enlargement
DECISION-MAKING IN THE COUNCIL OF MINISTERS AFTER THE 2004 ENLARGEMENT | 15
expressed that there is now “a strong feeling that we need more solidarity”, as well as that there
is “an increasing emphasis on the need for compromise and negotiation”.
In order to compare these experiences with the actual data for individual government’sbehaviour, and in this way establish whether there even is a distinction between the ‘old’ and
‘new’ members, we first need to determine whether any distinct patterns can be detected for the
period prior to the enlargement. If decision-making in those years were indeed dominated by the
large member states as suggested in the literature (see section 2), then we should also observe
the behaviour of new large members to be different from new small members, granted that those
same patterns simply continued after enlargement. On the other hand, if decision-making in the
Council is now a new game altogether, it may be that, for example, new members generally find
themselves outvoted more frequently than old member, or vice versa. Though, it may also be
that completely new alliances have emerged which have nothing to do with either the duration
of membership, the size of the countries or other commonly mentioned characteristics. In order
to compare the results from the period before the enlargement to the period after, Figure 1
below shows the level of recorded opposition per country from September 2001 to April 2004,either in the form of voting or expressed in a formal statement, which we can then later compare
to the period including the 10 new governments.
Figure 1. Oppositions per country before the enlargement
010
20
30
40
50
60
German
y
France UK
Italy
Spain
Nethe
rland
s
Greec
e
Belg i
um
Portu
g al
Sweden
Austria
Denm
ark
Finlan
d
Irelan
d
Luxembo
urg
Jan-April 2004
Jan-Dec 2003
Jan-Dec 2002
Sept-Dec 2001
Figure 1 has been organised according to Council members’ size (and hence voting weights). It
is immediately clear from the results that a country’s decision to oppose a proposal does not
entirely correlate with only this characteristic prior to enlargement. The large countries
positioned on the left-hand side of the figure have indeed opposed more in total than the smaller
ones on the right-hand side, but some countries deviate considerably from this trend. For
example, Denmark and Sweden have more frequently voiced opposition than several of themedium-sized members, and in terms of the total number of oppositions recorded from
September 2001 to April 2004, they did so even more than France and Italy. Also Portugal, as a
medium-sized member, seems to have registered opposition disproportionately more frequently
than either Belgium, Greece or the Netherlands, who wield the same voting power as Portugal.
Still, it can be concluded that some tendency is indicated in the table of more frequent
recordings of oppositions by the larger countries than by the smaller members.
Besides the total number of oppositions recorded per country, Figure 1 also reflects the
distribution of oppositions per year in the period leading up to the enlargement. This additional
distinction in the table makes it possible to establish, for example, that Denmark and Sweden
have not consistently opposed on the same occasions. A large proportion of Denmark’s
oppositions were recorded in 2003, whereas Sweden was more frequently in opposition in 2002.
8/7/2019 desicion-making in EU Council after enlargement
Similarly, it can be observed that Germany was in the opposition relatively few times in 2002,
compared to the number of times it voted against a proposal in 2003 or 2004; the latter years
show a stable rate of around 22 oppositions per year for this member. Lastly, it is interesting to
observe that although the United Kingdom opposed less than Germany in 2004, these twocountries seem to have stayed on a similar level of recorded oppositions throughout the other
years. Hence, the figures could suggest that the label of either being a Euro-sceptic or pro-
European government does not necessarily indicate how often a government finds itself
opposing policy proposals in the Council.
The following presentation of the same results, yet grouped into different categories, further
elaborates on which distinctions can actually be made with regard to a Council member’s
decision to oppose a proposal.
Figure 2. Oppositions for big, medium and small members,
September 2001-April 2004
0
10
20
30
40
50
60
70
Sept-Dec
2001
Jan-Dec
2002
Jan-Dec
2003
Jan-April
2004
Big
Medium
Small
Big: Germany, UK, France, Italy, Spain
Medium: Netherlands, Greece, Belgium, Portugal, Sweden
Elaborating on the above distinction between large and small countries’ behaviour in voting
situations, Figure 2 presents the findings for the September 2001-April 2004 period when
grouping the data into a group of the five largest, medium-sized and smallest members,respectively. The results are that in the period leading up to the enlargement, larger members
8/7/2019 desicion-making in EU Council after enlargement
DECISION-MAKING IN THE COUNCIL OF MINISTERS AFTER THE 2004 ENLARGEMENT | 17
more frequently recorded their oppositions to a proposal than either smaller or medium-sized
members did. Particularly the last years covered by the figure (2003 and 2004) show a
significant difference in the behaviour between the five largest members and the rest of the
Council. Interestingly, the medium-sized members and the smallest members showed almost nodifference in their numbers of recorded oppositions in the time immediately prior to the
enlargement (January-December 2003 and January-April 2004).
Turning to Figure 3, which presents the same data but grouped into oppositions according to
geographical location, the results from the data appear to contradict an assumption frequently
heard in the debates: The results do not show any consistent pattern of Northern members being
more frequent opposers than Southern members. In fact, the Southern members opposed the
most in 2002 and were in 2003 equally active on this account as the Northern members. The
Central European members, on the other hand, opposed more than both the Northern and the
Southern countries in the January-April 2004 period, but had a considerably lower number of
recorded oppositions in the previous years. In sum, a geographical distinction of the data does
not seem to substantiate the claim that either Northern or Southern members are more ‘difficult’members and frequently vote against the majority.
Other groupings such as ‘receivers vs. contributors’ or ‘pro- vs. sceptic EU members’ have also
been mentioned in both the political debates and in the literature, and the tables for these
groupings can be found in Appendix II. However, neither of these additional suggestions show
consistent trends, and will therefore not be further elaborated upon here. But it can be concluded
that a consistent pattern can be observed in the distinction between large, medium and small
members; the following will reveal whether this differentiation also holds after the enlargement.
Turning to the post May-2004 period, Figure 4 provides the same information as in Figure 1,
although here of course with the inclusion of the ten new member states. A first immediate
reading of the table makes it clear that the larger countries placed towards the left-hand side of
the table have in total opposed considerably more than the smaller countries placed towards theright. So this corresponds with the patterns from the pervious years. Yet, the figure also shows
that the reason for the large discrepancy between the small and big members is mostly due to
the larger countries’ high level of recorded oppositions in the May-December 2004 period (the
black sections of the columns). Both the sections of the columns covering the oppositions in
2005 and 2006 seem to have less of a clear differentiation between the large and the smaller
members, and it may therefore be that a distinction between small and large members from
before the enlargement does not continue to also cover the entire period after the expansion.
Figure 4. Opposition per country after the enlargement
0
2
4
6
8
10
12
German
y
France UK
ItalySp
ain
Polan
d
Netherl
ands
Greec
e
Belg i
um
Czech R
ep.
Portu
g al
Hung ary
Swed
en
Austria
Slovakia
Denm
ark
Finlan
d
Irelan
d
Lithu
ania
Latvi
a
Slovenia
Eston
ia
Cypru
s
Luxembo
urg
Malt
a
Jan-Dec 2006
Jan-Dec 2005
May-Dec 2004
8/7/2019 desicion-making in EU Council after enlargement
In order to establish whether this interpretation of the figure is indeed correct, Figures 5 and 6
group the findings into categories similarly as to what was presented above for the period before
the enlargement. In other words, Figures 5 and 6 group the data presented in Figure 4 into
categories according to the size of the Council members and according to their geographicallocation, respectively. Interestingly, the findings in both tables are rather contradictory to what
was expressed by those interviewees arguing that Council decision-making has continued more
or less like ‘business as usual’. For example, Figure 5 shows completely different results for the
difference between how small, medium and large members vote. Whereas the largest countries
almost consistently opposed more than both the medium and small members during the years
before enlargement, after the enlargement they only did so in the months of May-December
2004. 2005 and 2006 did not see any high level of opposition from the 6 largest countries. In
fact, the category of Council members which has been recorded most frequently as opposers in
these last years is the ‘Medium 1’ group, consisting of the Netherlands, Greece, Belgium, Czech
Republic, Portugal and Hungary. The ’Medium 2’ and ’Small’ groups have also seen an
increase in their number of oppositions in the last two years, but their increase has been more
gradual than that of the ’Medium 1’ group. Since the current representation has clearly
strengthened the number of medium and smaller members, these figures may not be entirely
surprising considering the new composition of the Council. Still, comments were made in
several of the interviews that Poland would also actively voice its disapproval of proposals. So
together with the dominant large members from prior to the enlargement, this group could still
be expected to have had a higher record of oppositions.
Figure 5. Oppositions for big, medium and small members,
May 2004-December 2006
0
5
10
15
2025
30
May-Dec 2004 Jan-Dec 2005 Jan-Dec 2006
Big
Medium 1
Medium 2
Small
Big: Germany, UK, France, Italy, Spain, Poland
Medium 1: Netherlands, Greece, Belgium, Czech Rep., Portugal, Hungary
Medium 2: Sweden, Austria, Slovakia, Denmark, Finland, Ireland, Lithuania
Small: Latvia, Slovenia, Estonia, Cyprus, Luxembourg, Malta
Distinguishing between the Council members based on a geographical division, Figure 6
furthermore establishes that there is still no consistent pattern of either Northern or Southern
members being the ones most in opposition, as is often heard in the political debates and the
literature. Our figures suggest, however, that the Central and Eastern European countries are the
most likely to record their oppositions, yet, the variation is still too large and the time period too
short to make any firm conclusions on this point. But dominance by the Northern or Southern
members is certainly not detectable with regard to this issue.
8/7/2019 desicion-making in EU Council after enlargement
Figure 7. Oppositions for new and old members, May 2004-December 2006
0
5
10
15
20
25
30
35
40
May-Dec 2004 Jan-Dec 2005 Jan-Dec 2006
Old
New
Lastly, yet perhaps most exciting in light of the current political debate, is the difference in
recorded oppositions between ‘old’ and ‘new’ members. Figure 7 reports on this division and
immediately makes it clear that an adaptation process for both the old and new members has
certainly influenced Council decision-making since the enlargement. Whereas the old members
had a much higher opposition rate in the period immediately following the expansion (May-
December 2004), their dominance has in this respect declined considerably in the following
years. At the same time, the new members have clearly adopted their behaviour as well, and,
particularly when considering that this category obviously consists of 5 fewer countries thanwhat is included in the group of ‘old’ members, it is interesting to see that in 2006 they were
almost at an equal level of recorded oppositions as the old members.13
This supports the thesis
voiced in the interviews that all countries have to learn a new ‘game’ rather than the new ones
simply adapting. In fact, Figure 7 shows that the old members have had made more adaptations
in their behaviour since the enlargement than have the new members. Contrary to expectations
previous to enlargement, the result for 2006 shows that a distinction between old and new
member states has all but become irrelevant.
13 As reported in section 3.4 concerning the oppositions registered in the period prior to enlargement, no
further patterns can be detected when making distinctions either between ‘receivers and contributors to
the EU budget’ or between ‘pro-EU or Eurosceptic’ members; please refer to Appendix II for apresentation of these results.
8/7/2019 desicion-making in EU Council after enlargement
The previous section gave a clear picture of the absolute figures for the governments’ behaviour
based on the level of opposition according to different groupings of the countries. However, the
data do not indicate whether some governments only oppose when certain other governments
also oppose, or if the voting is strictly of an ad hoc nature. In this section we look into how
many countries are actually recorded as opposing a proposal when legislation is contested and
whether these countries form explicit coalitions.
Table 4. Number of member states contesting legislation,
September 2001-April 2004
Number of member states Number of cases
1 35
2 23
3 14
4 9
5 1
6 0
> 7 0
Table 4 shows that, in the period leading up to the 2004 enlargement, 71% of the cases where
the majority was contested consisted of only one or two member states. Hence, the recorded
disagreement does not appear to reflect ‘majority vs. minority’ dynamics in the Council in this
period. In fact, from these figures it even appears unlikely that oppositions are voiced as real
attempts to hinder policies from being passed; a single or small number of opposing
governments are simply irrelevant for the adoption of legislation due to the high voting
threshold.14
So why do governments oppose the majority in the first place? The obvious answer in most
other democratic legislatures would be that a member records its opposition when its interests
are not satisfactorily met by a proposal. Since most policy solutions are not of a ‘Pareto-
efficient’ nature (i.e. not all members in the legislature will be better off from the adoption of
the decision), a certain percentage of legislators can always be expected to lose from the
decision being passed and hence will vote against. In the Council, however, according to one
practitioner interviewed, opposition is recorded ‘… to signal to the home governments that
efforts have been made to uphold a position although the legislation may be adopted regardless’.
This means that opposing votes do indicate the government’s dissent from the proposedlegislation in question. However, in a case where a proposal is of less salience to the national
government, a Council member may decide not to state its preferences even if these are clearly
not met by the legislation on the table. It would chose not to do so because being in opposition
means the government is excluded from the negotiations on the majority agreement which is
constructed and as the home governments may simply not pay attention whether their position
was upheld when the legislation is of little saliency. Consequently, the numbers in Table 4 are
most likely downwards biased and only reflect the ‘tip of the iceberg’ in terms of how much
disagreement over proposals is actually present in the Council negotiations. Still, our data cover
enough time and enough recorded positions to draw inferences about who decides to record their
14 Please refer to Table 1 for an overview of the distribution of votes and the QMV thresholds throughout
the Council’s history.
8/7/2019 desicion-making in EU Council after enlargement
DECISION-MAKING IN THE COUNCIL OF MINISTERS AFTER THE 2004 ENLARGEMENT | 21
oppositions when. This is in itself of great relevance in an evaluation of the impact of the 2004
enlargement.
The extremely low number of countries found to record the oppositions when legislation wascontested in the 2001-2004 period may have increased considerably with the inclusion of a large
number of new countries. Hence, Table 5 below reports the size of the contesting ‘coalitions’ in
the post-May 2004 Council. From these results it appears as if the vast majority of opposing
formations also consisted of one to three Council members in this period. Yet, at the same time
it should be noted that 20% of the coalitions consisted of four member states or more,
demonstrating that larger opposing coalitions do form in the current Council compared with the
time prior to May 2004. A real bargaining scenario with apparent blocs of divergent interests
may therefore be more apparent in the current Council than was the case in the EU of 15.
Table 5. Number of member states contesting legislation,
May 2004-December 2006
Number of member states Number of cases1 31
2 38
3 12
4 9
5 7
6 1
> 7 3
4.2 Who votes with whom?
Voting behaviour and the formation of coalitions indicate something about both the transactioncosts included in the bargaining and the ability of the national constituencies to hold their
governments accountable. For example, if coalitions are not stable over time and across a
number of policy areas, negotiations become more cumbersome and costly in terms of time,
resources and perhaps also policy impact. Furthermore, it is commonly acknowledged that
democratic legislative processes allow constituencies to hold legislators accountable for the day-
to-day politics of passing laws. Such accountability is normally ensured (at least in principle) by
having legislators who pass policies according to defined sets of policy platforms. Policy
platforms are made explicit in, for example, party manifestos and they serve as the basis for
legislators’ campaigns; the constituencies can then reward or punish their elected
representatives for how they pursue those.
Voting behaviour related to the adoption of new legislation is one method by which theconstituencies can ascertain whether politicians are behaving according to their stated political
objectives. Such argumentation is also relevant in the EU context, as the passing of legislation –
even in the enlarged EU – requires the member governments to take a stand on regulatory and
distributional policy issues. The mere scope of cooperation in many of the policy areas is
evidence that the EU member states are not just negotiating within an intergovernmental
construction. Hence, voting behaviour and coalition formations are issues that must be
adequately addressed and reported upon. Yet, these issues are not always politically innocent
and the relatively sparse insights into the Council meetings pose a problem for outsiders
attempting to investigate the topic. So far no final conclusion has therefore been drawn on the
Council’s coalition-formation processes. Even the various accounts provided by practitioners
over the last decade do not appear altogether aligned. It still remains to be concluded whether
the governments form stable coalitions over time and across policy areas or if negotiations are
8/7/2019 desicion-making in EU Council after enlargement
characterised by ad hoc groupings and more volatile preference configurations. Nevertheless, a
few trends are still commonly acknowledged as revealing the basic characteristics of how some
groups in the Council behave: as previously mentioned, large member states and northern
countries have been thought to dominate both in the negotiation rounds and in the actual votingscenarios (Mattila, 2004; Hayes-Renshaw & Wallace, 2006). A redistributive cleavage and a
grouping of free-market vs. regulatory members have also been identified in certain periods and
particularly within specific policy areas (Zimmer et al., 2005; Thomson et al., 2004). Lately, and
in the four-year period leading up to the 2004 enlargement, patterns of party political influence
have also been detected, suggesting that the Council’s composition of centre-left and centre-
right governments may additionally play a role for the overall legislative output (Hagemann,
2007).
In order to investigate whether the opposing coalitions reported in Table 5 reflect a stable
pattern in the voting behaviour, or if there is less certainty with regard to which member states
vote together, Figure 8 presents a spatial picture of the coalitions in the current Council. The
positioning of the countries in the figure are estimated based on the probabilistic, geometricalscaling method NOMINATE, which is a popular analytical tool for analyses of voting behaviour
in parliaments (Poole, 2005).15
NOMINATE simply ‘reads’ the individual government’s
position on every single piece of legislation covered by the data and compares it to the full set of
observations made about all the other governments’ positions. Based hereon it produces a
spatial ‘map’ of the governments’ observed –rather than estimated – behaviour. The picture
reflected in Figure 8 in this way indicates how often the governments vote together (or not)
across the full range of policy proposals analysed. In other words, the distance between two
Council members in the figure shows how similar their preferences are in terms of either
supporting or opposing the majority on each of the adopted acts. To give an example, it can be
deduced from Figure 8 that the Netherlands and Italy have not voted the same way on a number
of occasions, whereas Greece and Italy must have voted similarly on most occasions.
It should be explained here that since Figure 8 shows the observed behaviour, ‘Dimension 1’
and ‘Dimension 2’ do not serve the same purpose as the usual x- and y-axes in most graphs,
scatterplots or the like. Usually, these axes would be predefined categories with a set of values
along which the governments could then be measured. Here the dimensions are instead scales of
some sort of cleavages which must be interpreted according to how the actors are placed in the
picture. Or, to put it differently, the NOMINATE method reverses the analysis of the
governments’ positions: it provides the results of how they have behaved and presents these
estimations in a spatial picture like the one found above. It is then up to the reader of the picture
to deduct what causes these results. In national parliaments the positioning of the actors is
usually characterised by either socio-economic cleavages (i.e. the left/right dimension) or single
issue politics such as environment or perhaps religion (though, this is most prominent in the
US). In any case, the reason for the labels “Dimension 1’ and ‘Dimension 2’ is simply thatNOMINATE does not provide the interpretation of the axes, but merely uses ‘empty’ scales
ranging from -1 to 1 to position the governments along.
15 For similar analyses of behaviour in the European Parliament, see also Hix et al. (2007).
8/7/2019 desicion-making in EU Council after enlargement
DECISION-MAKING IN THE COUNCIL OF MINISTERS AFTER THE 2004 ENLARGEMENT | 23
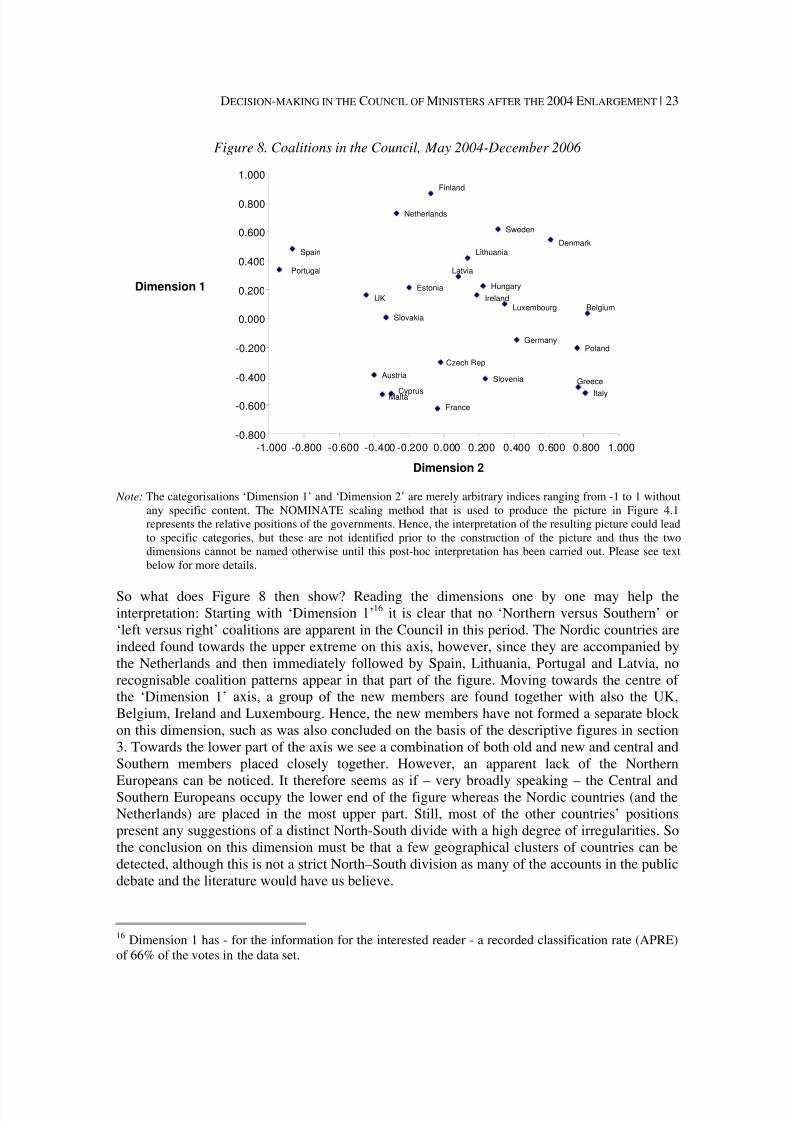
Figure 8. Coalitions in the Council, May 2004-December 2006
Note: The categorisations ‘Dimension 1’ and ‘Dimension 2’ are merely arbitrary indices ranging from -1 to 1 without
any specific content. The NOMINATE scaling method that is used to produce the picture in Figure 4.1
represents the relative positions of the governments. Hence, the interpretation of the resulting picture could lead
to specific categories, but these are not identified prior to the construction of the picture and thus the two
dimensions cannot be named otherwise until this post-hoc interpretation has been carried out. Please see text
below for more details.
So what does Figure 8 then show? Reading the dimensions one by one may help the
interpretation: Starting with ‘Dimension 1’16
it is clear that no ‘Northern versus Southern’ or
‘left versus right’ coalitions are apparent in the Council in this period. The Nordic countries are
indeed found towards the upper extreme on this axis, however, since they are accompanied by
the Netherlands and then immediately followed by Spain, Lithuania, Portugal and Latvia, no
recognisable coalition patterns appear in that part of the figure. Moving towards the centre of
the ‘Dimension 1’ axis, a group of the new members are found together with also the UK,
Belgium, Ireland and Luxembourg. Hence, the new members have not formed a separate block
on this dimension, such as was also concluded on the basis of the descriptive figures in section
3. Towards the lower part of the axis we see a combination of both old and new and central and
Southern members placed closely together. However, an apparent lack of the Northern
Europeans can be noticed. It therefore seems as if – very broadly speaking – the Central andSouthern Europeans occupy the lower end of the figure whereas the Nordic countries (and the
Netherlands) are placed in the most upper part. Still, most of the other countries’ positions
present any suggestions of a distinct North-South divide with a high degree of irregularities. So
the conclusion on this dimension must be that a few geographical clusters of countries can be
detected, although this is not a strict North–South division as many of the accounts in the public
debate and the literature would have us believe.
16 Dimension 1 has - for the information for the interested reader - a recorded classification rate (APRE)
‘Dimension 2’ does not provide much information on its own,17
and no permanent coalitions can
be detected along this dimension. Hence, turning instead to an overall reading of the picture
with the combined results of the two dimensions, the reading of ‘Dimension 1’ above seems to
gain slightly more support with regard to some countries’ geographical clustering. Thedistribution is certainly not complete, and the positions do not follow a North-South-East
division as could have been the result from a combined reading of the two axes. However, the
group of new member states grouped together in the middle – yet, accompanied by Ireland and
Luxembourg – does add somewhat to the picture of tendencies towards geographical alliances.
Still, Austria, Malta and Cyprus seem to form another small group just left of the centre in the
bottom part of the figure, while most of the remaining countries are scattered around in the
centre-right corner of the lower section.
In sum, it seems as if the inclusion of the 10 new member states has brought about interesting
dynamics in the Council in terms of voting behaviour and coalition formation of both the old
and new member states. Although there is some resemblance to a map of Europe in Figure 8 –
and therefore the appearance that some governments form alliances somewhat related to ageographical pattern – the positioning of the countries is not as clearly defined as in the time
prior to the 2004 enlargement by the accounts of any existing research (see section 2). On the
other hand, it would have been surprising if the old member states had been left unaffected in
their voting behaviour and if the new governments had simply taken up positions according to a
North-South divide, a North-South-East cleavage or even a party political configuration as
identified in the period preceding the enlargement. More time and a more established system
may be needed in order for such patterns to emerge, if at all. Yet, together with the above
findings regarding the individual governments’ level of recorded disagreement, it can be
concluded that ‘old vs. new’ blocs are certainly not apparent in the current Council.
4.3 The role of the Presidency, the Council’s General Secretariat and theCommission
A very important finding related to the above analysis of coalitions in the Council is that the
role of intermediary actors has increased considerably following the enlargement. This
conclusion is drawn on the basis of all of the interviews conducted for this study, as well as the
results presented in Table 6 below. The table shows the amount of legislation adopted at the 1st,
2nd
and 3rd
readings in the time prior to and following enlargement, and there is no doubt that the
increasing figures for 1st
reading adoptions also mean a greater reliance on the intermediary
actors as brokers of agreements. These actors are commonly considered to be the country
holding the Presidency, the Commission and the Council’s General Secretariat.
Particularly the Presidency is seen to have a much more important role now in preparing and co-
ordinating the negotiations, given the increased number of parties. The emphasis on this role isespecially apparent when taking into account the previously mentioned statements that a lot of
the negotiating work is already done before parties even enter the meeting room (see section 2).
It predominantly falls to the Presidency to find and co-ordinate policy positions prior to the
actual negotiations. One observer explains this: “Negotiations now take place elsewhere,
presidencies have bilateral contacts with people … it all happens but it happens in a much more
informal manner outside the meeting room, in bilateral or multilateral contacts… so the
presidency has to go round and hear all the major member states and actually push them to see
how far they will go and that helps to put together a compromise proposal… the bilaterals have,
in a way, become more important than the plenary sessions.”
17 The amount of votes estimated by this dimension is only an additional 11% when the first dimension
has been classified; see Appendix I for an explanation.
8/7/2019 desicion-making in EU Council after enlargement
DECISION-MAKING IN THE COUNCIL OF MINISTERS AFTER THE 2004 ENLARGEMENT | 25
Similarly, the Council Secretariat has become more important in its role as a coordinator and in
providing internal institutional support. Especially interviewees representing some of the
smaller and new member states indicated that to them the Secretariat has become and important
support in forming a policy position. A special section (referred to as the ‘dorsal’, or‘backbone’) with responsibility for Co-decision legislation was created even before the
enlargement and serves the purpose of coordinating and facilitating early agreements between
the Council and the Parliament. Several interviewees from the Secretariat expressed that such
facilities are now even more essential in order to ensure as smooth and efficient a legislative
process as possible.
The role of the Commission is an issue which the interviewees proved to have very different
views about. Some described the Commission as having gained considerably more influence
now that a need for more guidance and brokering between a larger set of interests is required.
Though, when investigating this argument, it appears as if such influence may not be apparent
in the ministerial meetings, but rather takes place in between the meetings when policies have to
be formulated and compromises have to be found. However, other practitioners have pointedout that this role has been attributed to the Commission for a considerable amount of time,
particularly for areas falling under QMV. It has not been possible to explore or support either of
these points in greater detail for the purpose of this report, however, there is certainly a need -
and fortunately also available data – for a further study of the Commission. Still, it should here
be noted that the policy output from the Council is obviously linked to both the administrative
and political agenda of the Commission. One very apparent point which illustrates this
dependency on the Commission is its recent strategy of introducing less legislation with the
intention of dedicating more rigorous attention to the individual proposals. That the
Commission has a mandate to make such a decision reflects the fact that this institution
certainly plays a role for the decision-making and internal processes in the Council.
Table 6. Legislation passed at Council’s 1st , 2nd and 3rd reading
Jan 2001-April 2004 May 2004 - Dec 2006
Total co-decision 169 125
1st reading 52 71
% 30.7 56.8
2nd reading 92 50
% 54.4 40.0
3rd reading 25 4
% 14.8 3.2
A last remark on the role of the intermediary actors is that both the figures reported in Table 6and the statements made by the interviewees stress that the legislative process has not been
prolonged after the enlargement with regard to the number of readings required. According to
one inside observer this is the case especially due to an increasing tendency by the Presidency to
push for adoption of legislation at the first reading. However, although more readings are not
required before agreements can be made, it was at many occasions stressed that the meetings
last longer, and that the legislative process may have been prolonged somewhat with regard to
the time spend – rather than the number of readings – on each individual proposal. In fact, a
concern has been voiced about a push from the presidency’s side to speed up the legislative
process and pass legislation at the Council’s first reading. This might undermine the quality of
the legislation adopted, it is argued. Such concerns were particularly expressed with regard to
Co-decision legislation, where it was emphasised by officials that the logic of this procedure is,
in fact, a two-reading process. While it made sense to introduce the possibility of a first reading
8/7/2019 desicion-making in EU Council after enlargement
DECISION-MAKING IN THE COUNCIL OF MINISTERS AFTER THE 2004 ENLARGEMENT | 27
5. Changes across policy areas
Having discussed the changes in decision-making in the Council overall, this section focuses on
legislation passed within the respective policy areas. Due to the scope of the report, we onlyinvestigate the key findings related to general variances across the policy areas. In other words,
although the data allow for further analyses of specific topics within the respective fields, this
section establishes what implications the enlargement has had for more overall issues such as
adoption rates, level of opposition and use of formal rules for passing legislation when looking
across the different policy fields. Interestingly, a great degree of variation can be observed:
while all areas have experienced an initial adaptation period since the enlargement, some have
faced greater difficulties in ‘recovering’ to the same levels of legislation passed in years prior to
the enlargement. The latter appear to be the ones with large proportions of legislation falling
under the unanimity rule, whereas the ones traditionally falling under QMV seem to have
returned to same adoption levels as prior to the expansion. The data also show a great variance
in the level of opposition recorded from one policy field to another. Taking into account also the
opposition voiced in the formal statements makes it clear that even policy areas that haveunanimity as the dominant decision rule see legislation being adopted with a notable amount of
recorded disagreement. The enlargement has further elevated these levels, and in sum, it can be
concluded that the introduction of the 10 new member states have certainly had an impact on
decision-making within the respective areas. It seems fair to say that the Commission’s
conclusion (European Commission, 2006) that a policy gridlock has been avoided needs some
clarification and elaboration when distinguishing between specific policy fields in the manner
presented here.
5.1 Amount of legislation adopted per policy area
Figure 9 presents a first important indication of how enlargement has affected decision-making
within the respective policy fields. It shows the amount of legislation adopted per policy area inthe period before and after May 2004. The graph suggests that something clearly changed
around the time of enlargement: out of the nine policy areas, all but two (Economic & Financial
Affairs and General Affairs & External Relations) experienced a drop in the amount of
legislation passed in the May-December 2004 period compared to the periods preceding
enlargement. And for the areas of Agriculture & Fisheries, Justice & Home Affairs,
Environment, and Transport, Telecommunications & Energy, these were rather significant
decreases. Employment, Social Policy and Consumer Affairs also seems to have been affected
in the period after May 2004, but this policy area has more than ‘recovered’ and actually shows
an adoption rate for 2006 that exceeds all of the preceding figures. By contrast, the other areas
have not yet reached the same levels as prior to the enlargement.
In a clear departure from the general pattern, the policy area of General Affairs and ExternalRelations shows an impressive increase just after the enlargement. This result may be related to
the fact that a large number of the 41 pieces of legislation that had to be re-adopted in order to
accommodate the 10 new members were categorised to fall under this policy area. Also the
observed increase in the graph for the area ‘Competitiveness’ may be related to the passing of
proposals that were renegotiated in order to include the new members. However, the highest
adoption rate for this area was not immediately following the enlargement, but rather in 2005
after the initial legislative ‘accommodation’ period can be thought to have passed. It may
therefore be that together with the areas Economic & Financial Affairs and Employment, Social
Policy & Consumer Affairs, these areas have actually experienced a general increase in the
legislative activity due to enlargement. As soon as data become available for the first months –
or the full year – of 2007, it will be interesting to see whether this trend continues.
8/7/2019 desicion-making in EU Council after enlargement
Figure 9. Passed legislation per policy area, September 2001 to December 2006
0
10
20
30
40
50
60
70
Nov-Dec
2001
Jan-Dec
2002
Jan-Dec
2003
Jan-April
2004
May-Dec
2004
Jan-Dec
2005
Jan-Dec
2006
Agriculture & Fisheries
Economic & Financial
Affairs
Justice & Home Affairs
Environment
Employment, Soc. Pol.
& Consumer Aff.
Education, Youth &
Culture
Transport , Telecoms &
Energy
Competiveness
General Affairs &
External Relations
Each of the observations from Figure 9 seems to suggest that although a policy gridlock may not
exist in terms of the total volume of adopted legislation in the period after enlargement, some
policy areas have experienced a drop in ‘productivity’. Both the data and the findings from the
interviews relate this tendency to areas that predominantly fall under unanimity. It was observed
by several of the interviewees that agreement in some policy areas, such as Justice and Home
Affairs as well as in General Affairs & External Relations, has certainly become more difficult.
These statements are also clearly supported by the data for Justice and Home Affairs presented
in Figure 9. The contradicting results reported for General Affairs & External Relations in the
figure can be clarified with the explanation that very little legislation had been recorded under
the General & External Relations category prior to the enlargement, but may instead be found
under other policy areas that an act may also relate to. Therefore, although the data present the
correct figures for how much legislation was actually recorded under this policy area, the
experience by the practitioners may still reflect a correct picture of the negotiations within the
area. Please refer to Appendix I for an elaboration of how legislation is categorised into policy
areas.
In addition to the wide variation found in adoption rates reported across the different policy
fields, our material suggests that it may be reasonable to investigate whether a policy gridlock
has in fact occurred within some policy fields in terms of policy quality and not only policy
quantity. As shown above, areas that traditionally include a large amount of legislation fallingunder the unanimity rule are challenged by the need to accommodate the increased number of
interests. Many of the interviewees observed that this phenomenon resulted in a significant
reduction in the details of the policy content. While there is not necessarily a correlation
between the detail of proposed legislation and the quality of its content, as mentioned in section
3, some interviewees argued that the quality of legislation might be affected due to the fact that
there is now less time to spend on the respective proposals.
5.2 Voting and recorded disagreement per policy area
Besides the quantity of legislation adopted in each policy field before and after the enlargement,
another interesting topic to explore is whether the level of recorded disagreement varies from
one area to another. Since one of our main findings in section 3 was that the governments
8/7/2019 desicion-making in EU Council after enlargement
DECISION-MAKING IN THE COUNCIL OF MINISTERS AFTER THE 2004 ENLARGEMENT | 29
increasingly rely on the opportunity to record their opposition in formal statements, it seems
relevant to investigate whether this phenomenon is limited to only a few policy areas or is
apparent in all of them. The possibility that enlargement may also have affected this issue to
varying degrees across the policy fields should also be explored.
Figure 10 below provides a general overview of the amount of opposition registered through
voting, abstentions, formal statements and the total number of oppositions per policy area before
the enlargement. Two findings stand out: First, it seems that there is a considerable difference in
the level of opposition across the respective policy areas. Agriculture & Fisheries is by far the
area with the most recorded oppositions, but several other areas also show a notable amount of
recorded oppositions, particularly in light of their respective adoption rates (see Figure 9 above).
Second, Figure 10 suggests that different means of voicing disagreement are used differently
across policy areas. For example, whereas Agriculture & Fisheries registered a total of 204
oppositions (when adding the figures for ‘Abstentions, ‘Formal statements’ and ‘Opposition
through voting’), only 69 of these came in the form of direct votes against the majority.
Abstentions were recorded on 38 of the acts adopted within this policy area, and formalstatements were recorded 79 times. A somewhat similar picture is given in the area of Economic
& Financial Affairs – although on a completely different scale – with 18 acts including
opposition through voting, 30 acts adopted with formal statements and only a very low number
of abstentions. For Transport, Telecommunications and Energy, however, the record is rather
different: here the largest proportion of disagreement is recorded as oppositions through voting
(24 acts), whereas formal statements come only second with a total of 15 and abstentions are
recorded on 9 acts. Hence, the option of using formal statements as a means of opposing the
majority is not always the dominant alternative, despite the impression created by data presented
in section 3. Nevertheless, it definitely seems to be a popular measure for voicing opposition in
the majority of the policy areas.
Figure 10. Oppositions, abstentions and formal statements per policy area,September 2001-April 2004
0102030405060708090
Ag ri.
& Fisherie
s
Eco &
Fin.
Affairs
JHA
Envir
onment
Emplo
ymen
t, Soc. P
ol. & C...
Educ
ation, Y
outh & C
ulture
Tran
sport,
Telec
oms &
Energ y
Compe
tivenes
s
General
Affa
irs & Exte
rnal Rel
...
Oppositions
Abstentions
Formal Statements
8/7/2019 desicion-making in EU Council after enlargement
Figure 11. Oppositions, abstentions and formal statements per policy area,
May 2004-December 2006
0
510
15
20
2530
3540
Ag ri. &
Fisheri
es
Eco &
Fin.
Affairs
JHA
Envir
onmen
t
Employme
nt, So
c. Po
l. & C...
Educat
ion, Y
outh
& Cu
lture
Transport
, Tele
coms &
Energ
y
Compe
tiven
ess
General A
ffairs
& Exte
rnal R
...
Oppositions
Abstentions
Formal Statements
Turning to the period after enlargement, Figure 11 shows a rather dramatic change in the use of
formal statements and opposition through either direct voting or abstention. The first
observation to make in comparing Figure 10 and Figure 11 is the difference in the values on the
y-axis: it is immediately clear how much the opposition rates have been lowered in the area of
Agriculture & Fisheries, which lead to ‘inflation’ of the values on the y-axis in the figure
reporting the data for the period prior to the enlargement (Figure 10). The second-most notable
change from Figure 10 to Figure 11 is in the use of formal statements: the difference between
the amount of recorded formal statements and opposition voiced through voting has increasedconsiderably in some areas, particularly Justice & Home Affairs and General Affairs & External
Relations. Of course, these areas customarily pass legislation by unanimity and, hence,
opposition through voting or abstention is usually not recorded in these areas. What is
interesting from these figures, however, is that opposition through formal statements is clearly
recorded following the enlargement. Unanimity does not necessarily indicate that the Council
has reached a consensus in which all governments have adapted to a common, homogenous set
of preferences. Rather, it seems to be a game of compromise bargaining, with the formal
statements providing the possibility to signal to external actors that an alternative position was
held by a single or number of governments, without those actually having to make the drastic
step of vetoing a given proposal. Such behaviour was already noted in section 3, but the
increases in the graphs representing the specific areas of Justice & Home Affairs, General
Affairs & External Relations as well as Economic & Financial Affairs 18 further support theimportance to be attributed to the use of formal statements.
From Figure 11 it can furthermore be observed that some of the areas that fall predominantly
under QMV have seen a change in how contesting positions are recorded. For example, the area
of Transport, Telecommunications & Energy, which previously had a much higher rate of
disagreement recorded as opposition through voting, now seems to have reversed that pattern to
a much higher reliance on formal statements and abstentions. Conversely, the area of
Employment, Social Policy & Consumer Affairs has now a higher rate of opposition recorded as
contesting votes and a lower level of formal statements and abstentions. Prior to enlargement,
18 Economic & Financial Affairs are mentioned, although this area already had a high level of recorded
formal statements prior to the enlargement.
8/7/2019 desicion-making in EU Council after enlargement
DECISION-MAKING IN THE COUNCIL OF MINISTERS AFTER THE 2004 ENLARGEMENT | 31
these categories were ranked in reverse order with the greatest incidence of opposition voiced as
formal statements, and a very low level of opposition expressed either via direct voting or
abstention.
The reason why Agriculture & Fisheries has seen a considerable reduction in the level of
opposition is most likely related to the lowering in the rate of passed legislation within this area
after the enlargement (see Figure 9). Still, Agriculture & Fisheries seems to have maintained the
same rate of opposition through voting, abstentions and formal statements issued prior to and
after May 2004. In this most contested area (in absolute terms), formal statements have been
recorded 36 times following enlargement, opposition through voting (the black line) 29 times
and abstention 21 times. In the area of Environment, however, a considerable rate of all three
forms of oppositions can be observed, representing an increase of opposition since enlargement.
This result is particularly striking in light of the reduced amount of legislation passed in this
area, which was also remarked upon by many of the practitioners involved in policy-making in
this area.
Figure 12. Oppositions per country, per policy area, May 2004-December 2006
0
10
20
30
40
50
60
70
80
GermanyFrance UK
ItalySp
ain
Polan
d
Nethe
rland
s
Greec
e
Belg i
um
Czech R
ep.
Portu
g al
Hung ary
Swed
en
Austria
Slovakia
Denmark
Finlan
d
Irelan
d
Lithu
ania
Latvia
Slovenia
Eston
ia
Cypru
s
Luxembo
urg Malta
Agriculture & Fisheries
Competitiveness
Economic & Financial Affairs
Education, Youth & Culture
Employment, Social Policy and
Consumer Affairs
Environment
General Affairs and External
Relations
Justice and Home Affairs
Transport, Telecommunication
and Energy
Figure 12 further divides opposition per policy area to also include divisions per country. It
should be stressed that the figure is not intended to be used for a detailed analysis of each graph,
but rather is included to give a general indication of the fluctuations of opposing votes by
member states across the different policy areas. Against this background, two interesting
findings are evident: Although there is considerable variation in the Council members’frequency of opposition within the various policy fields, all 25 governments tend to oppose
within certain policy fields and refrain from opposing in others. This is particularly apparent in
Agriculture & Fisheries, and to a lesser degree in Justice & Home Affairs, Transport,
Telecommunications and Energy, General Affairs & External Relations and Environment.
The second interesting observation from the figure is that none of the countries seems to
consistently dominate throughout all policy areas in terms of recorded opposition. Germany has
a relatively high opposition rate in a few of the areas, but none of the Council members is found
to oppose in all areas. Apart from Germany, all countries seem to generally vary in the
frequency with which they register opposition across the policy fields. Hence, some of the
assumptions expressed in the current debate concerning certain countries’ general predisposition
to take an opposing position warrant closer scrutiny. For example, the assertion that the UK and
8/7/2019 desicion-making in EU Council after enlargement
Poland are always present in the group of opposing countries appears to only hold in certain
policy areas.
The results presented in Figure 12 further show that the variance in the levels of oppositionacross policy fields may correlate with the fields in which a country has vital interests. The field
of agriculture is the most explicit illustration of this case: High levels of opposition are recorded
among the producers especially in the South (Spain, Italy, Poland and Greece) and in the North
(Sweden and Denmark). Similarly, Germany frequently opposes legislation in Transport,
Telecommunications & Energy. While it is somewhat more difficult to draw conclusions in
some of the other areas, e.g. Justice & Home Affairs, it is nevertheless interesting to detect such
patterns.
As a final remark it needs to be pointed out that the variations in opposition across policy areas
is presented in Figure 12 presented in the form of absolute figures. Since the results are highly
correlated with the amount of legislation adopted within the respective areas, the policy areas
with most legislative activity are also the ones with the highest amount of legislation passed
with recorded opposition. This means that, although Agriculture & Fisheries is certainly the areawith highest level of recorded opposition, it does not necessarily have the highest level of
disagreement when considering the amount of legislation adopted. Therefore, when making
comparisons of the relative distribution across the policy areas, the relative adoption rates in
each area also need to be taken into account. Figure 12 qualifies the finding from section 3 that
the large and medium-sized member states tend to oppose more frequently than the smaller ones
by specifying that this is particularly due to their stronger inclination to oppose legislation in the
policy areas of Agriculture & Fisheries, General Affairs & External Relations and Justice &
Home Affairs.
In sum, it is evident that the level of contested decisions varies widely across the different
policy areas, but also that enlargement has had a different impact on the respective policy fields.
Whereas all areas have experienced a decrease in both the adoption rates and the level of contestimmediately following the enlargement, some areas seem to have returned to almost the same
levels of ‘productivity’ as prior to May 2004. Still, particularly the areas falling under unanimity
seem to have been challenged by the introduction of the 10 new member states when
considering both the decrease in the amount of passed legislation and the elevated levels of
contest recorded in the form of formal statements. Given our finding illustrated in Figure 12 that
governments vary from one policy area to another in how often they decide to oppose a policy
proposal, it was made even clearer that it is necessary to distinguish between policy areas when
investigating both the general decision-processes in the Council as well as individual
government’s behaviour.
8/7/2019 desicion-making in EU Council after enlargement
DECISION-MAKING IN THE COUNCIL OF MINISTERS AFTER THE 2004 ENLARGEMENT | 33
6. Conclusions
The institutions, governments, politicians and officials that make up the unique political system
of the EU are fast approaching a crossroads. The reflection period that followed in the wake of the negative French and Dutch referenda is coming to an end, and it is increasingly apparent that
despite the difficulty of the task of finding a consensus on the way forward, a move towards
solving the current reform impasse is sorely needed.
This report seeks to contribute to the current debate by presenting the results and analysis of a
large body of data and insights gleaned from interviews with over 50 practitioners involved in
decision-making in the EU’s most important legislative institution, the Council of Ministers.
The intention has been to establish the current state of affairs in the Council based on facts and
figures. No in-depth analysis has been presented to date that draws from both quantitative and
qualitative material in this manner, and the relatively long period covered by our data allows for
specific investigations into the implications of the 2004 enlargement for the Council’s internal
processes.
Some evaluations of the integration of the new member states into the respective EU institutions
have been carried out by both by the Commission and external observers. The evaluations of the
enlargement’s impact on the internal working processes in the Council, in particular, however,
have relied almost exclusively on qualitative descriptions of the changes. These evaluations
have concluded that the integration is running relatively smoothly and that the expansion of the
Council has by and large been found to be a success. The results presented in this report do not
dispute this interpretation of the current state of affairs as such, but through a presentation of
quantitative data and first-hand accounts of the changes that have occurred in the expanded
Council, a more nuanced evaluation is offered.
6.1 Summary of the findingsAlthough the Council has managed to continue to adopt legislation at an impressive rate, we
find that there have been significant changes to the internal processes and legislative procedures
in the Council since the enlargement of May 2004. Many of these changes are the consequence
of the increased number of interests that need to accommodated in the legislation, a general
formalisation of the meetings and an emphasis on high ‘productivity’ in terms of short
legislative sessions and limited negotiation time spent on individual proposals. The number of
pieces of legislation adopted at the 1st
reading in the Council is gradually increasing, and in the
view of many of the insiders interviewed, this tendency is likely to continue. The country
holding the presidency at any one time especially feels strong pressure to reach early and swift
agreements.
The period immediately following the enlargement saw a significant drop in the amount of legislation passed, but the total number of acts adopted in 2006 has increased to almost the same
level as prior to enlargement. This may be explained by the increase in the percentage of
legislation passed under the co-decision procedure or adopted by QMV.19
In 2006, more than
40% of legislation passed fell under co-decision, compared to 34% in 2005, and only 26% in
2004. The use of the QMV decision rule (which in some cases is also applied to non-co-decision
legislation) has reached an even-higher level and covered more than 53% of the legislation
adopted in 2006.
19 These two phenomena are of course somewhat related since co-decision by definition includes the
QMV adoption rule. In some cases, however, legislation falling under either of the other procedures
(consultation or cooperation) may also be passed by QMV. See section 3 for details.
8/7/2019 desicion-making in EU Council after enlargement
Contrary to what was expected to result from the sizeable increase in the number of
representatives around the negotiation table, official disagreement in voting situations following
enlargement has not been found to increase. There must then be other measures in place to
explain the smooth legislative process, since the representation of more divergent preferencessurely cannot have led to a decrease in the level of disagreement in meetings. One such measure
is the use of formal statements, which are included in the official Council decision records, to
signal a country’s reservations or even outright opposition to an act, even in cases where this
was not expressed through voting. Hence, while the Council records now show an even-greater
degree of consensus as far as voting behaviour is concerned, the governments are at the same
time able to ensure the recording of their political positions in these formal statements. The use
of formal statements has risen considerably since enlargement, and the proportion of legislation
adopted in 2006 with one or more governments voicing reservations either through direct voting
or in the formal statements amounted to a surprising 45%. Adopting legislation in the Council
hence seems to be a two-sided political game that is increasingly accepted even in the official
records.
Section 3 presented descriptive statistics on individual government’s behaviour and looked into
the differences between, inter alia, the following groupings of countries: 1) large, medium and
small members, 2) new and old members, and 3) Northern, Central, Eastern and Southern
members. The adaptation to the work processes of an EU of 25 was reflected in the data, which
showed that the old members have gradually decreased their opposition rates, whereas the new
members have conversely increased theirs since May 2004. The results for 2006 revealed that
the two groups now stand on an equal level, indicating that the distinction between old and new
is largely irrelevant on this account. The grouping into large, medium and small members
showed that the largest members clearly dominate in terms of having the highest opposition
rates prior to enlargement, while the medium-sized and small members recorded a significantly
lower level of recorded opposition in this period. Two outliers stood out in the figures, namely
Denmark and Sweden, but the distribution of opposition was nevertheless clearly biasedtowards the large countries. Following the enlargement this situation changed drastically. The
months immediately following May 2004 continued to see a larger opposition rate by the
biggest members, but already in 2005 did this role shifted to the medium-sized members,20
only
to be further accentuated in 2006. None of the alternative groupings – such as for example
between Northern, Central, Eastern and Southern members – reflected stable cleavages over the
years covered by the data.
The geometrical scaling method technique used in section 4 further confirmed the last point
above, namely that a distinction between old and new members cannot be found in the Council.
The findings in this section also established that the patterns detected in the other groupings
were in fact not due to a permanent coalition structure: the observation that the medium-sized
member states have taken an opposing position most frequently than the others since theenlargement does not mean that they have opposed the same policies, thereby forming a
separate bloc. Rather, from the analysis in section 4 it became clear that the enlargement has led
to somewhat unstructured alliances, particularly when considering the finding in the recent
literature of a North-South coalition before the enlargement. We did not detect a North-South
division in our data after May 2004, although a few clusters of countries based on geographical
location could be observed.
The 2004 enlargement has had a rather different impact on the various policy areas. This was
made clear in section 5, in terms of the amount of legislation adopted per year, the number of
20 Particularly the group categorised as ‘Medium 1’ in Figure 5 and which included the Netherlands,
Greece, Belgium, the Czech Republic, Portugal and Hungary.
8/7/2019 desicion-making in EU Council after enlargement
DECISION-MAKING IN THE COUNCIL OF MINISTERS AFTER THE 2004 ENLARGEMENT | 35
contested decisions as well as in the variance of how the governments used either direct voting
or formal statements to voice disagreement with a policy proposal. Most areas experienced a
rather significant drop in the amount of legislation adopted immediately following enlargement,
yet, while this has been only a temporary reaction in a large number of the areas, some – andparticularly the area of Justice & Home Affairs – have still not returned to the same adoption
rates as prior to enlargement. Both the data and the interviews relate the slowdown of the
adoption rates in these areas to the decision rule: negotiations have become more cumbersome
where legislation is predominantly passed by unanimity (particularly in Justice & Home Affairs
and also General Affairs & External Relations), whereas less discrepancy can be observed from
the time before to the time following the enlargement in areas that fall under QMV. The
increased rates of the total QMV legislation adopted per year (reported in section 3) may be a
reaction to this, as the institution seeks ways to avoid policy deadlocks. Still, the figures in
section 5 emphasise the need to pay close attention to the individual policy areas, and not just
the total amount of legislation adopted each year, when evaluating whether deadlocks have
indeed occurred or not.
6.2 Is Council decision-making efficient?
Despite the substantial body of data and qualitative findings presented in this report, drawing a
conclusion on the controversial issue of whether the Council is an efficient institution is a
difficult matter. ‘Efficiency’ is a normative concept (who can say what efficiency really means
in any context?) that requires strict definitions in order to serve as a benchmark in evaluations
and analyses. Nevertheless, since the matter is of great importance – and highly disputed – in
the current debate on the need for institutional reform, we suggest approaching the topic by
distinguishing between two criteria for efficiency. The first is a criteria of efficiency in terms of
quantity (i.e. policy output). The second is a criteria of efficiency in terms of quality (i.e. policy
content).Given the sui generis nature of the EU as a political system, it would be futile to compare the
Council with either domestic institutions (parliaments) or other international organisations.
Rather, any assessment of the Council’s efficiency must in fact be made against the institution
itself. The 32 months prior to enlargement can serve as the standard of comparison for the
efficiency of the Council in terms of policy output for the 32 months after enlargement. This is
not meant to imply that the Council was necessarily an efficient institution before the
enlargement, but some sort of benchmark is needed for such a discussion and in the absence of a
better empirical alternative, this method seems the most convincing. Other caveats should of
course also be acknowledged, such as the fact that internal administrative and domestic political
agendas vary and thus one should not expect a similar level of output every month or even every
year. Nevertheless, these anomalies should be sufficiently allowed for, since the period covered
by our data is long enough to balance out most such fluctuations.
Regarding efficiency in terms of quantity, the results summarised above give mixed evidence as
to whether the Council’s ‘productivity’ level has really been left unaffected, as is often stated.
While the total amount of legislation passed in 2006 reached a level almost comparable to the
years before enlargement, the quantity of policies passed within the respective areas certainly
varies. In fact, the data and interviews used in this study could indicate that a policy gridlock
may have occurred in certain fields; those areas falling under the unanimity rule particularly
seem to have experienced a change in the adoption rate, a point echoed by many of the
interviewees. To be specific, the areas of Justice & Home Affairs and General Affairs &
External Relations appear to face great challenges in constructing agreements in a 25 (now 27)
member Council. The data reporting on both the duration of meetings, the number of
negotiation rounds on individual proposals as well as the amount of legislation passed since
8/7/2019 desicion-making in EU Council after enlargement
enlargement within these policy areas reflect a more cumbersome legislative process. On the
other hand, the data covering the areas falling under QMV, such as Environment and Transport,
Telecommunications and Energy, showed that these areas have in 2006 managed to more or less
return to their adoption rates prior to enlargement. In fact, for the area of Employment, SocialPolicy and Consumer Affairs, the post-enlargement period has even seen an increase in the
amount of legislation adopted. But even within these areas, it was found that negotiations
generally take longer and have become more formalised, though this leaves little time to
negotiate on individual acts due to the large number of representatives present in the meetings.
The second criteria, regarding the quality of the passed legislation is obviously much more
difficult to assess objectively. In fact, we are not able to present any supportive data or objective
observations for a strong conclusion on this matter within the frame of this report. Nevertheless,
we deem it important to keep the consideration of quality of legislation in mind, and can at least
report the findings from the statements made on the topic by the practitioners in the large series
of interviews conducted for this study. These sources suggest that there may be reason for
concern regarding the issue: As mentioned in section 3, negotiators experience agreementsbeing reached on the basis of a lower common denominator since the content of individual
proposals must now accommodate a more diverse set of interests. Especially legislation falling
under unanimity has become more cumbersome after the enlargement, and may more often than
before satisfy only parts of the preferences the member states bring to the negotiation table. As a
consequence, policy proposals include considerably less detail and leave a greater scope to the
national levels in the implementation phase. Concerns were also raised about the trend toward
first reading adoptions by the Council, which was thought to result in bigger compromises being
made by the negotiating parties.
In sum, an impressive amount of legislation has been processed and adopted by the Council
since the 2004 enlargement. The institution seems to have almost fully ‘recovered’ from the
significant increase in the number of actors involved in the internal decision-making processes
since 2004 in terms of the total amount of legislation passed per year. Yet, further challenges
present themselves than what is reflected in the general adoption rates. These challenges raise
important questions with regard to both the efficiency of the institution in terms of producing
robust, high-quality legislation and the effective functioning of individual policy areas. The next
section discusses what the Constitutional Treaty may - or may not – change in this respect.
6.3 What would the Constitutional Treaty change?
The proposed Constitutional Treaty includes a number of important reforms with direct
implications for the issues addressed in this report. While the Treaty obviously consists of many
more articles than those concerned with the Council’s decision rules and legislative procedures,
these are the ones which have received the most attention in the debate on institutional reform,and also the ones we will focus on here. The most notable changes proposed in the Treaty are
the changes from the complex system of a triple majority rule to a simpler double majority rule,
as well as the extension of qualified majority to cover a number of additional articles within
certain policy areas. The following discuss each of these issues in turn, based on the results from
the previous sections.
The introduction of the double majority voting system (Article I-25 of the Constitutional Treaty)
comprises a dramatic switch (at least on paper) from the triple majority rule described in section
2. While the current rule includes a threshold for weighted votes of 72% (232 out of 321 votes
are needed), a simple majority of member states (i.e. at least 13) and 62% of the total EU
population (i.e. 282.7 million), the proposed double majority rule would include a majority
requirement of 55% of the member states and 65% of the population. Thus, while external
8/7/2019 desicion-making in EU Council after enlargement
DECISION-MAKING IN THE COUNCIL OF MINISTERS AFTER THE 2004 ENLARGEMENT | 37
observers may still find this rule rather cumbersome, it clearly implies a simplification of the
decision rule.
One of the reasons for the proposed double majority rule was to avoid an increase in theformation of blocking minorities in the enlarged Council, a scenario which was much predicted
and greatly dreaded before the enlargement. As we have seen in the results presented in the
previous sections, the level of contested decisions has indeed been elevated since the
enlargement. However, this has not been in the form of opposing votes, but rather through an
increased reliance on voicing opposition through formal statements following the adoption of a
decision. The amount of legislation contested through direct voting has remained at the same
level as prior to enlargement, although the data did report a tendency to larger ‘coalitions’ of
opposing countries being formed now than before 2004 (see section 4). Yet, the percentage of
legislation opposed through either formal statements or direct voting is considerably higher,
with a total 45% in 2006. As discussed in section 3, the reason why the Council members turn to
the formal statements is to have their positions recorded without actually hampering the passing
of legislation. Therefore, switching to a decision rule of a double majority rather than thecurrent triple majority may allow for more of these oppositions to be voiced through direct
voting rather than merely in the formal statements. In other words, a consequence of introducing
a lower threshold may not be an actual increase in the amount of legislation blocked, but could
instead be a more ‘honest’ and transparent voting scenario where countries are able to record
their position in voting situations without the pressure and concern of causing a situation similar
to the dramatic veto under unanimity. Many of the practitioners interviewed supported this
analysis as they attached mainly symbolic value to the proposed reform in terms of the
implications for policy outputs. Rather than a ‘revolution in Council decision-making’ – the
term officially coined for the reform by the institutions21
– this simpler decision-making rule
could be a step towards a higher level of transparency.
It has further been argued that the double majority implies a major power shift in the decision
making process by giving more weight to the bigger member states. While it is true that the rule
favours bigger members with larger populations to some degree, this observation may not
indicate any significant changes in reality. Rather, our finding in section 4 show that a new
grouping of medium sized member states are equally dominant to the larger members. By
introducing a large group of medium and smaller states, enlargement has considerably shifted
the balance of power between the members. It is therefore not possible for the large member
states to dominate negotiations similarly to prior enlargement. This is underlined by results from
the interviews which expressed the observation that big states such as France and Germany,
which were previously to be seen in the drivers seat for integration, have become more
‘sensitive’ and defensive. Our results also showed little evidence of any large versus small
coalitions emerging in the enlarged Council. As a consequence, while the double-majority rule
may return some weight back to the larger members, it is unlikely that it can seriously diminishthe role of the increased number of medium sized countries.
The planned extension of QMV to cover more areas, on the contrary, has been emphasised by
all interviewees as a crucial change which would greatly change decision-making. The draft
Treaty proposes the extension of QMV to 23 policies which previously fell under unanimity, as
well as an introduction of 19 new policy areas to also be covered by this decision rule. Given
that we have found that policy areas falling under unanimity on the whole seem to be hampered
more by the recent enlargement(s) than those under QMV, we can conclude that any extension
of QMV would most likely speed up the legislative process as well as enable a higher adoption
rate than is currently observed. However, as was also made clear in our results, extension of
21 See http://europa.eu/scadplus/constitution/doublemajority_en.htm
8/7/2019 desicion-making in EU Council after enlargement
QMV may imply a push for more first reading adoptions and, of course, the possibility that a
group of Council members will not have their preferences met by a given piece of legislation.
This latter point is made clear in section 4 where it shows that more oppositions are recorded
under QMV than under unanimity even when the formal statements are taken into account. Bydefinition, QMV allows for oppositions to be recorded to a wider extent
22than the unanimity
rule which somewhat ‘suppresses’ the governments’ ability to do so. An extension of the QMV
rule should therefore not only be evaluated on the basis of the possibilities for increasing the
amount of legislation passed, but must also consider the consequences of a possible effect for
the quality of a policy consensus.
The extension of QMV is limited to certain policy fields, which – as we learned in section 5 –
should be taken into account separately. The majority of changes fall under the policy area of
Justice & Home Affairs, a policy area where major difficulties have been noted in our data since
enlargement. Our findings in section 5 show that there were changes both regarding the policy
output as well as the level of contested decisions in this area. Numerous interviews with
practitioners and comments from policy experts regard the changes envisaged in theConstitution as crucial in resolving the current difficulties of finding agreement. As above,
however, a concern for the content of policy agreement rather than solely the quantity of
legislation of course needs to be kept in mind when considering these views. Since the findings
in section 3 showed that there is a tendency – particularly from the Presidency – to push for
early agreements of matters falling under QMV, any consequences of introducing a pressure on
member states to make compromises early on the in the negotiation process - rather than taking
the time for more in-depth negotiations - should be carefully considered.
Other policies that would be moved to QMV, or where new articles would be introduced and
covered by the QMV rule, include the following areas: 1) General Affairs & External Relations;
Transport, Telecommunications & Energy; as well as 5) Education, Youth & Culture. Apart
from the fields of Economic & Financial Affairs and Education, Youth & Culture these are all
areas in which we have found considerable decreases in policy output in the period immediately
following the 2004 enlargement. While some of these areas seem to have already ‘recovered’,
others have not quite reached the levels of policy adoption prior to enlargement but could be
expected to do so if more policies were moved to QMV. Still, some of the issues that have
proved most controversial since enlargement, such as the services directive and VAT
negotiations, would not have been moved under QMV with the new treaty. Despite being
characterised as an increasingly problematic policy area by practitioners, we have observed a
rather impressive increase in the adoption rate of legislation for General Affairs & External
Relations. A move to more QMV would most likely even increase this trend.23
.
Beside an extension of the QMV rule, the Constitutional text also stipulates an extension of the
co-decision procedure. Introducing the European Parliament into policy areas where it has so farhad no real power, could lead one to assume that the policy process would become more time
consuming and perhaps more cumbersome. Our results in section 4 showed, however, that this
is not necessarily the case, at least not in terms of the duration of the legislative process. The
22 QMV includes, of course, both the opportunity to oppose through voting, through abstentions and
through formal statements.23 As explained in Section 5, the classification of policies under General Affairs & External Relations
seems to have changed somewhat after enlargement, and we are therefore careful not to draw any
extensive conclusions in this area about the variance in the adoption rate from before to after the
enlargement. It appears as if more policies are now classified as General Affairs & External Relations,
whereas some of these policies would perhaps have been classified under other areas before the
enlargement depending on which area(s) the policy content would also be related to.
8/7/2019 desicion-making in EU Council after enlargement
DECISION-MAKING IN THE COUNCIL OF MINISTERS AFTER THE 2004 ENLARGEMENT | 39
data showed an increasing tendency to aim for first reading agreements and hence a great
emphasis on a smooth and (relatively) quick legislative process. It also showed that the
temporary decrease in policy output for co-decision legislation in the years 2004 and 2005 has
been followed in 2006 by an increase that even superseded the pre-enlargement levels. Thefindings therefore indicate that an extension of the co-decision procedure may not necessarily
cause a prolongation of the legislative process. Nevertheless, the issues raised above about other
challenges that policy proposals adopted at an early stage may face are still valid.
As a last point we would like to turn to an issue which is somewhat more political than merely a
‘weighing’ of the likely implications of the Constitutional Treaty against our findings in the
previous sections. As we have showed, enlargement has brought about also important
atmospheric changes related to the work processes and conduct of negotiations in the Council. It
was reported that our 52 interviewees (though, of course mainly the interviewees from the old
members commented on this) have experienced an increasing impersonality in the style of the
meetings. The legislators do no longer necessarily know each other, let alone are able to connect
across an increasingly longer negotiation table. Some observers therefore emphasise theincreasing tendency towards ‘statement reading’ in the Council formations rather than actual
negotiations. This has been seen as one of the reasons why negotiations have now moved
elsewhere. While institutional reform could do little to address these issues, it has been argued
that resolving the ‘constitutional crisis’ would give new impetus to the common European ethos
behind integration, as well as pushing some actors out of the current defensive behaviour in
negotiations, and prevent others from having an explicit negative attitude towards further
integration. This is clearly a somewhat ideological argument. Nevertheless, in addition to the
above predicted consequences of the Constitutional Treaty - if it was to be adopted in its current
form - it might be true that the impact of reform could have an equally important effect through
its symbolic value and on the political mood amongst policy actors.
6.4 Remaining issues to be explored in future research
This report presents the basic findings from our data and interview material with regard to the
general changes in Council decision-making since the 2004 enlargement. As discussed, these
findings are essential for establishing and evaluating the current state of affairs as well as for
making an informed analysis of likely future political scenarios. However, the topics we have
covered here by no means exhaust the issues that should be taken into account in the debate on
future institutional reform and on the general topics of efficiency, policy impact, accountability
and transparency of the EU’s most important legislative institution. The data and interview
material we have drawn on in this study include information on a large number of other issues
that also deserve closer scrutiny by politicians, officials, academics, and external EU observers
at large. In our view, the following five topics merit further study in relation to the current
debate:
1. More differentiated analyses according to policy areas.
Section 5 provided key results with regard to general variances across policy areas on a number
of issues; several topics still need to be investigated in a comparative manner between the
different policy fields. Research projects within individual fields have started to emerge in the
literature (e.g. Van Schaik et al. 2006; Guild & Carrera, 2005), but detailed analyses of cross-
sectoral trends should also be carried out, particularly when considering the elaborate flow of
policies between the Council’s different sectoral entities. The data set used in this report
contains information on a number of policy-specific issues and a consistent update of the data
set will allow for in-depth analyses of the decision processes across these respective areas and
across a large number of years.
8/7/2019 desicion-making in EU Council after enlargement
The importance we – and our interviewees – have attributed to the two-sided game that is
apparent in the Council’s decision records in terms of the possibility a government to voice its
position not only through voting (under QMV) but also in formal statements, raises a number of
questions with regard to the transparency and efficiency of the current legislative procedures.
Unlike most other legislatures, the Council members do not pass policies according to a set of
policy preferences publicly announced to the full population affected by these policies. It is thus
often difficult for the constituencies to have a clear overview of all governments’ positions on a
specific policy issue. As a result, the transparency of the Council has been, and remains, a much
debated issue. The increasing tendency by governments to use formal statements instead of
voting could be regarded as even increasing the problems of transparency, as it may encourage
policy-makers to hold a two-sided position with respect to European policies. One position may
be their ‘Brussels position’ whereas another is used to signal a political message to their home
constituencies. Our findings of how the Council members use voting and formal statements
need further enquiry in order to establish the effects of both voting and formal statements on theconstruction of policy agreements, if they play a role in the implementation phase, in future
negotiations on similar policy proposals or if an effect can be correlated to national level
politics.
3. Do votes matter?
The distribution of votes is receiving considerable attention in the current debate, mainly due to
the Constitutional Treaty’s proposed changes to the voting threshold. We have already
presented and analysed essential information in this report on the general voting patterns, on
how voting varies between policy areas as well as how individual governments behave in the
voting situations. However, our data also allows for rigorous analyses and presentation of facts
with regard to when voting takes place and whether the distribution of votes actually matters in
these situations.
4. Changes in other institutions, notably the Commission
An issue that follows on from decision-making in the Council is decision-making in the other
EU institutions. As the sole legislative agenda-setter, the Commission evidently plays a role for
adoption of policies in the Council, but also its supervisory powers in the implementation
process could be an issue for further investigation. Similarly to our approach in this report, we
would suggest an investigation of correlations between decision-making in the Commission and
decision-making in the Council based on both quantitative and qualitative material; fortunately,
studies relying on quantitative analyses of the Commission have started to emerge (e.g.
Franchino, forthcoming 2007).
5. Bicameral politics in the EU It is commonly acknowledged that decision-making in one legislative chamber influences
decision-making in another chamber in bicameral political systems. Whether the EU falls within
the category of a bicameral system is evidently a matter for debate. However, the current
institutional set-up for passing legislation under the co-decision procedure makes it relevant to
explore the topic of bicameral bargaining and, for example, national or party political
affiliations across the institutional divide of the Parliament and the Council. Our findings in the
previous sections that the presidency is frequently successful in achieving 1st
reading in the
Council suggest that the bicameral talks prior to the Council meetings should be further
accounted for.
8/7/2019 desicion-making in EU Council after enlargement
Mattila, M. (2006), Voting and Coalitions in the Council – Two Years after the Enlargement.
Robert Schuman Centre for Advanced Studies, EUI Discussion Paper 2005-6/CoM-3
European University Institute, Florence.
Mattila, M. and J.-E. Lane (2001), “Why Unanimity in the Council? A Roll Call Analysis of
Council Voting”, European Union Politics, 2, 31-52.
Moberg, A. (2002), “The Nice Treaty and Voting Rules in the Council”, Journal of Common
Market Studies, Vol. 40, No. 2, pp. 259-82.
Penrose, L.S. (1946), “The Elementary Statistics of Majority Voting”, Journal of the Royal
Statistical Society 109: 53-57.
Poole, Keith T. (2005), Spatial Models of Parliamentary Voting, Cambridge: Cambridge
University Press.
Shapley, L.S. and M. Shubik (1954), “A method for evaluating the distribution of power in a
committee system”, American Political Science Review 48:787-792.Sherrington, P. (2000), The Council of Ministers: Political Authority in the European Union,
London/New York: Pinter.
Thomson, R., J. Boerefijn and F. Stokman (2004), “Actor Alignments in European Union
Decision Making”, European Journal of Political Research 43 (2): 237-61.
Trumpf, J. and J.-C. Piris (1999), “Operation of the Council with an enlarged Union in
Prospect”, Report of the working party set up by the Secretary-General of the Council,
Brussels, 10 March.
Van Schaik, L. et al. (2006), Policy Coherence for Development in the EU Council – Strategies
for the Way Forward , Centre for European Policy Studies, Brussels.
Van Schendelen, M.P.C.M. (1998), EU committees as influential policy makers, Brookfield,
VT: Ashgate.
Zimmer, C., G. Schneider and M. Dobbins (2005), “The Contested Council: The Conflict
Dimension of an Intergovernmental Institution”, Political Studies, Vol. 53, No. 2, pp.
403-22.
8/7/2019 desicion-making in EU Council after enlargement
Appendix I. Research methods, data, interviews, etc.
Interviews
The qualitative material used for the analysis in this report consists of 52 interviews withpractitioners from the Council of Ministers, the European Commission and the European
Parliament, external experts as well as diplomats from the permanent representations of the
member states, both old and new. The interviews have been conducted over a time span of 13
months from January 2006 to February 2007. All of the interviews were of a semi-structured
nature, following the order of a questionnaire of 12 questions, with additional questions
included according to the special function and field of expertise of the interviewee. Follow-up
interviews of these same practitioners were later conducted in order to present the results from
our statistical data and to solicit their interpretation. Our interviewees agreed that we may use
the information they provided on condition that they remain anonymous.
Data
The data used for the quantitative analysis in this report are drawn from a sample of a largerdata set collected by Sara Hagemann, who retains full copyright of the data. The data set covers
all legislation passed in the Council from January 1999 until January 2007 and is continuously
updated as more information becomes available. The findings presented in this report rely on
information from the 32 months leading up to May 2004 and the 32 months that have now
passed since then. In other words, the data used here covers a period of more than 5 years
(September 2001 to December 2006) and consists of information on all legislation adopted
within this period.
The data consist of individual votes cast by each government on 872 pieces of legislation.
Legislation that was initiated and voted upon in the Council but not finally adopted in the period
September 2001 to December 2006 is not included in the analysis. However, of these 872 acts,
214 pieces were presented to the Council several times. A proposal that is voted upon X numberof times is treated as X individual votes as behaviour in the Council can be assumed to change
throughout the different stages of the legislative process (see Mattila, 2004; Mattila & Lane,
1999). Furthermore, the data include several cases where a single policy proposal presented to
the Council had to make a decision upon more than one issue. For instance, a proposal on
regulation of emissions from vehicles may include several different levels of emissions
standards depending on the type of vehicle.24
Decisions may therefore be taken on each of these
regulatory levels and are also included in the data as separate decisions. In sum, the total
number of decisions in the September 2001-December 2006 period amounts to 1,473 and results
in 22,195 decisions by the individual governments.
The data are collected from the minutes of individual Council meetings and includes
information on the following issues:• Procedure
• Date of introduction
• Date of adoption
• A and B points
• Policy area (as categorised by the General Secretariat/working groups)
• Title of proposal
24 See e.g. Council document number 8118/00: Decision of the European Parliament and of the Council
establishing a scheme to monitor the average specific emissions of CO2 from new passenger cars.
Reference numbers are PE-CONS 3608/00 ENV 48 ENT 28 CODEC 145 + COR 1 and corresponding
documents from meetings held in relation to this decision can be found based on these references through
the PreLex database.
8/7/2019 desicion-making in EU Council after enlargement
• Stage at which of the legislative process the vote was taken
• Stage at which of the legislative process the proposal was adopted
• Identity of the member holding the presidency
• Each country’s decision to
o support
o abstain
o oppose
o and/or make a formal statement. Formal statements are usually included in the minutes.
Each of the points of information above has then been coded such that Procedure, Policy Area,
Sectoral Council, Stage of Vote, Stage of Adoption, Presidency (i.e. nationality of the member
holding the Presidency) is included as categorical variables in the data set. Date of Introduction
and Date of Adoption are continuous variables, whereas A and B points and a country’sdecision to Support, Abstain, Oppose or make a Formal Statement are binominal.
The data are collected from the Council’s website,25
the inter-institutional data base PreLex26
and from the Council’s Access Service.27
Since 1999, it has been possible to trace a legislative
proposal through the public register of the Council and/or the PreLex database. For this purpose,
it is sufficient to know the COM reference number of the initial Commission proposal, the title
of the proposal or the inter-institutional file number. The inter-institutional file number will
provide all the documents linked to the same proposal/dossier (also from working groups) and
can be found through PreLex (when the COM number is known) or on the top of the page of the
Council minutes.
Although it can hence be concluded that important information is indeed available from the
Council, two important limitations to the data must be pointed out. First, analyses of Council
decision-making based on official documents often point out problems with the information that
is not included in the minutes and voting records (see e.g. Wallace & Hayes-Renshaw, 2006).
Only those decisions that result in a successful adoption are recorded, and, hence, the material
used in this report is unfortunately incomplete. Any legislative act that looks from the outset as
though it will fail to be adopted will not be put on the Council agenda, but is rather sent back to
the Commission ‘for further study’ (Heisenberg, 2005). Furthermore, although it is rarely the
case, it should also be noted that member states can still choose not to make their positions on a
proposal public. If a member state requests that its position is not officially recorded, the
minutes will simply state that “...the Council has adopted the above
[regulation/directive/decision]”. This occurred only 9 times in the period under study. Yet,
despite being rarely used, the fact that a member state is at least aware of this possibility maystill play a role in the decision-making process.
The second limitation is related to the issue of vote trading. No final conclusion has been drawn
with regard to the extent of vote trading in the Council, but recent findings suggest that it does
take place (Hayes-Renshaw & Wallace 2006). In reporting on Council activities, this aspect has
to be noted, but unfortunately cannot be incorporated in the results directly. The most
appropriate way to meet this limitation is therefore to report on the available information and
then subsequently consider the implications of vote trading when interpreting findings that may