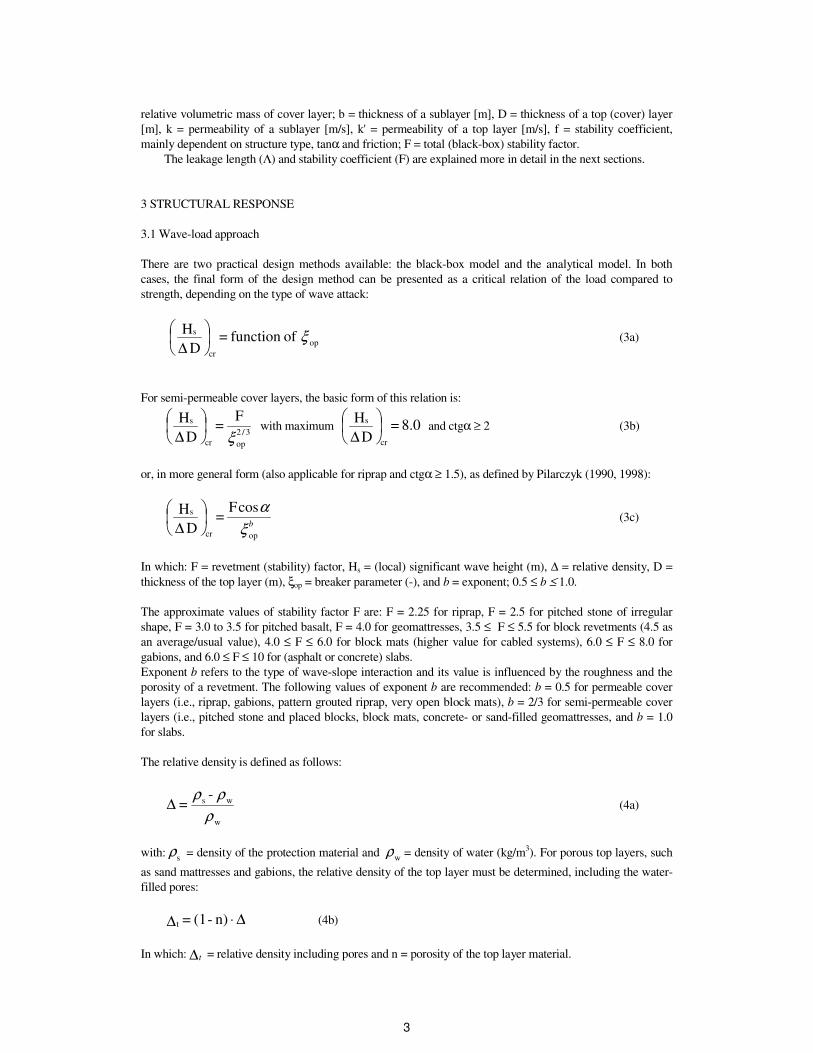
1 DESIGN OF (alternative) REVETMENTS K. W. Pilarczyk (former)Dutch Public Works Department (RWS), Hydraulic Engineering Institute, Delft; HYDROpil Consultancy, Nesciohove 23, 2726BJ Zoetermeer, The Netherlands; [email protected]1 INTRODUCTION The use of revetments, such as riprap, blocks and block mats, various mattresses, and asphalt in civil engineering practice is very common. The granular filters, and more recently the geotextiles, are more or less standard components of the revetment structure (PIANC, 1987,1992). Within the scope of the research on the stability of open slope revetments, much knowledge has been developed about the stability of placed (pitched) stone revetments under wave load (CUR/TAW, 1995) and stability of rock under wave and current load (CUR/CIRIA, 1991, CUR/RWS, 1995). Until recently, no or unsatisfactory design tools were available for a number of other (open) types of revetment and for other stability aspects. This is why the design methodology for placed block revetments has recently been extended in applicability by means of a number of desk-studies for other (open) revetments: • interlock systems and block mats; • gabions; • concrete mattresses; • geosystems, such as sandbags and sand sausages; and other stability aspects, such as: flow-load stability, soil-mechanical stability and residual strength. This chapter, based partly on the paper by Klein Breteler et al., 1998, aims at giving a summary of the increased knowledge, especially that concerning the design tools that have been made available. The details behind it can be found in Pilarczyk, 1998, Dikes&Revetments. Figure 1 Pressure development in a revetment structure 2 THEORETICAL BACKGROUND OF WAVE LOADING Wave attack on revetments will lead to a complex flow over and through the revetment structure (filter and cover layer). During wave run-up the resulting forces by the waves will be directed opposite to the gravity forces. Therefore the run-up is less hazardous then the wave run-down. Wave run-down will lead to two important mechanisms:
Transcript
1
DESIGN OF (alternative) REVETMENTS
K. W. Pilarczyk
(former)Dutch Public Works Department (RWS), Hydraulic Engineering Institute, Delft;
HYDROpil Consultancy, Nesciohove 23, 2726BJ Zoetermeer, The Netherlands; [email protected]
1 INTRODUCTION
The use of revetments, such as riprap, blocks and block mats, various mattresses, and asphalt in civil
engineering practice is very common. The granular filters, and more recently the geotextiles, are more or
less standard components of the revetment structure (PIANC, 1987,1992).
Within the scope of the research on the stability of open slope revetments, much knowledge has been
developed about the stability of placed (pitched) stone revetments under wave load (CUR/TAW, 1995) and
stability of rock under wave and current load (CUR/CIRIA, 1991, CUR/RWS, 1995).
Until recently, no or unsatisfactory design tools were available for a number of other (open) types of
revetment and for other stability aspects. This is why the design methodology for placed block revetments has
recently been extended in applicability by means of a number of desk-studies for other (open) revetments:
• interlock systems and block mats;
• gabions;
• concrete mattresses;
• geosystems, such as sandbags and sand sausages;
and other stability aspects, such as: flow-load stability, soil-mechanical stability and residual strength.
This chapter, based partly on the paper by Klein Breteler et al., 1998, aims at giving a summary of the
increased knowledge, especially that concerning the design tools that have been made available. The details
behind it can be found in Pilarczyk, 1998, Dikes&Revetments.
Figure 1 Pressure development in a revetment structure
2 THEORETICAL BACKGROUND OF WAVE LOADING
Wave attack on revetments will lead to a complex flow over and through the revetment structure (filter and
cover layer). During wave run-up the resulting forces by the waves will be directed opposite to the gravity
forces. Therefore the run-up is less hazardous then the wave run-down. Wave run-down will lead to two
important mechanisms:
2
• The downward flowing water will exert a drag force on the cover layer and the decreasing freatic level
will coincide with a downward flow gradient in the filter (or in a gabion). The first mechanism can be
schematised by a free flow in the filter or gabion with a typical gradient equalling the slope angle. It may
result in sliding.
• During maximum wave run-down there will be an incoming wave that a moment later will cause a wave
impact. Just before impact there is a 'wall’ of water giving a high pressure under the point of maximum
run-down. Above the run-down point the surface of the revetment is almost dry and therefore there is a
low pressure on the structure. The high pressure front will lead to an upward flow in the filter or a gabion.
This flow will meet the downward flow in the run-down region. The result is an outward flow and uplift
pressure near the point of maximum wave run-down (Figure 1).
The schematised situation can be quantified on the basis of the Laplace equation for linear flow:
0=z
+y
2
2
2
2
∂∂
∂∂ φφ
(1)
with: φ = φb = potential head induced in the filter or a gabion (m)
y = coordinate along the slope (m)
z = coordinate perpendicular to the slope (m)
Figure 2 Schematization of pressure head on a slope
After complicated calculations the uplift pressure in the filter or a gabions can be derived. The uplift pressure
is dependent on the steepness and height of the pressure front on the cover layer (which is dependent on the
wave height, period and slope angle, see Figure 2), the thickness of the cover layer and the level of the
phreatic line in the filter or a gabion. In case of riprap or gabions, it is not dependent on the permeability of
the cover layer, if the permeability is much larger then the subsoil. For semi-permeable cover layers the
equilibrium of uplift forces and gravity forces (defined by components of a revetment) leads to the following
(approximate) design formula (Pilarczyk et al 1998):
Λ∆ ξop
0.67
scr Df =
D
Hwith
'k
bDk=Λ (2a)
or ξ 0.67-
op
0.33
scr
k
k
b
Df =
D
H
′
∆ (2b)
or ξ 0.67-
op
scrF =
D
H
∆ (2c)
where Hscr = significant wave height at which blocks will be lifted out [m]; ξop = tanα/√(Hs/(1.56Tp2)) =
breaker parameter; Tp = wave period at the peak of the spectrum [s]; Λ = leakage length [m], ∆ = (ρs - ρ)/ρ =
3
relative volumetric mass of cover layer; b = thickness of a sublayer [m], D = thickness of a top (cover) layer
[m], k = permeability of a sublayer [m/s], k' = permeability of a top layer [m/s], f = stability coefficient,
mainly dependent on structure type, tanα and friction; F = total (black-box) stability factor.
The leakage length (Λ) and stability coefficient (F) are explained more in detail in the next sections.
3 STRUCTURAL RESPONSE
3.1 Wave-load approach
There are two practical design methods available: the black-box model and the analytical model. In both
cases, the final form of the design method can be presented as a critical relation of the load compared to
strength, depending on the type of wave attack:
ξop
s
cr
offunction = D
H
∆ (3a)
For semi-permeable cover layers, the basic form of this relation is:
ξ 3/2
op
s
cr
F =
D
H
∆ with maximum 8.0 =
D
Hs
cr
∆ and ctgα ≥ 2 (3b)
or, in more general form (also applicable for riprap and ctgα ≥ 1.5), as defined by Pilarczyk (1990, 1998):
ξ
αb
op
s
cr
cosF =
D
H
∆ (3c)
In which: F = revetment (stability) factor, Hs = (local) significant wave height (m), ∆ = relative density, D =
thickness of the top layer (m), ξop = breaker parameter (-), and b = exponent; 0.5 ≤ b ≤ 1.0.
The approximate values of stability factor F are: F = 2.25 for riprap, F = 2.5 for pitched stone of irregular
shape, F = 3.0 to 3.5 for pitched basalt, F = 4.0 for geomattresses, 3.5 ≤ F ≤ 5.5 for block revetments (4.5 as
an average/usual value), 4.0 ≤ F ≤ 6.0 for block mats (higher value for cabled systems), 6.0 ≤ F ≤ 8.0 for
gabions, and 6.0 ≤ F ≤ 10 for (asphalt or concrete) slabs.
Exponent b refers to the type of wave-slope interaction and its value is influenced by the roughness and the
porosity of a revetment. The following values of exponent b are recommended: b = 0.5 for permeable cover
layers (i.e., riprap, gabions, pattern grouted riprap, very open block mats), b = 2/3 for semi-permeable cover
layers (i.e., pitched stone and placed blocks, block mats, concrete- or sand-filled geomattresses, and b = 1.0
for slabs.
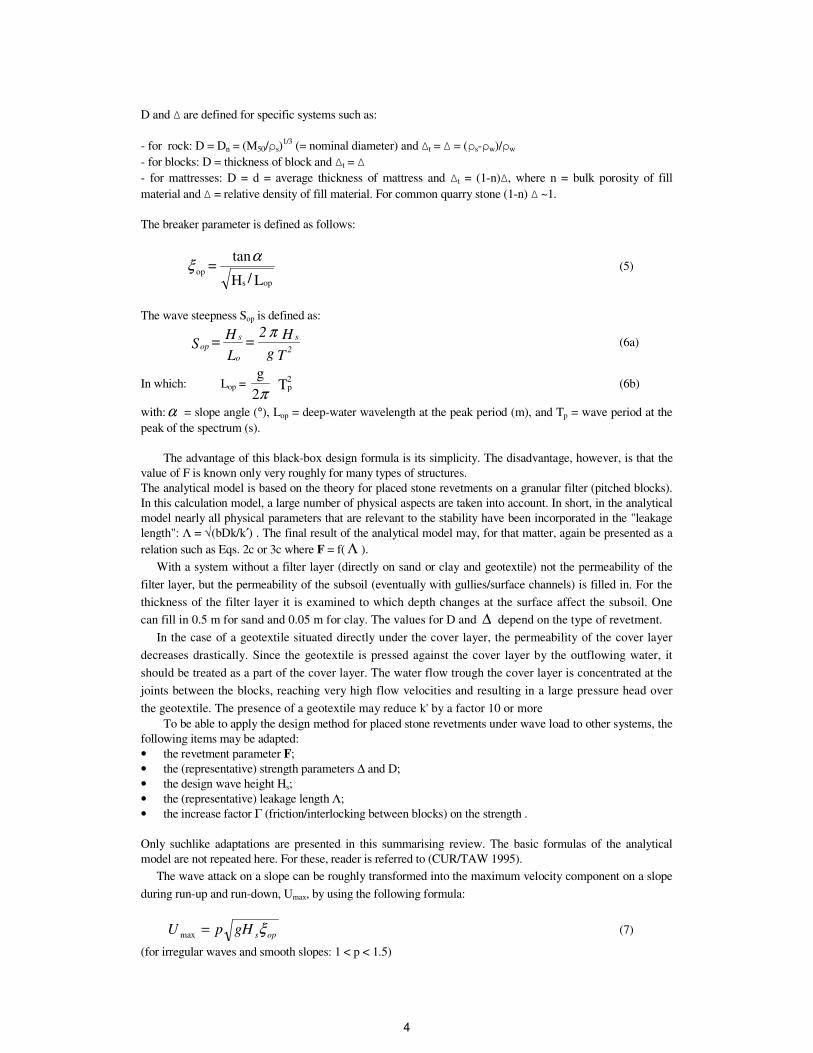
The relative density is defined as follows:
ρ
ρρ
w
ws -
= ∆ (4a)
with:s
ρ = density of the protection material and w
ρ = density of water (kg/m3). For porous top layers, such
as sand mattresses and gabions, the relative density of the top layer must be determined, including the water-
filled pores:
∆⋅∆ n) - (1 = t (4b)
In which: t∆ = relative density including pores and n = porosity of the top layer material.
4
D and ∆ are defined for specific systems such as:
- for rock: D = Dn = (M50/ρs)1/3
(= nominal diameter) and ∆t = ∆ = (ρs-ρw)/ρw
- for blocks: D = thickness of block and ∆t = ∆
- for mattresses: D = d = average thickness of mattress and ∆t = (1-n)∆, where n = bulk porosity of fill
material and ∆ = relative density of fill material. For common quarry stone (1-n) ∆ ~1.
The breaker parameter is defined as follows:
L/H
tan =
ops
op
αξ (5)
The wave steepness Sop is defined as:
T g
H 2 =
L
H = S
2
s
o
sop
π (6a)
In which: Lop = g
2 Tp
2
π (6b)
with:α = slope angle (°), Lop = deep-water wavelength at the peak period (m), and Tp = wave period at the
peak of the spectrum (s).
The advantage of this black-box design formula is its simplicity. The disadvantage, however, is that the
value of F is known only very roughly for many types of structures.
The analytical model is based on the theory for placed stone revetments on a granular filter (pitched blocks).
In this calculation model, a large number of physical aspects are taken into account. In short, in the analytical
model nearly all physical parameters that are relevant to the stability have been incorporated in the "leakage
length": Λ = √(bDk/k′) . The final result of the analytical model may, for that matter, again be presented as a
relation such as Eqs. 2c or 3c where F = f( Λ ).
With a system without a filter layer (directly on sand or clay and geotextile) not the permeability of the
filter layer, but the permeability of the subsoil (eventually with gullies/surface channels) is filled in. For the
thickness of the filter layer it is examined to which depth changes at the surface affect the subsoil. One
can fill in 0.5 m for sand and 0.05 m for clay. The values for D and ∆ depend on the type of revetment.
In the case of a geotextile situated directly under the cover layer, the permeability of the cover layer
decreases drastically. Since the geotextile is pressed against the cover layer by the outflowing water, it
should be treated as a part of the cover layer. The water flow trough the cover layer is concentrated at the
joints between the blocks, reaching very high flow velocities and resulting in a large pressure head over
the geotextile. The presence of a geotextile may reduce k' by a factor 10 or more
To be able to apply the design method for placed stone revetments under wave load to other systems, the
following items may be adapted:
• the revetment parameter F;
• the (representative) strength parameters ∆ and D;
• the design wave height Hs;
• the (representative) leakage length Λ;
• the increase factor Γ (friction/interlocking between blocks) on the strength .
Only suchlike adaptations are presented in this summarising review. The basic formulas of the analytical
model are not repeated here. For these, reader is referred to (CUR/TAW 1995).
The wave attack on a slope can be roughly transformed into the maximum velocity component on a slope
during run-up and run-down, Umax, by using the following formula:
opsgHpU ξ=max
(7)
(for irregular waves and smooth slopes: 1 < p < 1.5)
5
3.2 Flow-load stability
There are two possible approaches for determining the stability of revetment material under flow attack. The
most suitable approach depends on the type of load:
• flow velocity: 'horizontal' flow, flow parallel to dike;
• discharge: downward flow at slopes steeper than 1:10, overflow without waves; stable inner slope.
When the flow velocity is known, or can be calculated reasonably accurately, Pilarczyk's relation (Pilarczyk,
1990, 1999, Pilarczyk et al. 1998) is applicable:
g2
u
K
KK 0.035 = D
2cr
s
hT
ΨΦ
∆ (8)
in which: ∆ = relative density, D = characteristic thickness (m): for riprap D = Dn= nominal diameter as
defined previously, g = acceleration of gravity (g=9.81 m/s2), ucr = critical vertically-averaged flow velocity
a3 loose blocks on geotextile on compacted sand/clay 4.0 7.0 5.0
a4 linked/interlocked blocks on geotextile on good clay 5.0 8.0 6.0
or on fine granular filter
The results for structure type a3 (blocks on geotextile on sand) may only be applied if the wave load is
small (Hs < 1 or 1.5m (max.)) or to structures with a subsoil of coarse sand (D50> 0.3 mm) and a gentle slope
21
(tanα < 0.25), because geotechnical failure is assumed to be the dominant failure mechanism (instead of uplift
of blocks). The good compaction of sand is essential to avoid sliding or even liquefaction. For loads higher
than H = 1.2 m, a well-graded layer of stone on a geotextile is recommended (e.g. layer 0.3-0.5 m for 1.2 m <
H < 2.5 m).
Figure 12 Example of a stability function for type a3 (loose blocks on geotextile on sand)
The results for structure type a4 can be applied on the condition that clay of high quality and with a
smooth surface is used. A geotextile is recommended to prevent erosion during (long duration) wave loading.
The general design criteria for geotextiles on cohesive soils are given by Pilarczyk (1999/2000).
In the case of loose blocks an individual block can be lifted out of the revetment with a force exceeding its
own weight and friction. It is not possible with the cover layers with linked or interlocking blocks. Examples
of the second type are: block mattresses, ship-lap blocks and cable mats. However, in this case high forces
will be exerted on the connections between the blocks and/or geotextile. In the case of blocks connected to
geotextiles (i.e. by pins), the stability should be treated as for loose blocks in order to avoid the mechanical
abrasion of geotextiles by moving blocks. The lower boundary of stability of cabled mats can be increased by
a factor of 1.25 (or 1.5, if additionally grouted) in comparison with loose blocks. Such an increase of stability
is only allowable when special measures are taken with respect to the proper connection between the mats.
The upper boundary of stability (F = 8) remains the same for all systems. Application of this higher stability
requires optimization of design. This optimization technique (incl. application of geometrically open but
stable filters and geotextiles) can be found in (CUR, 1993 and CUR/TAW, 1995).
To be able to apply the design method for placed stone revetments under wave load to other semi-
permeable systems, the following items may be adapted: the revetment parameter F, the (representative)
strength parameters ∆ and D, the design wave height Hs and the (representative) leakage length Λ. The basic
formulas of the analytical model are presented in CUR/TAW, 1995 and Pilarczyk, 1998. Table 4 gives an
overview of useable values for the revetment constant F in the black-box model for linked blocks (block
mats).
22
Table 4 Recommended values for the revetment parameter F for blockmats (the lower values refer to blocks
connected to geotextile while the higher ones refer to cabled blocks).
Type of revetment F (-)
Linked blocks on geotextile on sand 5 to 6
Linked blocks on geotextile on clay
good clay 5 to 6
Mediocre (sandy) clay 4.5 to 5
Linked blocks on a granular filter
favourable construction 5 to 6
normal construction 4 to 5
unfavourable construction 3 to 4
The terms "favourable", "normal" and "unfavourable" refer to the composition of the granular filter and the
permeability-ratio of the top layer and the filter layer (see CUR/TAW, 1995). In a case of fine granular filter
and relatively permeable top layer the total composition can be defined as "favourable'. In a case of very
coarse granular layer and less permeable top layer the composition can be defined as "unfavourable". In a
case of blocks connected to a geotextile and concrete-filled mattresses on a filter layer the construction can be
usually defined as between "unfavourable" and "normal", and the stability factor F = 3.0 to 3.5 (max. 4.0) can
be applied. For blockmats and permeable mattresses on sand F = 5 (max. 6.0) can be applied. The higher
values can also be used in cases that the extreme design loading is not very frequent or when the system is
(repeatedly) washed in by coarse material providing additional interlocking.
This wide range of recommended values for F only gives a first indication of a suitable choice.
Furthermore it is essential to check the geotechnical stability with the design diagrams (see for example
Figure 4 and for a full set of diagrams see Pilarczyk (1998, 1999/2000).
5 STABILITY CRITERIA FOR CONCRETE-FILLED MATTRESSES
5.1 Concrete Mattresses
Characteristic of concrete mattresses are the two geotextiles with concrete or cement between them. The
geotextiles can be connected to each other in many patterns, which results in a variety of mattress systems,
each having its own appearance and properties. Some examples are given in Figure 13.
Figure 13 Examples of concrete-filled mattresses
23
The permeability of the mattress is one of the factors that determine the stability. It is found that the
permeability given by the suppliers is often the permeability of the geotextile, or of the so-called Filter Points
(Figure 14). In both cases, the permeability of the whole mattress is much smaller. A high permeability of the
mattress ensures that any possible pressure build-up under the mattress can flow away, as a result of which the
uplift pressures across the mattress remain smaller.
In general, with a subsoil of clay and silty sand the permeability of the mattress will be higher than the
permeability of the subsoil. Therefore the water under the mattress can usually be discharged without
excessive lifting pressures on the mattress.
The permeability of the mattress will be lower than the permeability of the subsoil or sub layers if a granular
filter is applied, or with a sand or clay subsoil having an irregular surface (gullies/cavities between the soil
and the mattress). This will result in excessive lifting pressures on the mattress during wave attack.
Figure 14, Principles of permeability of Filter Point Mattress
24
5.2 Design rules with regard to wave load
The failure mechanism of the concrete mattress is probably as follows:
• First, cavities under the mattress will form as a result of uneven subsidence of the subsoil. The mattress is
rigid and spans the cavities.
• With large spans, wave impacts may cause the concrete to crack and the spans to collapse. This results in
a mattress consisting of concrete slabs which are coupled by means of the geotextile.
• With sufficiently high waves, an upward pressure difference over the mattress will occur during wave run-
down, which lifts the mattress (Figure 1).
• The pumping action of these movements will cause the subsoil to migrate, as a result of which an S-
profile will form and the revetment will collapse completely.
It is assumed that local settlement of the subsoil will lead to free spans of the concrete mattress. Then, the
wave impact can cause the breaking of these spans, if the ratio of Hs/D is too large for a certain span length. A
calculation method is derived on the basis of an empirical formula for the maximum wave impact pressure
and the theory of simply supported beams. The collapsing of small spans (less then 1 or 2 m) is not
acceptable, since these will lead to too many cracks.
The empirical formula for the wave impact is (Klein Breteler et al 1998):
αρ
tan2.7 2
s
impactH
g
F= (25)
With: Fimpact = impact force per m revetment (N).
Calculation has resulted in an average distance between cracks of only 10 to 20 cm for a 10 cm thick mattress
and wave height of 2 m. This means that at such a ratio of Hs/D the wave impacts will chop the mattress to
pieces. For a mattress of 15 cm thick and a wave height of 1.5 m the crack distance will be in the order of 1
m.
Apart from the cracks due to wave impacts, the mattress should also withstand the uplift pressures due to
wave attack. These uplift pressures are calculated in the same way as for block revetments. For this damage
mechanism the leakage length is important.
In most cases the damage mechanism by uplift pressures is more important then the damage mechanism by
impact.
The representative/characteristic values of the leakage length for various mattresses can be assumed as
follow:
Leakage length Λ (m)
Mattress on sand*) on sand**) on filter
Standard - FP 1.5 3.9 2.3
FPM 1.0 3.9 2.0
Slab 3.0 9.0 4.7
Articulated (Crib) 0.5 1.0 0.5
*) good contact of mattress with sublayer (no gullies/cavities underneath) **) pessimistic assumption: poor compaction of subsoil and presence of cavities under the mattress
25
Figure 15 Calculation results for concrete mattresses (Hs/∆D < 4 because of acceptable crack distance due to
impacts on spans).
Taking into consideration the above failure mechanisms, the following design (stability) formula has been
derived for the mattresses (Eq. 3b):
4D
H:
F =
D
H
max
s
3/2
op
s =
∆∆with
ξ (26)
with:
D = ρ
s
2mper mass
(which can be called Deffective or Daverage)
∆ = relative volumetric mass of the mattress (-) = (ρs - ρ)/ρ
ρs = volumetric mass of concrete (kg/m3)
F = stability factor (see below)
For an exact determination of the leakage length, one is referred to the analytical model (Klein Breteler et al
1998). However, besides the mattresses of a type as, for example, the tube mat (Crib) with relative large
permeable areas, the other types are not very sensitive to the exact value of the leakage length. It can be
recommended to use the following values of F in design calculations:
• F = 2.5 or (≤ 3) - for low-permeable mattresses on (fine) granular filter,
• F = 3.5 or (≤ 4) - for low-permeable mattress on compacted sand,
• F = 4.0 or (≤ 5) - for permeable mattress on sand or fine filter (Df15 < 2 mm).
The higher values can be applied for temporary applications or when the soil is more resistant to erosion (i.e.
clay), and the mattresses are properly anchored.
26
6 STABILITY OF GABIONS
6.1 Introduction
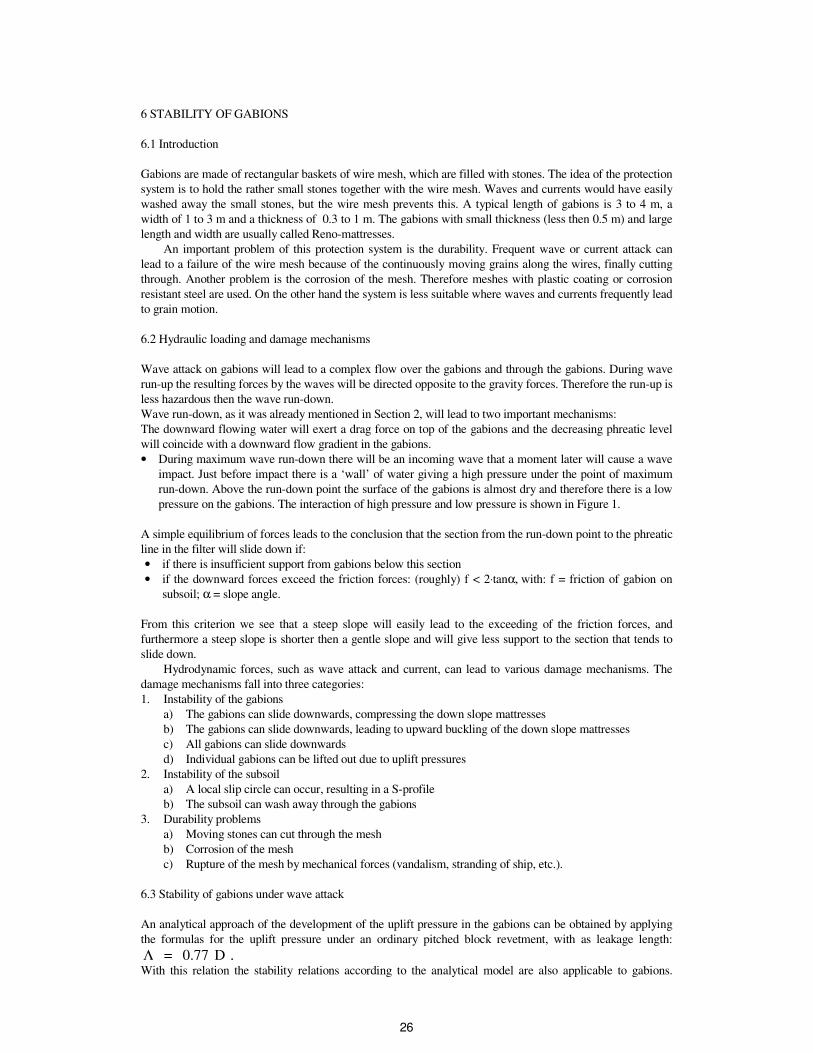
Gabions are made of rectangular baskets of wire mesh, which are filled with stones. The idea of the protection
system is to hold the rather small stones together with the wire mesh. Waves and currents would have easily
washed away the small stones, but the wire mesh prevents this. A typical length of gabions is 3 to 4 m, a
width of 1 to 3 m and a thickness of 0.3 to 1 m. The gabions with small thickness (less then 0.5 m) and large
length and width are usually called Reno-mattresses.
An important problem of this protection system is the durability. Frequent wave or current attack can
lead to a failure of the wire mesh because of the continuously moving grains along the wires, finally cutting
through. Another problem is the corrosion of the mesh. Therefore meshes with plastic coating or corrosion
resistant steel are used. On the other hand the system is less suitable where waves and currents frequently lead
to grain motion.
6.2 Hydraulic loading and damage mechanisms
Wave attack on gabions will lead to a complex flow over the gabions and through the gabions. During wave
run-up the resulting forces by the waves will be directed opposite to the gravity forces. Therefore the run-up is
less hazardous then the wave run-down.
Wave run-down, as it was already mentioned in Section 2, will lead to two important mechanisms:
The downward flowing water will exert a drag force on top of the gabions and the decreasing phreatic level
will coincide with a downward flow gradient in the gabions.
• During maximum wave run-down there will be an incoming wave that a moment later will cause a wave
impact. Just before impact there is a ‘wall’ of water giving a high pressure under the point of maximum
run-down. Above the run-down point the surface of the gabions is almost dry and therefore there is a low
pressure on the gabions. The interaction of high pressure and low pressure is shown in Figure 1.
A simple equilibrium of forces leads to the conclusion that the section from the run-down point to the phreatic
line in the filter will slide down if:
• if there is insufficient support from gabions below this section
• if the downward forces exceed the friction forces: (roughly) f < 2⋅tanα, with: f = friction of gabion on
subsoil; α = slope angle.
From this criterion we see that a steep slope will easily lead to the exceeding of the friction forces, and
furthermore a steep slope is shorter then a gentle slope and will give less support to the section that tends to
slide down.
Hydrodynamic forces, such as wave attack and current, can lead to various damage mechanisms. The
damage mechanisms fall into three categories:
1. Instability of the gabions
a) The gabions can slide downwards, compressing the down slope mattresses
b) The gabions can slide downwards, leading to upward buckling of the down slope mattresses
c) All gabions can slide downwards
d) Individual gabions can be lifted out due to uplift pressures
2. Instability of the subsoil
a) A local slip circle can occur, resulting in a S-profile
b) The subsoil can wash away through the gabions
3. Durability problems
a) Moving stones can cut through the mesh
b) Corrosion of the mesh
c) Rupture of the mesh by mechanical forces (vandalism, stranding of ship, etc.).
6.3 Stability of gabions under wave attack
An analytical approach of the development of the uplift pressure in the gabions can be obtained by applying
the formulas for the uplift pressure under an ordinary pitched block revetment, with as leakage length:
Λ = 0.77 D .
With this relation the stability relations according to the analytical model are also applicable to gabions.
27
Substitution of values, which are reasonable for gabions, in the stability relations according to (CUR/CIRIA
1991) provides stability relations which indeed match the a line through the measured points.
After complicated calculations the uplift pressure in the gabions can be derived (Klein Breteler et al, 1998).
The uplift pressure is dependent on the steepness and height of the pressure front on the gabions (which is
dependent on the wave height, period and slope angle), the thickness of the gabions and the level of the freatic
line in the gabions. It is not dependent on the permeability of the gabions, if the permeability is larger then the
subsoil. The equilibrium of uplift forces and gravity forces leads to the following (approximate) design
formula :
ξ 2/3-
op
sF=
D
H ⋅∆
with 6 < F < 9 and slope of 1:3 (tanα = 0.33) (27a)
or, using Pilarczyk’s equation (3c) with b=2/3 and F = 9 (see Figure 16):
=
∆ ξα
b
op
s
cr
cosF =
D
H
ξ
α3/2
op
cos9 (27b)
with: Hs = significant wave height of incoming waves at the toe of the structure (m)
∆ = relative density of the gabions (usually: ∆ ≈ 1)
D = thickness of the gabion (m)
F = stability factor
ξop = breaker parameter = tanα/√(Hs/(1.56Tp2)
Tp = wave period at the peak of the spectrum (s)
For practical applications F ≤ 7 is recommended in (27b).
It is not expected that instability will occur at once if the uplift pressure exceeds the gravity forces. On the
other hand, the above result turns out to be in good agreement with the experimental results.
Figure 16: Summary of test results ((Ashe 1975) and (Brown 1979)) and design curves
The experimental verification of stability of gabions is rather limited. Small scale model tests have been
performed by Brown (1979) and Ashe (1975), see Figure 16.
28
6.4 Motion of filling material
It is important to know if the filling material will start to move during frequent environmental conditions,
because it can lead to rupture of the wire mesh. Furthermore the integrity of the system will be effected if
large quantities of filling material is moved.
During wave attack the motion of the filling material usually only occurs if ξop < 3 (plunging waves). Based
on the Van der Meer's formula for the stability of loose rock (CUR/CIRIA, 1991) and the assumption that the
filling of the gabion will be more stable then loose rock, the following criterion is derived (Van der Meer
formula with permeability factor: 0.1 < P < 0.2; number of waves: 2000 < N < 5000; and damage level: 3 < S
< 6):
ξ
opff
s F=
D
H
∆ with 2 < F < 5 (28)
with:
Hs = significant wave height of incoming waves at the toe of the structure (m)
∆f = relative density of the grains in the gabions (usually: ∆ ≈ 1.65)
Df = diameter of grains in the gabion (m)
F = stability factor
ξop = breaker parameter = tanα/√(Hs/(1.56Tp2)
Tp = wave period at the peak of the spectrum (s)
In all situations the stone size must be larger than the size of the wire mesh in the basket; this defines the
minimum size.
7 SCOUR AND TOE PROTECTION
Toe protection consists of the armouring of the beach or bottom surface in front of a structure which
prevents it from scouring and undercutting by waves and currents. Factors that affect the severity of toe
scour include wave breaking (when near the toe), wave run-up and backwash, wave reflection, and grain
size distribution of the beach or bottom materials.
Toe stability is essential because failure of the toe will generally lead to failure throughout the entire
structure. Toe scour is a complex process. Specific (generally valid) guidance for scour prediction and toe
design based on either prototype or model results have not been developed as yet, but some general
(indicative) guidelines for designing toe protection are given in SPM (1984) and CUR/RWS (1995).
The maximum scour force occurs where wave downrush on the structure face extends to the toe and/or
the wave breaks near the toe (i.e. shallow water structure). These conditions may take place when the
water depth at the toe is less than twice the height of the maximum expected unbroken wave that can exist
at that water depth. The width of the apron for shallow water structures with a high reflection coefficient,
which is generally true for slopes steeper than about 1 on 3, can be planned based on the structure slope
and the expected scour depth. The maximum depth of a scour trough due to wave action below the natural
bed is about equal to the maximum expected unbroken wave at the site. To protect the stability of the
face, the toe soil must be kept in place beneath a surface defined by an extension of the face surface into
the bottom to the maximum depth of scour. This can be accomplished by burying the toe, when
construction conditions permit, thereby extending the face into an excavated trench the depth of the
expected scour. Where an apron must be placed on the existing bottom, or can only be partially buried, its
width should not be less than twice the wave height. Some solutions for toe protection can be found in
Large-scale tests of large geobags (geocontainers)
Large scale tests geocontainers in Delta Flume http://www.delftcluster.nl/website/files/files_org/consortium/Final_H4595_low.pdf
P. van Steeg, M. Klein Breteler, 2008, Large scale physical model tests on the stability of geocontainers, , H4595, Delft Cluster,May 2008; http://www.delftcluster.nl/website/files/files_org/consortium/Final_H4595_low.pdf
CUR, 1995, Design manual for pitched slope protection, CUR report 155, ISBN 90 5410 606 9, Centre for Civil
Engineering Research and Codes (CUR), P.O.Box 420, Gouda, the Netherlands.
CUR, 2006, Ontwerpen met geotextile Zandelementen (report CUR 217) (Design of sand-filled
geo-elements; actually under translation), Centre for Civil Engineering Research and Codes
(CUR), P.O.Box 420, Gouda, NL.
Recio Molina, Juan Antonio, 2007, Hydraulic Stability of Geotextile Sand Containers for
Coastal Structures - Effect of Deformations and Stability Formulae -, PhD-thesis,
Leichtweiß-Institut für Wasserbau, Technical University of Braunschweig, Germany;
http://www.digibib.tu-bs.de/?docid=00021899.
H. Oumeraci, M. Hinz, M. Bleck and A. Kortenhaus, 2003, Sand-filled Geotextile Containers for Shore Protection, Proceedings ‘Coastal Structures 2003’, Portland, Oregon, USA http://www.fzk.uni-hannover.de/uploads/tx_tkpublikationen/sf_geocont_03.pdf http://www.fzk.uni-hannover.de/286.html?&L=1
Grüne J., Sparboom, U., Schmidt-Koppenhagen, R., Wang, Z., Oumeraci H., 2006: Scour Protection for Offshore Wind Energy Monopile Structures with Geotextile Sandcontainers, Offshore Wind and other marine renewable Energies in Mediterranean and European Seas (OWEMES), Civitavecchia , (2006)
Na een eerdere uitgave over ontwerpaspecten (CUR 214) is nu verschenen publicatie 217
'Ontwerpen met geotextiele zandelementen'. Met deze geotextiele constructies, die ter
plekke met zand worden gevuld, kunnen diverse typen beschermingsconstructies worden aangelegd. Met deze publicatie 217 (prijs 50,-euro) heeft de waterbouwkundig ontwerper
een complete leidraad. Als u publicaties 214 en 217 tegelijk bestelt, betaalt u slechts 75,-
euro (incl. BTW en verzendkosten).
http://www.hydraulicengineering.tudelft.nl
http://www.kennisbank-waterbouw.nl/
http://www.kennisbank-waterbouw.nl/rockmanual
www.kennisbank-waterbouw.nl/Software
(http://www.kennisbank-waterbouw.nl/Software/SwanOne.zip) http://www.waterbouw.tudelft.nl/ http://www.delftcluster.nl/ http://www.unesco-ihe.org/we/dicea/int03/default.htm?http://www.unesco-ihe.org/we/dicea/int03/int0301.htm http://mail.vssd.nl/hlf/f011contents.pdf http://www.waterbouw.tudelft.nl/public/verhagen/ http://books.google.nl/books?ct=title&q=Coastal+Protection+,+Pilarczyk&lr=&sa=N&start=0 http://www.citg.tudelft.nl/live/pagina.jsp?id=4de0d195-5207-4e67-84bb-455c5403ae47&lang=en http://www.library.tudelft.nl/ws/search/publications/theses/index.htm?to=2008&de=Hydraulic+Engineering&n=10&fr=2008&s=1&p=2 [20] The stability of synthetic gabions in waves Oosthoek, J. | Civil Engineering and Geosciences | Stive, M.J.F., prof.dr.ir. (senior mentor); Uijttewaal, W.S.J., dr.ir. (mentor); Verhagen, H.J., ir. (mentor); De Meerleer, F., ing. (mentor); Texion Geosynthetics (company) | gabion; mattress; stability; stability; geogrid | 2008 | Master thesis | application/pdf | TU Delft, Civil Engineering and Geosciences, Hydraulic Engineering [23] Toe structure for rubble mound breakwaters: analysis of toe bund design tools and a method for toe rock stability description Baart, S.A. | Civil Engineering and Geosciences | Stive, M.J.F., prof.dr.ir. (senior mentor); Verhagen, H.J., ir.(mentor); Uijttewaal, J.S.W., dr.ir.(mentor); Bos, J.P. van den (other person involved); Royal Boskalis Westminster (company); Olthof, J. ir. (mentor) | toe bund; rubble mound breakwater; rock stability; water motion; coastal structure | 2008 | Master thesis | application/pdf | TU Delft, Civil Engineering and Geosciences, Hydraulic Engineering
37
[29] Elastocoast pilots in the Netherlands, storm season 2007/2008 Bijlsma, E. | Civil Engineering and Geosciences | Vrijling, J.K., prof.dr.ir. (senior mentor); Verhagen, H.J., ir. (mentor); Den Uijl, J.A., ir. (mentor); Voortman, H.G., dr.ir. (mentor); ARCADIS, Elastogran GmbH (company) | elastocoast; polymer; revetment; pilot; Netherlands | 2008 | Master thesis | application/pdf | TU Delft, Civil Engineering and Geosciences, Hydraulic Engineering [30] The Elastocoast® system: a study of possible failure mechanisms E. Bijlsma | Civil Engineering and Geosciences | Vrijling, J.K., prof.dr.ir.; Verhagen, H.J., ir. (mentor); Den Uijl, J.A., ir. (mentor); Voortman, H.G., dr.ir. (mentor); ARCADIS, Elastogran GmbH (company) | elastocoast; polymer; dike; revetment; failure mechanisms | 2008 | Master thesis | application/pdf | TU Delft, Civil Engineering and Geosciences, Hydraulic Engineering http://www.vandermeerconsulting.nl/ http://www.oas.org/cdcm_train/ http://users.coastal.ufl.edu/~sheppard/eoc6430main.htm
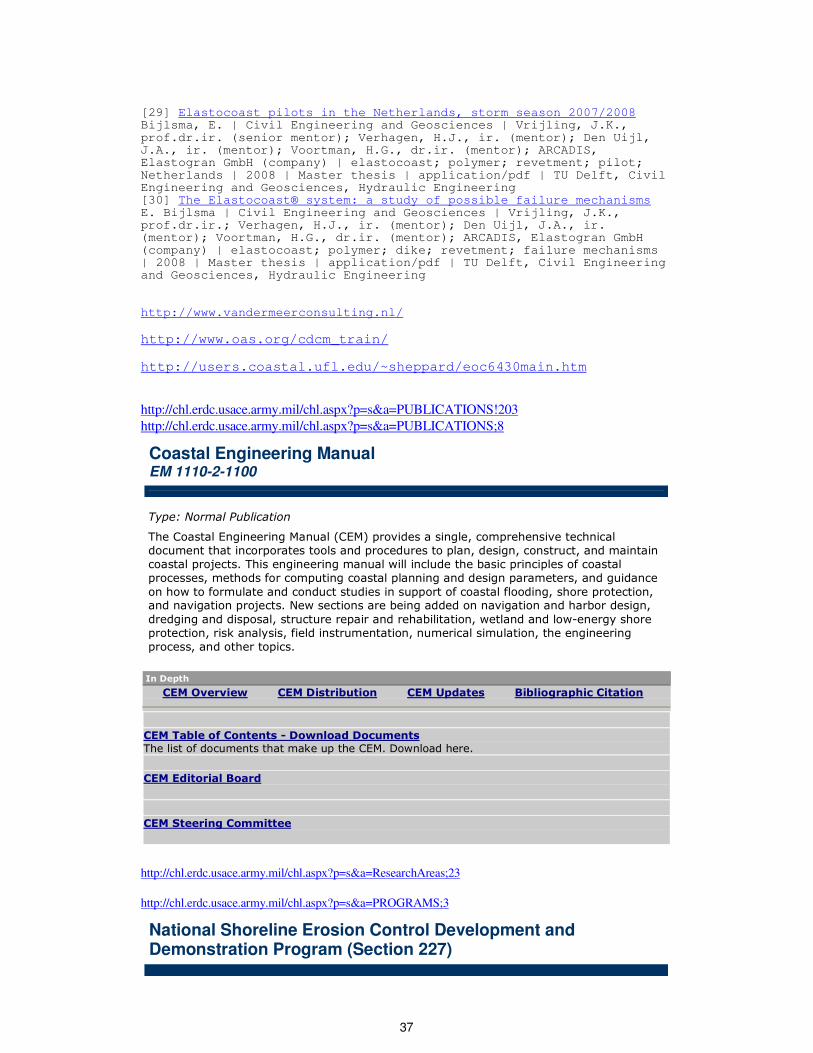
The Coastal Engineering Manual (CEM) provides a single, comprehensive technical
document that incorporates tools and procedures to plan, design, construct, and maintain
coastal projects. This engineering manual will include the basic principles of coastal
processes, methods for computing coastal planning and design parameters, and guidance
on how to formulate and conduct studies in support of coastal flooding, shore protection, and navigation projects. New sections are being added on navigation and harbor design,
dredging and disposal, structure repair and rehabilitation, wetland and low-energy shore
protection, risk analysis, field instrumentation, numerical simulation, the engineering
process, and other topics. In Depth
CEM Overview CEM Distribution CEM Updates Bibliographic Citation
CEM Table of Contents - Download Documents The list of documents that make up the CEM. Download here. CEM Editorial Board
Appendix Comparative stability of revetments (Pilarczyk, 1990, Coastal Protection)
Note: Ψu= stability upgrading factor in comparison with riprap
42
From Rock Manual 2007 Numbering equations relates to draft version, therefore Eq. 5.193 is 5.183 in the final RM 2007 Eq. 5.194 is 5.1.84 Eq. 5.195 is 5.185
43
44
Note: the use of Fig. 5.68 is questionable, and it should not be used; for dimensionering, follow the guiding provided in the text!