Page 1
Design and Development of Membrane Electrode Assembly for Proton Exchange
Membrane Fuel Cell
by
Harshal Anil Kasat
A Thesis Presented in Partial Fulfillment
of the Requirements for the Degree
Master of Science
Approved July 2016 by the
Graduate Supervisory Committee:
A.M. Kannan, Co-Chair
Patrick Phelan, Co-Chair
Abdelrahman Shuaib
ARIZONA STATE UNIVERSITY
August 2016
Page 2
i
ABSTRACT
This work aimed to characterize and optimize the variables that influence
the Gas Diffusion Layer (GDL) preparation using design of experiment (DOE) approach.
In the process of GDL preparation, the quantity of carbon support and Teflon were found
to have significant influence on the Proton Exchange Membrane Fuel Cell (PEMFC).
Characterization methods like surface roughness, wetting characteristics, microstructure
surface morphology, pore size distribution, thermal conductivity of GDLs were examined
using laser interferometer, Goniometer, SEM, porosimetry and thermal conductivity
analyzer respectively. The GDLs were evaluated in single cell PEMFC under various
operating conditions of temperature and relative humidity (RH) using air as oxidant.
Electrodes were prepared with different PUREBLACK® and poly-tetrafluoroethylene
(PTFE) content in the diffusion layer and maintaining catalytic layer with a Pt-loading (0.4
mg cm-2). In the study, a 73.16 wt.% level of PB and 34 wt.% level of PTFE was the optimal
compositions for GDL at 70 °C for 70% RH under air atmosphere.
For most electrochemical processes the oxygen reduction is very vita
reaction. Pt loading in the electrocatalyst contributes towards the total cost of
electrochemical devices. Reducing the Pt loading in electrocatalysts with high efficiency
is important for the development of fuel cell technologies. To this end, this thesis work
reports the approach to lower down the Pt loading in electrocatalyst based on N-doped
carbon nanotubes derived from Zeolitic Imidazolate Frameworks (ZIF-67) for oxygen
reduction. This electrocatalyst perform with higher electrocatalytic activity and stability
for oxygen reduction in fuel cell testing. The electrochemical properties are mainly due to
Page 3
ii
the synergistic effect from N-doped carbon nanotubes derived from ZIF and Pt loading.
The strategy with low Pt loading forecasts in emerging highly active and less expensive
electrocatalysts in electrochemical energy devices.
This thesis focuses on: (i) methods to obtain greater power density by
optimizing content of wet-proofing agent (PTFE) and fine-grained, hydrophobic,
microporous layer (MPL); (ii) modeling full factorial analysis of PEMFC for evaluation
with experimental results and predicting further improvements in performance; (iii)
methods to obtain high levels of performance with low Pt loading electrodes based on N-
doped carbon nanotubes derived from ZIF-67 and Pt.
Page 4
iii
DEDICATION
I would like to dedicate this to my parents Anil and Mangala Kasat who ensured
that I was provided with every tool required to achieve. They have been there for me my
entire life, and their unwavering support has given me the confidence to tackle tough times
at Arizona State University. And I would like to thank all my friends, without whom none
of my success would be possible. Finally, and most importantly, loving thanks to Harsha
C. Pol, for her constant and overflowing support and encouragement.
Page 5
iv
ACKNOWLEDGMENTS
I would first like to express my sincere thanks to Professor A.M. Kannan for his
astounding support and help in this project. He helped me overcome the difficulties I faced
during the entire project. His willingness to help me every time I encountered an issue
helped me a lot to get through with this project. Without his guidance and profound help,
it would not have been possible for me to complete this project. In addition, I would like
to thank Professor Patrick Phelan, Professor Abdelrehman Shuaib who obliged me with
being part of my committee.
I would also like to thank my lab mate in Dr. Kannan’s research group: Brahim
Laoun for helping me out with my project, giving me useful suggestions that helped me
complete the project successfully.
I would also like to express my gratitude to Mr. Riaz Ahmad from Quantachrome
Instruments for pore size distribution measurements which was a crucial result of this
report.
Page 6
v
TABLE OF CONTENTS
Page
LIST OF TABLES…………………………………………………………………….. viii
LIST OF FIGURES…………………………………………………………..…………..ix
CHAPTER
1 INTRODUCTION ...................................................................................................... 1
1.1 Background and Motivation ........................................................................................................... 1
1.2 Proton Exchange Membrane Fuel Cells (PEMFC) .............................................................. 4
1.3 Gas Diffusion Layer ........................................................................................................................... 5
1.3.1 Carbon Support Material .................................................................................................................. 7
1.4 Proton Exchange Membranes .............................................................................. 9
1.4.1 Catalyst Layer .................................................................................................................................... 10
1.5 Problem Statement............................................................................................................................ 11
1.6 Organization of the Thesis ............................................................................................................ 14
2 LITERATURE REVIEW ......................................................................................... 16
2.1 Datta Et. Al. Paper on Understanding of GDL in PEMFC ........................................... 16
2.2 Kannan Et. Al. Review of Characterization Techniques for GDL for PEMFC .. 18
2.2.1 Thermal Conductivity ..................................................................................................................... 18
2.2.2 Porosity and Pore Size Distribution ......................................................................................... 19
2.2.3 Surface Morphology........................................................................................................................ 19
2.2.4 Contact Angle ..................................................................................................................................... 20
Page 7
vi
CHAPTER Page
2.3 Kannan Et. Al. Paper on GDL Using New Type of Graphitized Nano-Carbon
Pureblack® for PEMFC ................................................................................................................................ 20
2.4 Kannan Et. Al. Paper on Effect of Carbon Substrate of GDL on Performance of
PEMFC ................................................................................................................................................................ 20
2.5 Kannan Et. Al. Paper on Wire Rod Coating Process of Gas Diffusion Layer for
PEMFCS ............................................................................................................................................................. 21
2.6 Lim Et. Al. Paper on Effects of Hydrophobic Polymer Content in GDL on
Power Performance of a PEM Fuel Cell .............................................................................................. 22
2.7 Kannan Et. Al. Paper on Development of GDL Using Water Based Carbon
Slurry for PEMFC .......................................................................................................................................... 23
2.8 Cho Et. Al. Paper on Optimization of GDLs for High Performance PEMFC
Employing Stainless Steel Bipolar Plates ........................................................................................... 23
2.9 Xia Et. Al. Paper on MOF Derived Bifunctional Oxygen Electrocatalyst ............ 25
3 METHODOLOGY ................................................................................................... 27
3.1 Experimental Protocol for Gdl Optimization ...................................................................... 27
3.1.1 Gas Diffusion Layer ........................................................................................................................ 27
3.1.2 Catalyst Coated Membrane .......................................................................................................... 30
3.1.3 Fuel Cell Assembly and Testing ................................................................................................ 31
3.2 Experimental Protocol for PT-NCNTFS Cathode Catalyst Using ZIF-67 ............ 33
3.2.1 Gas Diffusion Layer ........................................................................................................................ 33
3.2.2 Catalyst Coated Membrane .......................................................................................................... 35
Page 8
vii
CHAPTER Page
3.2.3 Fuel Cell Assemby and Testing ................................................................................................ 36
4 RESULTS AND DISCUSSION ............................................................................... 38
4.1 GDL Optimization ............................................................................................................................ 38
4.2 PT-NCNTFS Cathode Catalyst Using ZIF-67 .................................................................... 46
5 CONCLUSION ......................................................................................................... 51
6 REFERENCES ......................................................................................................... 53
Page 9
viii
LIST OF TABLES
Table Page
1 Physico-Chemical Properties of PUREBLACK® 205-110 Carbon ................................. 8
2 Values of Various Individual Parameters at Two Levels .............................................. 30
3 22 -Factorial Design: GDL Samples Were Fabricated with Following Different
Concentration of PB and PTFE......................................................................................... 30
4 Fuel Cell Performance Data of MEA with Various GDL Compositions ...................... 39
5 Final Design of GDL ..................................................................................................... 40
Page 10
ix
LIST OF FIGURES
Figure Page
1 Observed Changes in (a) Global Average Surface Temperature, (b) Global Average Sea
Level from Tide Gauge (Blue) and Satellite (Orange) Data and (c) Northern Hemisphere
Snow Cover ......................................................................................................................... 2
2 Schematic of a PEM Fuel Cell ......................................................................................... 5
3 Carbon Paper with Microporous Layer............................................................................ 6
4 Schematic Representation of Micelle-Encapsulated PUREBLACK® and VGCF
Carbons ............................................................................................................................... 9
5 Primary Chemical Structure of Nafion .......................................................................... 10
6 Water Management in PEMFC ...................................................................................... 12
7 Process of Coating Carbon Paper with Microporous Layer .......................................... 28
8 Design of Experiments Approach .................................................................................. 29
9 CCM Micro-Spray Method ............................................................................................ 31
10 Greenlight Test Station (G50 Fuel Cell System, Hydrogenics, and Vancouver,
Canada) ............................................................................................................................. 33
11 Easycaoter Equipment (EC26, Coatema) Used for Coating GDL ............................... 34
12 Synthesis of Pt-NCNTFs Using ZIF-67 ....................................................................... 36
13 Fuel Cell Performance Using Various Content of PB and PTFE in GDL at 70 °C with
H2 and Air Gases, 70 % RH. The Open Symbols Are the Power Density Values ........... 39
14 Fuel Cell Performance of Optimized GDL at 70 °C with H2 and Air Gases, 70 % RH.
The Open Symbols Are the Power Density Values .......................................................... 40
Page 11
x
Figure Page
15 (a) Specific and (b) Cumulative Pore-Size Distribution of Diffusion Layer from
Mercury-Intrusion Porosimetry Measurements ................................................................ 41
16 Contact Angle Images of (a) GDL#1 (b) GDL#2 (c) GDL#3 (d) GDL#4 .................. 43
17 Wetting Angle Images of (a) Optimized GDL#1 (b) Optimized GDL#2 .................... 44
18 Scanning Electron Micrographs of Surface of Optimized Diffusion Layer #2 at (a) 25x
(b) 1000x ........................................................................................................................... 45
19 Scanning Electron Micrographs of (a,b) Pt-NCNTFs, and Transmission Electron
Micrographs of (c) NCNTFs and (d) Pt-NCNTFs ............................................................ 47
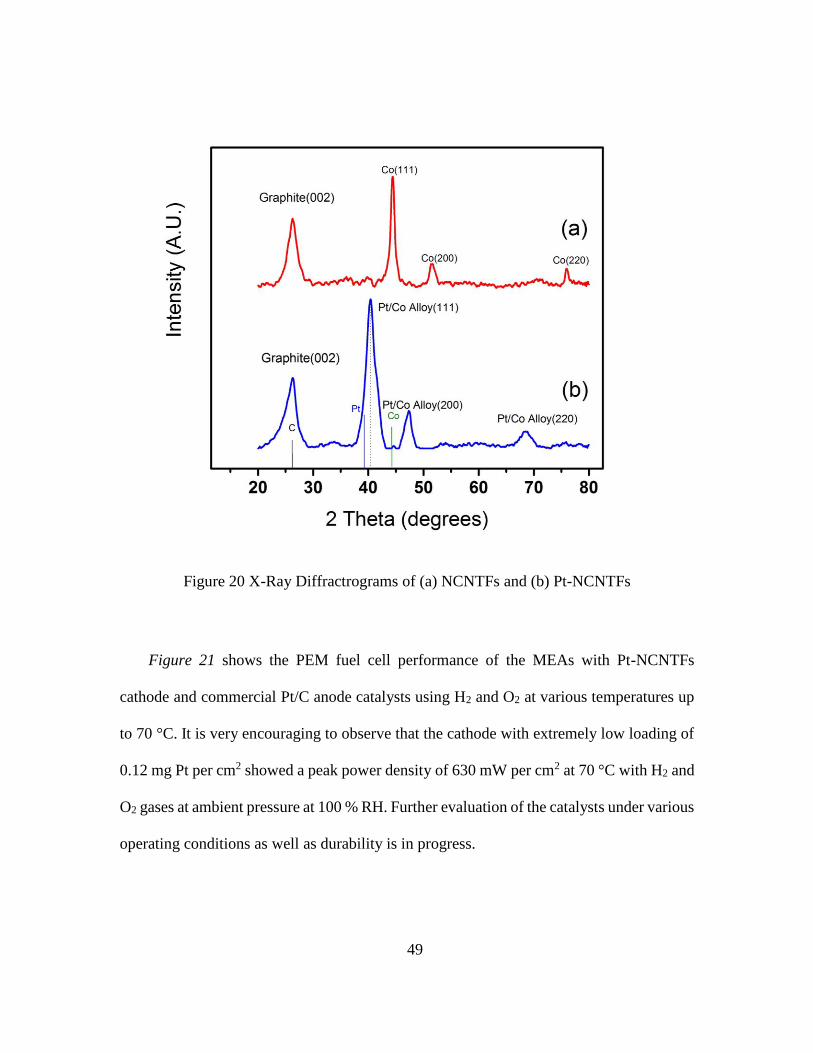
20 X-Ray Diffractrograms of (a) NCNTFs and (b) Pt-NCNTFs ...................................... 49
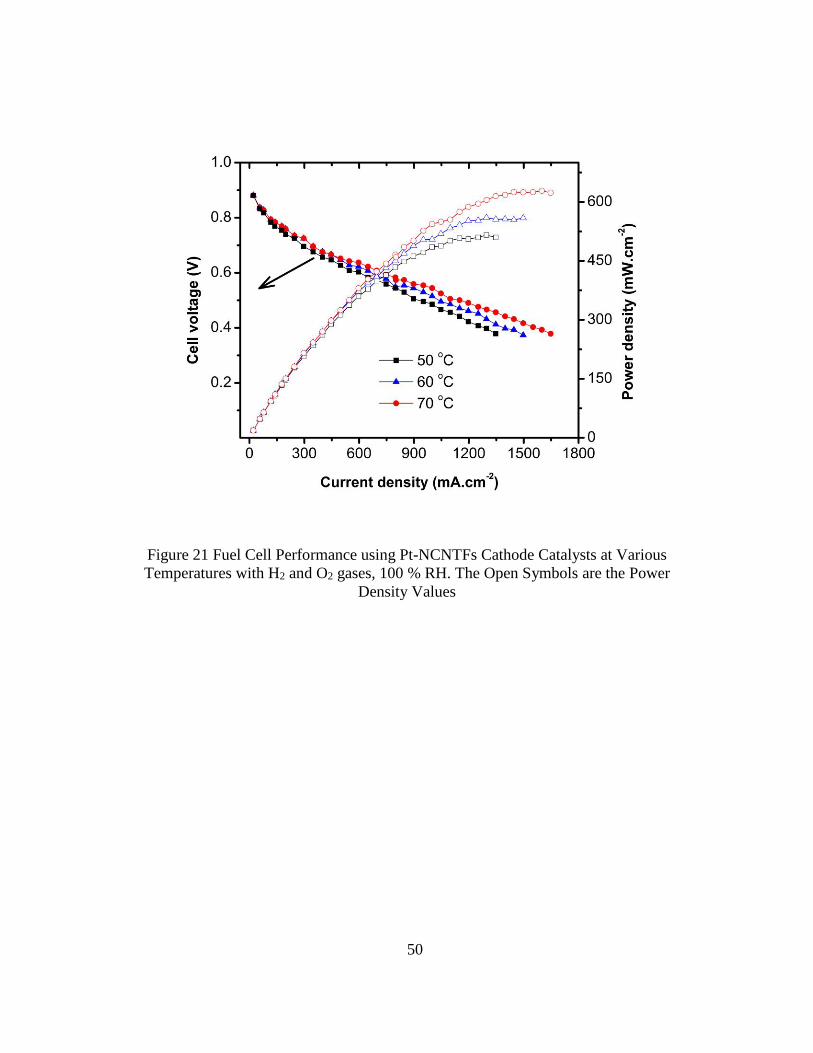
21 Fuel Cell Performance using Pt-NCNTFs Cathode Catalysts at Various Temperatures
with H2 and O2 gases, 100 % RH. The Open Symbols are the Power Density Values .... 50
Page 12
xi
ABBREVIATIONS
GHG: Green House Gas
IPCC: Intergovernmental Panel on Climate Change
PEMFC: Proton Exchange Membrane Fuel Cell/ Polymer Electrolyte Membrane Fuel
Cell
GDL: Gas Diffusion Layer
MEA: Membrane Electrode Assembly
CCM: Catalyst coated membrane
MPL: Micro-porous Layer
CL: Catalyst Layer
CFP: Carbon Fiber Paper
PB: PUREBLACK®
VGCF: Vapor grown carbon fiber
SDS: Sodium Dodecyl Sulfate
ORR: Oxygen reduction reactions
DOE: Design of Experiments
SCCM: Standardized cubic centimeters per minute
MOF: Metal organic frameworks
Page 13
xii
ZIF: Zeolitic imidazolate frameworks
NCNTF: Nitrogen doped Carbon Nanotube framework
DI water: Deionized water
IPA: Isopropyl alcohol
Page 14
1
1 INTRODUCTION
1.1 BACKGROUND AND MOTIVATION
Since decades, fossil fuels, especially petroleum has been the primary energy
source for conveyance. Though it has been a cheaper and better performing alternative than
other fuels in the past, recent years have observed a trend towards using alternative and
sustainable sources of energy in transportation sector. The reasons behind this shift are the
non-renewable nature of fossil fuel, increasing cost of petroleum products, as well as the
environmental threats due to the generation of greenhouse gases (GHG), contributing
towards global warming more than ever. In 2012, 1.17 billion barrels of petroleum products
were consumed in the US[1], which contributed to a 5.026x10⁹ tons of greenhouse gases
released into the atmosphere[2]. CO2 being the most salient GHG. The global atmospheric
concentration of CO2 has increased from a pre-industrial value of about 280 to 379 parts
per million in 2005[3]. Warming of the climate system is unequivocal. This can be found
in evidence of increases in global average air and ocean temperatures, widespread melting
of snow and ice, and rising sea levels.
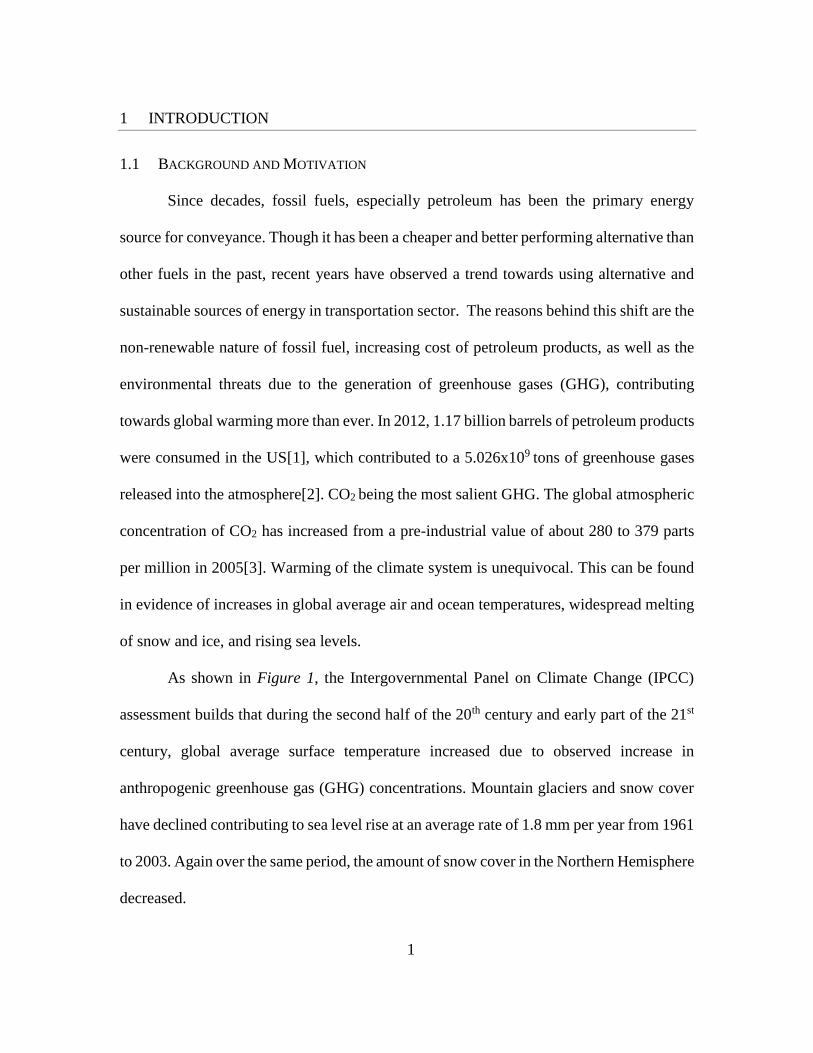
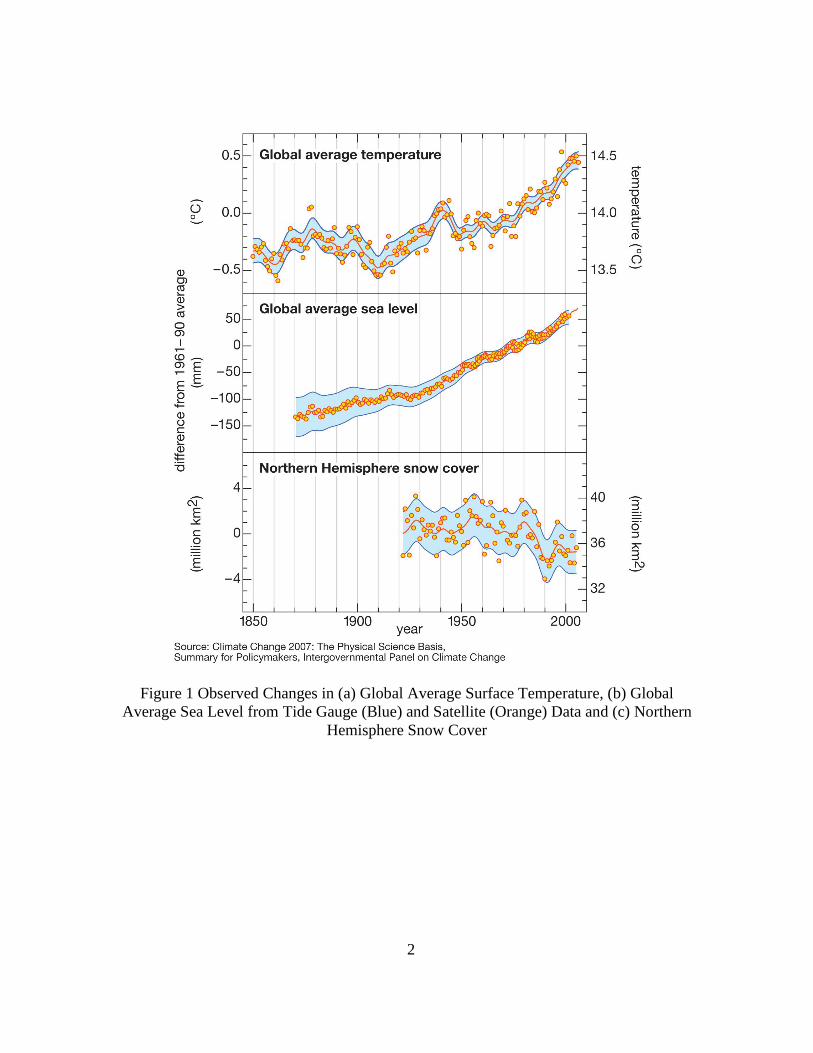
As shown in Figure 1, the Intergovernmental Panel on Climate Change (IPCC)
assessment builds that during the second half of the 20th century and early part of the 21st
century, global average surface temperature increased due to observed increase in
anthropogenic greenhouse gas (GHG) concentrations. Mountain glaciers and snow cover
have declined contributing to sea level rise at an average rate of 1.8 mm per year from 1961
to 2003. Again over the same period, the amount of snow cover in the Northern Hemisphere
decreased.
Page 15
2
Figure 1 Observed Changes in (a) Global Average Surface Temperature, (b) Global
Average Sea Level from Tide Gauge (Blue) and Satellite (Orange) Data and (c) Northern
Hemisphere Snow Cover
Page 16
3
To address all these legislations and to comply with standards like Corporate
Average Fuel Economy (CAFÉ) as well as California zero-emission vehicle, there is an
increasing pressure on automotive manufacturers to produce more efficient and alternative
fuel vehicles. With the depletion of fossil fuels and growing concerns over environmental
issues such as global warming, there has been a keen interest in research related to fuel
cells.
Fuel cell combines the advantage of both combustion engine as well as a battery
except for the fact that fuel cells can be operated continuously as long as it is provided with
the required amount of fuel and oxidant. Fuel cells (particularly hydrogen) due to their high
efficiency and zero pollution provide the promise of being one of the long-term solutions
to the improvement of energy efficiency, energy sustainability, and energy security and the
reduction of greenhouse gases and urban pollution. The use of hydrogen as fuel will greatly
reduce the polluting CO and NOx emissions.
PEMFCs have the potential to become both reliable and commercial energy
generators in the near future. But the key challenges currently hampering widespread
Proton Exchange Membrane Fuel Cell (PEMFC) commercialization are their high costs
and limited hydrogen availability[4]. Subsequently fuel cell material costs is directly
proportional with active area, thus the key to reducing the costs is to enable greater power
densities from PEM fuel cells, so that compact fuel cell configurations can handle greater
power ranges[5]. As power densities increase, heat transfer and gas diffusion rates become
limiting factors to performance, and both of these factors are heavily influenced by the
porous transport layer which is referred to as the gas diffusion layer (GDL)[6, 7].
Page 17
4
1.2 PROTON EXCHANGE MEMBRANE FUEL CELLS (PEMFC)
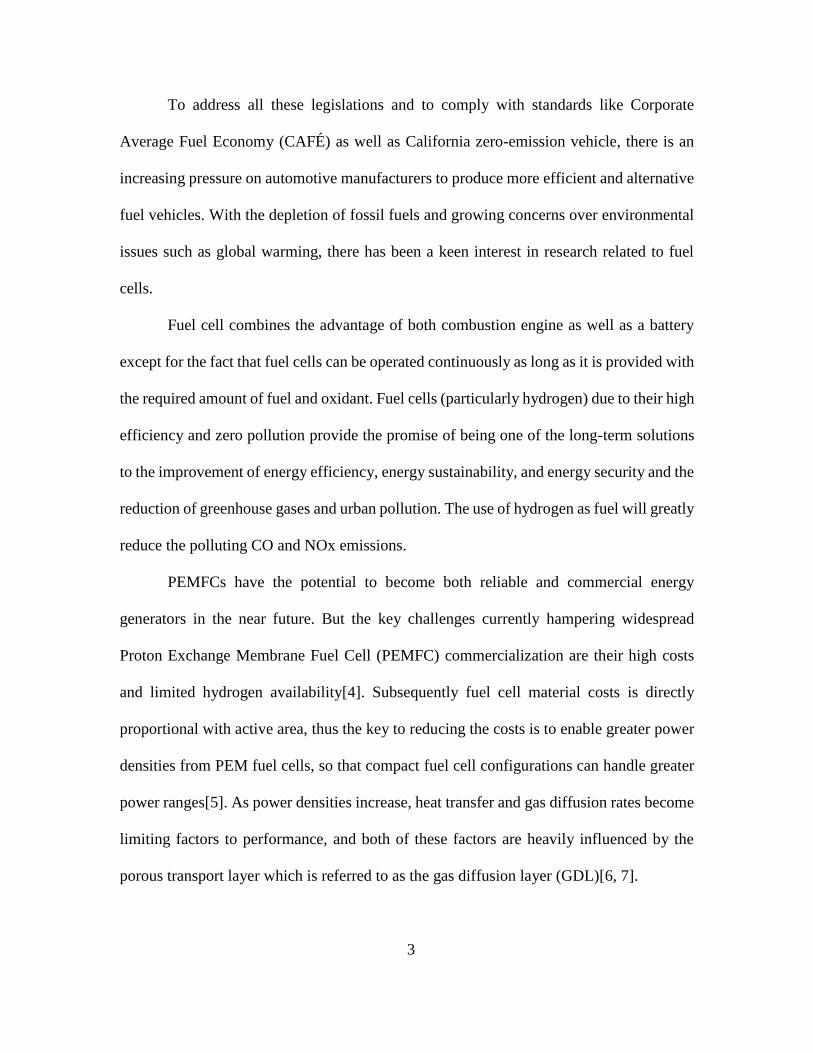
Polymer electrolyte fuel cells gained momentum due to the low operating
temperature (<100 °C), attainable high power densities, fast start-up capability and their
relatively simple handling. This fuel cell utilizes ionically conductive polymer usually
perfluorosulfonic acid (Nafion) membrane which acts as electrolyte; impermeable to gases
but it conducts protons. The membrane that acts as the electrolyte is sandwiched between
the two porous, electrically conductive electrodes. These electrodes are typically made out
of carbon cloth or carbon fiber paper. At the interface between the porous electrode and
the polymer membrane there is a layer with catalyst particles, typically platinum supported
on carbon (see Fig. 1.2). The composite structure of gas diffusion layer, anode, proton
exchange membrane, cathode and gas diffusion layer is known as membrane electrode
assembly (MEA). Oxygen from air and hydrogen fuel are channeled to the cathode and
anode side, respectively through flow channels (Bipolar plates).
The hydrogen molecule is ionized on the anode side:
𝐻2 → 2𝐻+ + 2𝑒− (1)
and its product species protons and electrons are recombined with an oxygen atom to
produce a water molecule on the cathode side:
1
2𝑂2 + 2𝑒
− + 2𝐻+ → 𝐻2𝑂 (2)
The hydrogen ion permeates through ionomer membrane and reaches cathode side;
however, the electrons are routed around an external circuit, providing useful electricity.
Page 18
5
The migration of proton in membrane is promoted by sulphonate group present in the
membrane structure through the formation of hydronium ion.
Figure 2 Schematic of a PEM Fuel Cell
1.3 GAS DIFFUSION LAYER
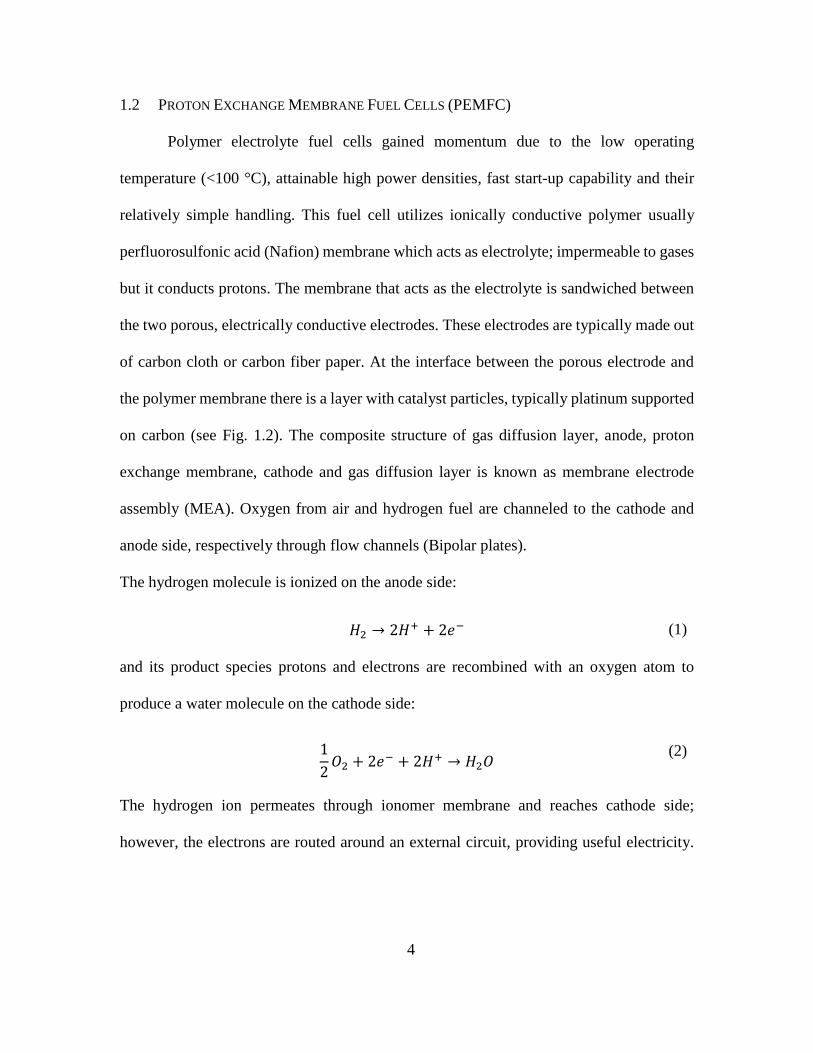
The macro-porous layer of diffusion layer (DL) is either carbon paper or woven
carbon cloth which serves as physical substrate for catalyst layer, current collector as well
as an elastic component of the MEA. The DL are fabricated using carbon paper in a
PEMFC are usually treated (coated) with a hydrophobic agent such as PTFE in order to
improve the water removal within the DL and the fuel cell. It is also very common to have
a catalyst-backing layer or microporous layer (MPL) between the catalyst layer (CL) and
diffusion layer. The MPL consists of thin layer of carbon black mixed with PTFE coated
on to a sheet of macro-porous carbon fiber paper (CFP), due to their high porosity (>=70%)
and good electrical conductivity.
Page 19
6
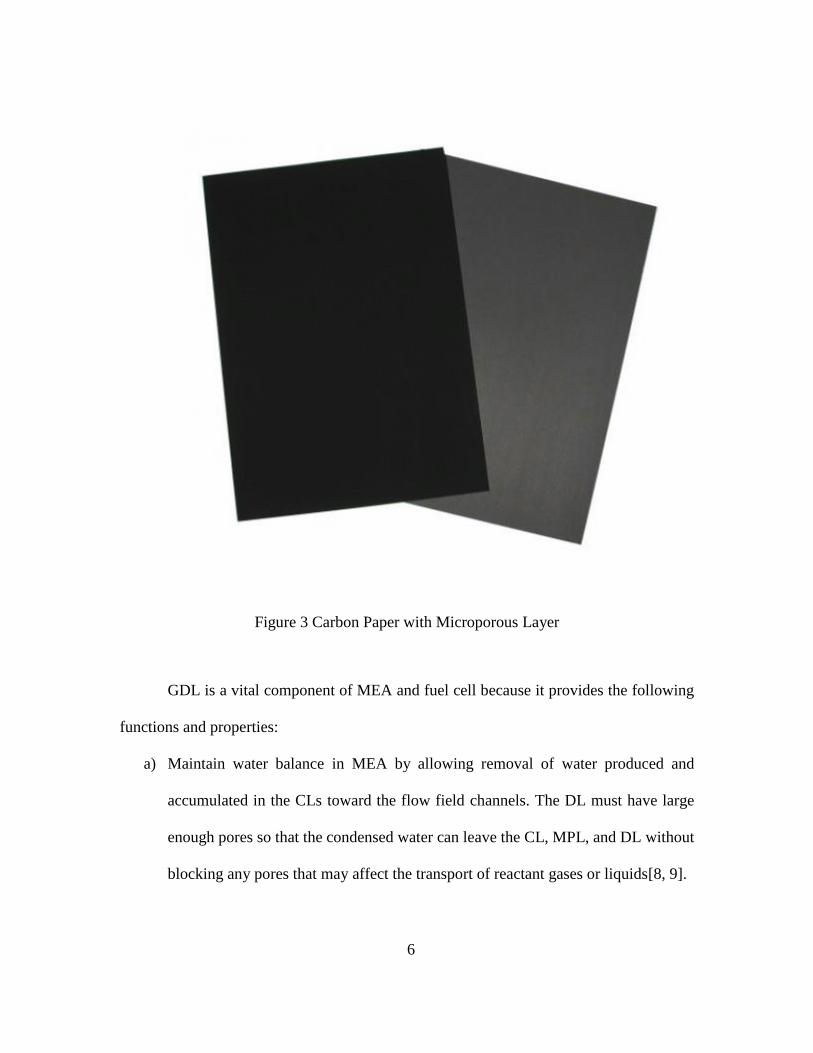
Figure 3 Carbon Paper with Microporous Layer
GDL is a vital component of MEA and fuel cell because it provides the following
functions and properties:
a) Maintain water balance in MEA by allowing removal of water produced and
accumulated in the CLs toward the flow field channels. The DL must have large
enough pores so that the condensed water can leave the CL, MPL, and DL without
blocking any pores that may affect the transport of reactant gases or liquids[8, 9].
Page 20
7
b) It provides mechanical support to the CL and the membrane in order for these two
components to be unaffected by the pressure that the landings or ribs of the bipolar
plate put on them. Thus the DL should not deform substantially after several hours
of operations [10, 11].
c) It helps to provide electrical contact from the bipolar plates to the CL and vice versa
with low resistance between them[12].
d) It also helps in heat transfer from CL to the bipolar plates in order to keep the cell
at desired temperature of operation[13].
1.3.1 CARBON SUPPORT MATERIAL
The micro-porous layer of gas diffusion layers (GDLs) was fabricated with the
PUREBLACK® carbon powder along with vapor grown carbon fiber (VGCF) dispersed in
sodium dodecyl sulfate (SDS) aqueous solvent mixed with polymeric binder (usually
PTFE). Microporous layers have a pore size between 100 and 500 nm, as compared with
10–30µm pore size for carbon-fiber-paper substrates[14].
Carbon powder is used as support material for the following reasons
a) Availability of variable surface area and porosity.
b) High electrical and thermal conductivity.
c) Stable in reducing and reasonably oxidizing environments.
Carbon powder characteristics affects the linear as well as non-linear polarization
components as well as reversible potential of the cell (E°). Carbon support should have a
higher surface area as it increases the oxidation.
Page 21
8
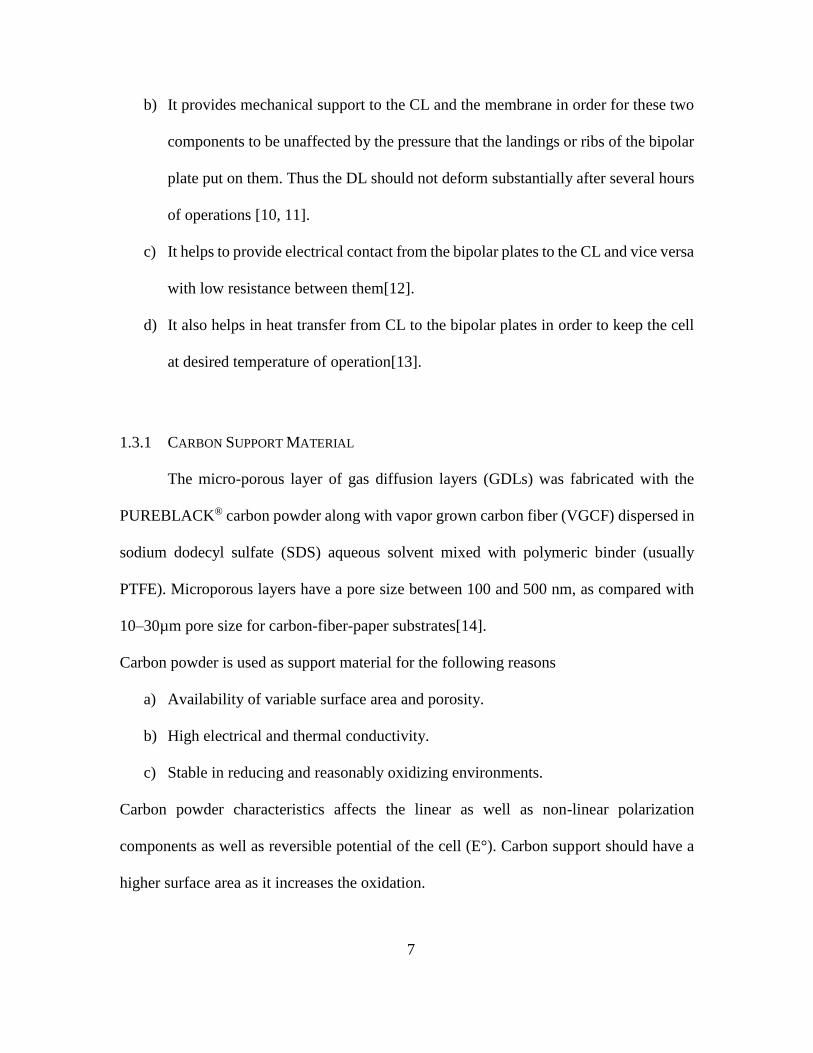
PUREBLACK® has inherent hydrophobic characteristics which leads to relatively
better gas transport as well as water management characteristics especially at high current
densities, in 100% RH operation. Table 1 lists the phsico-chemical properties of
PUREBLACK® 205-110 Carbon
Table 1: Physico-Chemical Properties of PUREBLACK® 205-110 Carbon
Property Surface
Area
(m2/g)
Moisture
(ppm)
Sulphur
(ppm)
Volatile
matter
(%)
Particle
size
(nm)
Ash
(ppm)
PUREBLACK® 46 20 <50 0.03 44 20
VGCF is mixed with nano-chain Pureblack® 205-110 to offer adhesion and
increased mechanical strength between macro-porous and micro-porous layers. Also, the
robustness of the micro-porous layer was improved by combining PUREBLACK® carbon
with a fibrous nano-carbon.
As shown in Figure 4, SDS molecules are chemically adsorbed on the surface of
the carbon particles, forming micelle-encapsulation [15]. The SDS, anionic surfactant is
attached to the surface of carbon particle/fiber assisting homogenous dispersion of the
slurry in water medium. GDLs fabricated using SDS water solution as a medium of
dispersion for carbon slurry has been found to be better performer compared to GDLs
fabricated with alcohol based solution[16].
Page 22
9
Figure 4 Schematic Representation of Micelle-Encapsulated PUREBLACK® and VGCF
Carbons
1.4 PROTON EXCHANGE MEMBRANES
Effective proton exchange membrane should possess the following properties:
a) High proton conductivity
b) Possess high thermomechanical and chemical stability
c) Impermeable to gases (oxygen) and fuels (hydrogen)
d) Achieve balanced water transport
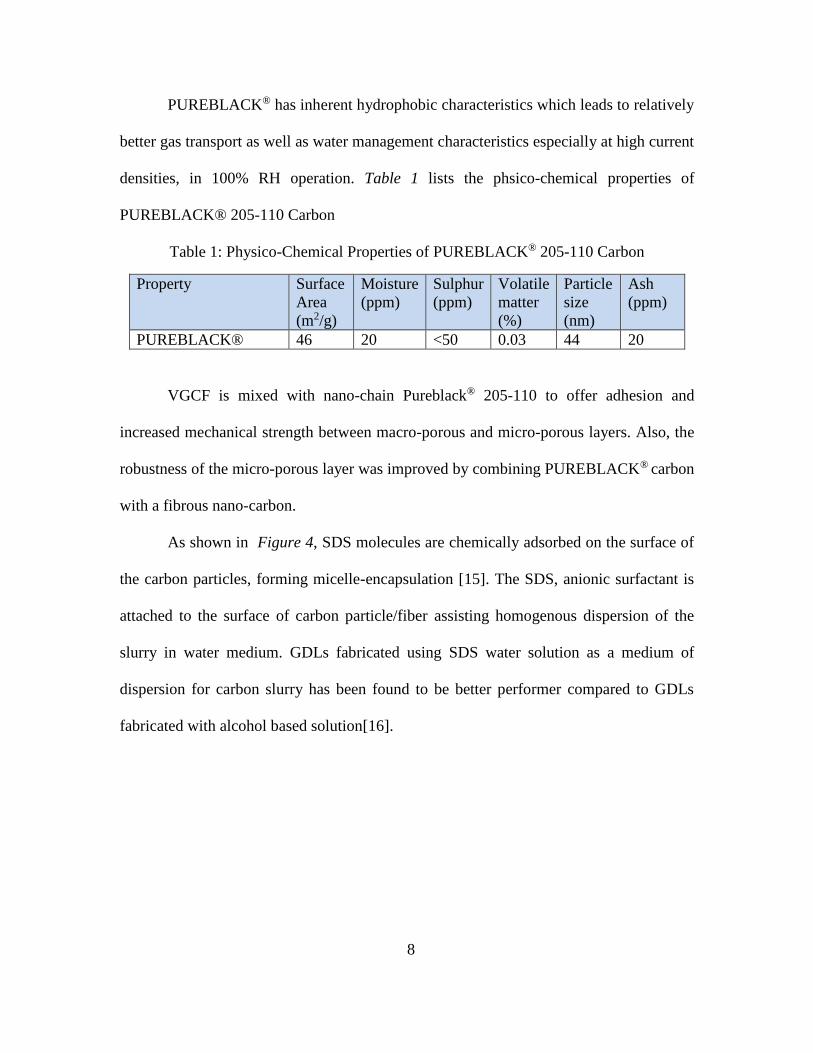
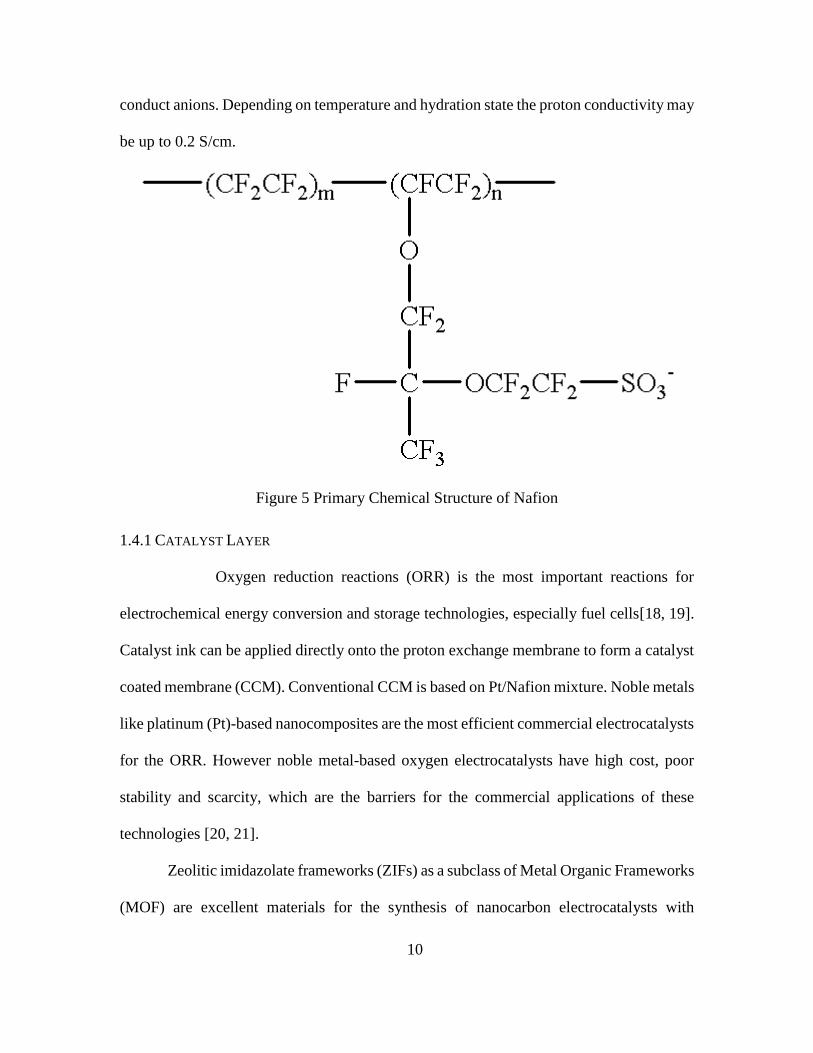
Nafion which is a perfluorosulphonic polymer electrolyte (see Figure 5) has been durable
over long time up to 60,000 h; since they can withstand harsh chemical and physical
environment in PEMFC[17]. Protons on the sulfonic acid group (SO3H) “hop” from one
acid site to another. The pores thus allow movement of cations but the membranes do not
Page 23
10
conduct anions. Depending on temperature and hydration state the proton conductivity may
be up to 0.2 S/cm.
Figure 5 Primary Chemical Structure of Nafion
1.4.1 CATALYST LAYER
Oxygen reduction reactions (ORR) is the most important reactions for
electrochemical energy conversion and storage technologies, especially fuel cells[18, 19].
Catalyst ink can be applied directly onto the proton exchange membrane to form a catalyst
coated membrane (CCM). Conventional CCM is based on Pt/Nafion mixture. Noble metals
like platinum (Pt)-based nanocomposites are the most efficient commercial electrocatalysts
for the ORR. However noble metal-based oxygen electrocatalysts have high cost, poor
stability and scarcity, which are the barriers for the commercial applications of these
technologies [20, 21].
Zeolitic imidazolate frameworks (ZIFs) as a subclass of Metal Organic Frameworks
(MOF) are excellent materials for the synthesis of nanocarbon electrocatalysts with
Page 24
11
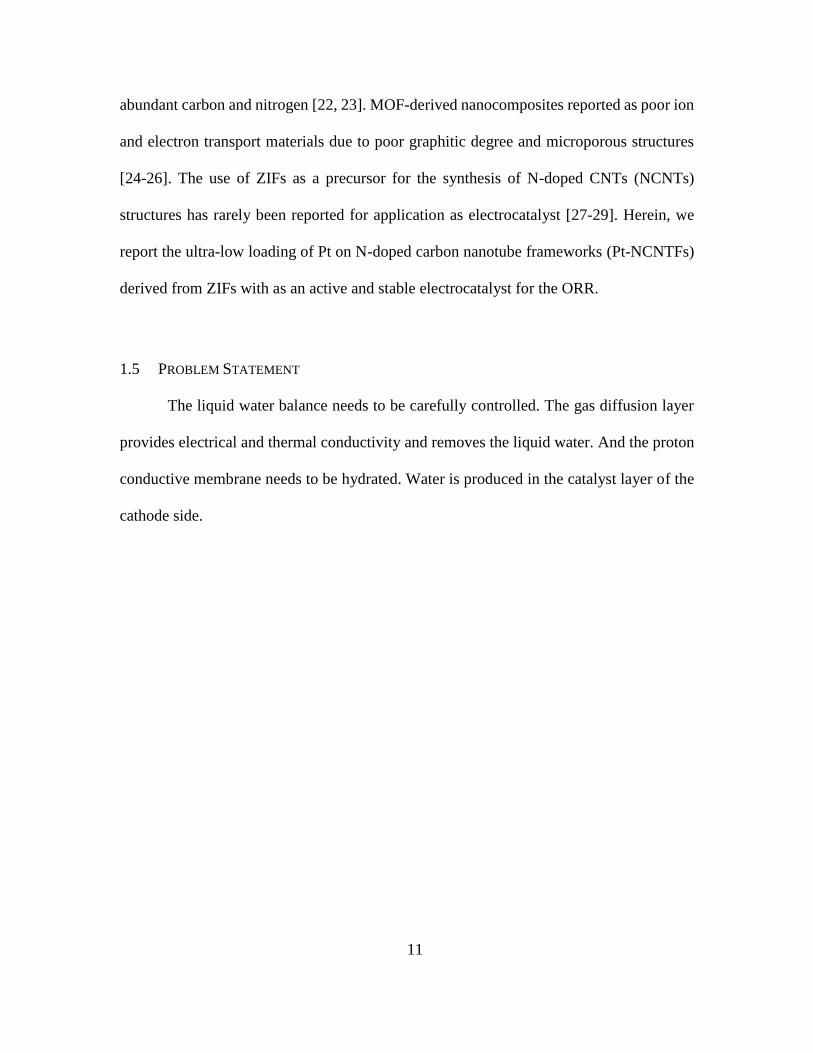
abundant carbon and nitrogen [22, 23]. MOF-derived nanocomposites reported as poor ion
and electron transport materials due to poor graphitic degree and microporous structures
[24-26]. The use of ZIFs as a precursor for the synthesis of N-doped CNTs (NCNTs)
structures has rarely been reported for application as electrocatalyst [27-29]. Herein, we
report the ultra-low loading of Pt on N-doped carbon nanotube frameworks (Pt-NCNTFs)
derived from ZIFs with as an active and stable electrocatalyst for the ORR.
1.5 PROBLEM STATEMENT
The liquid water balance needs to be carefully controlled. The gas diffusion layer
provides electrical and thermal conductivity and removes the liquid water. And the proton
conductive membrane needs to be hydrated. Water is produced in the catalyst layer of the
cathode side.
Page 25
12
Figure 6 Water Management in PEMFC
If membrane is “too dry” you will not be able to get as much voltage of a fuel cell
because ohmic resistance starts going up. Insufficient amount of water in the fuel cell
would lead to a higher membrane resistance and membrane dry out, resulting in premature
failure of the fuel cell. Thus the membrane needs high humidity for conductivity.
At the same time, excess water in the fuel cell would cause an increase in the mass
transport loss at the cathode side resulting in cell degradation. Hence, the desired objective
of a water management scheme is to maintain a correct water balance in the fuel cell. In
fuel cell flooding the first thing that happens is that the membrane itself is a little bit dry,
as you start running some current through here, it starts producing water and the first thing
that will happen is that the electrodes themselves will start flooding and then if you
Page 26
13
continue to create current faster than you can get water out of the system you will start
forming water droplet in the channels. And then you can eventually get to a point where
you are producing so much water that the channels themselves are completely flood,
completely blocking the ability of oxygen to get to the cathode and that would be one of
the reasons that your voltage will quickly start dropping. And that is form of mass transfer
over potential. What happens is oxygen cannot get to the electrode fast enough.
The gas diffusion layer is a paper made of carbon fibers with a hydrophobic coating,
typically PTFE. In a fully hydrophobic material, water uses the lowest resistance path,
which is tortuous. The remaining gas pathways are also tortuous, which leads to transport
losses. Air has a double duty, it basically provides oxygen to the electrode and then you
need pressure from the air to force out water, so that it does not build up in channels. The
GDL is often coated with teflon to shed liquid water and make it hydrophobic. So you don't
have droplets of water, that keeps water more in the gaseous phase as it leaves.
Previous studies have demonstrated that metal–organic frameworks (MOFs) with
their unique porous structure can act as both templates and precursors for the preparation
of porous carbon materials. morphology and crystallinity of carbon materials can be
controlled by varying the morphology and metal ions of MOFs. Zeolitic imidazolate
frameworks (ZIFs) as an important branch of MOFs are synthesized by coordinating
transition metals (Zn2+, Co2+) with imidazole ligands. Thus, ZIFs, which are rich in carbon,
nitrogen and transition metals, easily prepared and very cost effective, could be ideal solid-
phase precursors for the synthesis of nitrogen-doped carbon materials.
The focal point of this research work is primarily on the proton exchange membrane
fuel cell. This thesis will entail and achieve the following objectives:
Page 27
14
a) Fabrication of GDL for optimizing the composition of MPL at 70 °C for 70% RH
using air as an oxidant. The durability difficulties of PEMFC becomes especially
severe under low humidity and high temperature, which are the desired operation
conditions for PEMFC.
b) Pt-NCNTFs cathode catalyst using ZIF-67 for PEMFC.
1.6 ORGANIZATION OF THE THESIS
This thesis is organized to provide an in-depth understanding of the research work
accomplished.
a) Chapter One gives an introduction to the thesis including background information
and the scope of the proposed work.
b) Chapter Two entails a comprehensive literature review of PEMFC technology: the
historical highlights of PEMFC, the technical challenges facing the technology,
fabrication of GDLs, and other valuable research work achieved that are significant
to this thesis.
c) Chapter Three describes the experimental procedures and settings to prepare gas
diffusion layer. Also, the development and characterization of the different
materials for GDLs.
d) Chapter Four discusses the results of this thesis research by implementing various
tools such as PEMFC test, pore size distribution, wetting angle test, SEM and
thermal conductivity to evaluate the characterization of GDLs. It also highlights
Page 28
15
various tools such as PEMFC test, XRD tests, SEM and TEM to evaluate the
characterization of Pt-NCNTFs.
e) Chapter Five presents the summary and conclusion of the research performed in
this thesis. In addition, it also provides the recommendations for future research.
Page 29
16
2 LITERATURE REVIEW
An extensive literature review is done to investigate the effects of varying the
compositions of chemicals in GDL to allow further optimization studies. Furthermore, the
different range of chemical compositions for namely PB and PTFE are reviewed to select
the most suitable range to be evaluated using full factorial design of experiments (DOE).
Also, previous works done to analyze the water distribution in fuel cells and to correlate
this water accumulation to performance are reviewed. Due to high fuel cell performance
loaded catalyst derived by MOF/ZIF reported in recent years, previous works are reviewed.
In this chapter, a literature review is provided for
(i) The techniques that have been applied to fabricate the GDL
(ii) The impact of different compositions of PB and PTFE on the fuel cell performance
(iii) The application of ZIF-MOF as the best potential precursor of electrocatalyst due
to high surface area of ZIF-MOF morphology, rich in metal ions, presence of
carbon and nitrogen in the ligand.
2.1 DATTA ET. AL. PAPER ON UNDERSTANDING OF GDL IN PEMFC
Like previous article, this paper proposes a discussion about influence of structure
and design of GDL and MPL on the performance of PEMFC. The objective is to find
correlation between ex-situ measured effective diffusivity of water vapor and in-situ
performance and limiting current density in PEMFC [30]. The effect of adding multiple
MPLs, MPL loading and MPL particle size on cell performance are also investigated.
Carbon fiber papers provided by AvCarb Material Solutions were used for this work, since
Page 30
17
woven fabrics are ten-folds expensive at high volume production. This paper discusses key
GDL structural properties namely thickness, porosity, and pore size distribution. Results
show that thicker GDL (>100 microns) show higher total pore volume (4.9 mLg-1) and
larger mean pore diameter (54 µm) thus making it preferable for wet conditions (>70%
RH) as compared to thinner GDL having total pore volume (2.9 mLg-1) and mean pore
diameter (39 µm) being preferred for low current density/ dry conditions (<30% RH). It
was found that at operating conditions of 70 °C, 12 psig, 2X stoichiometric flows, and
100% RH A/C the fuel cell performance and limiting current was directly proportional
until certain value of measured effective water vapor diffusivity. Although two-layer MPL
provides higher current density, single MPL serves well for lower power and
humidification applications. Lower MPL (≤10 gm-2) loading and medium to small particle
size (5-20 µm) led to better fuel cell performance under wet conditions while MPL loading
from 10 gm-2 to 30 gm-2, medium size particles i.e., 17 µm, medium thickness and medium
PTFE loadings exhibiting better performance under dry conditions.
Morgan et al. [30] identified the role of the GDL and summarized five key features
that link the required GDL properties and the best performance of the PEMFC, as follows:
(1) Reactant permeability: The GDL should be macroporous to ensure an efficient
supply of reactants (O2/H2) to the catalyst layer.
(2) Product permeability: a high product permeability with a balanced water flow in
the membrane electrode assembly (MEA) is required. The GDL should prevent the
blockage of the catalysts site and prevent the membrane drying [31].
Page 31
18
(3) Electrical conductivity: The GDL should ensure a high electrical conductivity to
minimize Ohmic losses. In addition, as reported by Morgan et al. the addition of PTFE that
increase the porosity reduce the electrical conductivity, thus an optimized PTFE content is
required.
(4) Thermal conductivity: an enhanced thermal management is required to remove
the heat from the membrane electrode assembly (MEA).
(5) Mechanical support: a robust mechanical support to protect the membrane and
catalyst layers from damage during assembly is required form the GDL.
2.2 KANNAN ET. AL. REVIEW OF CHARACTERIZATION TECHNIQUES FOR GDL FOR
PEMFC
Various characteristics for GDL has been reviewed including surface morphology,
pore size distribution, wettability, thermal and electrical conductivity to achieve optimum
fuel cell performance [32]. The method discussed offer understanding which are suitable
for large scale as well as small production of GDL materials. Few of the characterization
tools are described below:
2.2.1 THERMAL CONDUCTIVITY
Through-plane thermal conductivity measurement setup follows standardized
method namely ASTM standard E2584-07 (Standard Practice for Thermal Conductivity of
Materials Using a Thermal Capacitance (Slug) Calorimeter) which was succeeded by
ASTM E2584-10, ASTM standard D5470-06 (2011) (Standard Test Method for Thermal
Page 32
19
Transmission Properties of Thermally Conductive Electrical Insulation Materials). The
setup usually consisted of GDL sample compressed between two graphite rods with load
range from 0.07-1.38 MPa with the help of loading clamp. Heat flux from the lower rod
consisting of a heating element was transmitted to the upper rod. Thermocouples are
positioned on lower as well as upper graphite rod at various locations radially to measure
the hot side and cold side temperatures of the sample, respectively. The entire system was
monitored using Data Acquisition system (DAQ) [33].The system used to measure the
thermal conductivity of GDL as a function of temperature and compression.
2.2.2 POROSITY AND PORE SIZE DISTRIBUTION
Mercury intrusion porosimetry instruments like Quantachrome PoreMaster-33 and
Micromeritics AutoPore IV-9500 are majorly used to determine porosity and pore size
distribution for GDL. In this method, mercury (Hg) with high surface tension is forced into
sample. The pore size distribution divided into micro, meso- and macrospores is calculated
by the uptake of mercury as a function of pressure using Washburn equation. From total
uptake of mercury at the maximum applied pressure, the porosity can be calculated.
2.2.3 SURFACE MORPHOLOGY
GDL surface morphology can be understood using characterization tools such as
Scanning electron microscopy (SEM), atomic force microscope (AFM) and laser
profilometer. The images captured using above mentioned tools can provide important
information regarding mechanical properties of MPL, distribution of adhesion forces and
conductive area, average material surface roughness.
Page 33
20
2.2.4 CONTACT ANGLE
Sessile drop method is the most frequently used method for measuring the contact
angle on diffusion-media surface. Contact angle is an important parameter in PEMFC to
regulate the water management. In this method small water droplet (≤1mm) is set on the
surface and contact angle is measured by fitting tangent to three-phase point where liquid
surface and solid surface come in contact. The contact angle can be measured directly by
digitizing the image and using a computer program. The wetting characteristics of GDL
samples are generally analyzed by Goniometer using water drop.
2.3 KANNAN ET. AL. PAPER ON GDL USING NEW TYPE OF GRAPHITIZED NANO-CARBON
PUREBLACK®
FOR PEMFC
The literature review coins use of a new Nano-carbon material called
PUREBLACK® as MPL in GDL for PEMFC [35]. The GDL fabricated using
PUREBLACK® and VGCF performed excellent when air was used as an oxidant at
ambient pressure as well as making the MPL robust. Maximum power density of 0.55
W/cm2 has been reported.
2.4 KANNAN ET. AL. PAPER ON EFFECT OF CARBON SUBSTRATE OF GDL ON
PERFORMANCE OF PEMFC
This paper explains the influence of variable thickness (130, 170, 210, 250, 330 µm)
of teflonized non-woven carbon paper substrate developed by Hollingsworth & Vose Co.
employed as macro-porous layer on cathode sides at 80 °C using H2/air as well as H2/O2 at
different RH conditions on PEMFC performance [31]. Homogenous carbon slurry
Page 34
21
consisted of 75 wt.% PB and 25 wt.% VGCF with 25 wt.% PTFE in isopropyl alcohol
along with a dispersion agent, Novec-7300 (1 ml for 1 g of carbon). This carbon slurry was
coated on the carbon paper substrate using Easycoater equipment (EC26, Coatema) with
velocity of 3 m min-1 by single pass achieving carbon loading between 2.6-3 mg cm-2.
Although, thinner GDLs should generally be better performers due to shorter path for gas
diffusion however Kannan et al. found that thinner GDL with lower porosity cannot
provide continuous oxygen supply when the oxidant is air. Thus, they found that 330 µm
thick substrate having GDL pore volume of 103 cc g-1 outperformed 170 µm thick substrate
having GDL pore volume of 38 cc g-1 at all RH conditions (60-100%) using H2/air as well
as H2/O2. An important observation by the authors is significant improvement in fuel cell
performance in case of air as well as O2 as well as homogeneity in surface morphology
with the use of dispersing agent (Novec-7300).
2.5 KANNAN ET. AL. PAPER ON WIRE ROD COATING PROCESS OF GAS DIFFUSION LAYER
FOR PEMFCS
Kannan et al. [36] employed wire wound rods and an in-house motorized setup for
mass fabrication of MPL on non-woven carbon paper substrate by a single pass. They also
performed ex-situ characterization methods including surface morphology, contact angle
and pore size distribution using FESEM, Goniometer and porosimetry for MPL with
carbon composition of 75 wt.% PUREBLACK® and 25 wt.% VGCF and uniform PTFE
composition of 25 wt.% by using wire rod (RDS50). The MPL showed uniform and crack
free surface morphology at low magnification. Using water-ethanol (1:1 ratio) the contact
angle measurement was about 120 degrees. These authors conducted multiple experiments
Page 35
22
for finding pore diameter values of MPL with various compositions of PB and VGCF. The
results suggested a systematic increase in pore diameter when VGCF content increased
from 10 to 75 wt.% in MPL. It was established that higher amount of VGCF is more
beneficial for good performance at higher relative humidity (100% RH) whereas for lower
relative humidity (50% RH) higher amount of PUREBLACK® is more beneficial due to
smaller pores in the presence of H2 as fuel and air as an oxidant. They observed that fuel
cell performance of wire rod coated GDL was low for low RH conditions. This could be
attributed to large pores and variation in carbon loading between 2.5-3 mg cm-2, that are
certain limitations of manufacturing MPL using wire road coating method.
2.6 LIM ET. AL. PAPER ON EFFECTS OF HYDROPHOBIC POLYMER CONTENT IN GDL ON
POWER PERFORMANCE OF A PEM FUEL CELL
It is evident that there is a strong link between an efficient operation of the PEMFC
and an optimized GDL characteristics. In this context, Chan Lim and C.Y. Wang [37]
investigated the effect of the addition of 10 to 40 wt. % amount of fluorinated ethylene
propylene (FEP) content in the carbon paper GDL on the power performance of H2/air
PEMFC. The authors used a wet-proofed commercial carbon papers (Toray 090, E-Tek)
on both the anode and the cathode. The catalysts used is a carbon-supported 20 wt. %
Platnium/Carbon (E-Tek Inc.) with a commercial Nafion 112 membrane (EW 1100) from
Dupont. In addition Chan Lim and C.Y. Wang measured the polarization curves for each
amount of the FEP and they characterized the GDL by measuring the water contact angle
with a capillary rise method. The authors deduced from the observed values that an amount
of 10 wt. % FEP-impregnated cathode GDL provide higher power densities for the
Page 36
23
PEMFC, however there has been no optimization technic applied to confirm that the values
obtained are the real optimum for PEMFC performance.
2.7 KANNAN ET. AL. PAPER ON DEVELOPMENT OF GDL USING WATER BASED CARBON
SLURRY FOR PEMFC
In this research work, GDL was fabricated with carbon slurry dispersed in variable
concentration(25, 50 and 100 mM) of anionic water-soluble micelle surfactant namely SDS
[16]. The use of surfactant has demonstrated to control particle size and distribution of
nanoparticles deposited on carbon support. Furthermore, SDS helps to homogenously
disperse carbon nanotubes in water. Kannan and coworkers also compared GDL fabricated
with IPA based carbon slurry with water (SDS) based carbon slurry and found the later to
have lesser micro-cracks when observed under SEM however the contact angle remains
more or less similar for both. Additionally, they observed that rinsing the GDL in water
helps to eliminate sodium ion contamination in MEA which decreases the ionic
conductivity of Nafion. They also noted that GDL with SDS concentration of 50 mM
performed the best for both H2/air and H2/O2 at 90% RH.
2.8 CHO ET. AL. PAPER ON OPTIMIZATION OF GDLS FOR HIGH PERFORMANCE PEMFC
EMPLOYING STAINLESS STEEL BIPOLAR PLATES
Eom and Cho authored an article on influence of variable PTFE content (0-30 wt.%)
in MPL of GDL for various RH (25 to 100%), cell temperature (65 to 80 °C) and gas
pressure (0 to 1 bar) on the cell performance employing stainless-steel bipolar plate (Grade
316L) [38]. They observed stainless-steel bipolar plate to be more hydrophobic compared
Page 37
24
to graphite plate over longer cell operation. This investigation would provide valuable
insights for making fuel cell vehicle commercially viable. The paper illustrates the effect
of variable RH, cell temperature and gas pressure individually and their interaction with
each other. The paper demonstrates that increasing the PTFE content leads to decrease in
electrical conductivity and gas and water permeation rates of the GDLs. At a low RH of
25% the cell performance increased with increase in PTFE content. The reason for this is
maybe due to decrease in porosity and increase in water retention within the MEA. The
paper asserted that the cell temperature increase from 65 °C to 80 °C increased the charge
transfer resistance, leading to decrease in cell performance. According to Cho and
coworkers, high temperature of 80 °C, low RH (25-50%), and low PTFE content (0-10
wt.%) showed low cell performance. Whereas, high PTFE content (20-30 wt.%) displayed
high cell performance. However, increase in the gas pressure decreased the charge transfer
resistance, leading to increase in fuel cell performance. Experimental results shows that
under unpressurized condition, low PTFE content (0-20 wt.%) and full RH of 100%
showed best fuel cell performance while under pressurized conditions (1 bar), higher PTFE
content (20-30 wt.%) and low RH of 25% showed the best fuel cell performance. Increase
in mass transfer due to gas pressure was relatively more than increase in charge transfer
due to increase in RH in case of GDL with high PTFE content. On a whole the authors
observed under relatively low temperature (65 °C), high RH (100%) and unpressurized
condition, the GDL without PTFE exhibited highest fuel cell performance. In contrast,
under higher fuel temperatures of 80 °C, lower RH (25%) and 1 bar of gas pressure, the
GDL with 30 wt.% PTFE displayed highest fuel cell performance.
Page 38
25
2.9 XIA ET. AL. PAPER ON MOF DERIVED BIFUNCTIONAL OXYGEN ELECTROCATALYST
In 2016, Xia et al [39] used ZIF-67 as only precursor, by one step pyrolysis magically
turn it into high ORR performance catalyst, in the atmosphere of H2/Ar 1:9, heating
temperature at 700 °C the nitrogen doped carbon nanotube framework (NCNTF) has be
detected. In the heat treatment, because of presence of hydrogen gas form a reducing
environment that turns the cobalt ion into cobalt particle as catalyst to let carbon and
nitrogen to grow NCNT then many NCNT twisted around together form NCNTF. In this
process ZIF-67 not only act as C and N source but also provide catalyst and growth
template. The electrocatalytically activity of NCNTF was evaluated by the cyclic
voltammetry in O2 saturated KOH solution, a peak at ~0.78V was observed at cathode
indicated good ORR activity. The value of charge transfer numbers are in the range from
3.97 to 3.99 for the range of voltage from 0.3 to 0.7 V which are close to the theoretical
value of Pt/C 4.00. Furthermore, unlike most non-Pt electrocatalysts, the NCNTFs catalyst
also exhibits high ORR activity in 0.5M H2SO4 solution, with an onset potential of 0.85V
vs RHE. The linearity of the K-L plots and the calculated electron transfer number of 3.88
in acidic solution also confirm the excellent activity of the NCNTFs catalyst. The pyrolysis
temperature was studied from 700 °C to 1000 °C however the resultant of higher
temperature electrocatalytically activity decreases. The reason for this is maybe due to the
low defect density was formed at higher heat treatment temperature. Moreover, N doping
can introduce electrocatalytically active sites in C atoms around N atoms, also N doping
generated more defects of NCNTF. N content decreases at higher temperature due to the
decomposition of nitrogen group at high temperature. Though pyrolysis temperature at 600
Page 39
26
°C has showed most N doping content, it gives low electrocatalytic activity, reason of this
is the incomplete pyrolysis of ZIF-67. Existence of Co particle anchored inside the NCNT
also play an important role towards ORR and encapsulated Co can’t be leached away by
acid.
Page 40
27
3 METHODOLOGY
This section will explain the standard operating procedure developed to fulfil the
fabrication of various components of PEMFC system and fuel cell assembly. This section
is divided into two parts
a) Fabrication of GDL for optimizing the composition of MPL (PB and PTFE)
considering 70 °C for 70% RH using air (as expected in the normal weather
condition) as an oxidant.
b) Pt-NCNTFs cathode catalyst using ZIF-67 for PEMFC.
3.1 EXPERIMENTAL PROTOCOL FOR GDL OPTIMIZATION
3.1.1 Gas Diffusion Layer
Non-teflonized non-woven carbon substrate (GD07508G) was developed and
supplied by Hollingsworth & Vose Company. Teflon dispersion (LQ-1005-1000EW, 5%
wt.) from Ion Power, Inc., Nano-chain PUREBLACK® (grade 205-110) carbon from
Superior Graphite Co., VGCF from Superior Graphite Co., and SDS (C12H25SO4Na) from
Fisher Scientific were used for slurry preparation. VGCF was mixed with PUREBLACK®
to provide improved mechanical strength and adhesion of micro-porous layer with the
macro-porous layer.
0.5 g of carbon powder (73.16 wt.% Pure black carbon powder and 26.84 wt.%
VGCF) was dispersed in 20 ml DI water containing 120mg of SDS by stirring the mixture
for 10 mins and then sonicating for 30 min. PTFE (34 wt.%) dispersion was added into the
mixture and followed with the magnetic stirring for 10 min. To coat the paper with carbon
Page 41
28
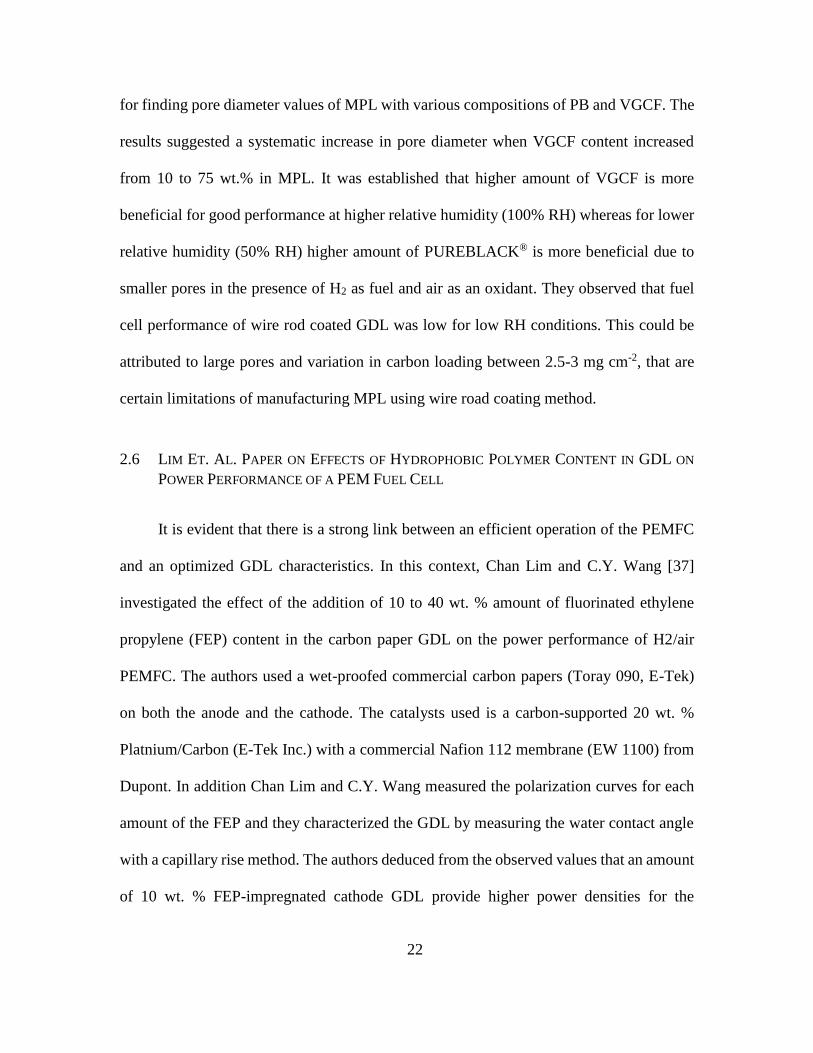
slurry and PTFE, a sample of 10 cm x 10 cm was slowly micro-sprayed. The carbon
loading on the micro-porous layer was about 3mg cm−2. After coating the micro-porous
layer, the GDL samples were dried at room temperature overnight and then placed in the
sintering oven at 350 °C for 30min in air. In order to ensure the best uniformity in PTFE
content possible, entire 10 cm x 10 cm sample were sintered, and then cut into individual
samples from the sintered square. Nevertheless, a PTFE migration was observed during
drying: higher amounts of PTFE dried on all the four edges of the paper in comparison
with its center. The carbon and PTFE content in the center of the paper was uniform, and
it was from this area that samples used in the experiments were cut. GDL sample was
washed to remove the SDS impurities by immersing them in warm DI water for 30 min.
Figure 7 shows the process of MPL preparation.
Figure 7 Process of Coating Carbon Paper with Microporous Layer
Page 42
29
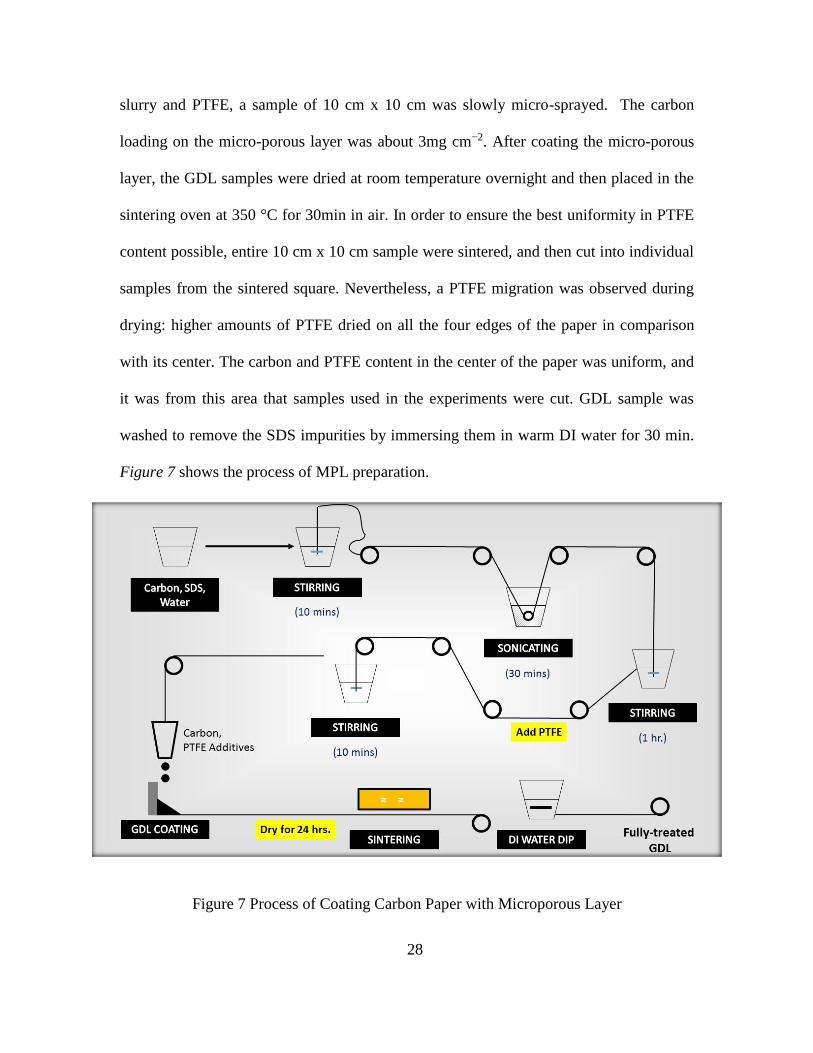
To improve performance of PEMFCs especially with air as an oxidant, the GDL
properties were carefully optimized. In the case of GDL optimization, the complexity of
the transport phenomena that occurs and the various material and design of the GDL that
exist adding to that the need for a high performance PEMFC, a robust optimization technic
is necessary to unlock the link in GDL characteristics and PEMFC performance. The
effects of various GDL compositions namely quantity of PB and PTFE, were evaluated
using full factorial design of experiments approach.
Figure 8 Design of Experiments Approach
Since this is a two-factor factorial i.e. PB content and PTFE content experiment
with both design factors at two levels. We have called these levels “low” and “high” and
denoted them “-” and “+”, respectively. The objective of this experiment was to determine
if adjustments to either of these two factors would increase the maximum power density.
Page 43
30
Table 2 Values of Various Individual Parameters at Two Levels
Parameters Value of variable
(-) Low level (+) High level
A PUREBLACK® composition
(wt.%)
50 90
B PTFE composition (wt.%) 10 40
It is convenient combinations in standard order (Yate’s order). “A” refers to the
effect of factor A, “B” refers to the effect of factor B, and “AB” refers to the AB interaction.
The order in which these experiments are performed is random (the order is computer-
generated) so that there is no possibility of any bias.
Table 3 22 -Factorial Design: GDL Samples Were Fabricated with Following Different
Concentration of PB and PTFE
Run # Yate’s notation Parameters
A B
1 (1) 50 10
2 A 90 10
3 B 50 40
4 AB 90 40
3.1.2 Catalyst Coated Membrane
Catalyst-coated membranes (CCM) with 5 cm2 active area were fabricated using
commercial Pt/C (Tanaka TKK, Japan) catalyst slurry in isopropanol (20 ml for 1 g of
electrocatalyst) by the micro-spray method for anode and cathode sides on Nafion®
membrane (NRE 212, Ion Power Inc., New Castle, DE, USA). The catalyst ink was
prepared by dispersing Pt/C in Nafion solution (Ion Power, Inc., LQ-1005-1000 EW, 5%
wt.) in order to extend the reaction zone of the catalyst layer and isopropyl alcohol. The
membrane was fixed in a home-made fixture to ensure anode and cathode catalyst layers
Page 44
31
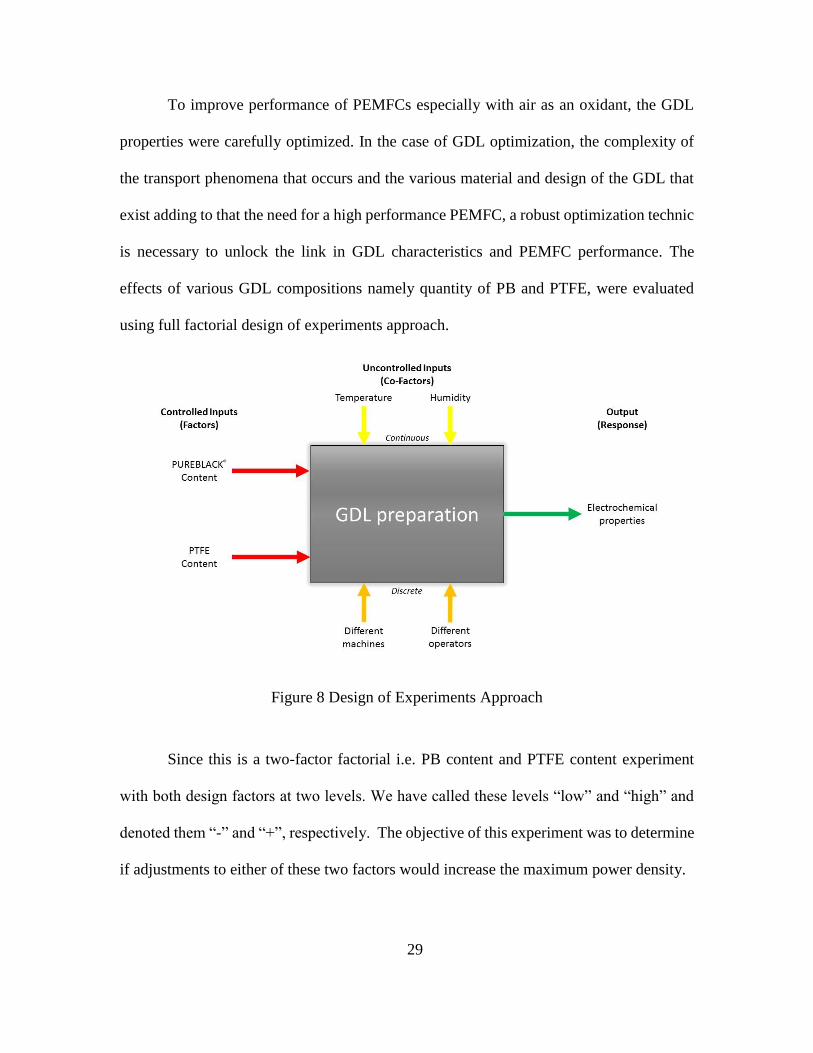
are exactly on the same area of the membrane. For both anode and cathode, the catalyst
loadings were about 0.4 Pt/C mg cm−2, respectively. The MEA was vacuum dried at 60 °C
for 15 minutes before assembling the electrode in the single cell test cell. Figure 9 shows
the process of spraying the CCM. New MEA with same procedure was prepared each time
for testing GDL with variable PB and PTFE content.
Figure 9 CCM Micro-Spray Method
3.1.3 Fuel Cell Assembly and Testing
Page 45
32
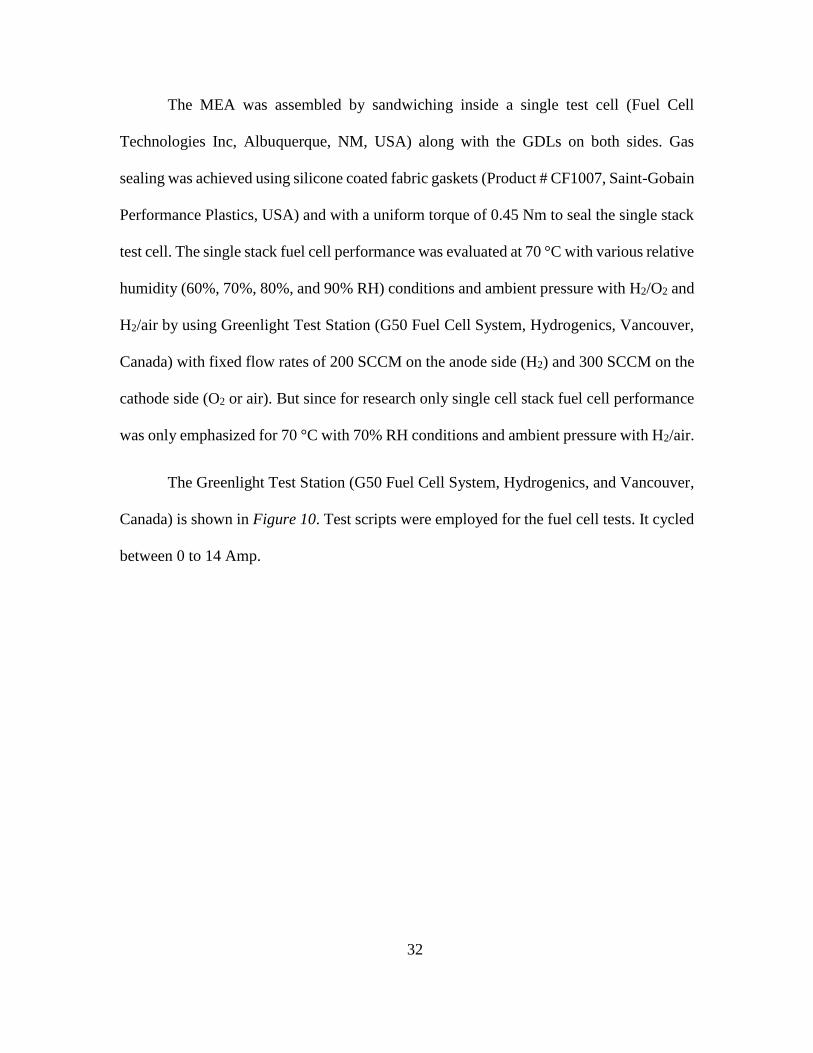
The MEA was assembled by sandwiching inside a single test cell (Fuel Cell
Technologies Inc, Albuquerque, NM, USA) along with the GDLs on both sides. Gas
sealing was achieved using silicone coated fabric gaskets (Product # CF1007, Saint-Gobain
Performance Plastics, USA) and with a uniform torque of 0.45 Nm to seal the single stack
test cell. The single stack fuel cell performance was evaluated at 70 °C with various relative
humidity (60%, 70%, 80%, and 90% RH) conditions and ambient pressure with H2/O2 and
H2/air by using Greenlight Test Station (G50 Fuel Cell System, Hydrogenics, Vancouver,
Canada) with fixed flow rates of 200 SCCM on the anode side (H2) and 300 SCCM on the
cathode side (O2 or air). But since for research only single cell stack fuel cell performance
was only emphasized for 70 °C with 70% RH conditions and ambient pressure with H2/air.
The Greenlight Test Station (G50 Fuel Cell System, Hydrogenics, and Vancouver,
Canada) is shown in Figure 10. Test scripts were employed for the fuel cell tests. It cycled
between 0 to 14 Amp.
Page 46
33
Figure 10 Greenlight Test Station (G50 Fuel Cell System, Hydrogenics, and Vancouver,
Canada)
3.2 EXPERIMENTAL PROTOCOL FOR PT-NCNTFS CATHODE CATALYST USING ZIF-67
3.2.1 Gas Diffusion Layer
Non-teflonized non-woven carbon paper (GD07508G, Hollingsworth & Vose
Company) was used as a substrate for fabricating gas diffusion layers (GDLs). Nano-chain
PUREBLACK® carbon (grade 205-110) from Superior Graphite Co., VGCF from Showa
Denka, Teflon dispersion (TE-3859) from DuPont Fluoroproducts and SDS
(C12H25SO4Na) from Fisher Scientific were used for carbon slurry preparation. 0.5 g of
carbon powder (73.16 wt.% Pure black carbon powder and 26.84 wt.% VGCF) was
dispersed in 8 ml DI water containing 120 mg of SDS by stirring the mixture for 10 min
and sonicated for 30 min. PTFE (34 wt.%) dispersion was added into the mixture and
Page 47
34
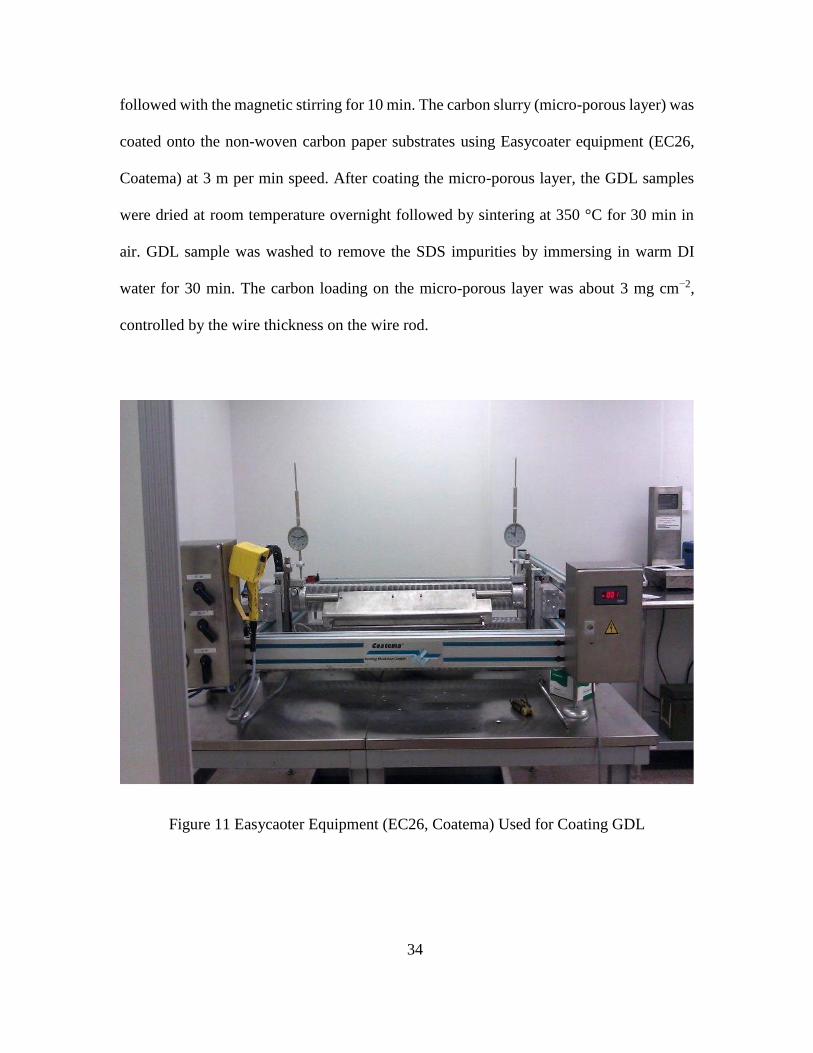
followed with the magnetic stirring for 10 min. The carbon slurry (micro-porous layer) was
coated onto the non-woven carbon paper substrates using Easycoater equipment (EC26,
Coatema) at 3 m per min speed. After coating the micro-porous layer, the GDL samples
were dried at room temperature overnight followed by sintering at 350 °C for 30 min in
air. GDL sample was washed to remove the SDS impurities by immersing in warm DI
water for 30 min. The carbon loading on the micro-porous layer was about 3 mg cm−2,
controlled by the wire thickness on the wire rod.
Figure 11 Easycaoter Equipment (EC26, Coatema) Used for Coating GDL
Page 48
35
3.2.2 Catalyst Coated Membrane
3.2.2.1 Synthesis of ZIF-67 Particles
ZIF-67 samples were synthesized as described in the published literature [39]. In
a typical synthesis, 2-methylimidazole (1.97 g) was dissolved in a mixed solution of 20 ml
of methanol and 20 ml of ethanol. Co(NO3)2 .6H2O (1.746 g) was dissolved in another
mixed solution of 20 ml of methanol and 20 ml of ethanol. The above two solutions were
then mixed under continuous stirring for few minutes and held for 20 h at room
temperature. The purple precipitate was collected by centrifuging the solution, washed in
ethanol several times and dried at 80 °C overnight. The flowchart in Figure 12 provides
the process steps sequentially.
3.2.2.2 Synthesis of Pt-NCNTFs
The ZIF-67 particles were soaked with H2PtCl6.6H2O solution (5 wt % solution in
DI water) and the resulting material was dried at 80 °C for 1h. The dried powder was heated
at 350 °C for 1.5 h then raised to 700 °C at a ramp rate of 2 °C per minute and pyrolyzed
for 3.5 h under flowing Ar/H2 (90% / 10% in volume ratio) atmosphere (see Figure 12).
The as-prepared black powder product after cooling down to room temperature naturally
was treated in 0.5M H2SO4 solution for 6 h. The resulting sample was collected by
centrifugation, repeatedly washed with DI water, and then dried at 80 °C. NCNTFs were
synthesized by following same protocol without adding Pt precursor. The synthesis process
reported here used only single precursor as carbon, nitrogen and Co source.
Page 49
36
Figure 12 Synthesis of Pt-NCNTFs Using ZIF-67
For PEMFC single cell tests, membrane electrode assemblies (MEAs) with active
area of 5.0 cm2 were fabricated as described below. Commercial Pt/C (Tanaka TKK, Japan)
and the Pt-NCNTF were used as anode and cathode catalysts, respectively. The cathode
catalyst ink was prepared by dispersing Pt-NCNTFs (or Pt/C for anode) in Nafion solution
(Ion Power, Inc., LQ-1005-1000 EW, 5% wt.) and isopropyl alcohol. The catalyst coated
membrane (CCM) was fabricated coating the catalyst ink by micro-spray method on
Nafion-212 (Ion Power Inc., USA) membrane and vacuum-dried at 70 °C. The catalyst
loading was 0.2 and 0.12 mg cm-2 on the anode and cathode sides of the CCM, respectively.
3.2.3 Fuel Cell Assembly and Testing
The MEAs were assembled by sandwiching the CCM with the gas diffusion layers
on both sides in the PEMFC test cell (Fuel Cell Technologies Inc., USA) of the CCM.
Silicone coated fabric (Product # CF1007, Saint-Gobain Performance Plastics, USA)
gasket used and the cell was tightened with a uniform torque of 0.45 Nm. Single cell fuel
Page 50
37
cell performance was evaluated using Greenlight Test Station (G50 Fuel Cell Test Station,
Hydrogenics, Canada) at 50, 60 and, 70 °C with H2/O2 at ambient pressure by galvanostatic
polarization. The relative humidity of the reactant gases was maintained at 100 % by
controlling the humidity bottle temperatures (both at 400 SCCM, respectively).
Page 51
38
4 RESULTS AND DISCUSSION
4.1 GDL OPTIMIZATION
Since the general aim of our research is related to the improvement of fuel cells
performance, it has been decided to conduct some performance tests (polarization curves)
in various operating conditions in order to show what was the actual effect of the
compositions of PB and PTFE on the performances.
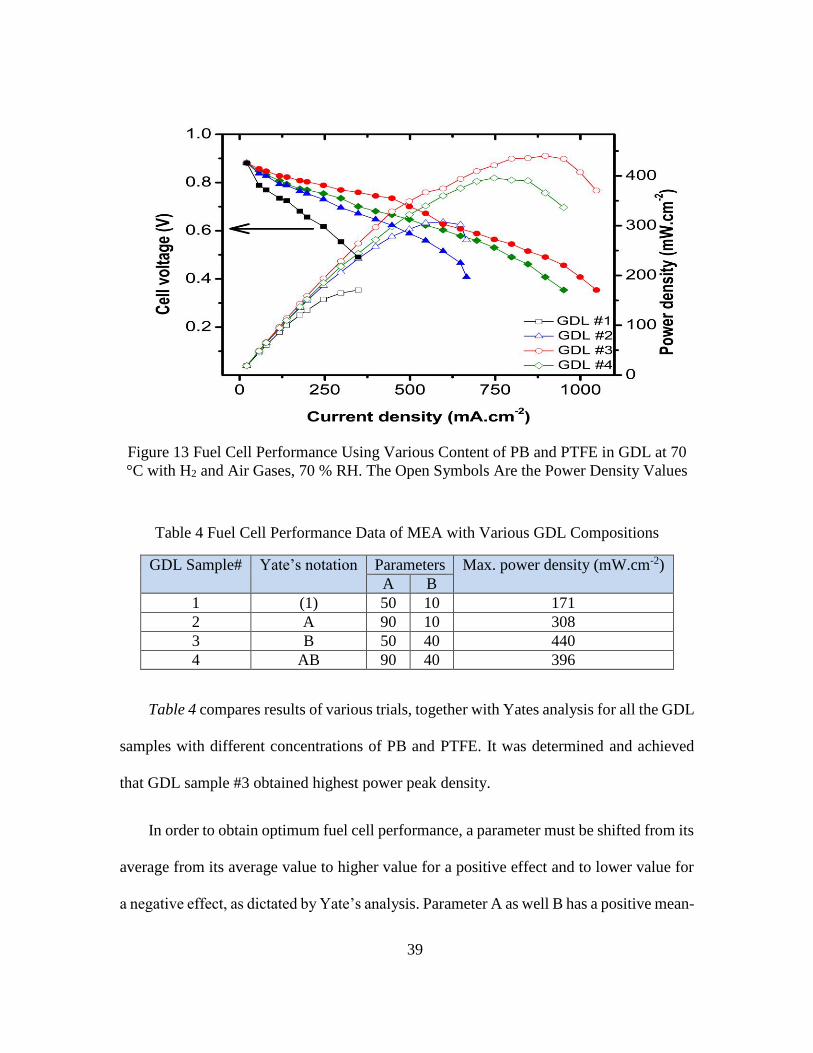
Figure 13 shows the PEM fuel cell performance of the MEAs with commercial Pt/C
catalysts using H2 and Air at temperatures of 70 °C and 70 % RH for different concentration
of PB and PTFE used in GDL using Greenlight Test Station (G50 Fuel Cell System,
Hydrogenics, Vancouver, Canada) with fixed flow rates of 200 SCCM on the anode side
(high purity H2, 99.99%) and 300 SCCM on the cathode side (Air). It is very encouraging
to observe that the carbon loading on the micro-porous layer was about 3mg cm−2 for all
the combination of content of PB and PTFE showed a peak power density of 440 mW per
cm2 at 70 °C with H2 and Air gases at ambient pressure at 70 % RH.
Page 52
39
Figure 13 Fuel Cell Performance Using Various Content of PB and PTFE in GDL at 70
°C with H2 and Air Gases, 70 % RH. The Open Symbols Are the Power Density Values
Table 4 Fuel Cell Performance Data of MEA with Various GDL Compositions
GDL Sample# Yate’s notation Parameters Max. power density (mW.cm-2)
A B
1 (1) 50 10 171
2 A 90 10 308
3 B 50 40 440
4 AB 90 40 396
Table 4 compares results of various trials, together with Yates analysis for all the GDL
samples with different concentrations of PB and PTFE. It was determined and achieved
that GDL sample #3 obtained highest power peak density.
In order to obtain optimum fuel cell performance, a parameter must be shifted from its
average from its average value to higher value for a positive effect and to lower value for
a negative effect, as dictated by Yate’s analysis. Parameter A as well B has a positive mean-
Page 53
40
effect value of 48.22 and 182.94 respectively and hence to reach the optimum its value
must be shifted to its upper limit.
Keeping the above consideration in view, a total of two typical GDL were fabricated
with the values of parameters A and B give in Table 5
Table 5 Final Design of GDL
Optimized GDL# Parameters Max. power density (mW.cm-
2) A B
1 71.58 29.5 415.70
2 73.16 34 486.95
Figure 14 Fuel Cell Performance of Optimized GDL at 70 °C with H2 and Air Gases, 70
% RH. The Open Symbols Are the Power Density Values
Page 54
41
The pore diameter, pore size distribution and pore volume of various GDL samples
were measured by Hg porosimeter (PoreMaster-60 GT, Quantachrome Instruments,
Boynton Beach, FL). The pore size distributions were calculated from the mercury
intrusion data by applying the Washburn equation.
Figure 15 (a) Specific and (b) Cumulative Pore-Size Distribution of Diffusion Layer from
Mercury-Intrusion Porosimetry Measurements
Page 55
42
The pore size distribution data for various GDL are shown on Figure 15. Even though
the pore sizes of GDL sample #1 and optimized GDL#2 are close to each other, there is a
reduction of pore size for the optimized GDL #1. There is a significant decrease in volume
of smaller pore at ~0.1 µm observed for GDL sample#1 and optimized GDL#2, along with
an increase in volume of the larger pore at ~50 µm. It is observed that the GDLs fabricated
with water based slurries have majority of the pores in the region of ∼50 μm. In order for
optimum gas and water transport of the GDLs, carbon slurry permeating into the macro-
porous carbon paper has to be prevented. GDL possesses many macro-holes and it enables
more gas to transport through the GDL as pressure increase. The carbon slurry permeation
into the macro-porous layer is extremely low for the water based slurry due to its
hydrophobic characteristics.
Apparently, the range of pore-size is broadly distributed between 0.004 and 1000 µm,
but small pores with the diameters less than 20 µm occupy 80% of the total pore volume.
The wetting characteristics (contact angle) of the GDLs were measured by rame´-hart
Advanced Automated Goniometer using water. Figure 16 shows the influence of the PTFE
content in the MPL on the contact angle. When the PTFE content increases from 5 to 40
wt.%, the contact angle is extended from 119° to 142°, which enhances the hydrophobic
properties of the GDL.
Page 56
43
Figure 16 Contact Angle Images of (a) GDL#1 (b) GDL#2 (c) GDL#3 (d) GDL#4
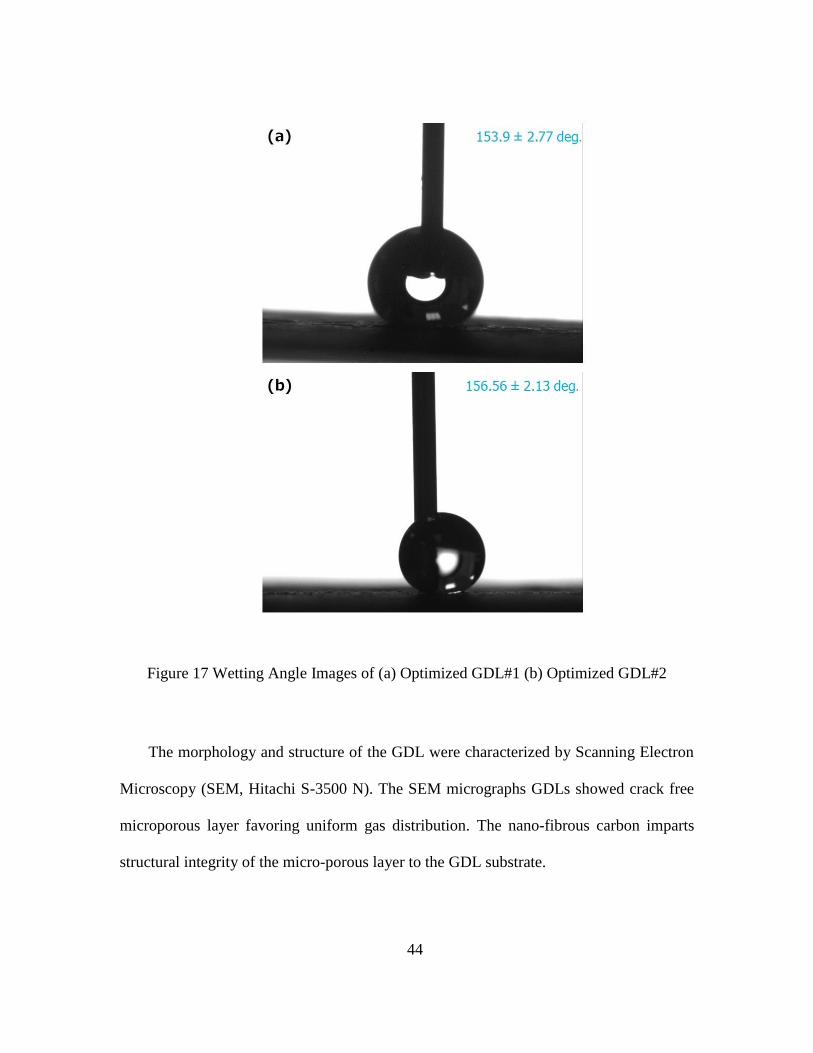
The angle measured by the tangent line for the optimized GDLs are about 155°.
Page 57
44
Figure 17 Wetting Angle Images of (a) Optimized GDL#1 (b) Optimized GDL#2
The morphology and structure of the GDL were characterized by Scanning Electron
Microscopy (SEM, Hitachi S-3500 N). The SEM micrographs GDLs showed crack free
microporous layer favoring uniform gas distribution. The nano-fibrous carbon imparts
structural integrity of the micro-porous layer to the GDL substrate.
Page 58
45
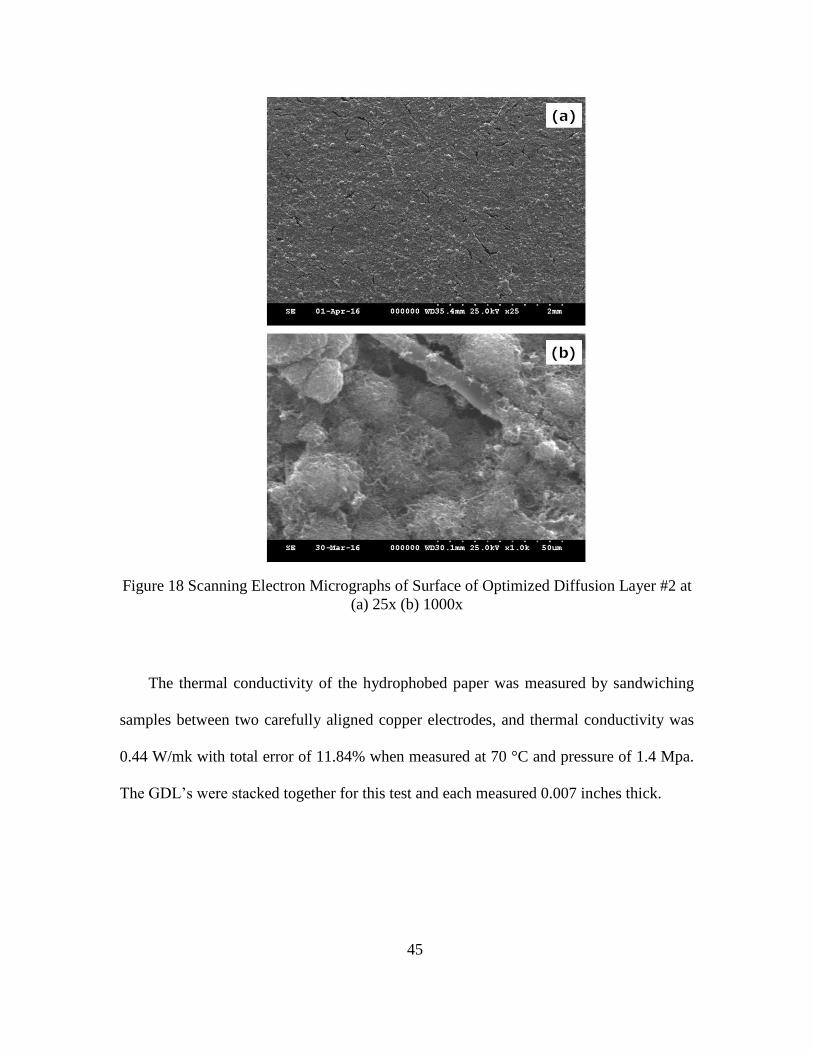
Figure 18 Scanning Electron Micrographs of Surface of Optimized Diffusion Layer #2 at
(a) 25x (b) 1000x
The thermal conductivity of the hydrophobed paper was measured by sandwiching
samples between two carefully aligned copper electrodes, and thermal conductivity was
0.44 W/mk with total error of 11.84% when measured at 70 °C and pressure of 1.4 Mpa.
The GDL’s were stacked together for this test and each measured 0.007 inches thick.
Page 59
46
4.2 PT-NCNTFS CATHODE CATALYST USING ZIF-67
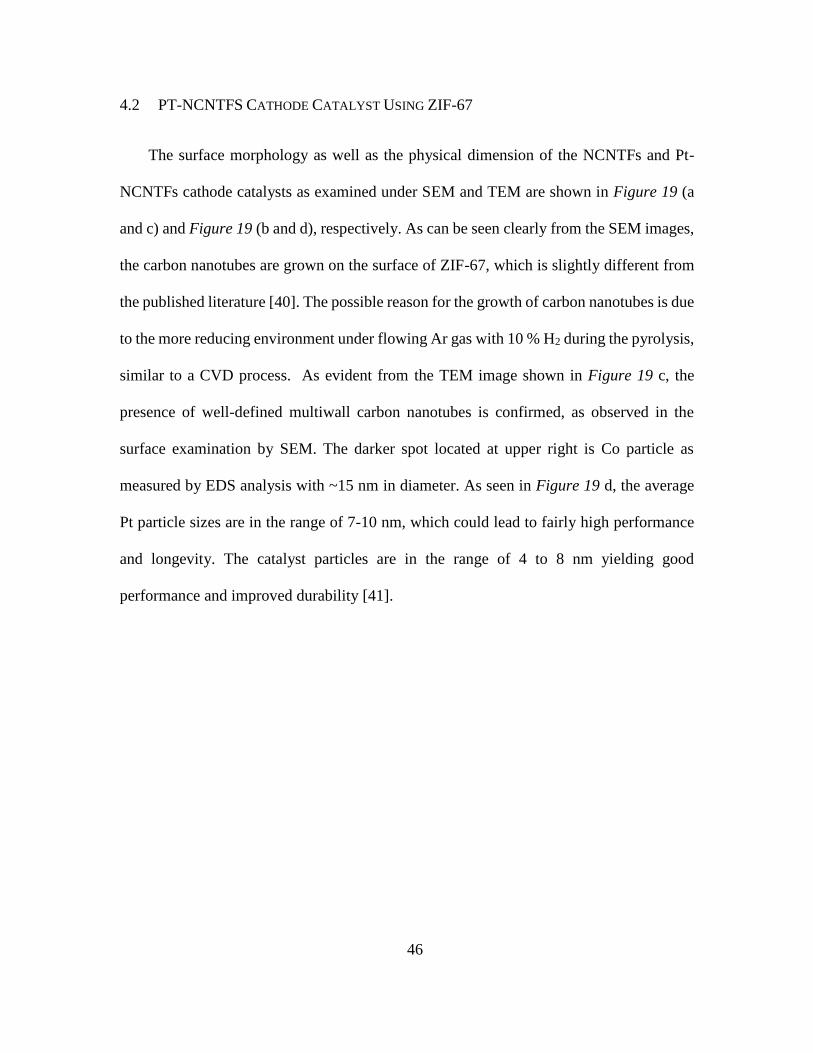
The surface morphology as well as the physical dimension of the NCNTFs and Pt-
NCNTFs cathode catalysts as examined under SEM and TEM are shown in Figure 19 (a
and c) and Figure 19 (b and d), respectively. As can be seen clearly from the SEM images,
the carbon nanotubes are grown on the surface of ZIF-67, which is slightly different from
the published literature [40]. The possible reason for the growth of carbon nanotubes is due
to the more reducing environment under flowing Ar gas with 10 % H2 during the pyrolysis,
similar to a CVD process. As evident from the TEM image shown in Figure 19 c, the
presence of well-defined multiwall carbon nanotubes is confirmed, as observed in the
surface examination by SEM. The darker spot located at upper right is Co particle as
measured by EDS analysis with ~15 nm in diameter. As seen in Figure 19 d, the average
Pt particle sizes are in the range of 7-10 nm, which could lead to fairly high performance
and longevity. The catalyst particles are in the range of 4 to 8 nm yielding good
performance and improved durability [41].
Page 60
47
`
Figure 19 Scanning Electron Micrographs of (a,b) Pt-NCNTFs, and Transmission
Electron Micrographs of (c) NCNTFs and (d) Pt-NCNTFs
In addition, graphitic lattice fringes (with 0.34 nm) are also evidenced for providing
superior conducting network as well as electrochemical stability. XRD patterns for
NCNTFs and Pt-NCNTFs are given in Figure 20. As clearly observed, both the NCNTFs
Page 61
48
and Pt-NCNTFs show the presence of graphitic carbon at 2ⴱ value of ~26.3 (hkl value:
002), confirming the graphitized CNTs under TEM examination. Other 3 diffraction peaks
in the NCNTFs (Figure 20 a) are identified as Co (111), Co (200) and Co (220) planes at
the 2ⴱ values of 44.36, 51.67 and 75.98, respectively. In the case of Pt-NCNTFs, the
presence of Pt-Co alloy is identified and is expected to exhibit enhanced electrochemical
performance towards ORR [42]. Based on the lattice parameters of Pt (3.92 Å) and Co
(3.53 Å), the composition of the Pt-NCNTFs (3.86 Å) is estimated to be 84 - 16 atomic wt.
% Pt-Co alloy using Vegard’s law [43]. From the Scherrer Equation the average crystallite
size was calculated by Full width at half maximum (FWHM), for the Pt-NCNTFs as 10.5
nm which is nearly identical to the values estimated from TEM images.
Page 62
49
Figure 20 X-Ray Diffractrograms of (a) NCNTFs and (b) Pt-NCNTFs
Figure 21 shows the PEM fuel cell performance of the MEAs with Pt-NCNTFs
cathode and commercial Pt/C anode catalysts using H2 and O2 at various temperatures up
to 70 °C. It is very encouraging to observe that the cathode with extremely low loading of
0.12 mg Pt per cm2 showed a peak power density of 630 mW per cm2 at 70 °C with H2 and
O2 gases at ambient pressure at 100 % RH. Further evaluation of the catalysts under various
operating conditions as well as durability is in progress.
Page 63
50
Figure 21 Fuel Cell Performance using Pt-NCNTFs Cathode Catalysts at Various
Temperatures with H2 and O2 gases, 100 % RH. The Open Symbols are the Power
Density Values
Page 64
51
5 CONCLUSION
The main conclusion of this work is that enhancing the knowledge on the materials
properties is of major interest to better understand and increase the performance. The best
performance with approximately 490 mA/cm2 at 650mV was obtained, when the GDL was
fabricated by spraying ink of compositions as follows: 0.5 g of carbon powder (73.16 wt.%
Pure black carbon powder and 26.84 wt.% VGCF) dispersed in 34 wt.% PTFE, maintaining
a constant composition for the catalytic layer with a Pt-loading of 0.4 mg cm-2.
Pt nanoparticles of size 10 nm were supported on nitrogen doped carbon nanotubes
framework prepared from pyrolysis of ZIF-67 at 700 °C in an Ar/H2 environment. ZIF-67
served as single source for Co, C and N. The MEA with Pt-NCNFs nanocatalyst showed
excellent PEMFC performance with a peak power density of 630 mW.cm−2 using Nafion-
212 membrane at 70 °C with H2 and O2 gases at ambient operating pressure. The
remarkable fuel cell performance with lower Pt loading towards ORR could be attributed
to the synergistic effect from Pt, Co, Pt-Co alloy, nitrogen and carbon nanotubes
framework.
Future scope can be as follows:
a) Automotive FC must withstand load cycling and freeze-thaw environmental
swings with an acceptable level of degradation from the beginning-of-life
(BOL) performance over a life time of 5500 h (~ 165,000 miles at 30 mph)
Page 65
52
b) Mass production methods are the key components to commercial viability of
FC systems
c) In addition, the thesis work done can be evaluated under various RH conditions
using H2/O2 and H2/Air for EIS.
Page 66
53
6 REFERENCES
[1] U. E. I. Administration, "Petroleum & Other Liquids," www.eia.gov, 2012.
[2] U. E. P. Agency, "Inventory of U.S. Greenhouse Gas Emissions and Sinks,"
www.epa.gov, 1990-2013.
[3] S. Solomon, D. Qin, M. Manning, Z. Chen, M. Marquis, K. B. Averyt, et al.,
"Climate Change 2007: The Physical Science Basis. Contribution of Working
Group I to the Fourth Assessment Report of the Intergovernmental Panel on
Climate Change," Cambridge University Press, New York2007.
[4] F. Barbir, PEM fuel cells: theory and practice. San Diego , California, USA:
Elsevier Academic Press, 2005.
[5] S. Srinivasan, O. Velev, A. Parthasarathy, D. Manko, and A. Appleby, "High
energy efficiency and high power density proton exchange membrane fuel cells
— electrode kinetics and mass transport," Journal of Power Sources, vol. 36, pp.
299-320, 1991.
[6] O. S. Burheim, H. Su, S. Pasupathi, J. G. Pharoah, and B. G. Pollet, "Thermal
conductivity and temperature profiles of the micro porous layers used for the
polymer electrolyte membrane fuel cell," International Journal of Hydrogen
Energy, vol. 38, pp. 8437-8447, 2013.
[7] U. Pasaogullari and C. Y. Wang, "Two-phase transport and the role of micro-
porous layer in polymer electrolyte fuel cells," Electrochimica Acta, vol. 49, pp.
4359-4369, 2004.
[8] A. M. Kannan, L. Cindrella, and L. Munukutla, "Functionally graded nano-porous
gas diffusion layer for proton exchange membrane fuel cells under low relative
humidity conditions," Electrochimica Acta, vol. 53, pp. 2416-2422, 2008.
[9] Z. Qi and A. Kaufman, "Low Pt loading high performance cathodes for PEM fuel
cells," Journal of Power Sources, vol. 113, pp. 37-43, 2003.
Page 67
54
[10] L. R. Jordan, A. K. Shukla, T. Behrsing, N. R. Avery, B. C. Muddle, and M.
Forsyth, "Diffusion layer parameters influencing optimal fuel cell performance,"
Journal of Power Sources, vol. 86, pp. 250-254, 2000.
[11] C. S. Kong, D. Y. Kim, T. H. Lee, H. K. Lee, and Y. G. Shul, "Influence of pore-
size distribution of diffusion layer on mass-transport problems of proton exchange
membrane fuel cells," Journal of Power Sources, vol. 108, pp. 185-191, 2002.
[12] Z. Zhan, J. Xiao, Y. Zhang, M. Pan, and R. Yuan, "Gas diffusion through
differently structured gas diffusion layers of PEM fuel cells," International
Journal of Hydrogen Energy, vol. 32, pp. 4443-4451, 2007.
[13] D. P. Wilkinson, Proton exchange membrane fuel cells: materials properties and
performance. Boca Raton, FL: CRC Press/Taylor & Francis, 2010.
[14] M. F. Mathias, J. Roth, J. Fleming, and W. Lehnert, Handbook of Fuel Cells
Fundamentals Technology and Applications: John Wiley and Sons, Ltd, 2010.
[15] C. Richard, F. Balavoine, P. Schultz, T. W. Ebbesen, and C. Mioskowski,
"Supramolecular Self-Assembly of Lipid Derivatives on Carbon Nanotubes,"
Science, vol. 300, pp. 775-778, 2003.
[16] J. F. Lin, X. Liu, A. Adame, R. Villacorta, J. Wertz, R. Ahmad, et al.,
"Development of gas diffusion layer using water based carbon slurry for proton
exchange membrane fuel cells," Electrochimica Acta, vol. 56, pp. 1591-1596,
2011.
[17] J. A. Kerres, "Development of ionomer membranes for fuel cells," Journal of
Membrane Science, vol. 185, pp. 3-27, 2001.
[18] J. Suntivich, H. A. Gasteiger, N. Yabuuchi, H. Nakanishi, J. B. Goodenough, and
Y. Shao-Horn, "Design principles for oxygen-reduction activity on perovskite
oxide catalysts for fuel cells and metal–air batteries," Nature chemistry, vol. 3, pp.
546-550, 2011.
[19] P. G. Bruce, S. A. Freunberger, L. J. Hardwick, and J. Tarascon, "Li–O2 and Li–S
batteries with high energy storage," Nature Materials, vol. 11, pp. 19-29, 2012.
Page 68
55
[20] R. Borup, "Scientific Aspects of Polymer Electrolyte Fuel Cell Durability and
Degradation," ChemInform, vol. 38, 2007.
[21] J. C. Meier, I. Katsounaros, C. Galeano, H. J. Bongard, A. A. Topalov, A. Kostka,
et al., "Stability investigations of electrocatalysts on the nanoscale," vol. 5, pp.
9319-933, 2012.
[22] T. Palaniselvam, B. P. Biswal, R. Banerjee, and S. Kurungot, "Zeolitic
imidazolate framework (ZIF)-derived, hollow-core, nitrogen-doped carbon
nanostructures for oxygen-reduction reactions in PEFCs," Chemistry (Weinheim
an der Bergstrasse, Germany), vol. 19, pp. 9335-9342, 2013.
[23] P. Zhang, F. Sun, Z. Xiang, Z. Shen, J. Yun, and D. Cao, "ZIF-derived in situ
nitrogen-doped porous carbons as efficient metal-free electrocatalysts for oxygen
reduction reaction," vol. 7, pp. 442-45, 2013.
[24] H. L. Jiang, B. Liu, Y. Q. Lan, K. Kuratani, T. Akita, H. Shioyama, et al., "From
metal-organic framework to nanoporous carbon: toward a very high surface area
and hydrogen uptake," Journal of the American Chemical Society, vol. 133, p.
11854, 2011.
[25] Z. S. Wu, L. Chen, J. Liu, K. Parvez, H. Liang, J. Shu, et al., "High‐
Performance Electrocatalysts for Oxygen Reduction Derived from Cobalt
Porphyrin‐Based Conjugated Mesoporous Polymers," Advanced Materials, vol.
26, pp. 1450-1455, 2014.
[26] D. Zhao, J. L. Shui, L. R. Grabstanowicz, C. Chen, S. M. Commet, T. Xu, et al.,
"Highly Efficient Non‐Precious Metal Electrocatalysts Prepared from One‐Pot
Synthesized Zeolitic Imidazolate Frameworks," Advanced Materials, vol. 26, pp.
1093-1097, 2014.
[27] D. Zhao, J. L. Shui, C. Chen, X. Chen, B. M. Reprogle, D. Wang, et al., "Iron
imidazolate framework as precursor for electrocatalysts in polymer electrolyte
membrane fuel cells," vol. 3, pp. 32-325, 2012.
Page 69
56
[28] W. Zhang, Z. Y. Wu, H. L. Jiang, and S. H. Yu, "Nanowire-directed templating
synthesis of metal-organic framework nanofibers and their derived porous doped
carbon nanofibers for enhanced electrocatalysis," Journal of the American
Chemical Society vol. 136, p. 14385, 2014.
[29] P. Su, H. Xiao, J. Zhao, Y. Yao, Z. Shao, C. Li, et al., "Nitrogen-doped carbon
nanotubes derived from Zn-Fe-ZIF nanospheres and their application as efficient
oxygen reduction electrocatalysts with in situ generated iron species," vol. 4, pp.
2941-2946, 2013.
[30] J. M. Morgan and R. Datta, "Understanding the gas diffusion layer in proton
exchange membrane fuel cells. I. How its structural characteristics affect diffusion
and performance," Journal of Power Sources, vol. 251, pp. 269-278, 2014.
[31] J. F. Lin, J. Wertz, R. Ahmad, M. Thommes, and A. M. Kannan, "Effect of carbon
paper substrate of the gas diffusion layer on the performance of proton exchange
membrane fuel cell," Electrochimica Acta, vol. 55, pp. 2746-2751, 2010.
[32] A. Arvay, E. Yli-Rantala, C. H. Liu, X. H. Peng, P. Koski, L. Cindrella, et al.,
"Characterization techniques for gas diffusion layers for proton exchange
membrane fuel cells – A review," Journal of Power Sources, vol. 213, pp. 317-
337, 2012.
[33] I. Nitta, O. Himanen, and M. Mikkola, "Contact resistance between gas diffusion
layer and catalyst layer of PEM fuel cell," Electrochemistry Communications, vol.
10, pp. 47-51, 1// 2008.
[34] D. C. Montgomery, Design and analysis of experiments vol. Eighth. Hoboken,
NJ: John Wiley & Sons, Inc, 2013.
[35] A. Kannan, A. Menghal, and I. Barsukov, "Gas diffusion layer using a new type
of graphitized nano-carbon PUREBLACK® for proton exchange membrane fuel
cells," Electrochemistry Communications, vol. 8, pp. 887-891, 2006.
[36] A. M. Kannan, S. Sadananda, D. Parker, L. Munukutla, J. Wertz, and M.
Thommes, "Wire rod coating process of gas diffusion layers fabrication for proton
exchange membrane fuel cells," Journal of Power Sources, vol. 178, pp. 231-237,
2008.
Page 70
57
[37] C. Lim and C. Y. Wang, "Effects of hydrophobic polymer content in GDL on
power performance of a PEM fuel cell," Electrochimica Acta, vol. 49, pp. 4149-
4156, 2004.
[38] K. Eom, E. Cho, J. Jang, H.-J. Kim, T.-H. Lim, B. K. Hong, et al., "Optimization
of GDLs for high-performance PEMFC employing stainless steel bipolar plates,"
International Journal of Hydrogen Energy, vol. 38, pp. 6249-6260, 2013.
[39] B. Y. Xia, Y. Yan, N. Li, H. B. Wu, X. W. Lou, and X. Wang, "A metal–organic
framework-derived bifunctional oxygen electrocatalyst," Nature Energy, vol. 1, p.
15006, 2016.
[40] S. H. Hsu, C. T. Li, H. T. Chien, R. R. Salunkhe, N. Suzuki, Y. Yamauchi, et al.,
"Platinum-free counter electrode comprised of metal-organic-framework (MOF)-
derived cobalt sulfide nanoparticles for efficient dye-sensitized solar cells
(DSSCs)," Sci Rep, vol. 4, p. 6983, 2014.
[41] J. F. Lin, A. Adame, and A. M. Kannan, "Development of Durable Platinum
Nanocatalyst on Carbon Nanotubes for Proton Exchange Membrane Fuel Cells,"
Journal of The Electrochemical Society, vol. 157, p. B846, 2010.
[42] D. Wang, H. L. Xin, R. Hovden, H. Wang, Y. Yu, D. A. Muller, et al.,
"Structurally ordered intermetallic platinum-cobalt core-shell nanoparticles with
enhanced activity and stability as oxygen reduction electrocatalysts," Nature
materials, vol. 12, p. 81, 2013.
[43] G.-H. Wang, J. Hilgert, F. H. Richter, F. Wang, H.-J. Bongard, B. Spliethoff, et
al., "Platinum-cobalt bimetallic nanoparticles in hollow carbon nanospheres for
hydrogenolysis of 5-hydroxymethylfurfural," Nature materials, vol. 13, p. 293,
2014.