Page 1
University of Gothenburg
Chalmers University of Technology
Department of Computer Science and Engineering
Göteborg, Sweden, May 2012
Design and Implementation for Report Layout
Merging
Bachelor of Science Thesis [in the Programme Software Engineering and
Management]
YANLING JIN
AMBER OLSSON
Page 2
The Author grants to Chalmers University of Technology and University of Gothenburg
the non-exclusive right to publish the Work electronically and in a non-commercial
purpose make it accessible on the Internet.
The Author warrants that he/she is the author to the Work, and warrants that the Work
does not contain text, pictures or other material that violates copyright law.
The Author shall, when transferring the rights of the Work to a third party (for example a
publisher or a company), acknowledge the third party about this agreement. If the Author
has signed a copyright agreement with a third party regarding the Work, the Author
warrants hereby that he/she has obtained any necessary permission from this third party to
let Chalmers University of Technology and University of Gothenburg store the Work
electronically and make it accessible on the Internet.
Design and Implementation for Report Layout Merging
YANLING JIN
AMBER OLSSON
© YANLING JIN, May 2012.
© AMBER OLSSON, May 2012.
Examiner: HELENA HOLMSTRÖM OLSSON
University of Gothenburg
Chalmers University of Technology
Department of Computer Science and Engineering
SE-412 96 Göteborg
Sweden
Telephone + 46 (0)31-772 1000
Department of Computer Science and Engineering
Göteborg, Sweden May 2012
Page 3
1
Design and Implementation for Report Layout Merging
Yanling Jin University of Gothenburg Göteborg, Sweden
[email protected]
Amber Olsson University of Gothenburg
Göteborg, Sweden
[email protected]
ABSTRACT
Merge tools are an increasingly used feature in col-
laborative environments. Being able to combine ver-
sions gives greater access to contributors as they can
work independently on the same work. However,
merge tools for working with data beyond textual
comparisons have less research devoted to them. This
thesis focuses on the creation of merging functionali-
ty for report layouts in Report Definition Language
(RDL) through the design of an intuitive interface and
effective merge algorithm. Interviews were conducted
to gather requirements from the application users. A
prototype was implemented for a two file merge with
user interaction. The approach taken was to analyze
the layout and find the corresponding matches. The
interface was designed to maximize usability and
included features using colors and viewing windows
for comparison.
General Terms
merging algorithms, differencing algorithm, cognitive user
interface
Keywords
report definition language; intuitive; merging; versioning
1 INTRODUCTION
Merge tools play an important role in a collaborative
environment. There are often several versions of a
document being created during the collaboration pro-
cess. These file versions can be considered revisions
that can be combined to achieve the final copy with
the possibility of desired changes taken from either
revision [1]. Merge tools are used to assist the collabo-
rators to find the differences between file versions and
selectively merge them into the same file.
Merge tools have generally been limited to line by line
comparison between two text files [2]. For a task such
as programming, line by line comparison has been
established as a functional, intuitive way of solving
the merging task [3]. For report layout design, the
complexities have challenged the common design of
the merge tools. Current text based or binary version
control systems are not adequate for documents with
graphics [3].
During the report layout merging process, the users
need to see how things have changed in order to un-
derstand how one change fits in the report. The user
must understand a large amount of data for each item
change, which can include position, size, color, or
attached conditions. Merging the textual representa-
tion of the report layout does not provide a visualized
view of the changes made nor handle the larger
amount of data for each item change, which might
lead to inconsistency of the overall layout as the re-
sult.
Most of the report layouts are recorded in XML-based
documents. XML is considered a standard, and it is a
language increasing in popularity [4]. Many languages
have been developed based on XML, including
XHTML and RSS. This makes XML a primary data
format for the publishing and transport of documents
on the internet [5].
Textual based merge tools are sensitive to changes of
the order in which lines appear in a text file, as well as
the indentation of the text file [3, 6]. For report layouts
in the XML documents, the changes of the line order
or the indentation of the text is irrelevant. Thus, using
textual merge tools will not produce the result wanted
for report layout merging.
As a response to the challenges described above, this
thesis presents a novel design for merging report lay-
outs recorded in Report Definition Language (RDL).
RDL is an XML-based language for representing
reports. It is an open schema proposed by Microsoft
in order to encourage the interchange of the report
definition [7].
This thesis focuses on the following objectives:
1. The identification of requirements for report
layout merging.
2. The implementation of functions for differ-
encing and merging report layout in RDL
documents.
3. The implementation of an intuitive interface
that supports the user in making the appro-
priate merge decisions.
Munson and Dewan along with Förtsch and West-
fechtel identified requirements for merge tools, but
the-se are not originally meant for RDL [2, 3]. Algo-
rithms previously used for differencing in XML [6, 8,
9] are not ready for RDL without changes. This thesis
provides new ideas in the research area of report lay-
out merging tools which has previously not been a
subject with much innovation.
Page 4
2
The solution in this thesis involves three major fields:
differencing, merging, and user interface. The differ-
encing uses an algorithm to compare report layouts in
RDL documents from a conceptual level. “Conceptu-
al” means that the comparison is not done on the
plain text, but that it is based on a logical, structural
understanding of the data recorded in the RDL docu-
ments. Merging includes finding out the dependen-
cies between the differences and performing the
merge process to each independent set of differences.
The merge process results in a set of differences.
These differences are presented to the user in an in-
tuitive way. The user interface of the solution is de-
signed to meet the visual requirements for report lay-
outs merging which includes high usability require-
ments. The interface should enable the merge process
to be easier for the user than the alternative of manu-
ally differencing and merging.
The findings of this thesis are implemented as added
prototype functionality to the IFS Report Designer
Tool. The IFS Report Designer Tool allows a user to
make a change to a default template, when this de-
fault template is updated by IFS, the user may want to
switch to this updated version. Including the user’s
previously revised changes to the updated version is
the functionality to be designed for this report design-
er tool. Two kinds of merging can be performed de-
pending on the existence of the original template: a
two-way merge between the user’s changed version
and the new template, and a three-way merge with
some degree of automated merge between the user’s
changed version and the new template based on the
original template. For prototype design and develop-
ment in this thesis, the focus is on two-way merging.
1.1 Background
This thesis is relevant to industry. Specifically, merg-
ing report layouts is an important task at IFS. Though
the need to merge layouts seldom occurs, it is almost
guaranteed to happen. Changes made to the base ver-
sion of the layout provided by IFS result in a new
version, and version changes often occur several
years apart.
Since the IFS default template provides information
with great detail, the customers usually need to re-
move items from the template to fit their needs.
Whenever the default templates are updated by IFS,
in order to switch to the newest versions, all the
changes made to the old default templates by the cus-
tomers are needed to apply to the new ones.
The current solution is based on a process of mostly
manual updates. The manual method is slow and in-
convenient. Each merge process can take up to be-
tween 30 and 40 hours. The manual process of merg-
ing two layouts involves having the user make a list
of changes from one layout compared to another. The
user then resolves the changes one by one using the
normal editing process of the report layout designer
tool.
This manual merging of revisions can be challenging
for users due to the large amount of information, with
some information being hidden or subtle. Although
graphically similar, hidden data between versions can
have been updated.
The users sometimes use a line-by-line merge tool
known as Delta Engine, an in-house versioning tool
for getting the delta between report layouts. The tool
may ease the job of differencing but is not considered
the solution for the merge process and suffers from
the drawbacks of line-by-line merging such as low
contextual understanding. The tool does not give the
user any data on changes that have been made. It is a
difficult task for the user to accomplish calculating
this data unaided.
1.2 Structure of the thesis
The thesis is structured as following: Section 2 intro-
duces the basic notions. The research method for this
thesis is given in Section 3. Section 4 reviews the
related work on merge tools and user interface princi-
ples. Section 5 presents the requirements taken from
the data collected. Section 6 explains the implementa-
tion of the solution, including the algorithms used and
the user interface design details. Section 7 provides
the conclusion. Recommended future work is speci-
fied in Section 8.
2 BASIC NOTIONS
2.1 Report Definition Language (RDL)
RDL is an XML-based schema that defines a report
file. A report can be seen as a combination of Data,
Layout, and Properties [7]. The data includes the
structure and methods for obtaining data. The layout
describes how to present the data. The properties are
the parameters that customize attributes of individual
parts. RDL is highly customizable allowing develop-
ers (e.g. IFS) to create their own versions.
Figure 1 A portion of the report layout in RDL
Page 5
3
Figure 1 presents the structure of a table recorded in a
page body in RDL. This can be recognized as similar
to the hierarchical structure of XML. The hierarchical
data form of XML is opposed to the flat data of a text
file[5]. This portion of RDL can be read such that
page-body has a table that has properties; table has
three table-columns, and each column has properties;
table has a table-body; table is linked to a data source
which is titled as YEAR, etc.
This thesis uses the IFS customized RDL version as
an example to approach the merging problems for
report layouts. The report layouts get the data infor-
mation from a data source file. The RDL cannot op-
erate without the data source file [10].
Figure 2 An example of a tree-structure of report layout
The RDL documents can be parsed into tree-based
structures. The page sections and the pages are pre-
sented as the direct children of the report layout. This
is seen in Figure 2.
2.1.1 Page Sections
There are total seven types of page sections. The
types shown in Figure 2 include: First Header, First
Footer, Repeating Header, Repeating Footer, Last
Header, Last Footer and Page Body. Each page sec-
tion contains layout items that belong to the section.
The page body is a flow area since it can be expanded
according to its content. The header and footer are
static area as they are fixed.
2.1.2 Report Settings
There are three different types of pages: first, repeat-
ing and last. Each page consists of three sections:
header, body, and footer. All three types of pages can
have different designs by referring to different page
sections.
One report can have different headers and footers for
each page, but can only have one page body. The first
page and last page optionally include the flow area.
The repeating page must contain a page body.
For example, in Figure 2 An example of a tree-
structure of report layout, there are three pages: first
page repeating page, and the last page. The repeating
page uses repeating header, page body, and repeating
footer. The first page and last page have their own
headers and footers.
2.1.3 Layout Items
An item can be thought of as an object. An item can
be one of the following: Text, Block [Container],
Tables, Chart, Line. Each item contains a variety of
properties that specify the attributes, such as font,
position, and stored data. The table consists of table
columns, table rows, table cells, and table conditions.
Tables, table cells, rows, and columns have separate
properties.
2.1.4 Properties
Figure 3 An example of text field in RDL documents
The report layout, page sections, and layout items
have their own properties. The properties are different
depending on the types of the layout objects. Differ-
ent objects can have different property values. In Fig-
ure 3, the text field has properties such as font,
height, width, location, etc.
2.1.5 Data Source
The data source in the report layout contains a query
to retrieve stored data. Not all layout items contain
data sources. Most commonly, a text field, a table, or
a chart contains data sources. Items such as lines and
containers do not have data sources since these items
cannot contain data information. In Figure 3, the text
field can retrieve the data from the specified data
source.
2.1.6 Conditions
Conditions are used to control the properties of an
object, including the visibility. Conditions can be
added to tables, table rows, table cells and block con-
tainers. Not all layout objects contain conditions. In
Figure 3, the text field has a visibility condition.
2.2 Difference (Delta)
There are three types of differences while making
file-to-file comparison: change, insertion, and dele-
tion. The differences are between two versions of an
item belonging to two revisions of a layout. The iden-
tification of these differences is determined by the
existence of the matching item on the other revision.
These differences should be treated separately from
Page 6
4
both the user interface perspective and from the algo-
rithm.
Detailed merges may have the user wishing to accept
or reject all differences down to each individual prop-
erty change of an item. However, multiple property
changes can be seen as one large change. Using one
large change to represent the difference can achieve
higher efficiency.
2.3 Graphical user interface (GUI) related terms
Figure 4, Overview of GUI components
The following terms are used throughout the thesis.
Figure 4 is an overview of GUI components related to
the report layout merge tool. Figure 4 provides an
idea of how each component related to the GUI
frame. The following definitions, labeled A to F de-
fine the sections of Figure 4 with the same letter.
A. Report Paper (Main canvas)
The report paper is the visual working space for edit-
ing a report layout.
B. Definition Tree (Schema)
The definition tree is the data definition source for the
report layout.
C. Layout Tree
The layout tree is the tree-based data display of all
items of the layout.
D. Difference Tree
The difference tree, often referred to as diff-tree, is
the categorized tree-based data display of all differ-
ences calculated between revisions.
E. Property Window
The property window contains a list of settings, or
properties, displayed for the currently selected item.
F. Preview Window
The preview window is the display for understanding
placement and highlighted items between two revi-
sions. The preview window consists of two preview
screens, one for each revision.
3 METHOD
3.1 Design Paper Prototyping
Example interface design mockups were created, af-
ter initial research began, that were used as discussion
points during the interviews and as guides during
development. The prototypes were made to look more
realistic for the interviewees by editing images manu-
ally taken from the IFS Report Designer Tool. Addi-
tional picture clips were added to the images to visu-
alize the interface ideas such as highlighting, compo-
nents for merge, etc. These paper prototypes are in-
cluded under Interview Questions, section PROTO-
TYPE.
3.2 Interview Study
Semi-Structured interviews with the users of the IFS
Report Designer Tool were conducted to gather re-
quirements. The interviews were focused on how the
users understand the merging task and how the merg-
ing task is currently performed. Interviewing allowed
the research to be more controlled as opposed to es-
tablishing requirements based only by documentation
[11].The cooperating company, IFS, had granted the
permission and time.
A set of interview questions was formalized before
the interview. These interview questions are listed in
Appendix 1- Interview Questions. The questions
marked Developers Questions, were asked as an addi-
tion in the developer interview. The interview started
with asking how often the conflict occurs. This ques-
tion was included to help rate the importance of
merging functionality related to the entire application.
This would affect if icons for merging functionality
should be visible and inactive or hidden, for example.
Questions two, three, and four were asked to gain an
understanding on the current working method for
solving the merge problem. Knowledge from the cur-
rent working method was for gaining the cognitive
aspects of the user’s thinking process, which should
be taken into consideration during the design.
For interview section part two, with the first two
questions, the user’s goals for the functionality were
requested. The answers were used to help formalize
the requirements of the report-layout merging. Ques-
tion three was asked for input on the customer. This
information presented an overview on the most com-
monly occurred difference types for merging. Ques-
tion four discovered information about the user’s trust
in the system as well as their desired level of control.
Question five provided information on what data is
considered important or should be hidden. With ques-
tion six, the priority of the properties window was
taken into account when changing the GUI for merg-
ing.
Page 7
5
With interview section part three, the developer ques-
tion one and three answered whether or not the inter-
face paper prototypes showed GUI features that are
conflicting with other GUI plans. The answer helped
split the GUI appropriately. Question two was de-
signed to find information about past design features,
specifically on the preview window. The technical
challenge of this aspect or if it proved a negative ad-
dition for the user, was important to know. Question
four was asked in order to benefit from the experi-
ence of someone familiar with the tool’s development
for upcoming challenges during implementation.
Four paper prototype designs (Interview Questions,
section PROTOTYPE) were shown to the interview-
ees. The interview was directed towards reviewing
these designs for criticism and comments. Finally the
participants were asked their preference of the four
example interfaces.
All interviews followed the same basic structure with
some variation which included some additions or
subtractions. Follow-up questions were allowed in the
case of interesting directions the interview took.
The individuals interviewed included Eva Sedola,
Daniel Svantesson, and Edina Becirovic. These three
individuals were selected based on their experience
around the IFS Report Designer Tool. Daniel
Svantesson was interviewed as a developer, and Eva
and Edina were interviewed as consultants and the
IFS Report Designer Tool users. Daniel Svantesson
attended the other two interviews because of his ex-
perience and interest in the tool.
Interviews were conducted on the date of April 3rd,
2012. Participants were given consent papers to de-
cide if their material would need to be anonymously
used and whether or not the interview could be rec-
orded. This was done to promote trust and maintain
an ethical research approach [11].
The interviews were carried out in English since all
parties involved speak fluent English. The interviews
were audio-recorded. The duration set for each meet-
ing was between half of an hour and one hour. Spe-
cifically interview 1 was 35 minutes, interview 2 was
38 minutes, and interview 3 was 48 minutes.
The three interviews were studied for analysis and
notes were taken on the contents. When a suggestion
or comment was given, it was rephrased as a re-
quirement. The list was then prioritized based on how
strong the feature was wanted by the interviewee.
Both authors of the thesis were present during each
interview and interpreted the recordings for data col-
lection. Using two observers provides the advantage
of increasing accuracy of the data collected [7]. In-
formation retrieved from the user interviews was used
as the first hand information for formulating and pri-
oritizing requirements.
3.3 Development
The prototype functionality was implemented in Java.
The design of the prototype was based on the re-
quirements formalized throughout the interview. The
prototype was developed as functionality built into an
already existing application, the IFS Report Designer
Tool.
The source code of the IFS Report Designer Tool was
studied. A set of user stories was created to cover the
planned functionality. This includes the list of merge
requirements and interface requirements.
The development was iterative, and the work was
done using agile methods. Working agilely provided
the ability to adapt to changes, so feedback during
this stage could directly affect development. Modifi-
cations were made to the requirements during the
development according to new data discovered or
prioritized.
4 RELATED WORK
This section describes work related to the problem of
merging functionality design. This is described in the
form of strategies and solutions for algorithms ob-
tained from the studied literature and requirements
information of a merge tool.
The section is structured with a list of general re-
quirements for merge tools, followed by the studies
on the XML merging algorithms. The user interface
principles are presented afterwards.
4.1 Merge Tools Requirements
Requirements in this section were taken from previ-
ously identified requirements [2, 3].These require-
ments were analyzed during the design research and
the decision to include the requirement or not was
ultimately based on the research conducted for the
design.
Munson and Dewan identified a list of high level re-
quirements for a merge tool during the development
of an object merging framework. These requirements
explained how it was believed a merge tool should
behave based on their observation of user situations
for merging [2].
Other requirements were identified during develop-
ment of a version control and merging system for
UML diagrams by Förtsch and Westfechtel. These
requirements represent a collection of requirements
based on what was judged as good in the applications
[3].
The decision of including these requirements depends
on the context of the specific tool. In some cases the
requirements have higher or lower priority. The
choice of including the merge requirements is de-
pendent on the data or file type which the tool sup-
Page 8
6
ports. Only for text or binary would line-by-line
methods be appropriate. In some cases, the require-
ment may contradict each other. For example, effi-
ciency may have to trade-off against accuracy.
Differencing Merging
(R1) Accuracy- The differ-
ences between two files
should be detailed and trust-
able as correct.
(R10) Conflict detection-
When merging, conflicts are
automatically found be-
tween versions.
(R2) High conceptual lev-
el- The context of the dif-
ferences should be under-
stood beyond the textual
representation.
(R11) Conflict resolution-
When merging, conflicts
can be resolved between
versions.
(R3) Domain independ-
ence- The differencing
should not be limited to a
single data type.
(R12) Interactive merging-
Merging can be automated
or manual. With interactive
merging, the user is given
control to keep or remove
changes.
(R4) Tool independence-
The differencing should be
free from limitations of the
tool that created the files.
(R13) Three-way merging-
Merging can be made with a
base version between two
files taken into the algo-
rithm.
(R5) History independ-
ence- A history of changes
should not be required to
find the differences between
two files.
(R14) Preservation of con-
sistency- The consistency of
the input is kept as close as
possible to the same level
when finished merging.
(R6) Efficiency- The tool
should have a high perfor-
mance level with the least
amount of resources.
(R7) User-friendly repre-
sentation- The tool shall
have high usability.
(R8)Line-by-Line Com-
parison- is done using cor-
responding line numbers
between versions.
(R9) Lightweight ap-
proach- Implementation
should be as efficient as
possible.
Table 1 Requirements from Munson & Dewan and Förtsch &
Westfechtel [2, 3]
Table 1 is the combination of requirements. Duplicate
requirements were removed.
4.2 XML differencing
RDL and XML share most of the characteristics such
as hierarchical structure and usage of tags. Reviewing
XML differencing algorithms can help to understand
RDL differencing and merging.
There are two trends for merging [3]. The first is a
category in which unique identifiers are assigned to
elements in structured data for merging. The unique
identifiers can then be tracked through the different
versions. While efficient, it does not guarantee accu-
rate results [12, 13]. The second category files differ-
enced without the use of unique identifiers [3]. With-
out unique identifiers, similarity values must be es-
tablished before differencing.
Similarity Flooding [8] is a way to associate directed
graphs without unique identifiers. Similarity flooding
calculates related nodes by finding adjacent node
similarity. If the adjacent nodes between two models
are similar, there is an increasing likelihood that an
adjacent node is similar.
SiDiff [9] compares elements with the same types,
and starts with a bottom-up traversal at the leaves of
the composition tree by checking the similarity of the
child nodes. The matching algorithm has a low suc-
cess rate on the most bottom nodes since they are
almost the same. Opposite to SiDiff, UML Diff [6] is
an algorithm for detecting structural change in a top-
down approach. It compares the root node first, and
then goes down to the sub trees.
These algorithms have described merging UML dia-
grams in XML documents, but they do not cover im-
plementing these algorithms specifically with RDL.
RDL documents contain layout items with data
sources that can be used as an identifier. This helps to
find corresponding items between different versions.
However, for finding the matching objects in RDL
documents, the algorithms cannot entirely depend on
the data sources, since they are not unique. There are
cases in which the same data source can be used by
two layout items, and some items do not contain data
sources, such as lines and containers.
The algorithm used in this thesis for finding matched
objects is a combination of using unique identifiers
and processing without unique identifiers, such as
Similarity Flooding, SiDiff and UML Diff. The child
node’s similarity was used to finding the matches of
table cells, rows and columns. The process that starts
from the root object, finds the corresponding page
sections, and then compares its content follows a top
down approach. This is similar to the approach UML
Diff takes.
4.3 User Interface principles
User interface analysis is important for creating a tool
with intuitive interface and for tasks requiring visual
support. An intuitive user interface is vital to a good
merge tool. An unintuitive interface will result in the
loss of the benefits of efficiency potential the merge
tool has [14]. Cognitive engineering principles have
Page 9
7
an emphasis on the mental process which would aid
creating an intuitive design [15].
1. Automate unwanted workload.
2. Reduce uncertainty.
3. Fuse data.
4. Present new information with meaningful aids to
interpretation.
5. Use names that are conceptually related to func-
tion.
6. Limit data-driven tasks.
7. Include in the displays only that information
needed by the user at a given time.
8. Provide multiple coding of data when appropri-
ate.
9. Practice judicious redundancy.
These principles were used to plan the design of the
prototype. The principals also allowed some features
to be identified and implemented.
5 REQUIREMENTS
This section contains the data collected in the form of
requirements. Part of this data was collected from the
interviews conducted. Additional information was
recorded during development. The full list of re-
quirements is contained in Appendix 2. The non-
functional requirements are primarily tool specific
and are efficiency, accuracy, usability, and reliability.
5.1 Diff-Algorithm
2-diff is the merge function which processes two re-
visions to result in a single revision with the desired
parts of both. 3-diff can make an automated merge
possible. If two documents share the same base ver-
sion, the base version can serve as an arbitrator to
increase the automation.
2-diff is a critical function, and 3-diff would first be
reliant on the implementation of 2-diff. The merge
process requires that the algorithm is able to match
items between revisions in order to understand the
changes that have taken place.
The automatic functioning minimizes the user inter-
action. The downside to automation is that it decreas-
es the reliability of the change resolutions. For this
reason, the reliability should be kept in check by hav-
ing the user approving all automated changes.
5.2 Revision Differences
The differences should be categorized in terms of the
differences types, such as change, deletion and inser-
tion. The amount of differences can be used as a ref-
erence for estimating the time required for merging.
The difference types along with the amount of the
differences of each type could provide a summary of
the differences.
Differences should be visible on the screen. The fol-
lowing user scenario was described where the user is
able to select an item that has another version and the
differences would become visible on the screen. This
was expanded to being able to select between revision
one and revision two changes, to immediately see the
affected item switching between versions.
The choice of indicators for marking change should
be easily visible and distinguishable. Using lines to
show the association of differences between two ver-
sions would be a problem with the type of changes
such as deletion and addition.
5.3 User Interaction
The interface for the merge function should include a
next button to cycle through the list of categorized
differences. Users are more positive when there is a
feeling of more interaction [16]. The button provides
immediate feedback to the user, giving a sense of
satisfaction.
It could be troublesome to go through each property
of a component to accept the changes. A separate diff
tree could be used as well to more easily distinguish
types of changes.
When merging, the user should be able to edit chang-
es. Users participated in a noted study by Dadgari and
Stuerzlinger [14] were reported to dislike finishing a
merge and then continuing to edit, but instead pre-
ferred the freedom to edit during the merging process.
The user should be able to mark resolved or unre-
solved for each difference. This should remove a dif-
ference and keep the current revision or take from the
other revision. A context-sensitive right click menu
has been used in other applications [17]with some
success. A right click menu to accept or reject chang-
es would fulfill this requirement. This follows the
idea that the interface should only provide data to the
user as the user needs it [15] since the data can be
hidden until a right click is activated.
5.4 Property Window
The property window presents detailed information
about selected items properties. Not all properties are
visible by viewing the items on the report paper. The
property window solves this problem. The property
window is important to perform the merge, since each
difference on the property of an item should be visu-
ally indicated in order to properly view changes. A
floating property window is an option with regards to
rationing screen space.
Page 10
8
5.5 Preview Screen
The inclusion of preview screens leads to familiar
feelings due to the similarity with traditional merge
tools. Small preview screens are considered to be of
limited use as far as seeing the details of a report lay-
out. Depending on the different complexity level of
the report layout, magnification at a high percentage
might be required. A magnification function can be
applied to the preview screen to help to view the dif-
ference details. The user would be able to limit the
working view to a small zoomed-in portion while the
preview screens provide a view of an entire item.
5.6 Spacing UI
Spacing problems can occur easily because of the
large amount of important information that needs to
be communicated to the user. The information is
competing for screen space. While Interview Ques-
tions, section PROTOTYPE, Diagram B has a good
metaphor, since side-by-side is a common design for
merging tools, but the required space cannot fit the
space constraints.
A unified diagram may be constructed which shows
the common and all specific items contained in only
one version when not enough space is available [9].
Selecting one layout to be used as a master layout
carries the benefit of giving precedence to a single
layout [14]. Using the main canvas for performing the
merging task as well as editing the report layout can
keep the user’s focus in one place by not having the
user switch working areas.
The view should be customizable to hide objects the
user does not need to compare [17]. For the require-
ments of this design, a zoom-to-change feature for the
main canvas would be optimum in providing the user
the ability to focus on the change by zooming into the
layout to a degree that may hide other data apart from
the change.
The merge selection on Diagram A of the paper pro-
totype is represented by radio buttons labeled A and
B. Due to the screen space constraints and the im-
portance of the layout as a whole, the merge selection
should stay hidden until the user selects a conflict to
merge.
5.7 Following Standards
The standards of previous tools, as well as the report
designer tool itself should be put into the design
where possible. One aspect of this is the main report
paper screen in the center. This works with the user’s
current cognitive process when designing and saving
a report layout. Interview Questions, section PRO-
TOTYPE. Diagram A was considered positively be-
cause the look and feel was keeping the original de-
sign of the report designer tool. Diagram B of the
paper prototype was direct and familiar. This famili-
arity originated from the line-by-line merging tool
used when merging code.
The names of A and B for the merge selection, on
Diagram A, C, and D, for choosing revisions caused
some confusion and the appropriateness was suspect
in the diagrams. Using file names was not considered
a much better proposal due to the fact that load order
affects how the files are worked with. The idea is that
terminology in the line-by-line merge tool could pos-
sibly be used, and in this case the files would be
named as revisions.
5.8 Visualizing Change
A. Minimizing Data Information
The choice for displaying only one change at a time is
the result of the fact that the screen can become clut-
tered, as some report layouts will have many differ-
ences between versions. Showing several differences
can have the negative result of separating the atten-
tion of the user, thus decreasing the user’s effective-
ness.
B. Using Colors
Color can group items together [18]. Users will asso-
ciate similarly colored items together and give similar
meanings to them. For this reason, the use of colors
will be incorporated into the design to better reflect
types of differences, while the difference category, as
change, insertion, or deletion should be grouped to-
gether with the use of color. However, it is recom-
mended as a rule to use no more than between three
and seven color codes as it becomes confusing and
the usability decreases [18]. Selecting distinct, bright
and saturated colors, make the colors easily discrimi-
nated [18].
The use of color should be matching with real-world
convention. Since the interface colors will guide the
behavior of the user, the choice of colors is important
for usability [19]. The information should present in a
way that does not require user to memorize them. The
user’s tacit knowledge and skills should be under-
stood [20]. For example, using red color can refer to
conflict or stop in the user’s mind.
The users focus can be controlled by using colors [1,
18]. In the demo paper prototypes shown during the
interviews, the highlighted items were seen to grab
the attention of the user. Using color coding can
speed the search [18]. While using the merging tool,
the user can more easily find the difference between
related objects if the objects are highlighted.
C. Symbols
The methods shown on the paper prototype may be
problematic for additions and deletions. The user
would not be aware of where the addition was meant
to show. This is the effect of the method relying
completely on a red outline of an object and its op-
Page 11
9
posing, changed version to also be outlined in red for
comparison. The change selection method shown in
the example has a low probability of allowing the
user to distinguish smaller changes.
Symbols such as an X or question mark can work to
illustrate items that are deleted. Design layouts that
display changes in text format are not making use of
graphical data for a user friendly design [3].
The icons themselves should be different from other
designs, but keep obvious characteristics to give the
meaning to the user [19]. The icons used should be
recognized for its interaction.
5.9 Concluding Design
The conclusion of the design information collected
points to the idea that the layouts are complex. The
simplicity of the example layout chosen for the paper
prototype on Interview Questions, section PROTO-
TYPE, resulted in difficulty when trying to fully un-
derstand the usability of the potential interface. As
expected, none of the paper prototypes was consid-
ered perfect. A mix of the better received features
was determined as a strategy for the design.
6 IMPLEMENTATION
This section describes the implementation created
based on the requirements collected. The features,
design, and algorithm included in the prototype are
explained. The section is structured in two parts, the
algorithm and the user interface.
The requirements designated for implementation in
the prototype are a subsection of the requirements
indicated by being underlined in Appendix 2.
6.1 Design of Algorithms
The algorithms can be divided as two parts, differenc-
ing and merging. The differencing algorithm has the
purpose of finding the corresponding objects between
two layouts and analyzing the differencing types. The
purpose of the merging algorithm is resolving the
differences. This is achieved by selecting one version
between the revisions to be used as a final version.
Assumptions
The algorithms follow the RDL implemented by the
IFS Report Designer Tool [21]. Some assumptions
were made based on this.
A. There is a definite presence of certain parent
nodes, such as Report Layout, Page Body.
B. Layout items in one page section cannot be
moved to another page section. For example,
a text field in the repeating header cannot be
moved to page body [10].
C. Layout items in a detail table cannot be
moved to its master table [10].
D. The name of the root objects and its direct
children are always unchanged.
E. Each table cell can have at most one child.
For example, a table cell may not contain
two charts.
F. The physical locations of layout items that
are the direct children of each page sections
are determined by their properties instead of
the tree locations.
G. Most layout items, such as text field, table,
and chart, contain a proper data source link.
Lines and containers do not have data
sources.
H. The page sections and pages do not contain
data source link.
6.1.1 Differencing
STEP 1: Finding the corresponding page sections
(direct children of the root object) in order to com-
pare them.
According to assumption B, the matching objects will
be found under the same page section. Since the
names of the page sections are unchanged (assump-
tion D), finding the matched page section can be
based on the name alone. These matches are made by
the name and parent alone.
Figure 5 Two layouts compared at their base
For example, in Figure 5, the report layouts of revi-
sion 1 and revision 2 are compared. The image illus-
trates that a match has been by the line drawn be-
tween the layouts. The algorithm will continue by
looking at the children of these nodes separately.
STEP 2: Construct a list of nodes of each page sec-
tion.
Two lists are constructed to contain all the nodes and
their children except for the children of the tables.
The tables are put into the list for further comparison.
The children of the table (i.e. table content) are not
put into the list.
According to assumption C, the table content cannot
be moved outside its own table. It is therefore unnec-
essary to compare the table content with the items
outside the table.
According to assumption F, the tree positions of the
layout items under each page sections are irrelevant
since the physical location of the layout items drawn
Page 12
10
on the report paper is determined by their properties.
Even though placing the items in a list will result in
losing the tree position, it will not affect the physical
location of the layout items.
Figure 6 Revision lists are created
In Figure 6, the layout items of the separate revision
trees from Repeating Header are taken and put into
separate lists.
STEP 3: Compare the nodes contained in the lists
Figure 7 Layout items comparison
Two lists seen in Figure 7, which contain the layout
items from Repeating Headers, are compared. Each
layout item from list1 will be compared with all lay-
out items from list 2.
Figure 8 The formula for calculating the final weight
The weight is calculated based on a set of predefined
requirements, such as having the same data type, hav-
ing the same data source, or the properties of the
nodes being the same. The sum of each weight calcu-
lation returned is the final weight of the pairs, accord-
ing to the formula seen in Figure 8. The final weight
is used to indicate the similarity level between a pair
of nodes.
The weight values are based on following constants.
Each constant has different values based on the im-
portance of the requirement they stand for.
a. WEIGHT_LIMIT
b. WEIGHT_SAMETYPE
c. WEIGHT SAMEDATASOURCE_EXIST
d. WEIGHT_SAMEDATASOURCE_NONEXIS
T
e. WEIGHT_PROPERTY
1. Weight from the data type
Each node has a type corresponding to the structural
parts of a report layout, such as a table, a text field, a
chart, etc. The data types are checked to assign the
similarity. If two components are considered as a
match, then the data type must be the same. In Figure
7, string COMPANY_NAME of list1 is being com-
pared with the three strings of list 2. The pairs will
have a weight for similarity given because they share
the same data type. This given weight is based on the
value of the constant, WEIGHT_SAMETYPE.
2. Weight from the data source.
This is done by exploiting additional information,
e.g., from the layout schema. According to Assump-
tion G and H, most of the components contain data
information, such as text field, table and chart.
The data source is an important reference to deter-
mine whether these two components are matched or
not. If two components are matched, the data source
must be the same. If the components contain the same
data information, they are most likely matched.
In Figure 7, the strings COMPANY_NAME from
both lists contain the same data source, so the pair
will have a weight for the same data source assigned,
which is based on WEIGHT_SAMEDATA-
SOUCE_EXIST. If both of the items do not have data
source, such as the horizontal lines in Figure 7, a val-
ue based on WEIGHT_SAMEDATASOUCE_NON-
EXIST will be given.
3. Weight from the property similarity
If two nodes are matched then the two nodes share
most of the same property values. The similarity of
the properties can be used to judge whether two items
are matched or not.
Figure 9 The formula for calculating the weight from the property
The corresponding properties such as the font, posi-
tion and colors of two items are compared. The num-
ber of matched properties is increased when one
property value is same. Since different components
have different number of properties, a percentage of
the matched properties out of the total number of
properties is used to assign the weight, as seen in
Figure 9.
4. Process the total weight
Page 13
11
Figure 10 Weight for each pair of nodes been compared
As described earlier, the final weight returned is used
to determine how similar these two layout items are.
In Figure 10, there is a weight returned from each
layout item of revision 2.
A pair of layout items with the highest weight re-
turned is considered as the matched pair if this re-
turned weight is greater than the minimum (i.e.
WEIGHT_LIMIT).
Figure 11 Comparison after match
After this comparison, the matched item from revi-
sion 2, if it exists, is removed from list 2. For exam-
ple, in Figure 11, the string COMPANY_NAME
from list 2 is matched, therefore while the string
CREATED from list 1 making comparisons with the
items in list 2, the string COMPANY_NAME from
list 2 will not be compared again, since it is already
removed from the list. This step is repeated for each
item in list 1.
Every item of revision 1 and revision 2 will be placed
in one matched pair. If there are no matches found for
an item in revision 1 or revision 2, a null value will
be assigned to be the other item for the matched pair.
STEP 4: Differences Identification
The matched pair may contain a revision 1 item and a
revision 2 item, both items are tree nodes. This indi-
cates the nodes are ‘matched’ between revisions.
Nodes that do not have a match are also recorded in a
matched pair with the other node in a null value.
Figure 12 An example of change
A change is defined by a difference in properties or
conditions between an item from revision 1 and a
matched item from revision 2. This is seen in Figure
12 where a chart is changed between revisions.
Figure 13 Insertion and deletion perspective
The interpretation of an insertion or deletion is based
on the perspective from revision as shown in Figure
13. The presence of addition or deletion is detected
when an item has no matching counterpart in the oth-
er revision.
If the item is on revision 1 and lacks a match on revi-
sion 2, it is a deletion. The opposing situation with
the single item on revision 2 is an addition. In the
example above, the chart is either inserted or deleted
depending on which version is considered revision 1.
This MatchedPair data structure can be used to detect
the difference types. The two nodes from both revi-
sions are recorded in a matched pair, if node 1 is null,
then it is an insertion, otherwise, it is a deletion. If
both of the nodes are references to the nodes in revi-
sion 1 and revision 2, a properties check will be per-
formed to indicate whether they are a change or not.
STEP 5: Table processing
Upon reaching the table processing stage, all layout
items in revision 1 have been matched with their
counterparts of revision 2, or with a null value. The
tables that are the direct children of each page section
have also been processed, and each table is matched
either with a table or with a null value.
The next step is to match the table content and the
table structure in terms of row and columns. The al-
gorithm first matches the table content by extracting
the children of the each table cell and compares them.
The table structure comparison is based on the con-
tent matches. The algorithm uses the content matches
to indicate the matched rows and columns between
two tables.
1. Process the table content
Each matched pair of tables will be analyzed again,
and the contents will be extracted and placed into two
separate lists. The extraction of the contents follows
the same rules and process as STEP 2. All contents
including their children shall be placed into the lists
except for the content of the tables.
The treatment of the lists follows similar methods as
STEP 3. Each item in the first list will be compared
Page 14
12
with all items in the second list. A final weight is
returned as the similarity level between the pair of
nodes being compared. The comparison uses the
same weight constants shown in STEP 3. The differ-
ences identification of the table contents follows the
same method in STEP 4.
It is a recursive process to build the list of each ta-
ble’s content. After the first time comparison, new
tables might be found and matched due to the hierar-
chy structure of the tables. These new tables will be
analyzed again for the table contents comparison.
This step will repeat until there are not any available
tables left.
Figure 14 Table comparison
For example, in Figure 14, the Page Body contains
two tables, TABLE: COMPANY and TABLE: (not
connected). These two tables should have been
matched before this step occurs.
Figure 15 An example of lists constructed from the table contents
Figure 15 uses TABLE: COMPANY as an example
to illustrate the process of table content comparison.
A list is constructed when this table is being checked.
All items in the list will be processed and their corre-
sponding matches are found on the same hierarchy.
TABLE: AREA_CODE and TABLE: (not connected)
are the newly recorded tables. If there is a matched
found for the table, the content will be put into a new
list and the items of the list will be compared with all
the items in the other list which is constructed from
the corresponding table of the other revision. Accord-
ing to this, List (Table: AREA_CODE) is construct-
ed. This list will be further compared, and a new ta-
ble, TABLE: EMP_DETAIL will be found. The con-
tent from this table will be put into another new list
and analysis will be done accordingly.
This process repeats itself until there are not more
tables being recorded. In Figure 15, there is no table
among the content of Table: EMP_DETAIL, so the
process stops after the content of this table has been
analyzed.
2. Process the table structure
The rows and columns of the table are compared after
the table contents are matched. The algorithm follows
a bottom-up approach and finds the matches based on
the table contents.
The following constants are used for comparing the
table structures. These constants have different values
depends on the importance of the requirements they
stand for.
a. WEIGHT_TABLELIMIT
b. WEIGHT_CONTENTMATCH
c. WEIGHT_CONTENTMISSING
d. WEIGHT_EMPTYMATCH
e. WEIGHT_COLUMNNUMBERMATCH
f. ROWWEIGHT_ROWNUMBERMATCH
Row match
Figure 16 The formula for calculating the weight for the table
structure
Each row in revision 1 is compared with all rows in
revision 2. A weight based on the formula in Figure
16 will be returned and recorded into a matrix with a
dimension of number of rows in revision 1 times
number of rows in revision 2.
Figure 17 An example of table comparison
Table2_row1 Table2_row2 Table2_row3
Table1_row1
Table1_row2
Table1_row3
Table1_row4
Figure 18 Matrix table for row
Page 15
13
For example, In Figure 17, a table with 4 rows is
compared with a table with 3 rows; a matrix table
such as Figure 18 can be constructed to record the
weight values.
A. Weight from the content match / missing
Each child of a cell in a row of revision 1 will be
checked whether it has a matched node or not. If
there is a matched node found, and the matched node
is the content in the row being compared, then the
content is matched, a weight with the value of
WEIGHT_CONTENTMATCH will be returned.
If there is no match of the content found in the row
being compared in revision 2, the content is consid-
ered as missing, a weight with the value of
WEIGHT_CONTENTMISSING will be returned.
In Figure 17, if the first row in table 1 compare with
the first row in table 2 and assuming the text_field in
both rows have already been matched, this is consid-
ered as a content match. And since the chart in the
first row of table 1 cannot be found in the first row of
table 2, it is a content missing.
B. Weight from the empty matches
Some of the cells in a row might not contain content.
If both rows contain empty cells, it is considered as
an empty match for this pair of empty cells. For ex-
ample, in Figure 17, if the first row in table 1 com-
pares with the first row in table 2, there is one empty
match since there is one pair of empty cells, the value
of WEIGHT_EMPTYMATCH will be returned.
C. Weight from the column number match
If the matching contents are in the same column posi-
tion, it is considered as a column match. For example,
in Figure 17, both the text_field in the first row of the
two tables are the child of the first cell. The cell posi-
tion in a row is related to its column position. Thus,
the two text_fields are in the same column position,
and a value of WEIGHT_COLUMNNUMBER-
MATCH will be returned.
D. Weight from the row number match
If two rows being compared are in the same row posi-
tion, it is considered as a row number match, the con-
stant WEIGHT_ROWNUMBERMATCH will be
returned.
Column match
Finding column matches follows the same approach
as the finding the row matches described above. Each
column in revision 1 is compared to all columns in
revision 2. A weight is assigned to each pair of col-
umns for indication of the likelihood of match. The
weight is a sum of content match, empty match, col-
umn number match and row number match.
The weight is recorded into a matrix with a dimen-
sion of number of columns in revision 1 times num-
ber of columns in revision 2.
Matrix handling
Two matrix tables are constructed, with one of them
records the weights from the row comparisons, such
as in Figure 18, and the other one contain the weights
from the column comparisons.
The algorithm takes the highest weight recorded in
each row in the matrix table, if the weight is higher
than a predefined value, i.e. WEIGHT_TABLE-
LIMIT, the corresponding pair of rows or columns
will be assigned as a matched pair, otherwise, it indi-
cates that no match is found for this row or column in
the revision 1.
Table2_row1 Table2_row2 Table2_row3
Table1_row1 1.5 0.9 1
Table1_row2 0.5 0.6 0
Table1_row3 0 0 0.2
Figure 19 An example of matrix table
For example, in Figure 19, if the weight that is the
result of row1 of table 1 and row 1 of table 2 compar-
ison is greater than WEIGHT_TABLELIMIT, these
two rows are matched, since the corresponding value
is the highest in this matrix row. However, even if the
corresponding value from row 3 of table 1 and row 3
of table 2 is the highest among all values in the row,
if this value is not greater than WEIGHT_TABLE-
LIMIT, this will indicate that there is no match for
row 3 of table 1.
After the matrix for the row and columns being pro-
cessed, a thorough check is conducted on each row
and column in revision 2. If no match has been as-
signed, the row or the column will be added to the
matched pair with a null value as the other node.
Each matched pair will be checked to determine the
difference type as described in STEP 4.
6.1.2 Merging
At this point, the revision 1 and revision 2 parts have
been matched. The algorithm takes a clone of revi-
sion1 as the current Working Version.
The merge algorithm is based on the matched pair.
The merge process functions by modifying the cur-
rent node from the current Working Version to the
selection of the node1 of revision1 or revision2.
Figure 20 Selection from revision 1 or revision 2
Page 16
14
As seen in Figure 20, by replacing the selected node’s
properties, according to layout item from revision 1
or the layout item from revision 2, a change is
merged.
It is mentioned earlier in this thesis, that the algorithm
identifies three types of differences, change, deletion
and insertion based on the existence of node1 from
revision 1 and node2 from revision 2.
The merge algorithm operates based on the differ-
ences types. The following examples explain the
merge process. myNode is a reference to the current
node from the Working Version. myNode is a clone
of node1 from revision 1. Since the Working Version
is a clone of revision 1, it means revision 1 is the cur-
rent selected version.
Choosing revision 2 will be the first action taken
place. This action modifies myNode according to
node2. Similarly, choosing revision 1 modifies
myNode according to node1. The data structure ex-
planations for this are shown in Figure 21, Figure 22,
and Figure 23.
A. CHANGE
Figure 21 The data of a change
Choose revision 2: change all the properties values of
myNode to the property values of node2.
Choose revision 1: change all the properties values of
myNode to the property values of node1.
B. DELETION
Figure 22 The data of a deletion
Choose revision 2: Get the myNode’s tree position to
its parent node and delete myNode from its parent
node.
Choose revision 1: Add back myNode to its parent
node with the tree position recorded.
C. INSERTION
Figure 23 The data of an insertion
Since myNode is null, its placement in the tree struc-
ture is not obvious. myNode’s placement can be
found according to the parent of node2. This is done
by searching through the matched pairs of the
node2’s parent, and the corresponding node is the
potential parent of myNode.
Choose revision 2: Get the potential tree position of
myNode by referencing to the tree position of node2
according to its parent node. Assign myNode the val-
ue of node2, and add myNode to its potential parent.
Choose revision 1: Delete myNode from its parent.
6.1.3 Limitations
A. Similarity weight constants
The selection of weight values is achieved through
manual testing including the minimum similarity val-
ue the items rely on being matched. This process in-
volved changing values during a controlled merging
process, i.e. a merge process where the perfect
matches is known.
B. Minimum difference calculation and de-
pendent difference
Consider a table has a row which has a chart in it.
The row with the chart is contained only in revision
2. According to the current algorithm in this thesis,
both the row and the chart will be marked as inser-
tions. However there is no place to insert the chart if
the row is not inserted first. This is an example of a
dependent difference. Only making one row insertion
will be more appropriate in this case, because the
chart is the content of the row, and is dependent on
the row’s existence.
C. Limited requirements coverage of the weight
system
The weight system is based on a list of predefined
requirements. If a requirement is matched, a weight
constant will be returned and added to the final
weight for a pair of items being compared. However,
there are more requirements can be explored, such
that the sibling, parent match. The less coverage of
the requirements will result inaccuracy of the matches
being made.
6.2 The Merging Interface
This section details the implemented interface and
features for user interaction. The screenshots of the
application features are taken from the prototype im-
plemented.
6.2.1 Revision Differences
There are three categories implemented to distinguish
between differences. The three categories are known
as insertion, deletion, and change.
Figure 24 The statistics of differences
Page 17
15
One way implemented to provide data quickly to the
user is the comparison statistic functionality which
provides a summary of the number and types of dif-
ferences. This displays on a status bar for the user to
keep track of the unprocessed differences, as seen in
Figure 24. The colors match with the highlight colors
for the layout times on the main canvas to extend the
color meaning.
6.2.2 User Interaction
Figure 25 Diff Panel
Four icons make up the diff panel, as seen in Figure
25. While normally inactive and greyed out, during
the merge process these are controls for the user to
manage the merge process.
Two arrow icons allow the user to cycle through the
diff-tree. A history button, labeled “history” provides
a shortcut to the history function of the report design-
er tool to encourage the user to record his changes.
The remaining icon allows the user to change merge
processes.
Figure 26 Item selection on the difference report
The diff tree as seen in Figure 26 is located as a tab,
and upon selecting an item located in the diff-tree, the
user can see the selection.
The layout tree is still accessible and editable, allow-
ing the tool to be used for normal functioning to edit,
add, or delete items.
The items are able to be resolved by right-clicking
and using the resulting window to select resolved, or
in the alternative scenario, unresolved.
6.2.3 Property Window
The property window is visible at all times when an
item is selected. The property window is also part of
the merge process by highlighting the changed prop-
erties on between the two items.
6.2.4 Preview Screen
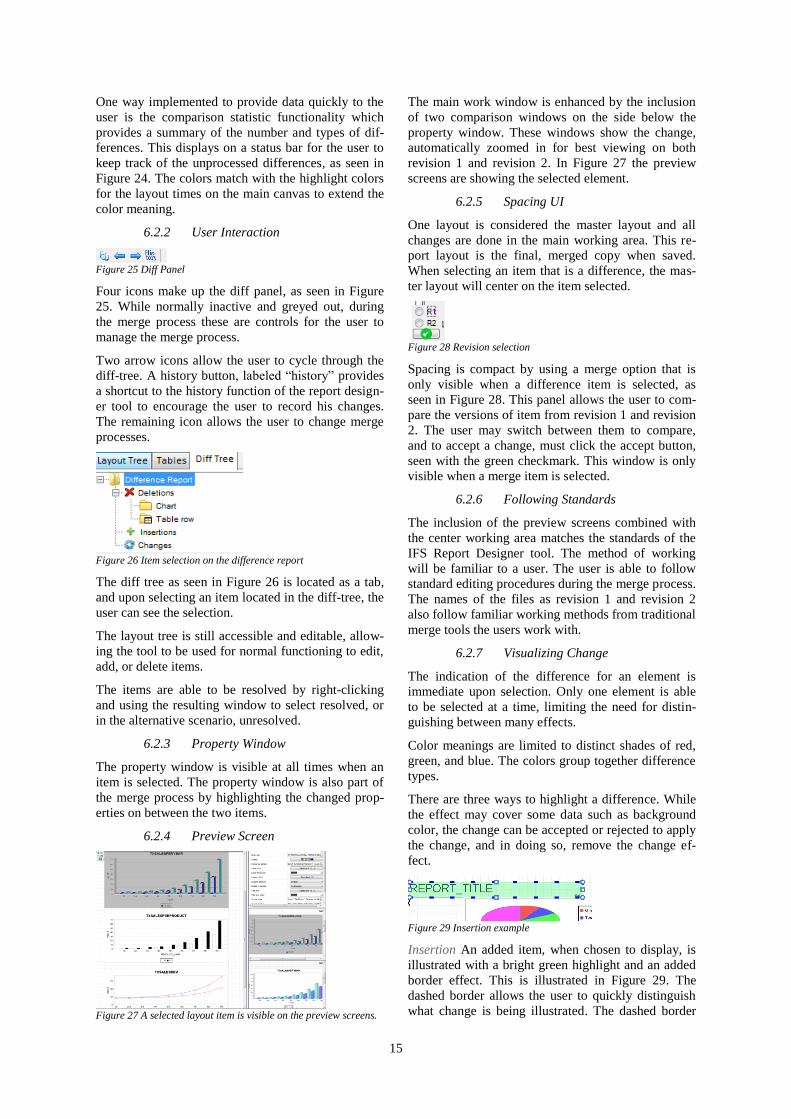
Figure 27 A selected layout item is visible on the preview screens.
The main work window is enhanced by the inclusion
of two comparison windows on the side below the
property window. These windows show the change,
automatically zoomed in for best viewing on both
revision 1 and revision 2. In Figure 27 the preview
screens are showing the selected element.
6.2.5 Spacing UI
One layout is considered the master layout and all
changes are done in the main working area. This re-
port layout is the final, merged copy when saved.
When selecting an item that is a difference, the mas-
ter layout will center on the item selected.
Figure 28 Revision selection
Spacing is compact by using a merge option that is
only visible when a difference item is selected, as
seen in Figure 28. This panel allows the user to com-
pare the versions of item from revision 1 and revision
2. The user may switch between them to compare,
and to accept a change, must click the accept button,
seen with the green checkmark. This window is only
visible when a merge item is selected.
6.2.6 Following Standards
The inclusion of the preview screens combined with
the center working area matches the standards of the
IFS Report Designer tool. The method of working
will be familiar to a user. The user is able to follow
standard editing procedures during the merge process.
The names of the files as revision 1 and revision 2
also follow familiar working methods from traditional
merge tools the users work with.
6.2.7 Visualizing Change
The indication of the difference for an element is
immediate upon selection. Only one element is able
to be selected at a time, limiting the need for distin-
guishing between many effects.
Color meanings are limited to distinct shades of red,
green, and blue. The colors group together difference
types.
There are three ways to highlight a difference. While
the effect may cover some data such as background
color, the change can be accepted or rejected to apply
the change, and in doing so, remove the change ef-
fect.
Figure 29 Insertion example
Insertion An added item, when chosen to display, is
illustrated with a bright green highlight and an added
border effect. This is illustrated in Figure 29. The
dashed border allows the user to quickly distinguish
what change is being illustrated. The dashed border
Page 18
16
also prevents the red and green color conflict that
occurs for individuals with problems distinguishing
between red and green colors.
Figure 30 Deletion example
Deletion A deleted item between revisions is indicat-
ed by the color red as well as having the X symbol
drawn over it as in Figure 30.
Figure 31 Change example
Change An item that has been changed between revi-
sions is highlighted a different color from normal
selection. This is seen in Figure 31. There is no sym-
bol used because the information about the change
can vary so much that symbols would become con-
fusing.
7 CONCLUSION
The user interface and algorithm covered in this the-
sis have been implemented in a prototype and demon-
strate a solution to the problem of report layout merg-
ing, and at the same time expand on the challenges
that still remain to be solved for report merging tools.
The user interface is designed to mimic some features
of traditional merge tools, such as side-by-side com-
parison while rationing the screen space required by
the merge process for communicating the necessary
data to the user. This was achieved with small, auto-
focusing preview-screens for the merging revisions.
The interface is designed to work functionally like the
designer tool of which it is a part. The automatic
highlighting of items combined with the ability to
cycle through a categorized list of differences allows
the user to quickly work through the merge process
by selecting which revision choice to keep and at the
same time see information about the difference visu-
ally.
The algorithm demonstrates the idea of how the un-
derlying structure can in some ways simplify the
merge process. The algorithm first follows a top-
down approach to find matches for the items other
than table contents. The table content comparison is
done recursively by comparing the table content in
the same hierarchy. The table structure processing
follows a bottom-up approach by basing on the con-
tents matches. The matched are calculated using the
weight system to measure the similarity level.
However, accurately calculating the differences be-
tween two tables requires more calculation. The pro-
totype developed has some requirements dropped due
to constraints with development but overall 2-diff
meets requirements.
8 FURTURE WORK
This section details the next steps to take future work
including further development of the prototype by
implementing more identified requirements as well as
reducing the limitations of the current implementa-
tion. Evaluation, further studies on user interface and
introducing tool-independence are also part of the
recommendation.
8.1 Remaining Requirement Implementation
As it has been noted in section 5 REQUIREMENTS,
the implementation has been limited to a subset of the
identified requirements. Future work can be done to
address these limitations by covering the remaining
requirements. Most relevant would be the require-
ments for 3-diff to allow for some automation.
8.2 Limitation Reduction
Various improvements can be made based on the
identified limitations. These limitations are identified
in Section 6.1.3.
A. Similarity weight constants
For better reliability, it would be recommended that
the weight constant can be calculated by testing the
values over several layouts with already known
matches to observe the similarity values that give the
highest accurate match rate.
B. Minimum differences calculation and de-
pendent change
Work can be done to include summaries of changes.
These summaries would indicate the level of the
changes impact. The summaries would also present
the change that includes both deletion and insertion of
an item’s versions between revisions [22, 23].
C. Limited requirements coverage of weight
system
If the tree is only traversed once, the similarity
matching simply will not have all the information to
make the most probable estimation. One suggestion
to improve this would be to increase the ways that
similarities being observed. If further work can be
done to expand the algorithm to include similarity
propagation through parents, children and sibling
matches, there would be an increased probability of
making accurate matches.
8.3 Evaluation
Page 19
17
It is recommended that further research should in-
volve an evaluation of the algorithm for performance
and accuracy. The objective would be to identify are-
as of improvement for matching items especially
without unique identifiers.
8.4 User Interface Studies
Further research into the user Interface is valuable.
As Zaman and Kalra proposed, a combination of user
interface methods can be the better choice [17]. It is
out of the scope of this thesis to do implementation
and analysis of several user interface methods for
merging.
8.5 Tool Independence
Along with the work in the previously described limi-
tations, in order to meet all requirements dis-
cussed[3], the research should be expanded to work
independently of the tool. Specifically, the require-
ments R3: Domain independence and R4: Tool inde-
pendence remains unfulfilled as this research focuses
on functionality within a designer tool and with RDL
data specific to IFS.
9 ACKNOWLEDGEMENTS
The authors of the thesis would like to thank the fol-
lowing:
Matthias Tichy, for his support in this re-
search.
Daniel Svantesson, Principle Software Engi-
neer at IFS, for his guidance and knowledge.
Eva Sedola and Edina Becirovic, for sharing
their experience and knowledge with IFS
Report Designer Tool.
IFS AB, for the opportunity to conduct this
research and the support.
REFERENCES
1. Dadgari, D. and W. Stuerzlinger, New techniques
for merging text versions, in Proceedings of the
14th international conference on Human-
computer interaction: interaction techniques and
environments - Volume Part II2011, Springer-
Verlag: Orlando, FL. p. 331-340.
2. Munson, J.P. and P. Dewan, A flexible object
merging framework, in Proceedings of the 1994
ACM conference on Computer supported
cooperative work1994, ACM: Chapel Hill, North
Carolina, United States. p. 231-242.
3. Förtsch, S. and B. Westfechtel, Differencing and
Merging of Software Diagrams - State of the Art
and Challenges, in ICSOFT2007: Barcelona,
Spain. p. 90-99.
4. Cobena, G., S. Abiteboul, and A. Marian.
Detecting changes in XML documents. in Data
Engineering, 2002. Proceedings. 18th
International Conference on. 2002.
5. Wang, Y., D.J. DeWitt, and J.Y. Cai. X-Diff: an
effective change detection algorithm for XML
documents. in Data Engineering, 2003.
Proceedings. 19th International Conference on.
2003.
6. Xing, Z. and E. Stroulia, UMLDiff: an algorithm
for object-oriented design differencing, in
Proceedings of the 20th IEEE/ACM international
Conference on Automated software
engineering2005, ACM: Long Beach, CA, USA.
p. 54-65.
7. Microsoft, Report Definition Language
Specification, 2008, Microsoft Corporation. p. 1-
170.
8. Melnik, S., H. Garcia-Molina, and E. Rahm.
Similarity flooding: a versatile graph matching
algorithm and its application to schema
matching. in Data Engineering, 2002.
Proceedings. 18th International Conference on.
2002.
9. Kelter, U., J. Wehren, and J. Niere, A Generic
Difference Algorithm for UML Models, in
Software Engineering, P. Liggesmeyer, K. Pohl,
and M. Goedicke, Editors. 2005. p. 105-116.
10. IFS, Development Guide - IFS Report Designer,
in Concepts2012.
11. Per Runeson , M.H., Guidelines for conducting
and reporting case study research in software
engineering. Journal of Empirical Software
Engineering, 2008. 14: p. 131–164.
12. Ohst, D., M. Welle, and U. Kelter. Difference
tools for analysis and design documents. in
Software Maintenance, 2003. ICSM 2003.
Proceedings. International Conference on. 2003.
13. Mehra, A., J. Grundy, and J. Hosking, A generic
approach to supporting diagram differencing and
merging for collaborative design, in Proceedings
of the 20th IEEE/ACM international Conference
on Automated software engineering2005, ACM:
Long Beach, CA, USA. p. 204-213.
14. Dadgari, D. and W. Stuerzlinger, Novel user
interfaces for diagram versioning and
differencing, in Proceedings of the 24th BCS
Interaction Specialist Group Conference2010,
British Computer Society: Dundee, United
Kingdom. p. 62-71.
15. Gerhardt-Powals, J., Cognitive engineering
principles for enhancing human-computer
performance. Int. J. Hum.-Comput. Interact.,
1996. 8(2): p. 189-211.
16. Cheng-Hua, W., L. Lu-Wen, and C. Yi-Ying. The
effect of ERP software interface design and
cognitive function on performance of user
Page 20
18
learning. in Service Operations, Logistics, and
Informatics (SOLI), 2011 IEEE International
Conference on. 2011.
17. Zaman, L., A. Kalra, and W. Stuerzlinger, The
effect of animation, dual view, difference layers,
and relative re-layout in hierarchical diagram
differencing, in Proceedings of Graphics
Interface 20112011, Canadian Human-Computer
Communications Society: St. John's,
Newfoundland, Canada. p. 183-190.
18. Horton, W., Overcoming chromophobia: a guide
to the confident and appropriate use of color.
Professional Communication, IEEE Transactions
on, 1991. 34(3): p. 160-171.
19. Ping, Z. and F. Xing. Analysis of cognitive
behavior in software interactive interface. in
Computer-Aided Industrial Design and
Conceptual Design, 2008. CAID/CD 2008. 9th
International Conference on. 2008.
20. Peschl, M.F. and C. Stary, The Role of Cognitive
Modeling for User Interface Design
Representations: An Epistemological Analysis of
Knowledge Engineering in the Context of
Human-Computer Interaction. Minds and
Machines, 1998. 8(2): p. 203-236.
21. IFS, IFS Report Designer, 2012.
22. Go, et al. Visually Supporting Source Code
Changes Integration: The Torch Dashboard. in
Reverse Engineering (WCRE), 2010 17th
Working Conference on. 2010.
23. Schneider, C., A. Zndorf, and J. Niere, CoObRA -
a small step for development tools to
collaborative environments, in Workshop on
Directions in Software Engineering
Environments; 26th international conference on
software engineering2004.
APPENDIX
1. Interview Questions
The interview questions below were used in the inter-
viewing of three users of the designer application.
I. BACKGROUND
1) How often do customer’s revised versions conflict
the company’s updated versions of the report layout?
2) What is the current solution for solving the con-
flicted report layout?
3) Can you show us an example of how you solve the
conflicted report layout?
4) Do you feel the solution is convenient, if not, what
are the problems?
II. REQUIREMENTS
1) What do you consider as the most important fea-
tures of the merging system?
2) Can you describe a merging system in your mind?
3) Does customer always prefer all the changes of the
newest updated report layout?
4) Do you prefer the idea of a mostly automatic sys-
tem of merging?
5) Is it important for you to know exactly how many
differences between two versions?
6) How often do you use the properties window to
make changes to the items on the report paper?
III. DEVELOPER ADDITION
1) From these images how does the merge tool inter-
face impact the tool interface in what is planned for
normal functioning?
2) Has it ever been considered that the report designer
tool make use of a preview screen to see an overall
layout design? Why or why not?
3) Are there currently future plans made for the report
designer tool’s interface?
4) Based on your experience, what problems could
you foresee from the interface demos?
IV. PROTOTYPE
A. Diagram Double-View
B. Diagram Connected Side-by-Side
Page 21
19
C. Diagram Minimum Display; Single Preview
D. Diagram Transparency
2. Requirements
Underlined requirements indicate inclusion in the
prototype.
Priority Requirements
REQ 1. The merge functionality shall be efficient.
REQ 2. The merge functionality shall be accurate.
REQ 3. The merge functionality shall have a focus on
usability.
REQ 4. The merge tool shall be reliable.
Diff Algorithms
REQ 5. For 3-diff, each file shall be selectable by the
user.
REQ 6. Options with 2-diff and 3-diff shall be select-
ed by the user based on preferences.
REQ 7. User Approval for changes in Automatic
Merging.
REQ 8. The merging shall calculate the minimum
difference between versions.
Revision Differences
REQ 9. Types of differences should be automatically
categorized.
REQ 10. A categorized summary of the total differ-
ences shall be made available.
REQ 11. The number of differences shall be available
to the user.
REQ 12. Related differences shall be detected.
REQ 13. Related differences shall be visually repre-
sented to the user.
User Interaction
REQ 14. A diff tree shall be available.
REQ 15. The diff tree shall contain the different types
of differences.
REQ 16. The diff tree shall associate different merge
types with both symbol and color.
REQ 17. User shall be able to cycle differences by
single interaction i.e. a next button.
REQ 18. It shall be possible to edit during the merge
process.
REQ 19. A right click menu shall be used for the
merge process.
Property Window
REQ 20. The property window shall optionally float.
REQ 21. The property window shall be viewable
during merging process.
REQ 22. Properties differences shall be visually indi-
cated in the property window.
Preview Screen
REQ 23. Magnification shall be available on the pre-
view window.
REQ 24. Differences shall be visible on the preview
screen.
Spacing UI
REQ 25. Spacing shall prioritize the main working
layout (report paper).
REQ 26. One report layout shall be viewable at a
time.
REQ 27. Merge choice selection shall not interfere
with or cover other parts of the layout.
REQ 28. The differences can be jumped to when se-
lecting the difference from the diff-tree.
Following Standards
REQ 29. The files selected shall be represented by
the term ‘revisions’ or R1 and R2.
REQ 30. The old look and feel shall be kept as much
as possible.
Page 22
20
Visualizing Change
REQ 31. The merging shall allow the user to view
one difference at a time.
REQ 32. The merging shall optionally allow the user
to view all changes at a time.
REQ 33. The difference shall be clickable by the us-
er, then becoming visible.
REQ 34. The difference clicked on the canvas shall
be associated to the difference tree and the prop-
erty window.
REQ 35. Symbols shall be used as the visual repre-
sentation for types of differences.
REQ 36. The user shall be able to customize the
symbol to represent the insertion and deletion.
REQ 37. The user shall be able to customize the
symbols to represent the types of changes.