34
Design and Manufacturing Considerations for Medical Device Coatings Keith Edwards, President Biocoat, Inc.
| Date post: | 27-Jul-2015 |
| Category: |
Documents |
| Upload: | keith-edwards |
| View: | 79 times |
| Download: | 6 times |
Design and Manufacturing Considerations for
Medical Device CoatingsKeith Edwards, President
Biocoat, Inc.

Devices that benefit from a coating:Guide wires
PTCA catheters
IOL insertion cartridges
Micro-catheters
Clot retrieval wires
Delivery Sheaths
Stent delivery systems
Embolic delivery
Implant delivery
Endoscopes
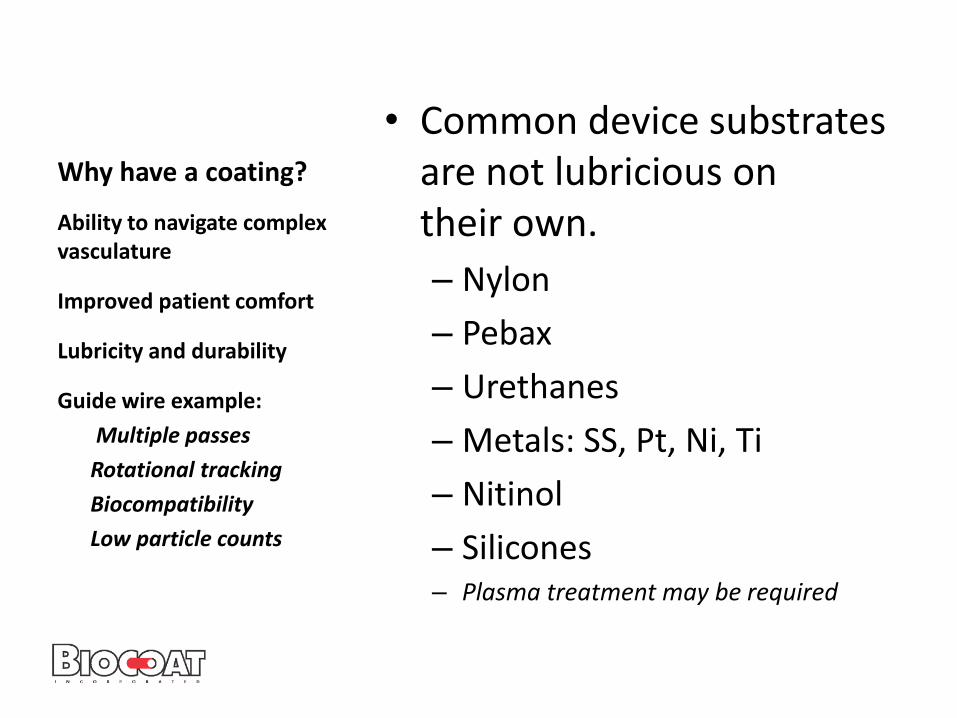
Why have a coating?
• Common device substrates are not lubricious on their own.
– Nylon
– Pebax
– Urethanes
– Metals: SS, Pt, Ni, Ti
– Nitinol
– Silicones– Plasma treatment may be required
Ability to navigate complex vasculature
Improved patient comfort
Lubricity and durability
Guide wire example:
Multiple passes
Rotational tracking
Biocompatibility
Low particle counts

Regulatory Considerations
• Design Inputs should include several options that meet your design requirements:
Lubricity
Durability
Biocompatibility – ISO 10993
• Cytotoxicity (MEM Elution)
• Hemolysis (Direct Contact Method)
• Irritation (Intracutaneous Reactivity)
• Systemic Toxicity (Systemic Injection)
• Partial Thromboplastin Time (PTT)
• USP 788 - Particulates
Thickness
Test method: is the test environment reflective of the use?

Case Example: FDA Examiner Inquiry
• Coating Integrity: FDA recommends that you provide quantitative analysis of the presence/absence of coating pre- and post-simulated use. In your coating integrity test reports you should include a detailed discussion of the surfaces using any practical methods to quantify defects. This may include counting the number of total defects per unit area, measuring representative defect areas, and measuring worst-case defect areas. You should support your discussion with representative images (including worst-case) at a sufficient magnification to characterize the defects. Multiple magnifications may be needed to visualize and adequately characterize the product. The discussion of acceptable coating integrity should include a justification that the number and size of defects observed will not impact clinical performance.

Technical Coating Considerations
• Will my coating stick?
• What particle counts may I anticipate?
• Verification of coating presence
• QA/QC testing & sampling
• PVP vs. HA
• Surface Energy
• Contact angle
• Unreacted monomers
• Plasticizers & bloom
• Humidity
• Sterilization methods
• Heat cure vs. UV cure

7
HA Coating Platform
Covalent bondsIsocyanate linkage
Mechanical AdhesionAdsorption
ElectrostaticMechanical interlock

PVP – A matrix of cross-linked polymers of various molecular weights
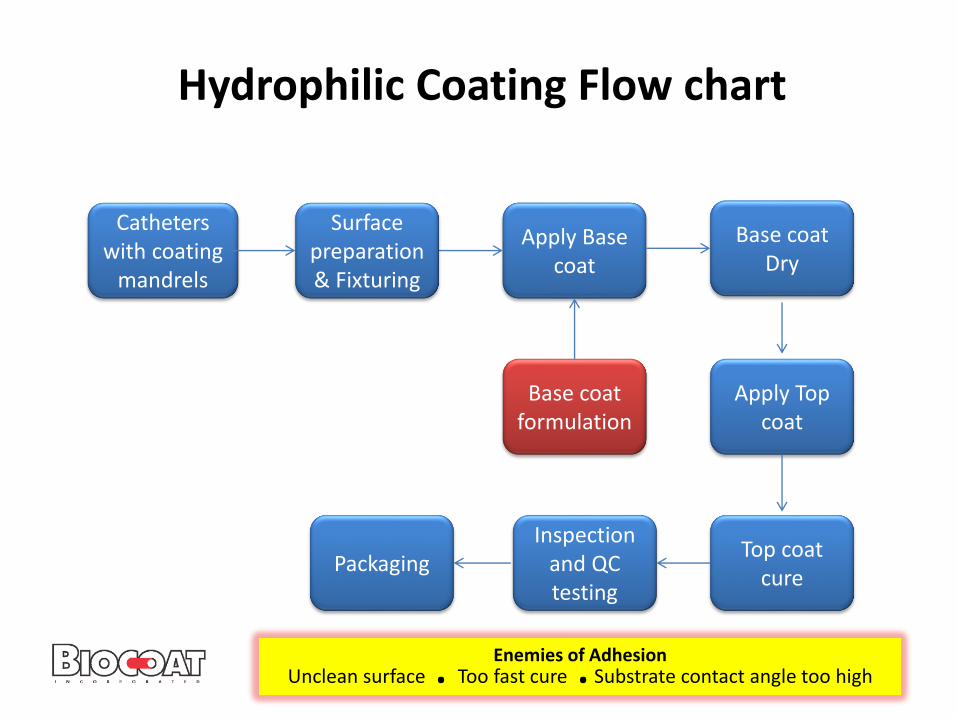
Hydrophilic Coating Flow chart
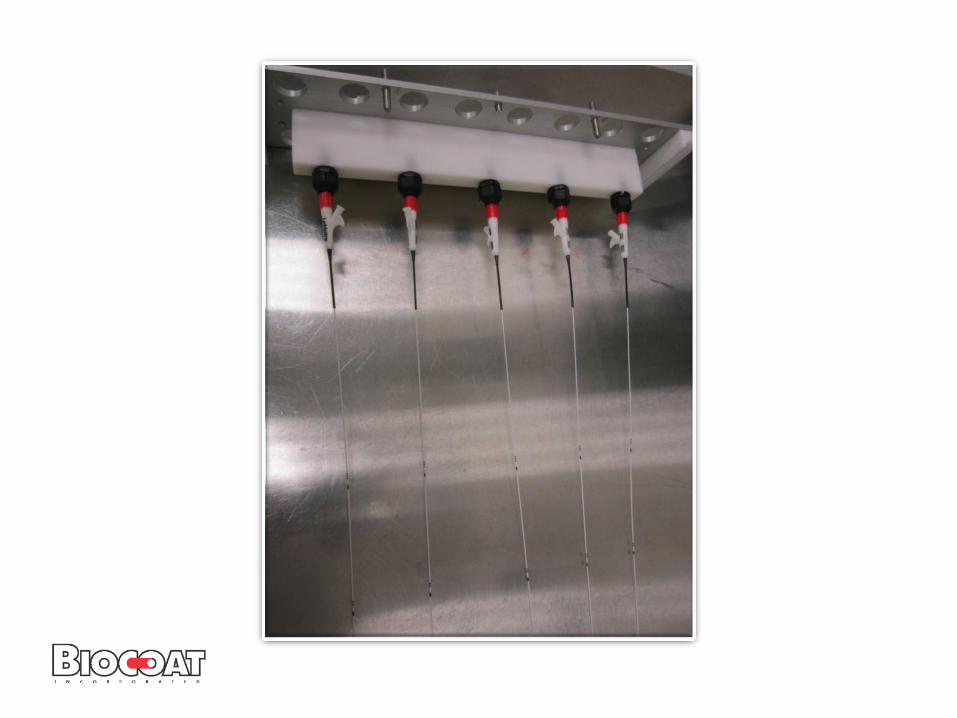
Catheterswith coating
mandrels
Top coat cure
Apply Base coat
Apply Top coat
Base coat Dry
Base coat formulation
Inspection and QC testing
Packaging
Enemies of Adhesion
Surface preparation & Fixturing
Unclean surface . Too fast cure . Substrate contact angle too high


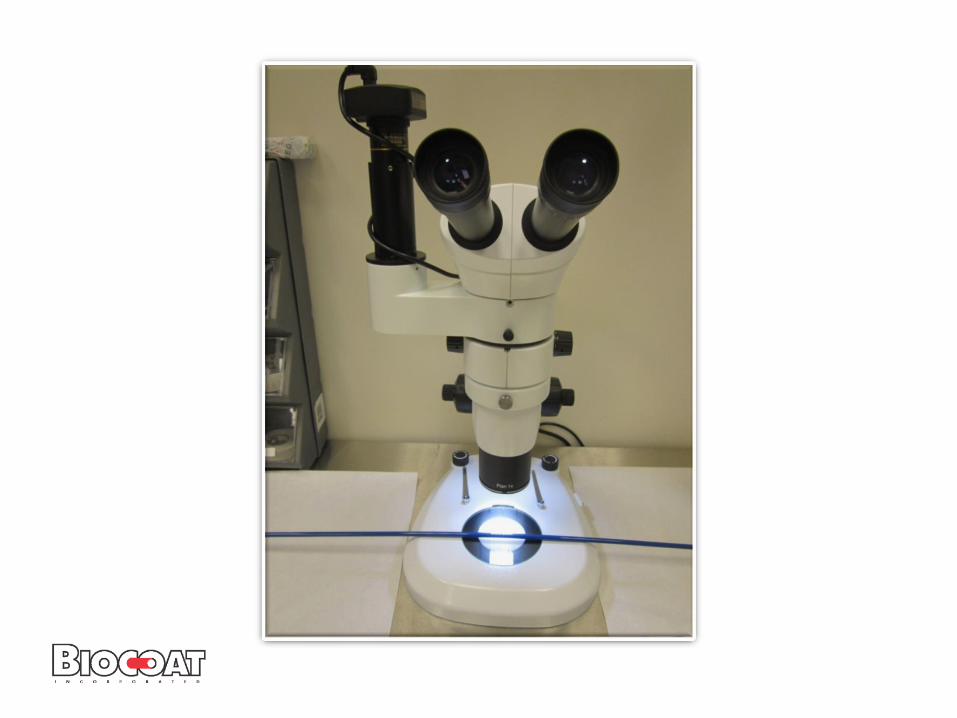

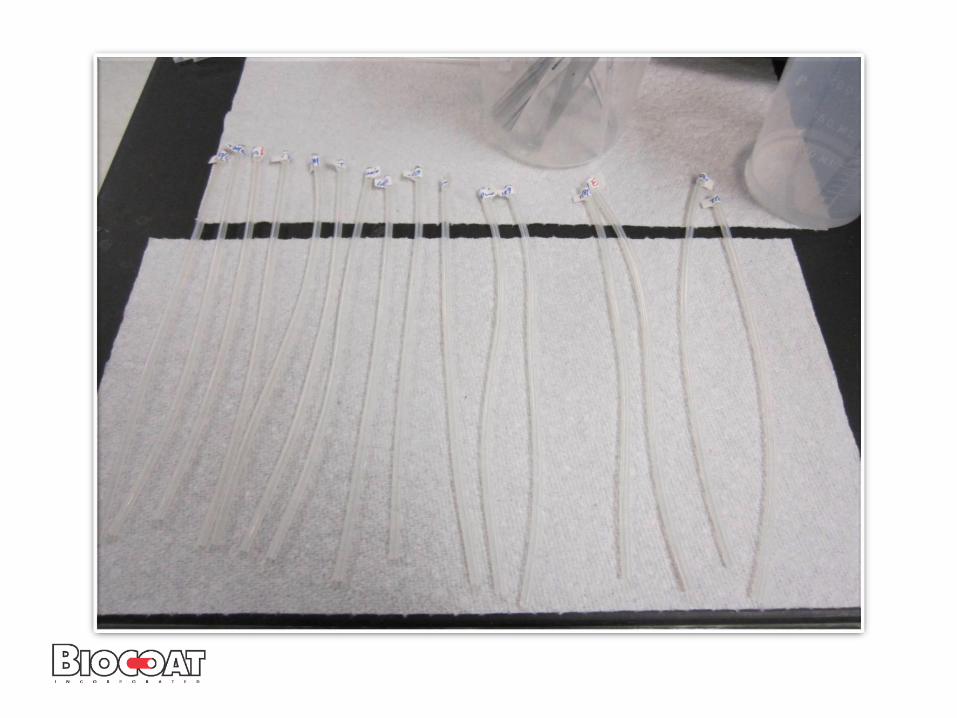
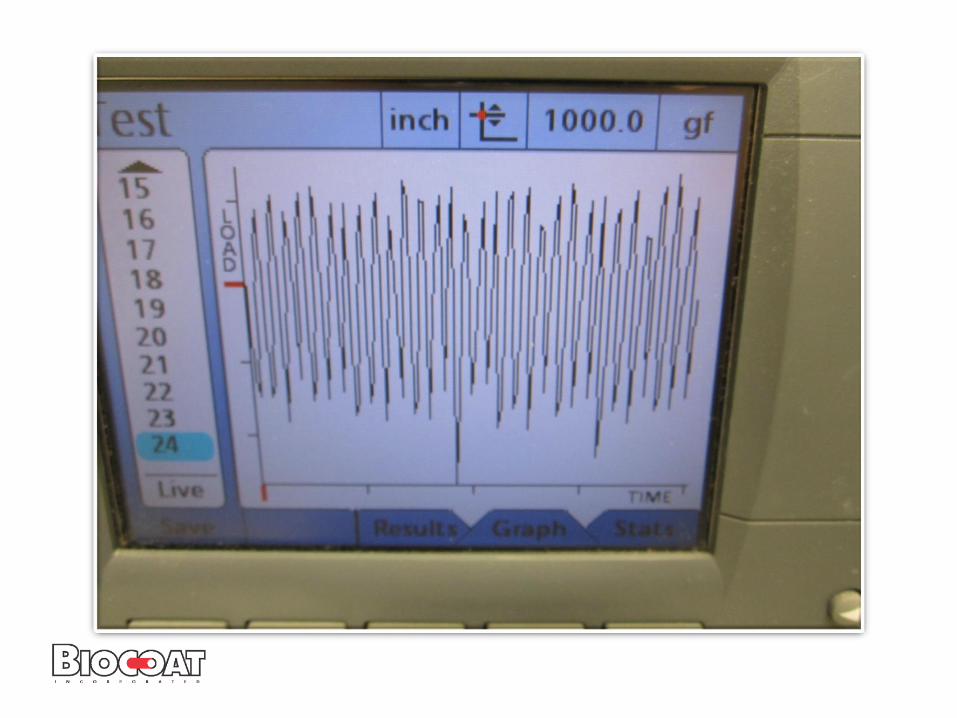
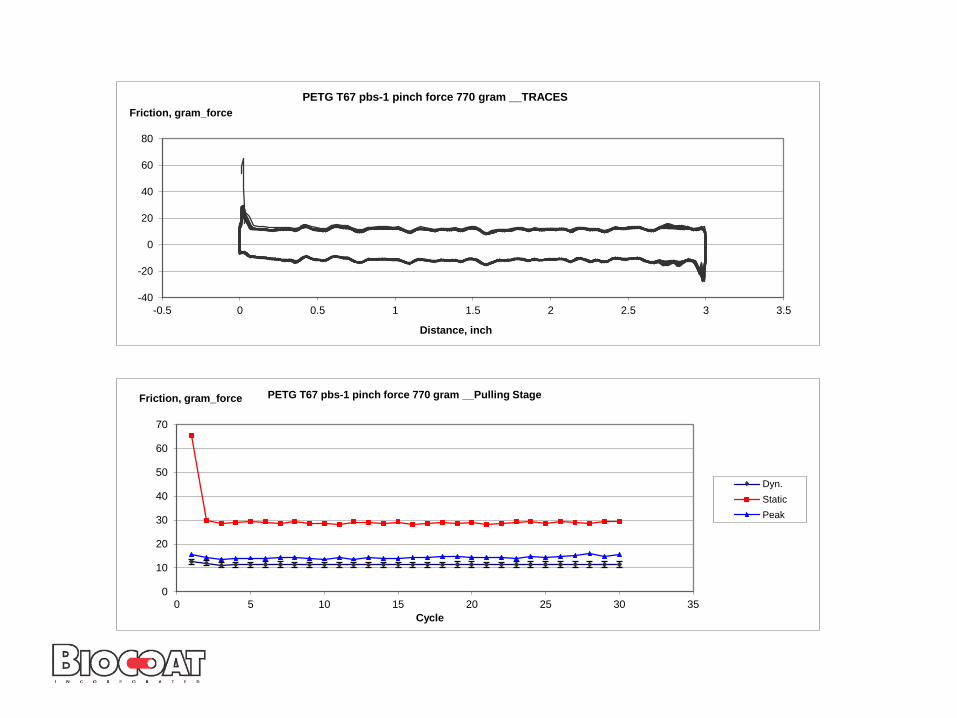
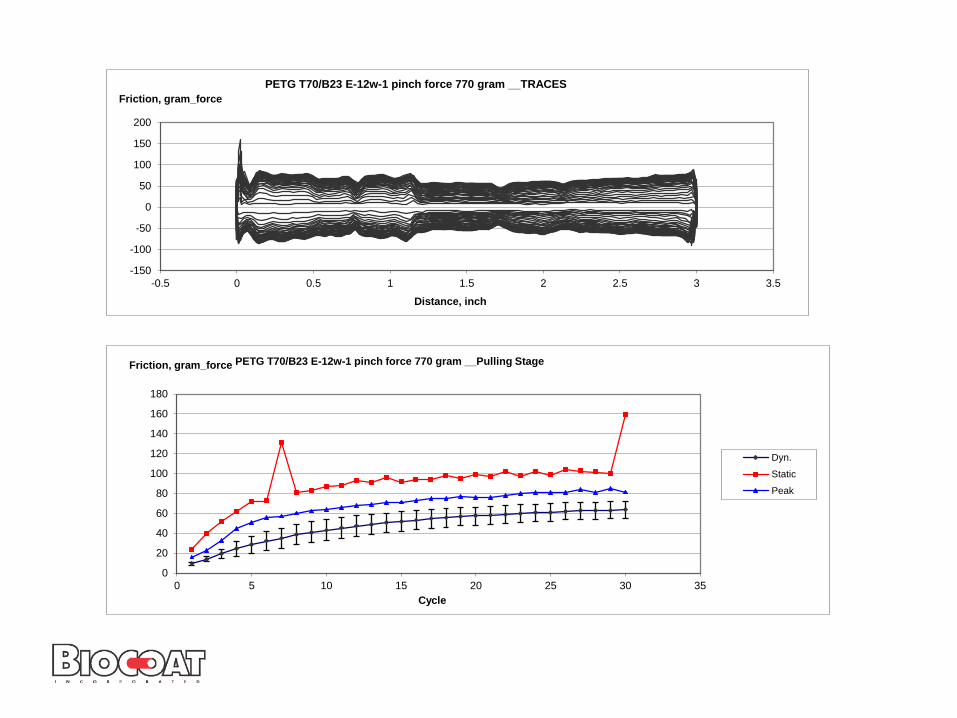
Performance: Pinch Friction test
• Pinch testing on 10 uncoated and 10 coated tubes to evaluate frictional forces. Pinch testing parameters:
– Load : 470 grams
– Number of cycles: 30
– Pinch pad material: Delrin or Silicone
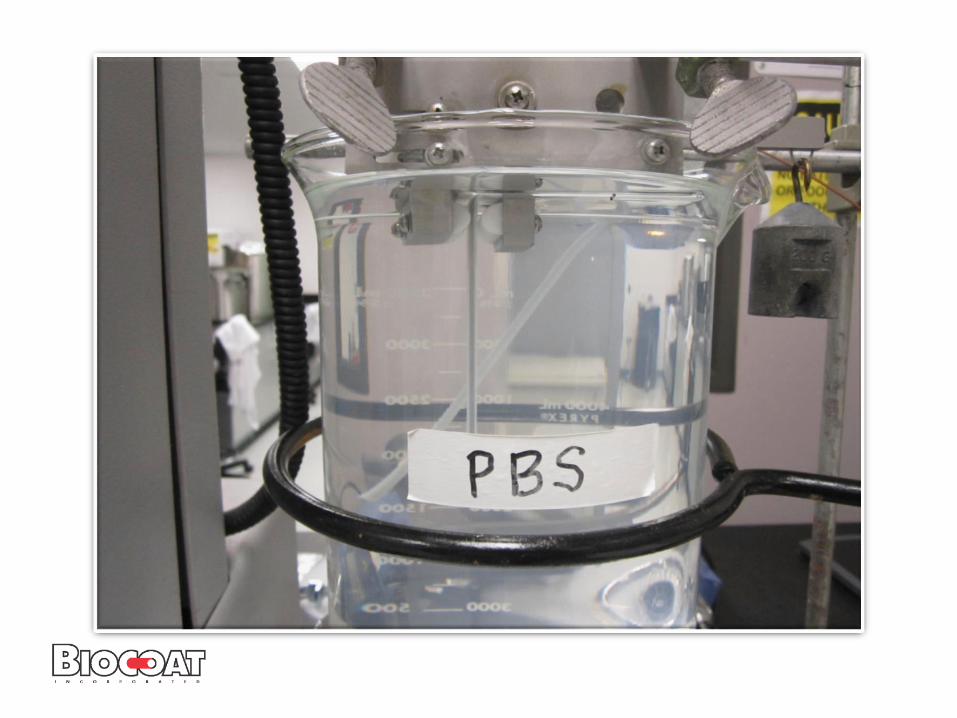
– Phosphate Buffered Saline (PBS) bath at 37C
• Trackability testing on 10 coated tubes to measure insertion and pulling forces
• Design team to define friction specification and failure mode• Comment: Delrin pads harder on coating; display better lubricity. Silicone pads
softer on coating; display higher friction.
Other tests: Bound top coat,Swelling ratios &
rotational tracking

-40
-20
0
20
40
60
80
-0.5 0 0.5 1 1.5 2 2.5 3 3.5
Friction, gram_force
Distance, inch
PETG T67 pbs-1 pinch force 770 gram __TRACES
0
10
20
30
40
50
60
70
0 5 10 15 20 25 30 35
Friction, gram_force
Cycle
PETG T67 pbs-1 pinch force 770 gram __Pulling Stage
Dyn.
Static
Peak
-150
-100
-50
0
50
100
150
200
-0.5 0 0.5 1 1.5 2 2.5 3 3.5
Friction, gram_force
Distance, inch
PETG T70/B23 E-12w-1 pinch force 770 gram __TRACES
0
20
40
60
80
100
120
140
160
180
0 5 10 15 20 25 30 35
Friction, gram_force
Cycle
PETG T70/B23 E-12w-1 pinch force 770 gram __Pulling Stage
Dyn.
Static
Peak

Head to Head Comparison
0.0
20.0
40.0
60.0
80.0
100.0
120.0
0 5 10 15 20 25 30
Dyn
amic
Fri
ctio
n P
ulli
ng
(g)
Cycle
Dynamic Friction Pulling Over 30 Cycles
N=3, delrin pads, 470g load, 30 cycles


Got Slick?Hydration is part of the procedure.
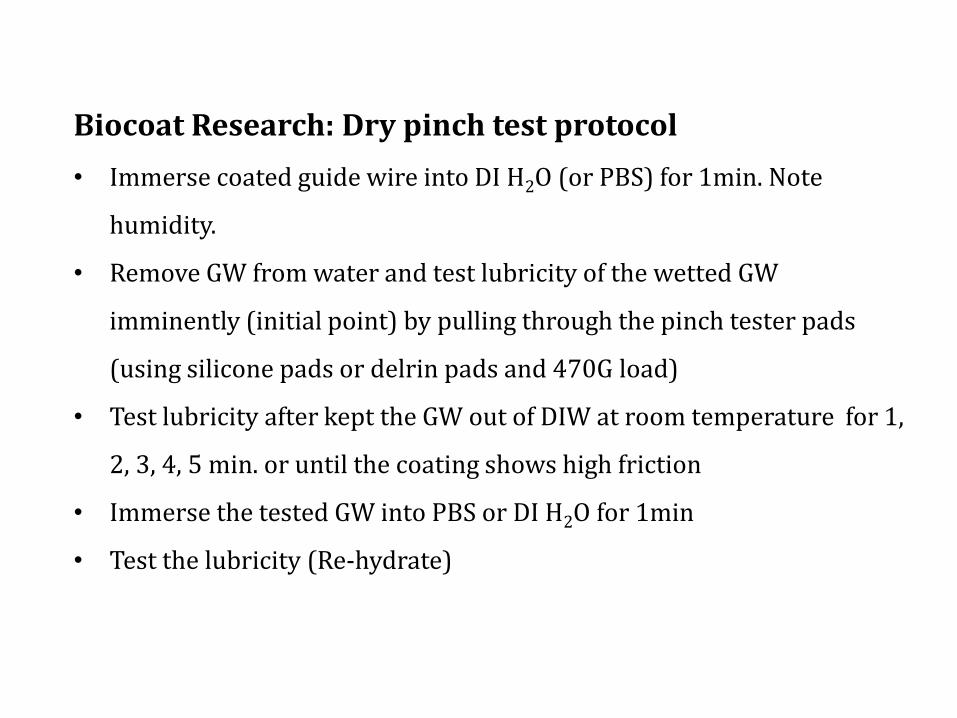
Biocoat Research: Dry pinch test protocol
• Immerse coated guide wire into DI H2O (or PBS) for 1min. Note
humidity.
• Remove GW from water and test lubricity of the wetted GW
imminently (initial point) by pulling through the pinch tester pads
(using silicone pads or delrin pads and 470G load)
• Test lubricity after kept the GW out of DIW at room temperature for 1,
2, 3, 4, 5 min. or until the coating shows high friction
• Immerse the tested GW into PBS or DI H2O for 1min
• Test the lubricity (Re-hydrate)

0
50
100
150
200
0 1 2 3
Pu
llin
g St
age
Fric
tio
n (
g)
Distance (inch)
A-14: Delrin-pads & 470G
Initial
1min
2min
3min
4min
5min
Re-hydrate
0
50
100
150
200
0 1 2 3P
ulli
ng
Stag
e Fr
icti
on
(g)
Distance (inch)
A-14: Silicone-pads & 470G
Initial
1min
2min
3min
4min
5min
Re-hydrate
Open air Time Pinch Test
Humidity: 66.5-67% & Temp.: 21-22oC
DIW H2O Hydrated

0
50
100
150
200
0 1 2 3
Pu
llin
g St
age
Fric
tio
n (
g)
Distance (inch)
A-14: PBS Hydrated
initial
1min
2min
3min
Re-hydrate
0
50
100
150
200
0 1 2 3
Pu
llin
g St
age
Fric
tio
n (
g)
Distance (inch)
A-14: DIW Hydrated
initial
1min
2min
3min
4min
5min
Re-hydrate
Open air Pinch Test: Delrin-pads & 470g
Humidity: 53-55% & Temp: 21-21.5oC
Weight gained after soaking in PBS for 1 min.:
0.007g
After 3min.: 0.002g remained
(4” length GW: 0.0323” OD)
Weight gained after soaking in DIW for 1min.:
0.0077g
After 5min.: 0.0016g remained
(4” length GW : 0.0323” OD)
0
50
100
150
200
250
0 1 2 3
Pu
llin
g St
age
Fric
tio
n (
g)
Distance (inch)
A-14: PBS Hydrated(Humidity: 44%)
initial
1min
2min
3min
4min
Re-hydrate
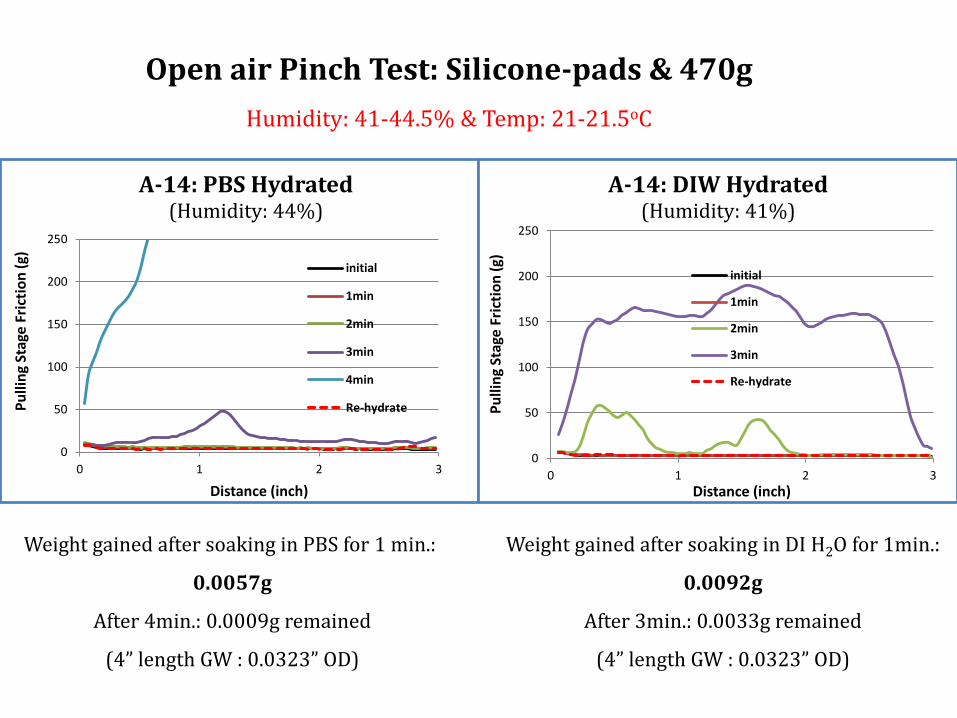
Open air Pinch Test: Silicone-pads & 470g
Humidity: 41-44.5% & Temp: 21-21.5oC
0
50
100
150
200
250
0 1 2 3
Pu
llin
g St
age
Fric
tio
n (
g)Distance (inch)
A-14: DIW Hydrated(Humidity: 41%)
initial
1min
2min
3min
Re-hydrate
Weight gained after soaking in PBS for 1 min.:
0.0057g
After 4min.: 0.0009g remained
(4” length GW : 0.0323” OD)
Weight gained after soaking in DI H2O for 1min.:
0.0092g
After 3min.: 0.0033g remained
(4” length GW : 0.0323” OD)

Particulates ≥ 10µmLow Friction - Low particulate
0
2
4
6
8
10
12
0 500 1000 1500 2000 2500 3000 3500 4000 4500
Dyn
amic
Fri
ctio
n (
gf)
Number of Particles ≥ 10 µm
Small Particle Correlation to Lubricity
USP 788 limits = 6000 particle/mlParticles are Hyaluronic acid, will degrade in-vivo

Particulates ≥ 25µmLow Friction - Low particulate
0
2
4
6
8
10
12
0 20 40 60 80 100 120 140 160 180 200
Dyn
amic
Fri
ctio
n (
gf)
Number of Particles ≥ 25 µm
Large Particle Correlation to Lubricity
USP 788 limits = 600 particle/ml

Coating Business Models
• Cost of Reagents
• Royalty & rate
• Tiered or flat rates
• Term and amount
• Quarterly minimums
• License fee
• One time or for each device?
• Cost per device
• Batch size/throughput per shift
• Waste
• Equipment
• Service agreements

Coating Economics
• Actual cost of coating per device is $0.25 to $1.75
• Cost of application – fully loaded- may be $6 to $50 per device
• For costs under $5 high volume is required
• Minimize waste
• Annual volumes under 30,000 – contract coating service
• Higher volumes – coat in house or at a tubing/wire vendor
• International manufacturing locations
• Investments vary & clean room needed

R&D & Innovation
• R&D
– Cost reduction initiatives: shorter cycle times, waste reduction & shelf life of reagents.
– Characterization of coatings: particle counts and related testing parameters on a wide variety of substrates.
• Innovation
– Gamma and e-Beam sterilization

How do I know my coating is there?
Without destructive testing?

Coated
Uncoated


