69
Design and Use of the IPUMS-International Data Series http://international.ipums.org http://international.ipums.org Matt Sobek Minnesota Population Center [email protected]
| Date post: | 30-Dec-2015 |
| Category: |
Documents |
| Upload: | grant-dorsey |
| View: | 220 times |
| Download: | 0 times |
Design and Use of the IPUMS-International Data Series
http://international.ipums.orghttp://international.ipums.org
Matt SobekMinnesota Population Center
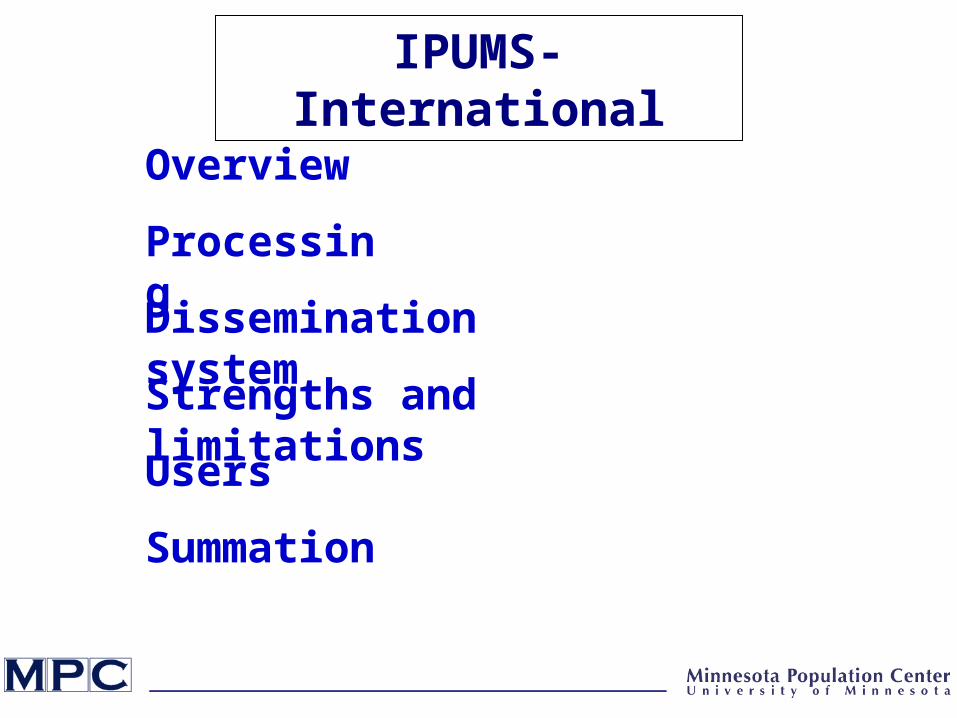
Overview
Processing
Dissemination system
Strengths and limitations
Users
Summation
IPUMS-International
Census data samples
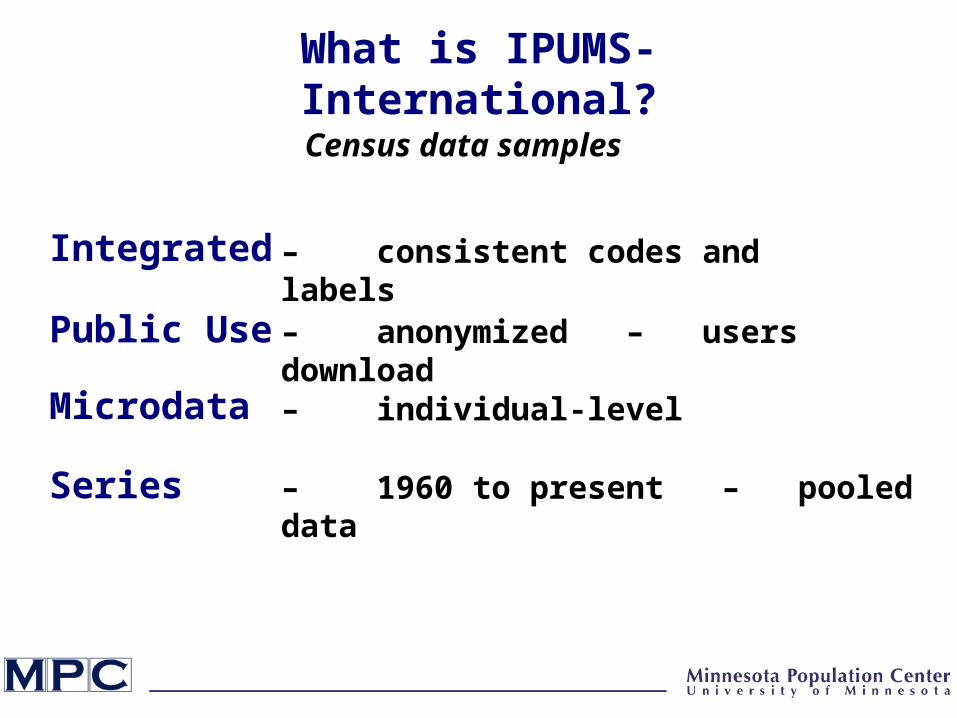
What is IPUMS-International?
Integrated
Public Use
Microdata
Series
– consistent codes and labels
– anonymized – users download
– individual-level
– 1960 to present – pooled data
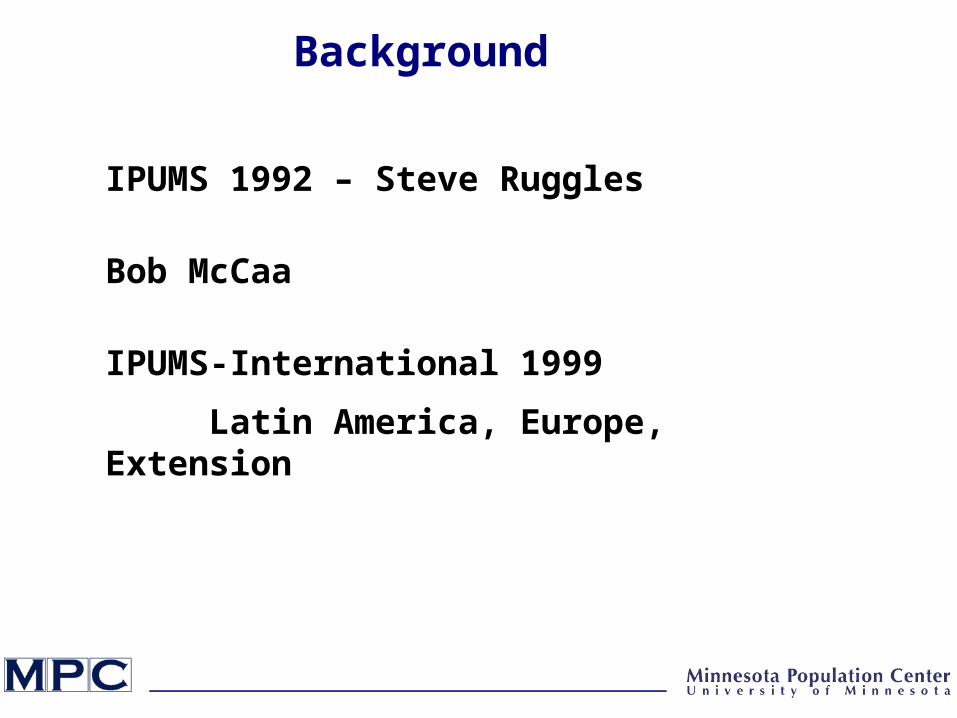
IPUMS 1992 – Steve Ruggles
Bob McCaa
IPUMS-International 1999
Latin America, Europe, Extension
Background

Map of IPUMS Partners
Dark green = disseminating dataLight green = partners, not yet disseminating
83 countries
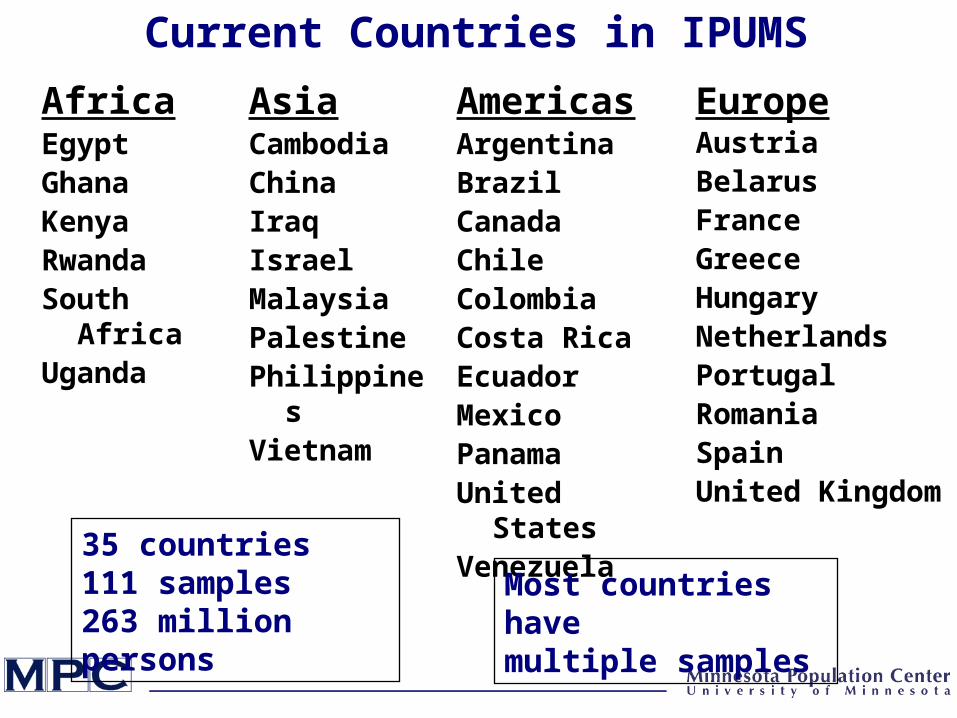
Current Countries in IPUMS
35 countries111 samples263 million persons
EgyptGhanaKenyaRwandaSouth AfricaUganda
CambodiaChinaIraqIsraelMalaysiaPalestinePhilippinesVietnam
ArgentinaBrazilCanadaChileColombiaCosta RicaEcuadorMexicoPanamaUnited StatesVenezuela
AustriaBelarusFranceGreeceHungaryNetherlandsPortugalRomaniaSpainUnited Kingdom
Most countries havemultiple samples
Africa Asia Americas Europe
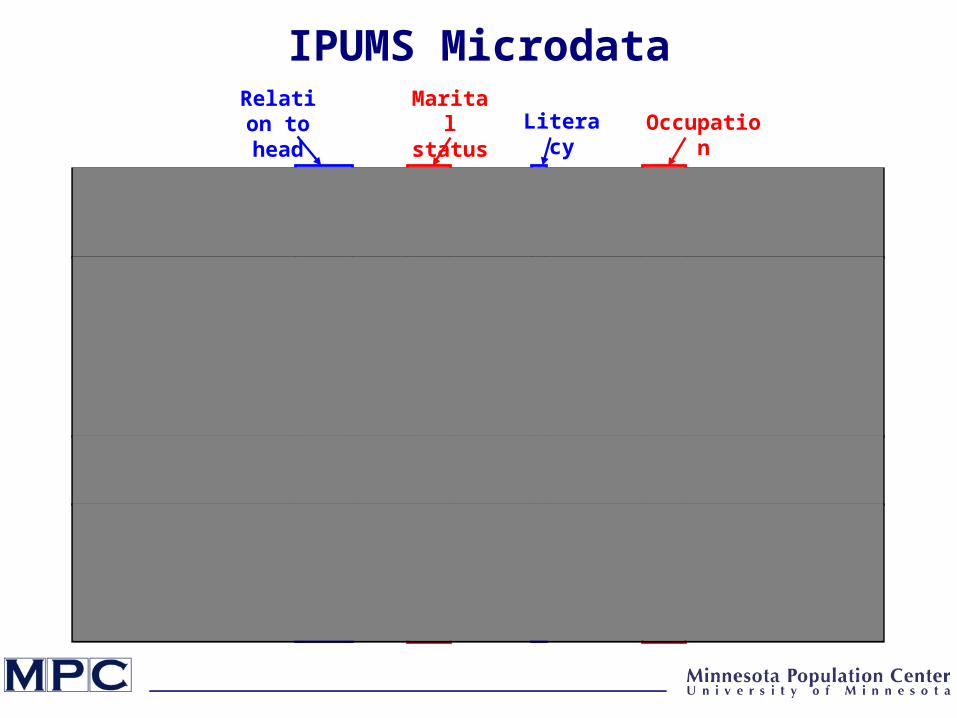
IPUMS MicrodataRelation to head
Marital status Literacy Occupation

Selected Variable Topics
Basic demographics
Marriage
Family structure
Fertility and mortality
Migration
Ethnicity, language, religion
Education
Work
Income
Housing characteristics
475 Integrated variables
9052 Unharmonized
variables

User Access
Application
• Scholarly and educational purposes
• Key: it must not be redistributed
Once approved, access to all data
Free
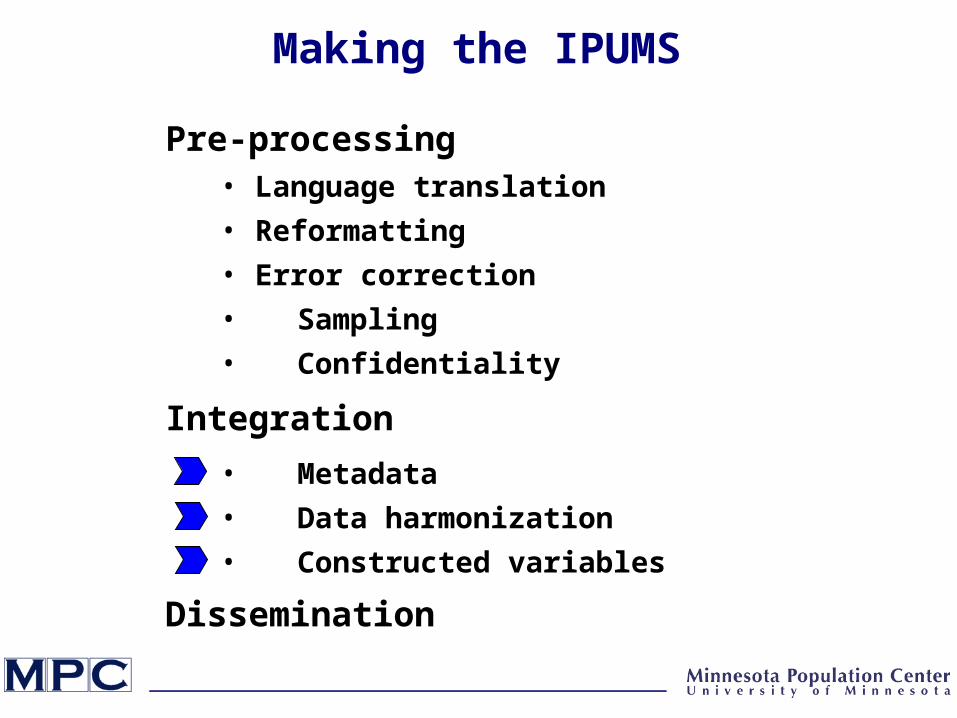
Making the IPUMS
Pre-processing
Integration
Dissemination
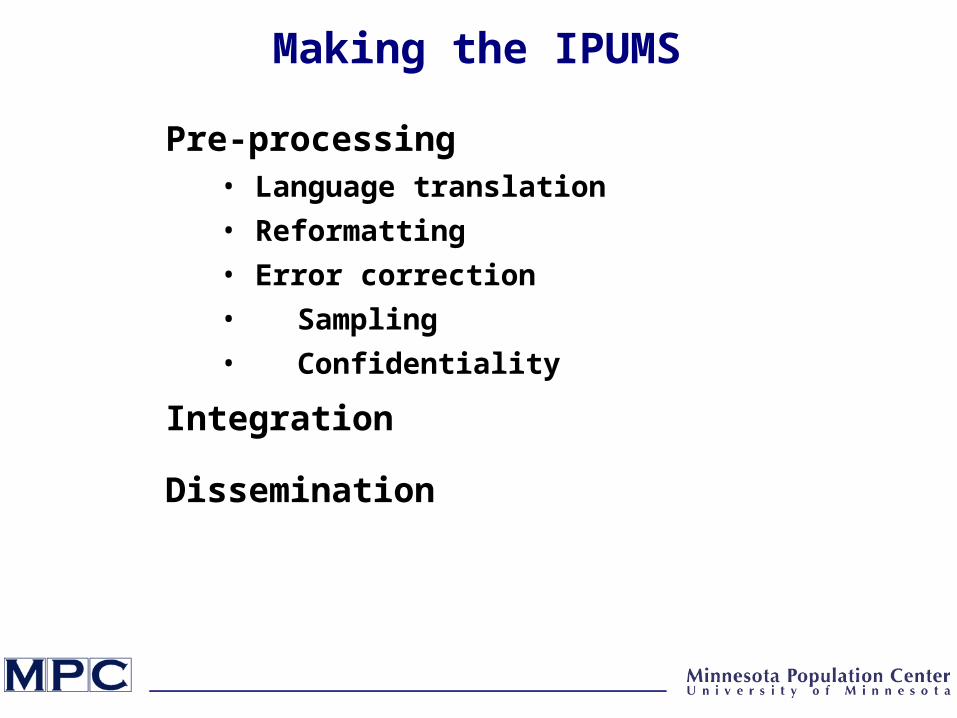
Making the IPUMS
Pre-processing
Integration
Dissemination
• Language translation
• Reformatting
• Error correction
• Sampling
• Confidentiality
Making the IPUMS
Pre-processing
Integration
• Language translation
• Reformatting
• Error correction
• Sampling
• Confidentiality
• Metadata
• Data harmonization
• Constructed variables
Dissemination
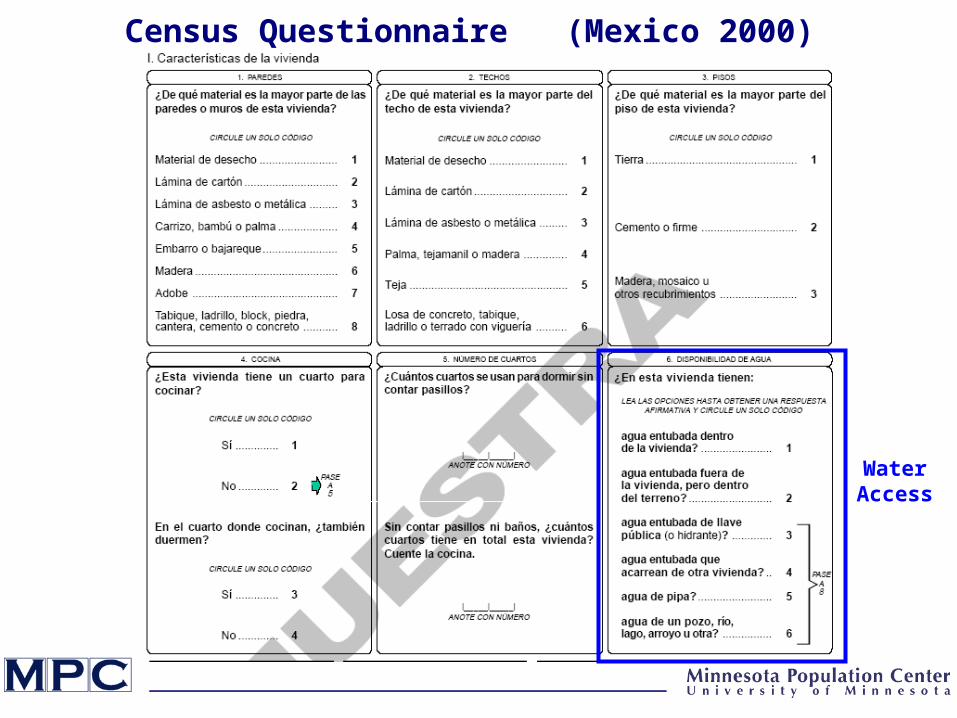
Census Questionnaire (Mexico 2000)
WaterAccess
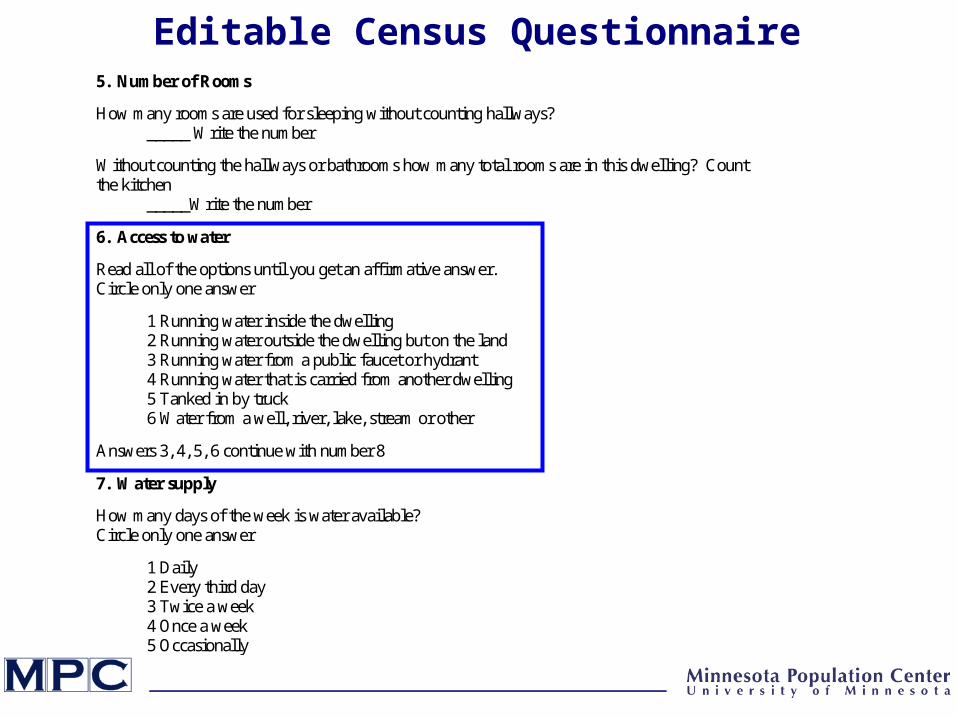
5. Number of Rooms
How many rooms are used for sleeping without counting hallways? _____ Write the number
Without counting the hallways or bathrooms how many total rooms are in this dwelling? Count the kitchen
_____Write the number
6. Access to water
Read all of the options until you get an affirmative answer. Circle only one answer
1 Running water inside the dwelling 2 Running water outside the dwelling but on the land 3 Running water from a public faucet or hydrant 4 Running water that is carried from another dwelling 5 Tanked in by truck 6 Water from a well, river, lake, stream or other
Answers 3, 4, 5, 6 continue with number 8
7. Water supply
How many days of the week is water available? Circle only one answer
1 Daily 2 Every third day 3 Twice a week 4 Once a week 5 Occasionally
Editable Census Questionnaire
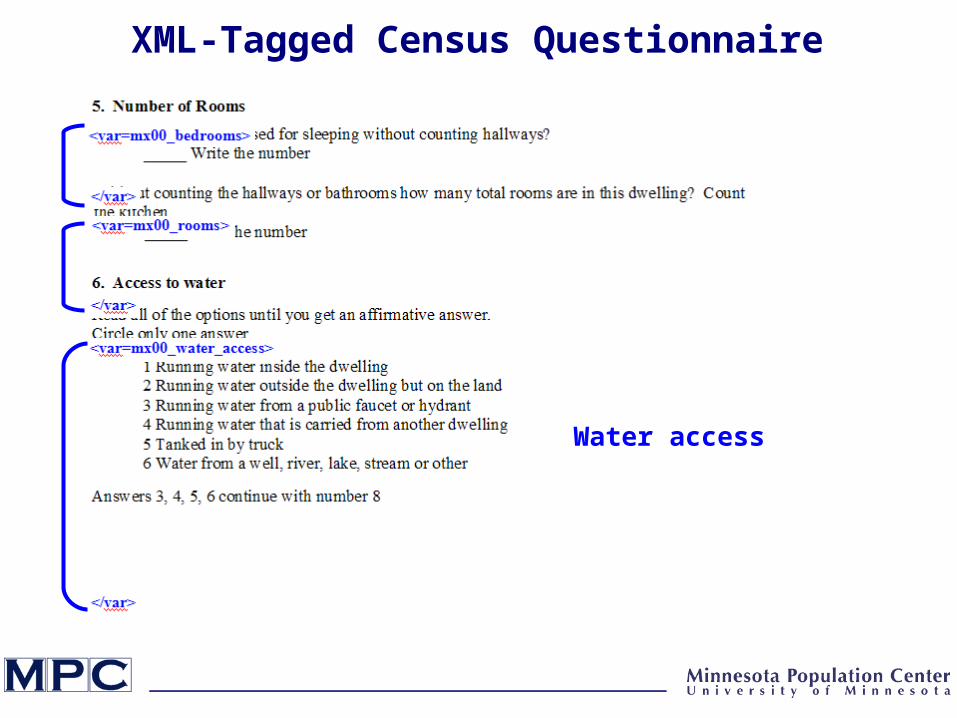
Water access
XML-Tagged Census Questionnaire
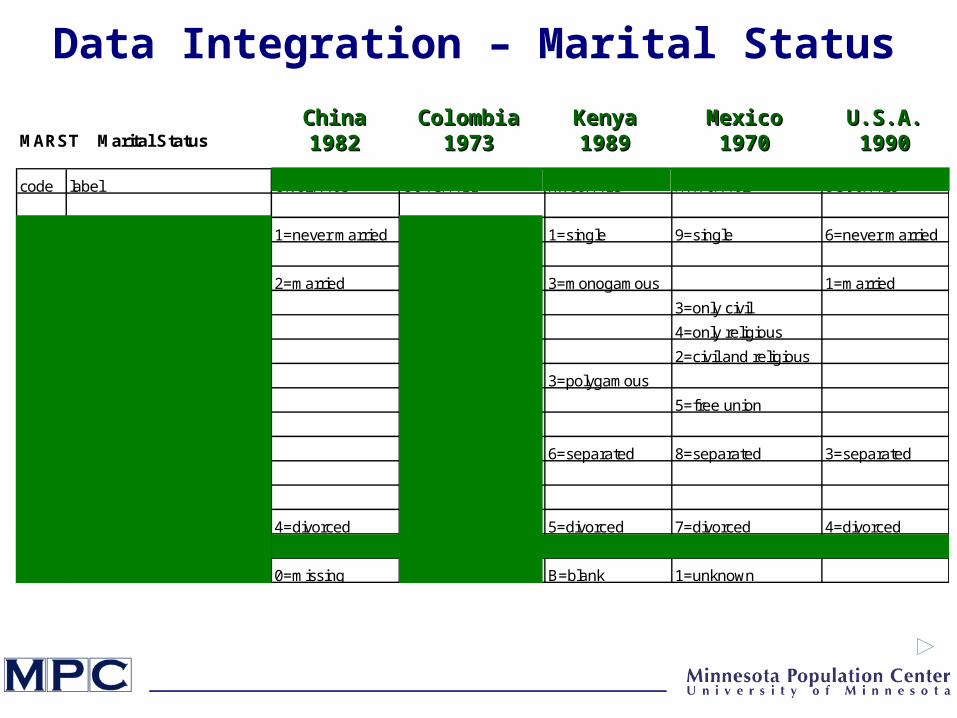
Data Integration – Marital Status
MARST Marital Status
code label CN82A403 CO73A411 KN89A413 MX70A402 US90A425
100 SINGLE/NEVER MARRIED 1=never married 4=single 1=single 9=single 6=never married
200 MARRIED/IN UNION
210 Married (not specified) 2=married 2=married 3=monogamous 1=married
211 Civil 3=only civil
212 Religious 4=only religious
213 Civil and religious 2=civil and religious
214 Polygamous 3=polygamous
220 Consensual union 1=free union 5=free union
300 SEPARATED/DIVORCED 3=sep. or divorced
310 Separated 6=separated 8=separated 3=separated
321 Legally separated
322 De facto separated
330 Divorced 4=divorced 5=divorced 7=divorced 4=divorced
400 WIDOWED 3=widowed 5=widowed 4=widowed 6=widowed 5=widowed
999 UNKNOWN/MISSING 0=missing 6=unknown B=blank 1=unknown
ChinaChina19821982
ColombiaColombia19731973
KenyaKenya19891989
MexicoMexico19701970
U.S.A.U.S.A.19901990
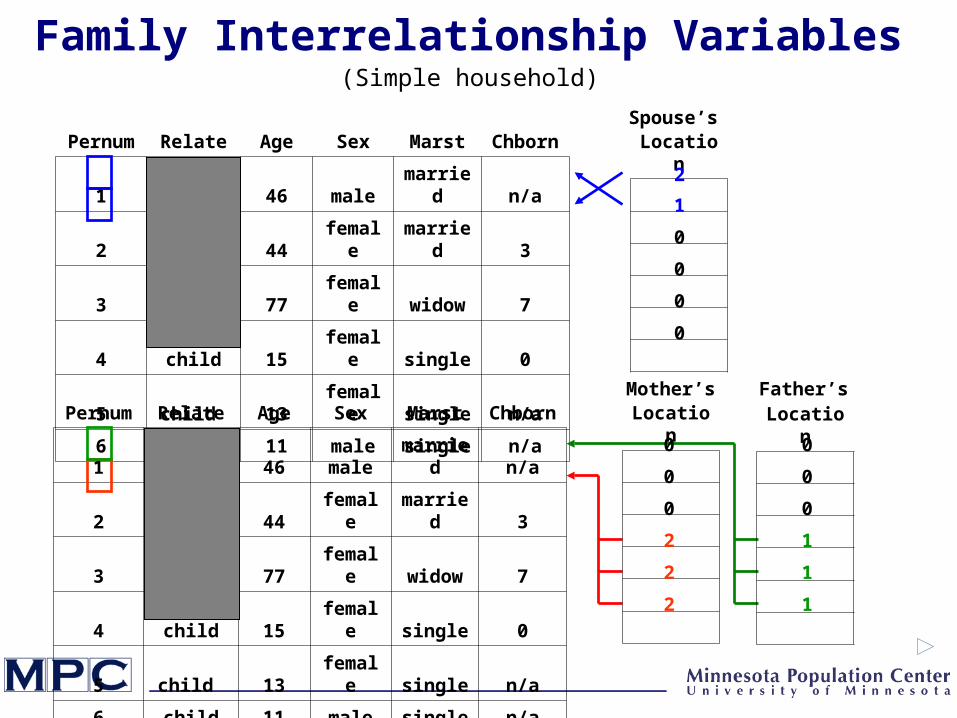
Pernum Relate Age Sex Marst Chborn
1 head 46 male married n/a
2 spouse 44 female married 3
3 aunt 77 female widow 7
4 child 15 female single 0
5 child 13 female single n/a
6 child 11 male single n/a
Pernum Relate Age Sex Marst Chborn
1 head 46 male married n/a
2 spouse 44 female married 3
3 aunt 77 female widow 7
4 child 15 female single 0
5 child 13 female single n/a
6 child 11 male single n/a
Spouse’s
Mother’s Father’s
Family Interrelationship Variables
Location
2
1
0
0
0
0
Location
Location
0
0
0 0
0
0
2 1
1
1
2
2
(Simple household)
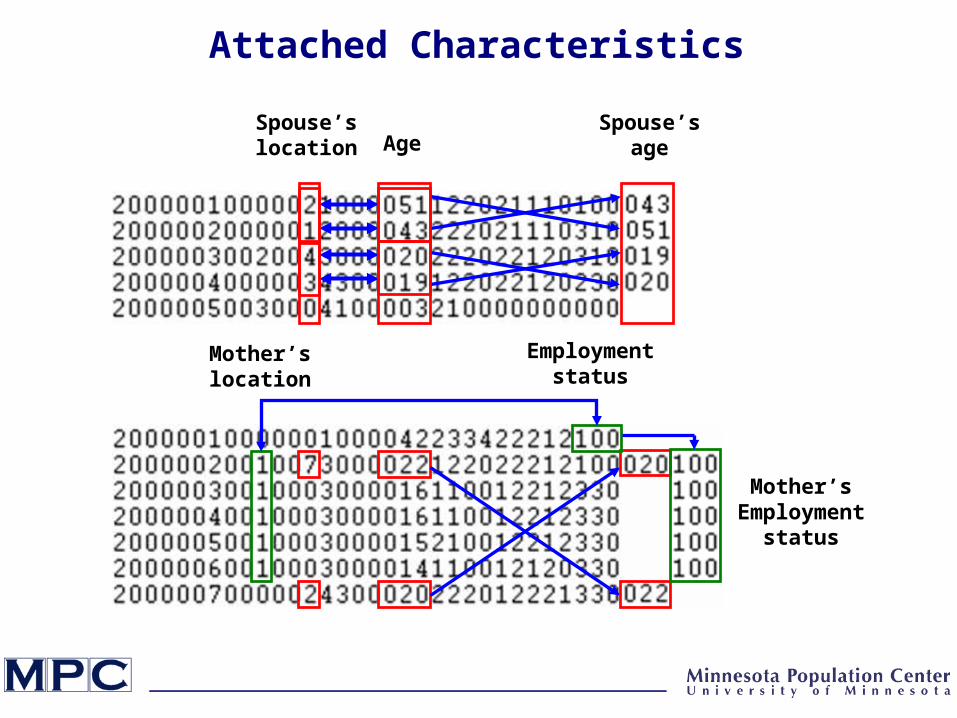
Attached Characteristics
Spouse’s age
Mother’s location
Employment status
Mother’s Employment
status
Spouse’s location Age
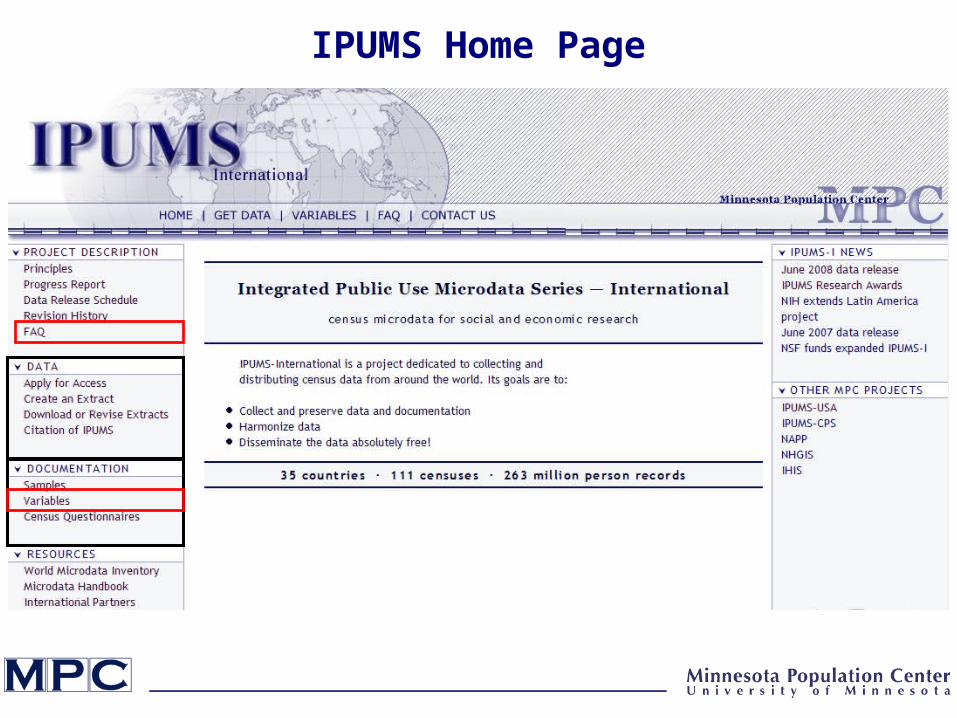
IPUMS Home Page
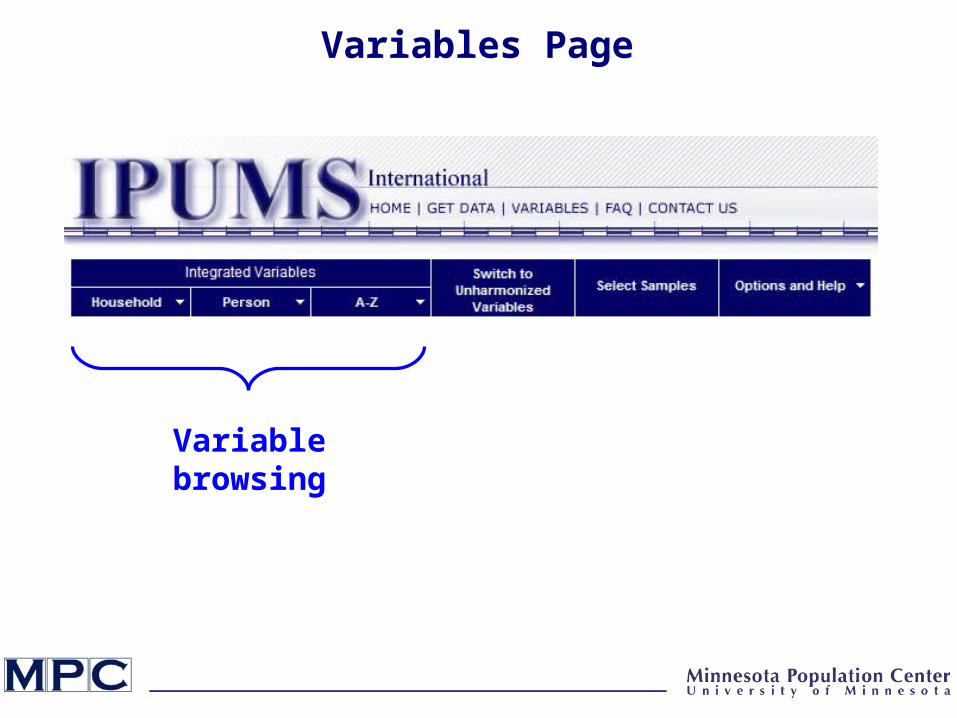
Variables Page
Variable browsing
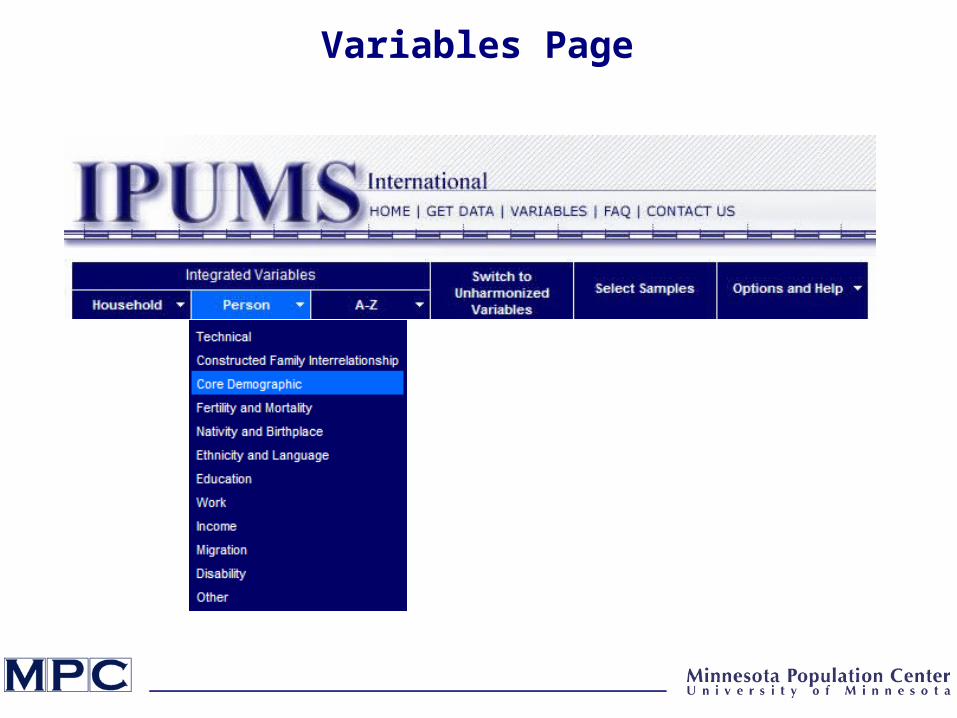
Variables Page

Variables Page

Sample Filtering
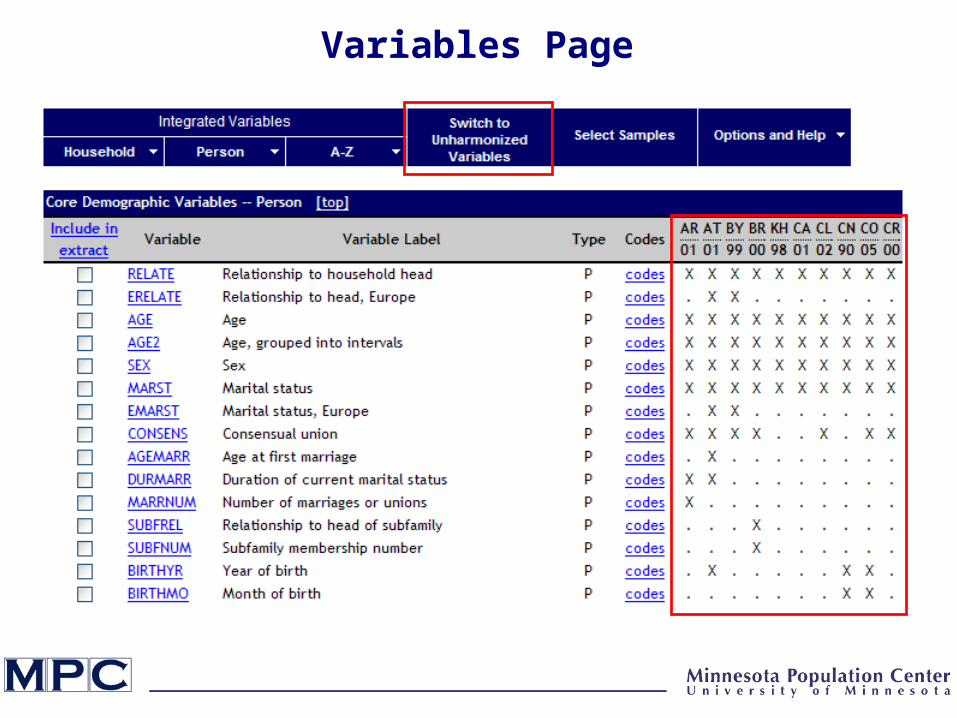
Variables Page
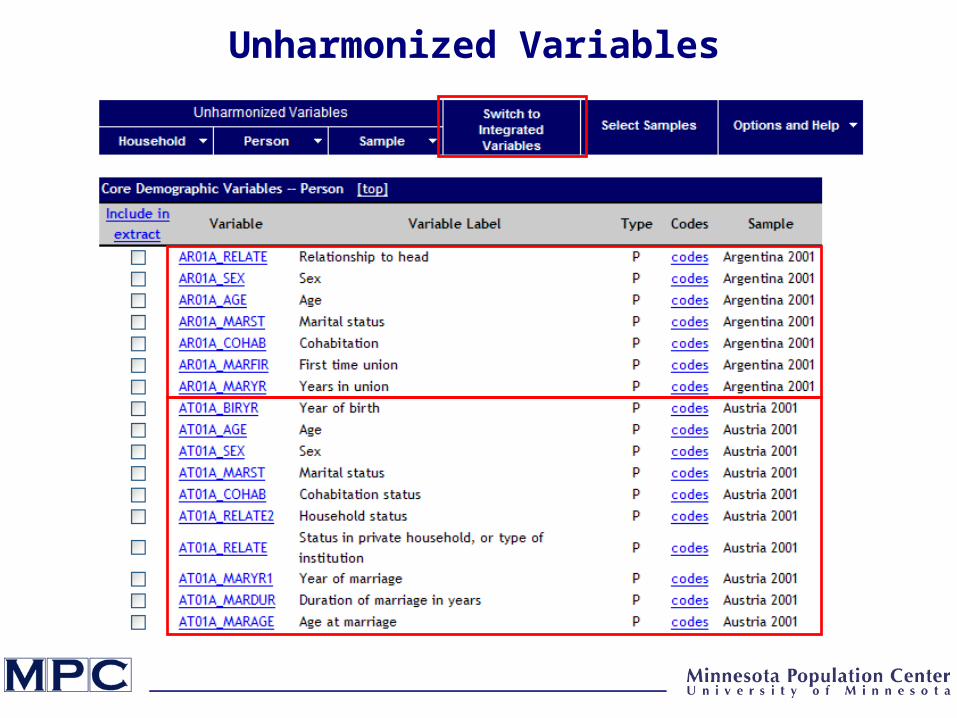
Unharmonized Variables

Variables Page

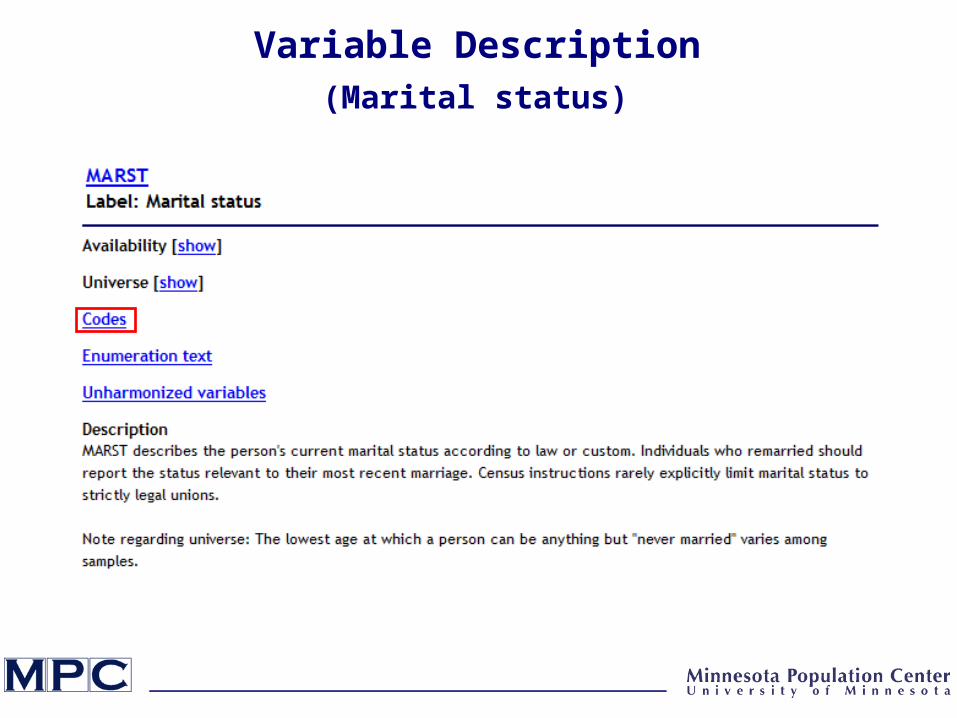
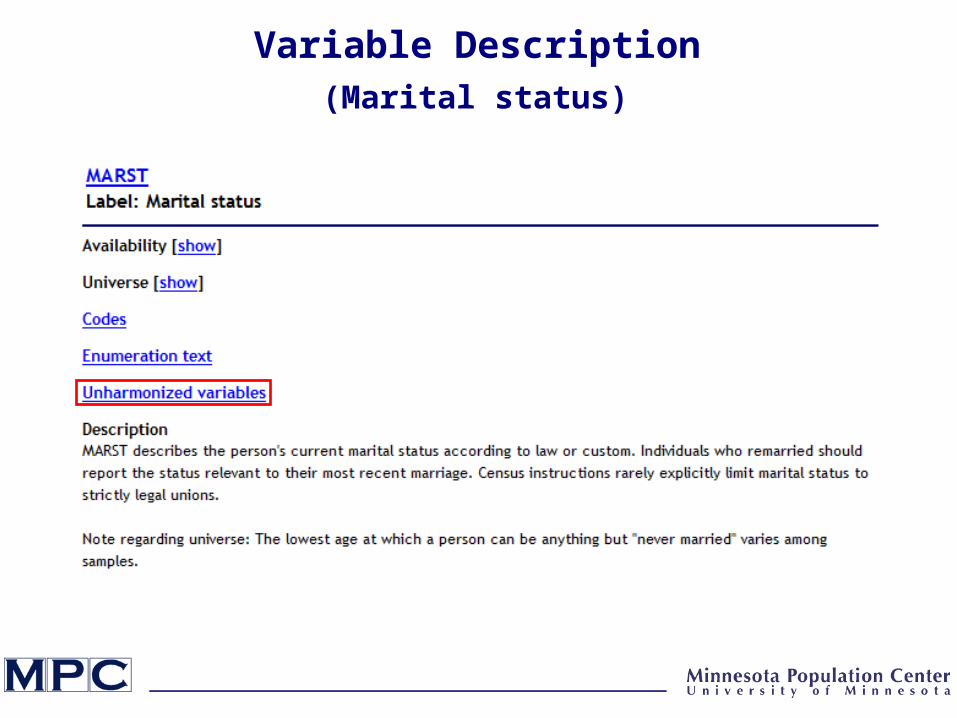
Variable Description
(Marital status)

Comparability Discussion
(Marital status)

Variable Description
(Marital status)

Enumeration Text(Marital status)
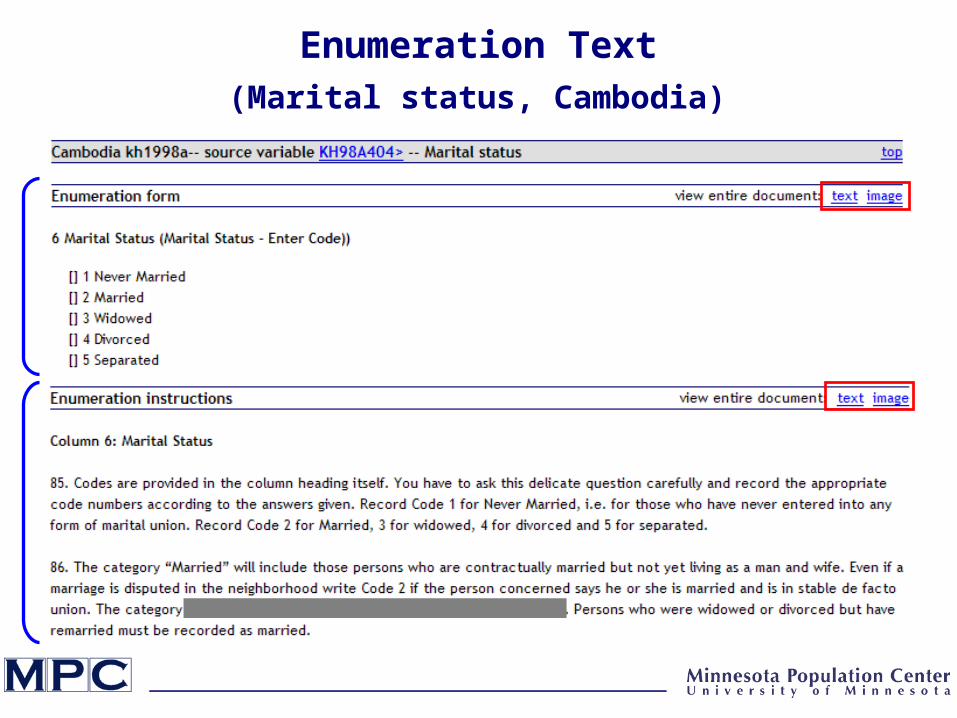
Enumeration Text(Marital status, Cambodia)
Variable Description(Marital status)
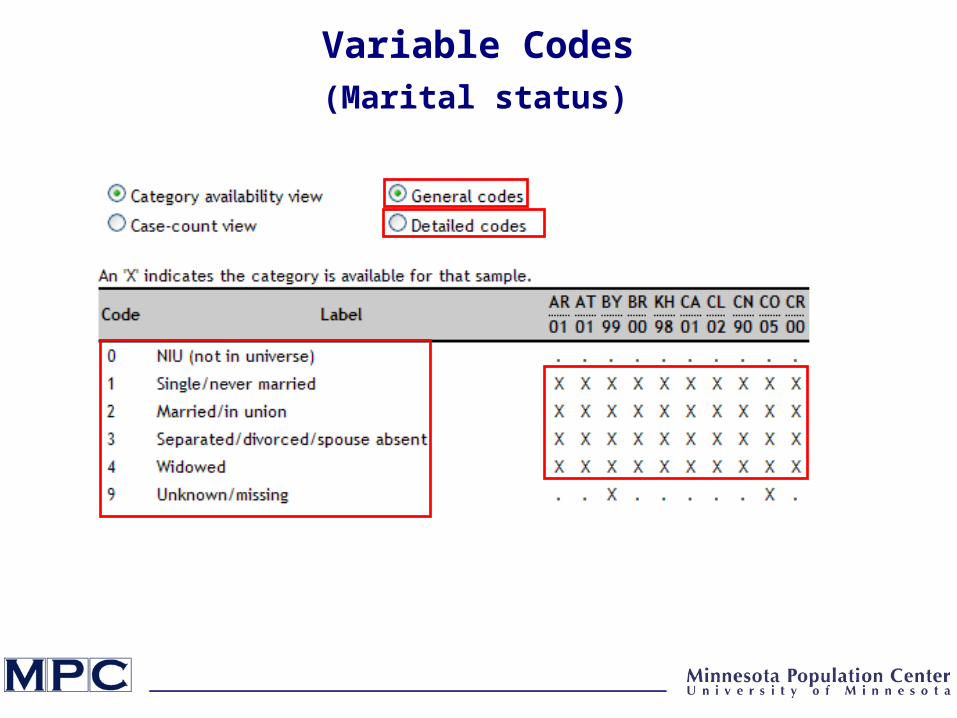
Variable Codes(Marital status)

Variable Codes(Marital status)
Variable Description(Marital status)
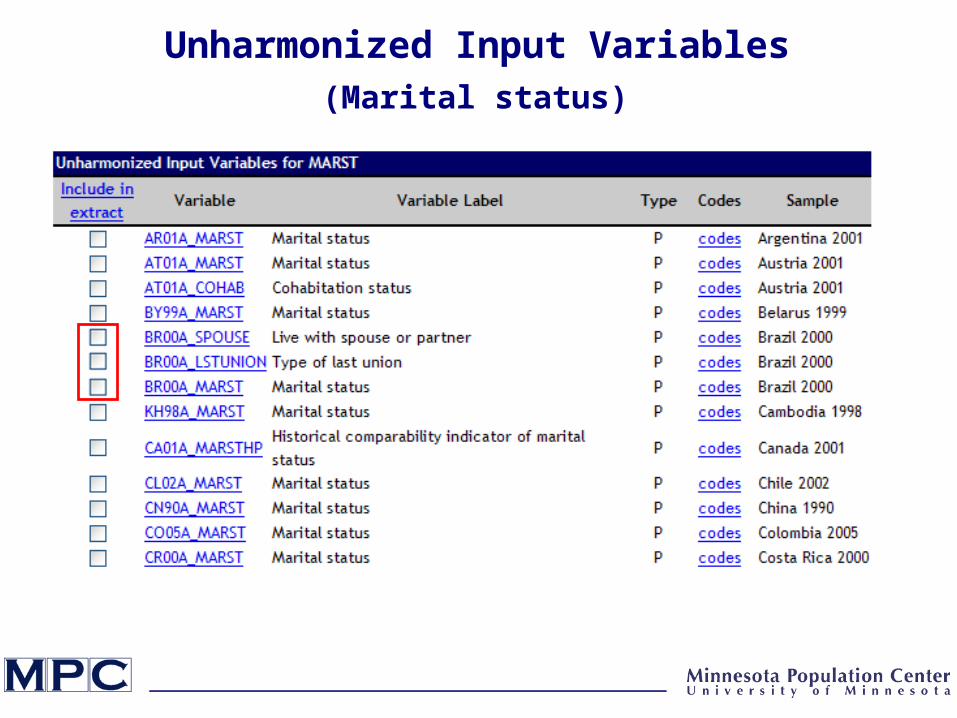
Unharmonized Input Variables(Marital status)
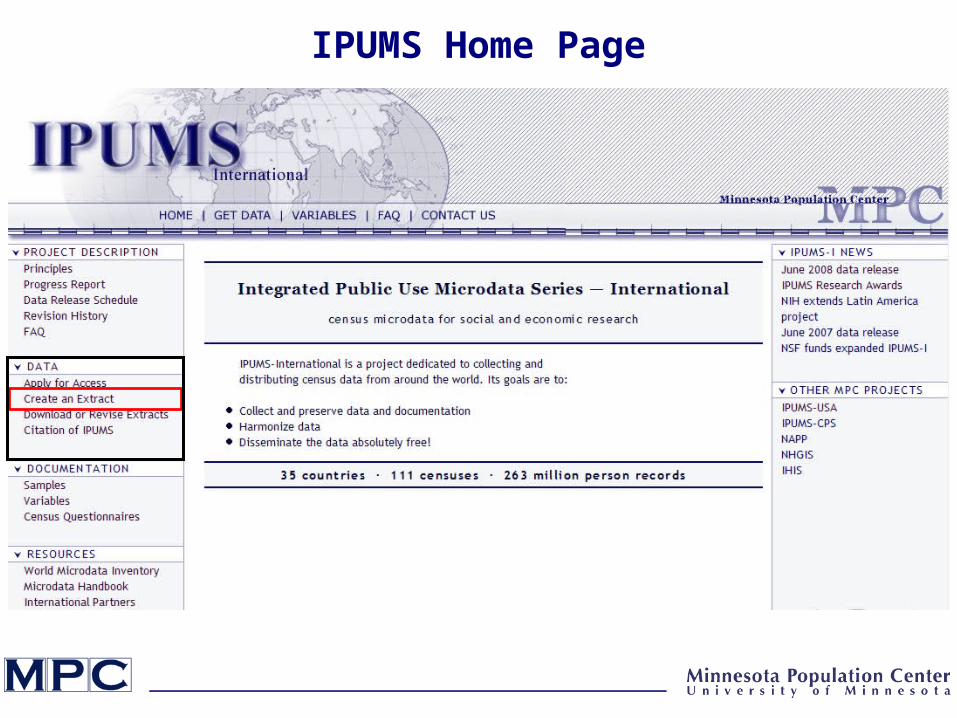
IPUMS Home Page
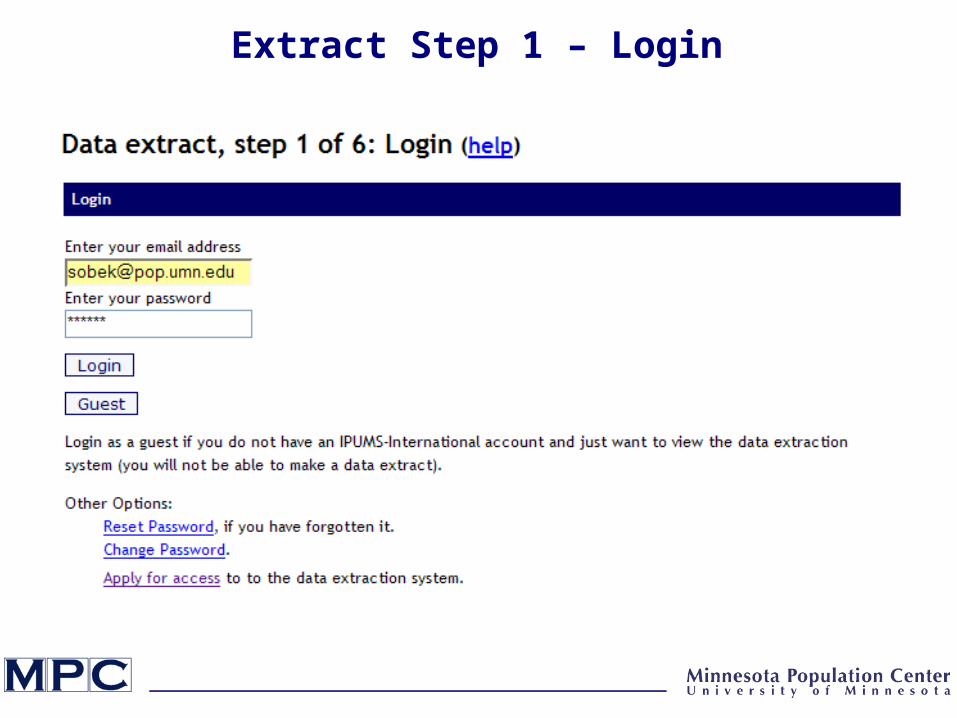
Extract Step 1 – Login

Extract Step 2 – Select Samples

Extract Step 3 – Select Variables
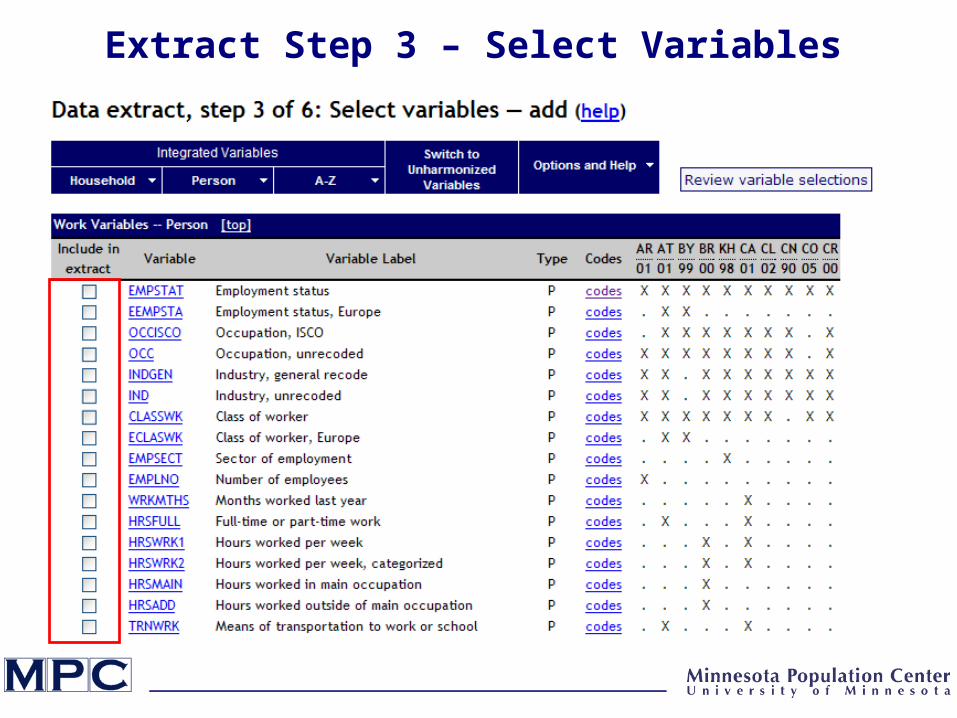
Extract Step 3 – Select Variables
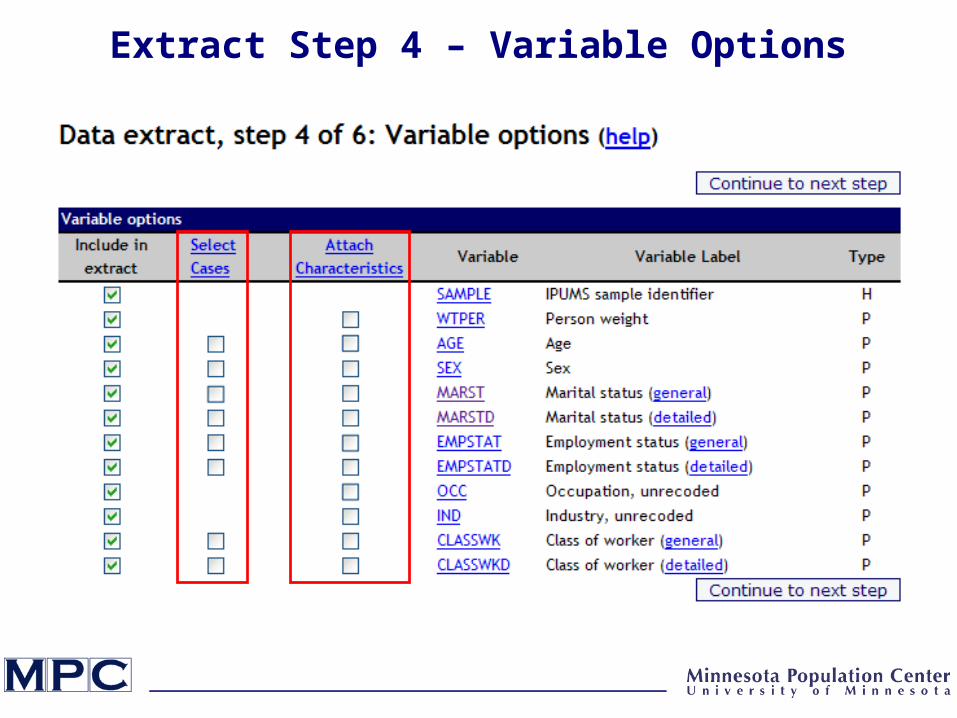
Extract Step 4 – Variable Options

Extract Step 4 – Select Cases
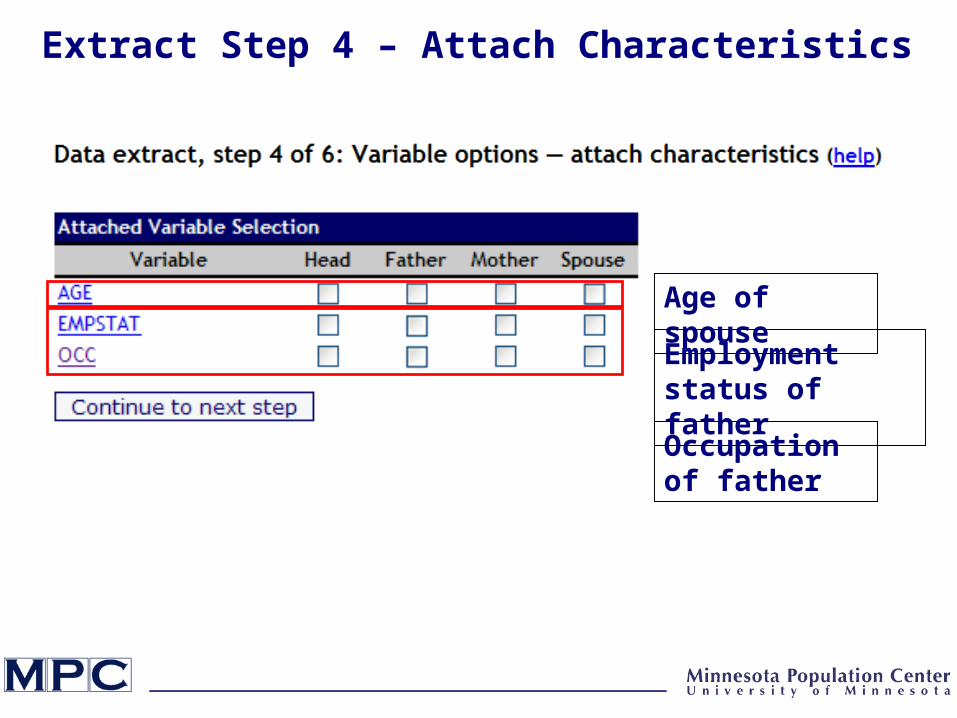
Age of spouse
Employment status of father
Occupation of father
Extract Step 4 – Attach Characteristics

Extract Step 5 – Customize Sample Sizes

Extract Step 5 – Customize Sample Sizes

Extract Step 5 – Customize Sample Sizes
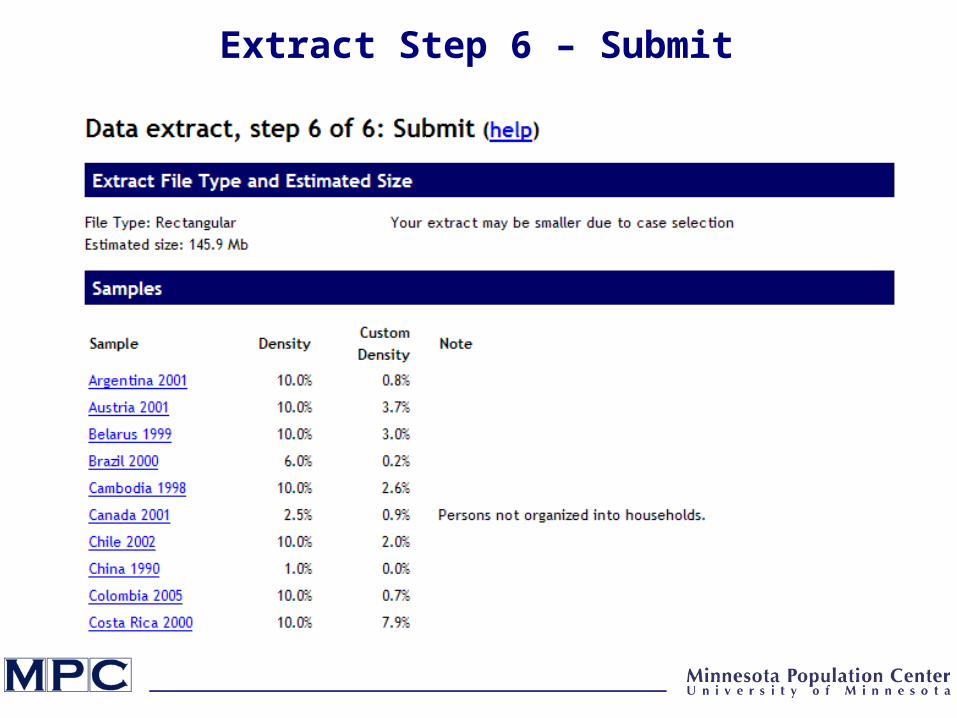
Extract Step 6 – Submit
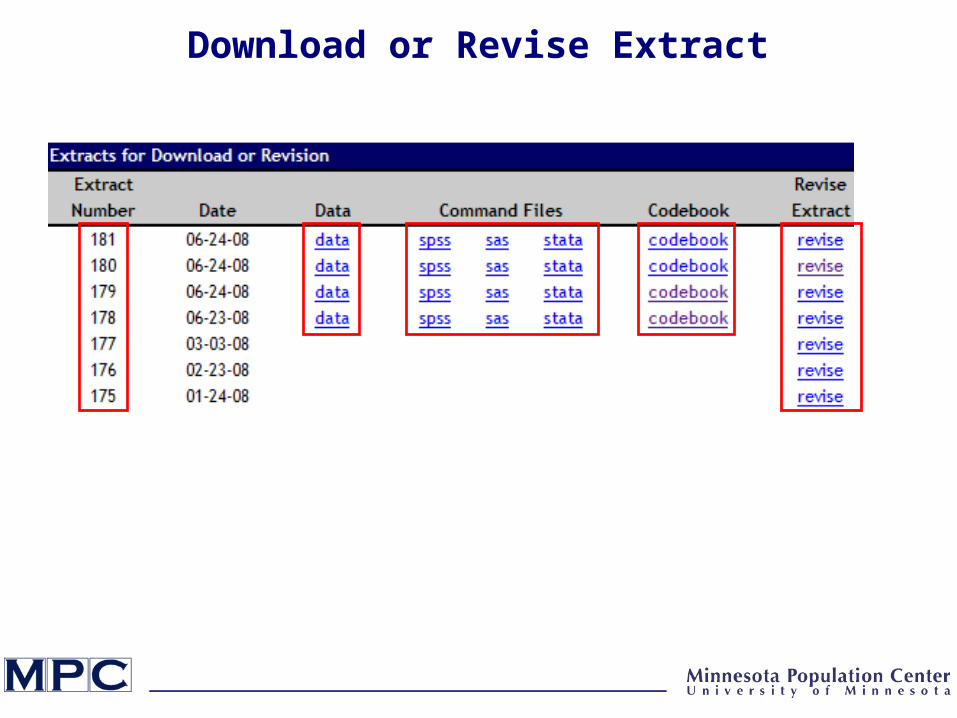
Download or Revise Extract
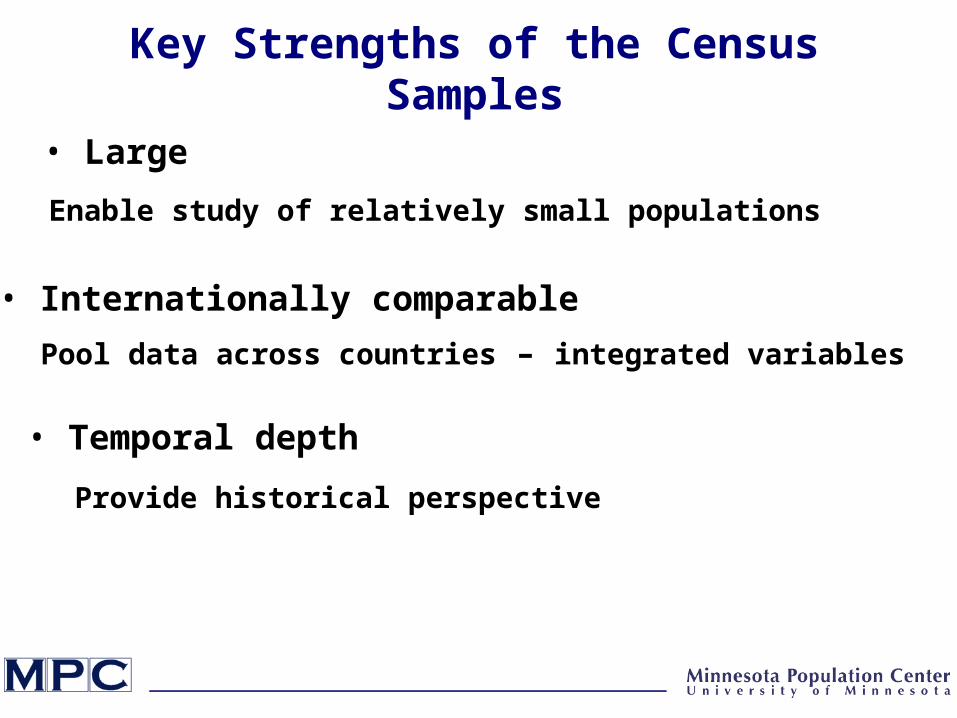
Key Strengths of the Census Samples
• Internationally comparable
Pool data across countries – integrated variables
Enable study of relatively small populations
• Large
• Temporal depth
Provide historical perspective
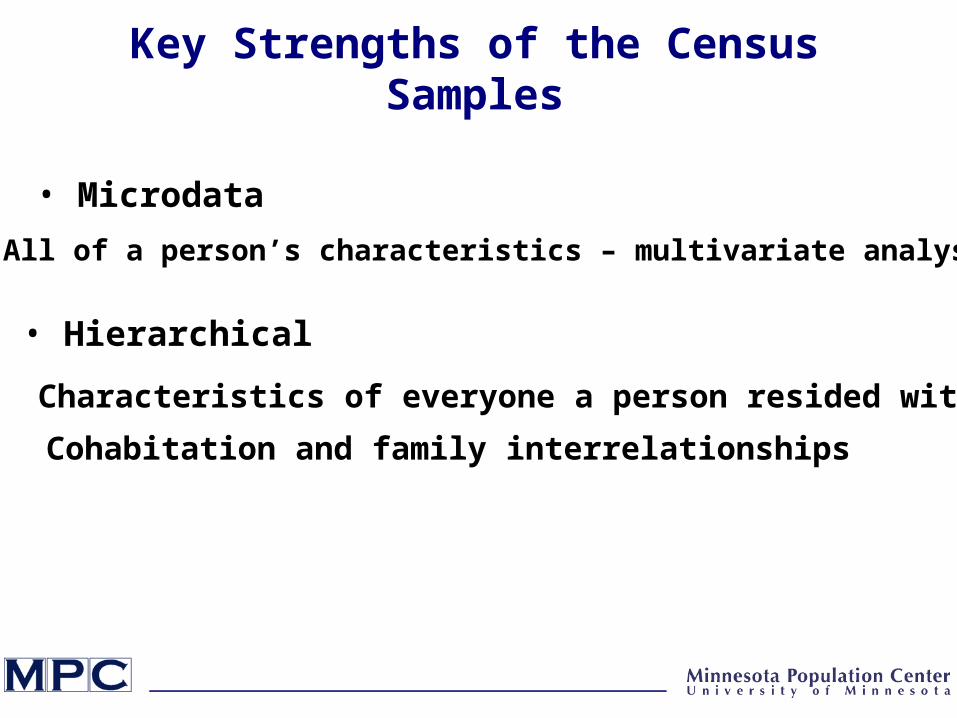
Key Strengths of the Census Samples
• Microdata
All of a person’s characteristics – multivariate analysis
• Hierarchical
Characteristics of everyone a person resided with
Cohabitation and family interrelationships

Limitations Due to Confidentiality
• Geography
20,000 population or larger
• Sensitive variables, very small categories
• Samples
Too small to answer some questions

Other Issues and Limitations
• Varying census years
• Cross-sectional dataNot longitudinal
• User burdenInformation overload; culturally specific knowledge
Variable labels are insufficient
• Very large data
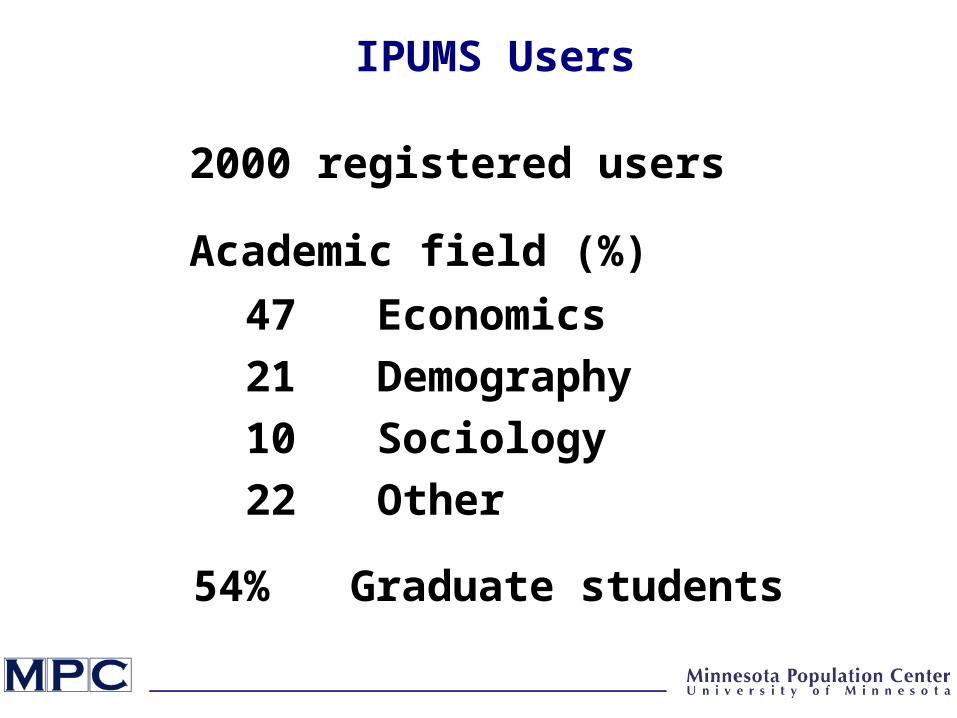
Academic field (%)
47 Economics
21 Demography
10 Sociology
22 Other
IPUMS Users
54% Graduate students
2000 registered users
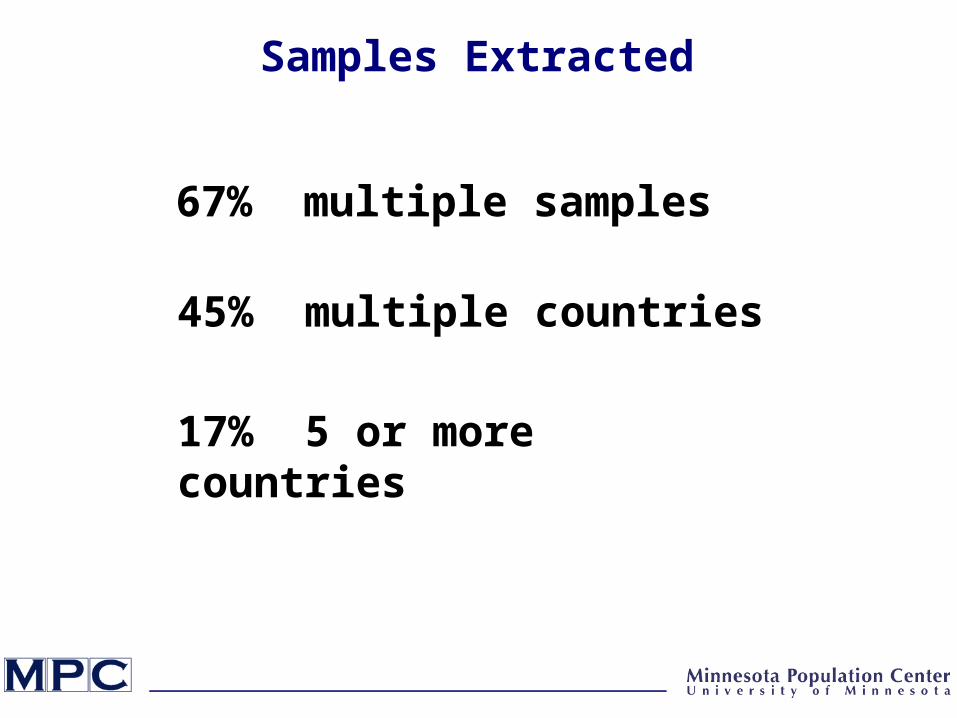
67% multiple samples
45% multiple countries
Samples Extracted
17% 5 or more countries
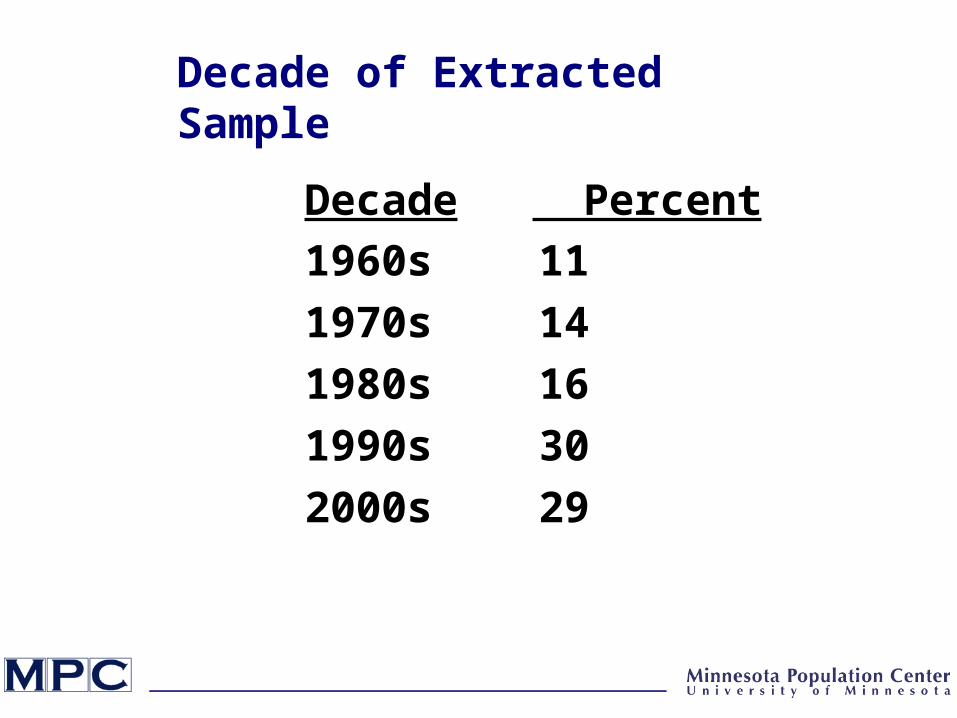
Decade of Extracted Sample
1960s 11
1970s 14
1980s 16
1990s 30
2000s 29
Decade Percent

Most Frequently Extracted Countries
1. Mexico
2. Brazil
3. United States
4. Colombia
5. France
6. Chile
7. Ecuador
8. Vietnam
9. Kenya
10. Argentina
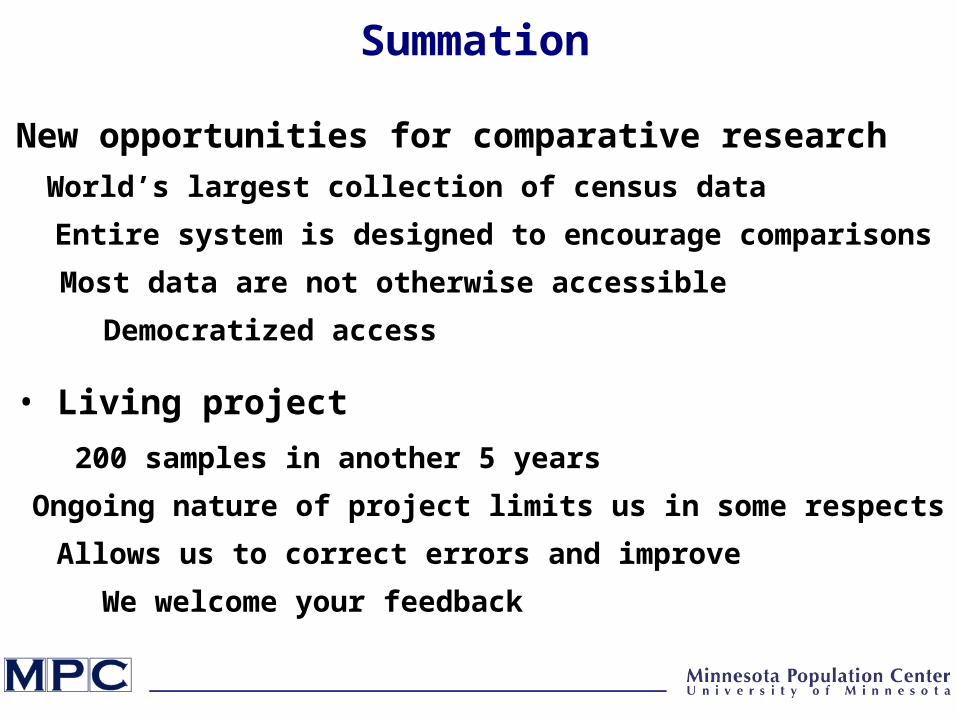
Summation
• Living project
Democratized access
World’s largest collection of census data
200 samples in another 5 years
Ongoing nature of project limits us in some respects
Allows us to correct errors and improve
Most data are not otherwise accessible
• New opportunities for comparative research
Entire system is designed to encourage comparisons
We welcome your feedback
0
5
10
15
20
25
30
35
40
45
50
1960 1965 1970 1975 1980 1985 1990 1995 2000 2005
Pe
rce
nt
in L
ab
or
Fo
rce
MexicoMexicoCosta RicaCosta Rica
EcuadorEcuador
ChileChile
VenezuelaVenezuela
ColombiaColombia
BrazilBrazil
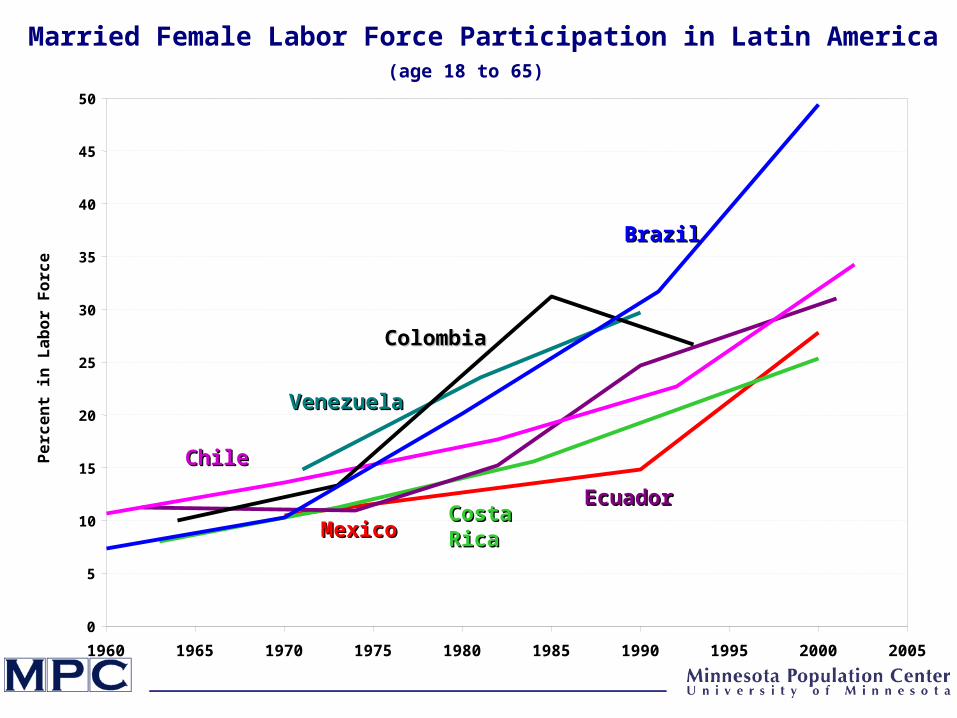
Married Female Labor Force Participation in Latin America(age 18 to 65)
0
10
20
30
40
50
60
70
1920 1930 1940 1950 1960 1970 1980 1990 2000 2010
Pe
rce
nt
in L
ab
or
Fo
rce
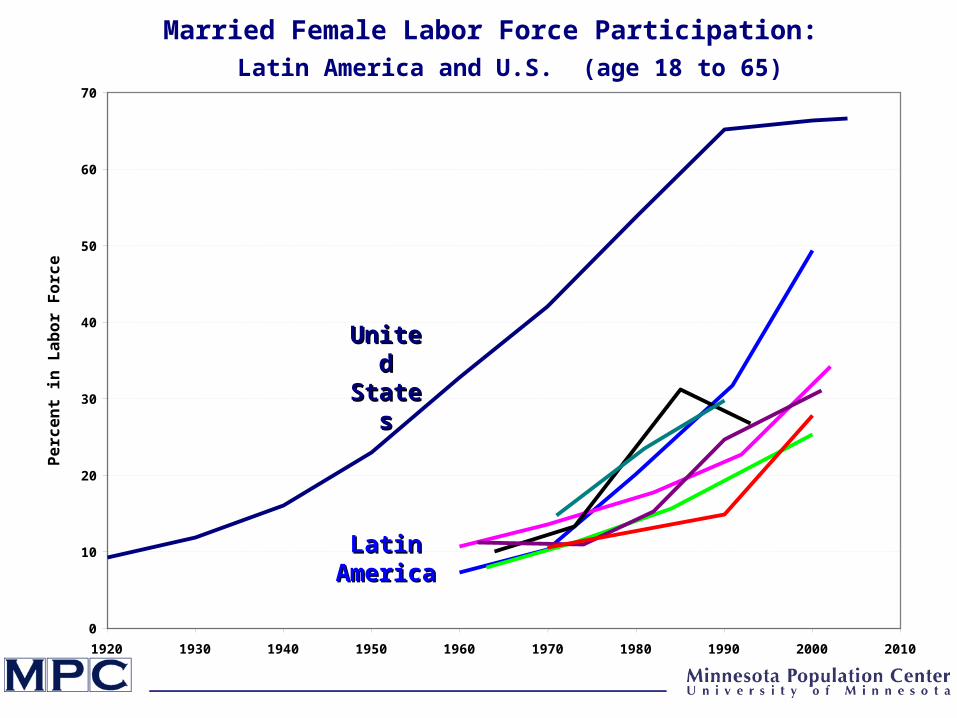
Latin Latin AmericaAmerica
United United StatesStates
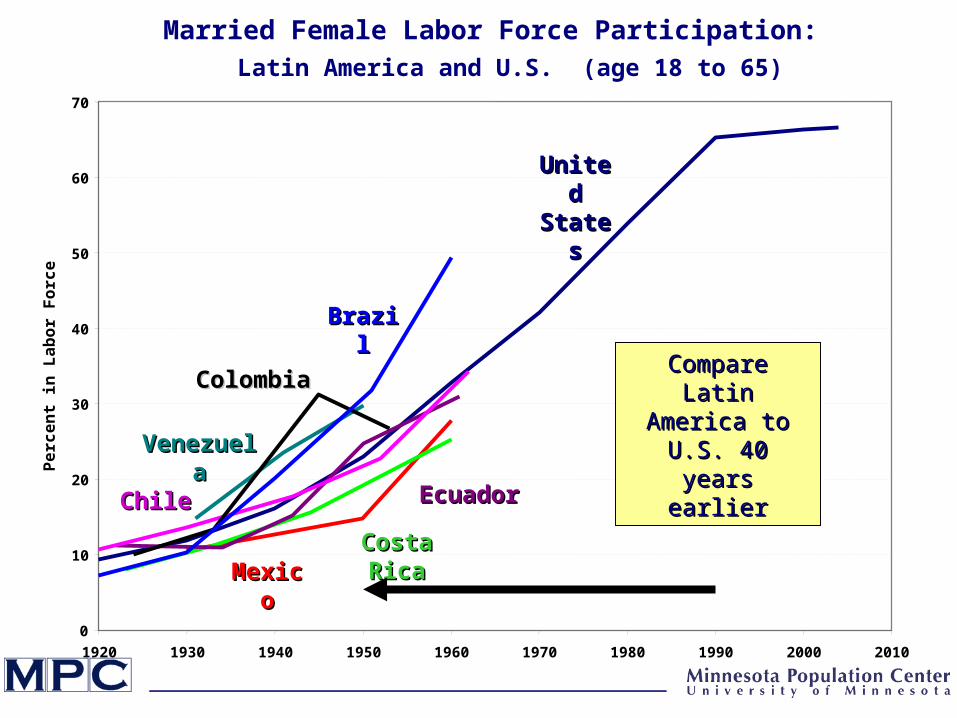
Married Female Labor Force Participation:Latin America and U.S. (age 18 to 65)
0
10
20
30
40
50
60
70
1920 1930 1940 1950 1960 1970 1980 1990 2000 2010
Pe
rce
nt
in L
ab
or
Fo
rce
United United StatesStates
MexicoMexicoCosta RicaCosta Rica
EcuadorEcuadorChileChile
VenezuelaVenezuela
ColombiaColombia
BrazilBrazil
Married Female Labor Force Participation:Latin America and U.S. (age 18 to 65)
Compare Latin Compare Latin America to U.S. America to U.S. 40 years earlier40 years earlier
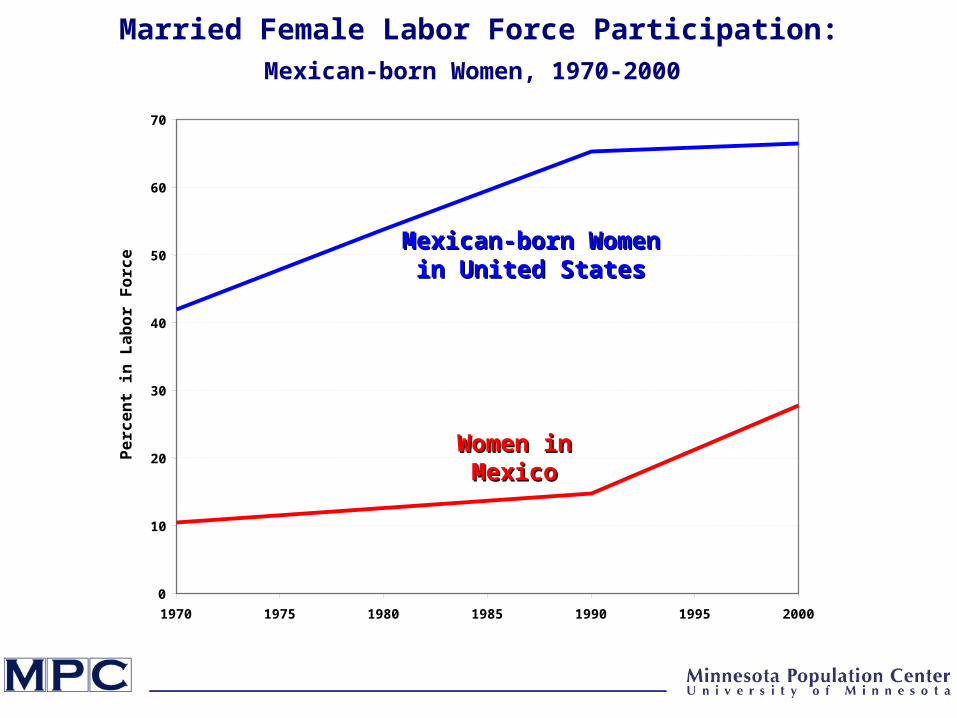
Married Female Labor Force Participation:Mexican-born Women, 1970-2000
0
10
20
30
40
50
60
70
1970 1975 1980 1985 1990 1995 2000
Pe
rce
nt
in L
ab
or
Fo
rce
Mexican-born Women Mexican-born Women in United Statesin United States
Women in Women in MexicoMexico
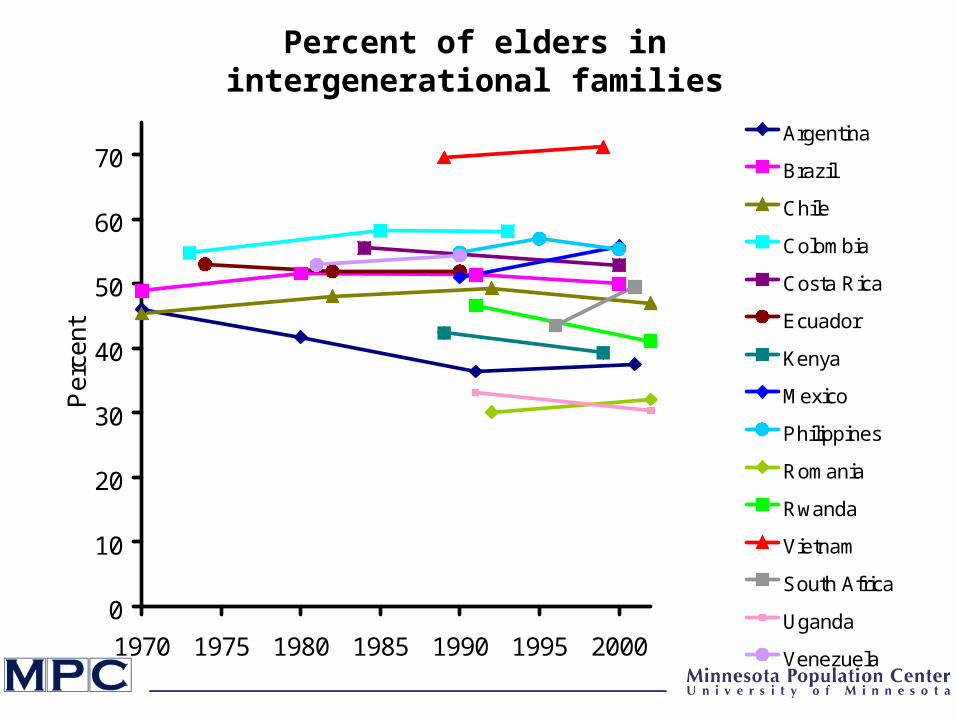
Percent of elders in intergenerational families
0
10
20
30
40
50
60
70
1970 1975 1980 1985 1990 1995 2000
Per
cent
Argentina
Brazil
Chile
Colombia
Costa Rica
Ecuador
Kenya
Mexico
Philippines
Romania
Rwanda
Vietnam
South Africa
Uganda
Venezuela

Percent in elder-head intergenerational families
0
10
20
30
40
50
1970 1975 1980 1985 1990 1995 2000
Per
cent
Argentina
Brazil
Chile
Colombia
Costa Rica
Ecuador
Kenya
Mexico
Philippines
Romania
Rwanda
Vietnam
South Africa
Uganda
Venezuela
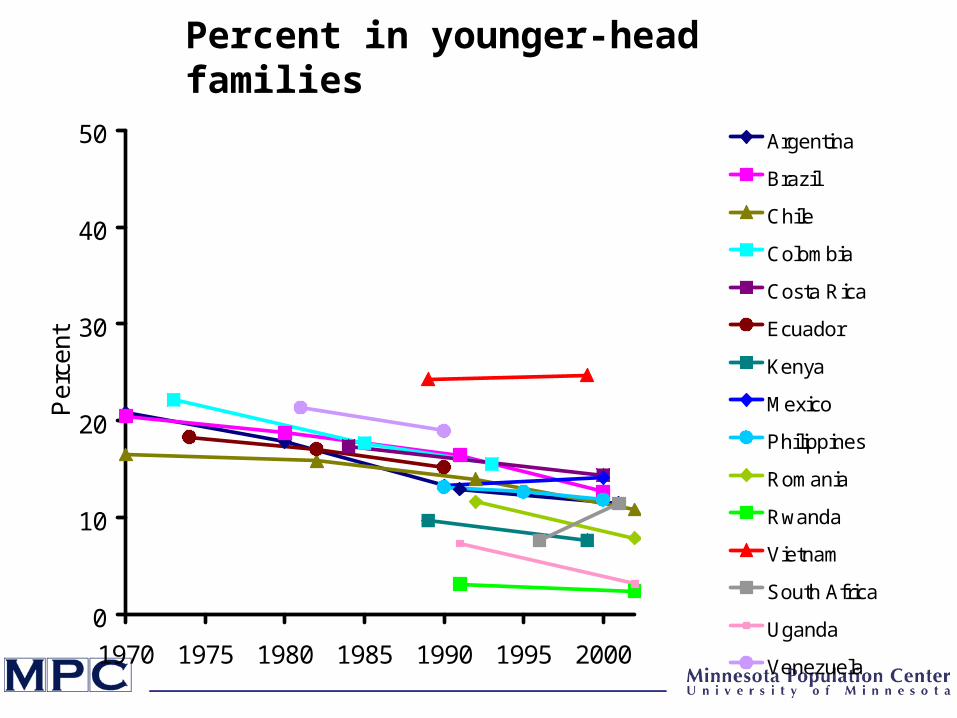
Percent in younger-head families
0
10
20
30
40
50
1970 1975 1980 1985 1990 1995 2000
Per
cent
Argentina
Brazil
Chile
Colombia
Costa Rica
Ecuador
Kenya
Mexico
Philippines
Romania
Rwanda
Vietnam
South Africa
Uganda
Venezuela

Persons with Completed Secondary Education:National Populations Versus Migrants to the United States
0
10
20
30
40
50
60
70
80
90
100
Brazil Chile Costa Rica Ecuador Mexico Vietnam Kenya South Africa
Pe
rce
nt
In home country, ca. 2000 Migrants to U.S. 1995-2000

Working-Age Population in the Labor Force, by Sex
0
10
20
30
40
50
60
70
80
90
100B
razi
l 19
60
Bra
zil 1
97
0B
razi
l 19
80
Bra
zil 1
99
1B
razi
l 20
00
Ch
ile 1
96
0C
hile
19
70
Ch
ile 1
98
2C
hile
19
92
Ch
ile 2
00
2
Co
lom
bia
19
64
Co
lom
bia
19
73
Co
lom
bia
19
85
Co
lom
bia
19
93
Co
sta
Ric
a 1
96
3C
ost
a R
ica
19
73
Co
sta
Ric
a 1
98
4C
ost
a R
ica
20
00
Ecu
ad
or
19
62
Ecu
ad
or
19
74
Ecu
ad
or
19
82
Ecu
ad
or
19
90
Ecu
ad
or
20
01
Me
xico
19
70
Me
xico
19
90
Me
xico
20
00
Ve
ne
zue
la 1
97
1V
en
ezu
ela
19
81
Ve
ne
zue
la 1
99
0
Ch
ina
19
82
Vie
tna
m 1
98
9V
ietn
am
19
99
Ke
nya
19
89
Ke
nya
19
99
So
uth
Afr
ica
19
96
So
uth
Afr
ica
20
01
Fra
nce
19
62
Fra
nce
19
68
Fra
nce
19
75
Fra
nce
19
82
Fra
nce
19
90
Un
ited
Sta
tes
19
60
Un
ited
Sta
tes
19
70
Un
ited
Sta
tes
19
80
Un
ited
Sta
tes
19
90
Un
ited
Sta
tes
20
00
Pe
rce
nt
of
Wo
rkin
g-A
ge
Po
pu
lati
on
Males Females Persons age 16 to 65.

Population Residing with an Elderly Person
0
5
10
15
20
25
30
1960
1970
1980
1991
2000
1973
1985
1993
1970
1990
2000
1989
1999
1996
2001
1982
1989
1999
1962
1968
1975
1982
1990
1960
1970
1980
1990
2000
Per
cen
t o
f to
tal
po
pu
lati
on
Elderly persons (age 65+) Non-elderly residing with an elderly person
Brazil Mexico KenyaColombia VietnamChinaS Africa France United States


