DESIGN OF GAS HANDLING FACILITIES FOR SHALE OIL PRODUCTION Rocky Mountain Gas Processors Association – 2015 Regional Conference Thursday November 19, 2015 Denver, CO Mike Conder and April Schroer
Transcript
DESIGN OF GAS HANDLING
FACILITIES FOR SHALE OIL
PRODUCTION
Rocky Mountain Gas Processors Association – 2015
Regional Conference
Thursday November 19, 2015 Denver, CO
Mike Conder and April Schroer
Overview
Trends in Gas Handling from Shale Oil Production
Designing with PVT Fluid Analyses
Simulating Gas Handling at Oil Production Facilities
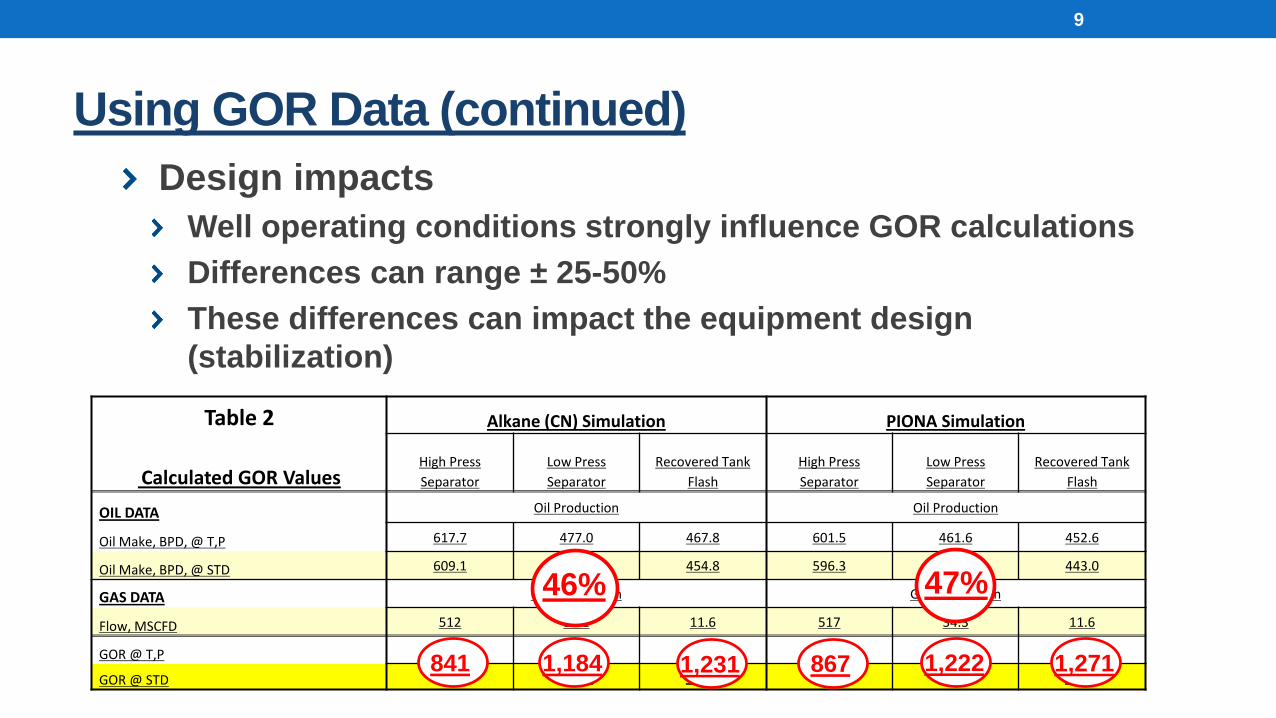
Using GOR Data
Modeling Different Oils
Lift Gas Design & Sources
VRT Design & VRT/VRU System Value
Practical Tips for Facility Design
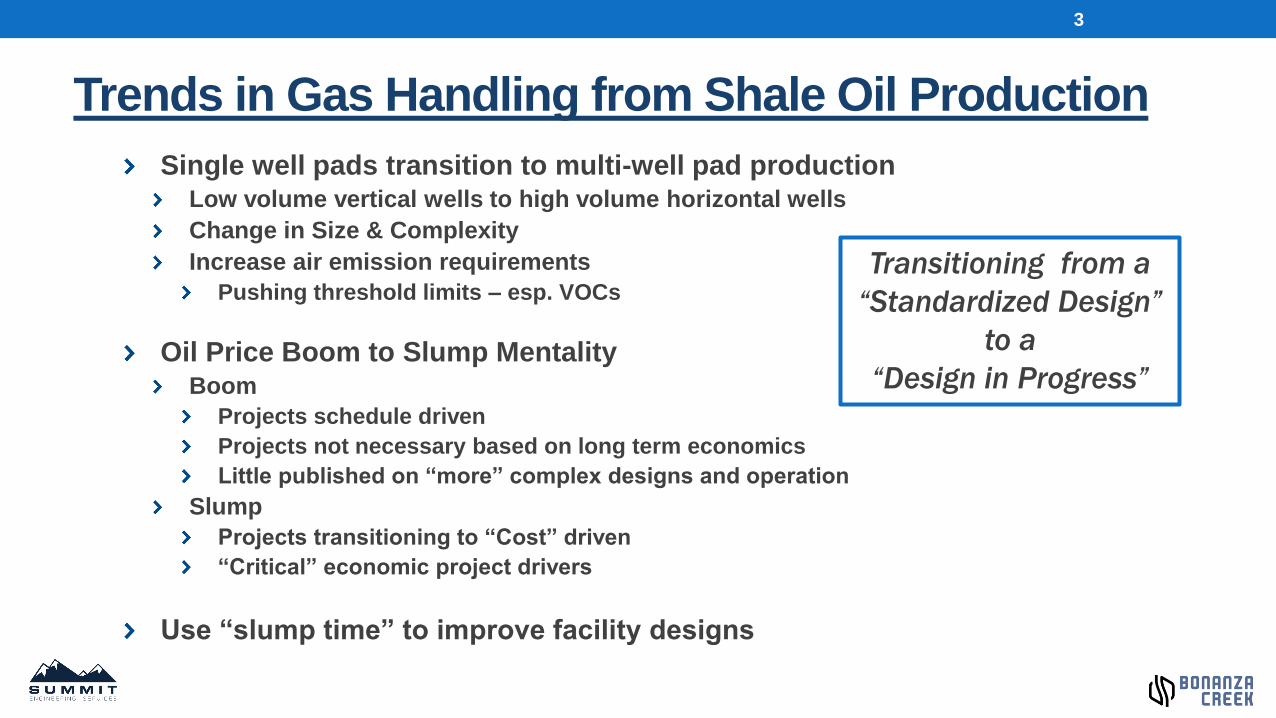
Trends in Gas Handling from Shale Oil Production
Single well pads transition to multi-well pad productionLow volume vertical wells to high volume horizontal wells
Change in Size & Complexity
Increase air emission requirements
Pushing threshold limits – esp. VOCs
Oil Price Boom to Slump MentalityBoom
Projects schedule driven
Projects not necessary based on long term economics
Little published on “more” complex designs and operation
Slump
Projects transitioning to “Cost” driven
“Critical” economic project drivers
Use “slump time” to improve facility designs
3
Transitioning from a
“Standardized Design”
to a
“Design in Progress”
Designs for Shale Oil/Gas Handling – “Traditional”
“Traditional” Well Pad typical flow sheet
4
Designs for Shale Oil/Gas Handling “4 Well Multi”4 –Well Multi-Well Pad Flow Sheet
5
GATHERING
Designing with PVT Fluid Analyses
PVT (Pressure-Volume-Temperature) fluid properties analysisMainly used for planning field exploitation by reservoir engineers
However, facilities engineers can use this information for equipment design
Predict gas handling requirements of the well and/or field
PVT samples are typically taken at surface separator Gas/Oil/Water samples taken & then recombined in the lab
GC results are carbon number (CN or “alkane – straight chain”) analysis
Typical range from C1 (methane ) to C36 with inerts
CN can be used in a process simulator for equipment sizing
Our work is based on VMG Sim “PIONA” (Paraffin's, Iso-paraffins,
Olefins, Naphthenes and Aromatics) new oil characterization Gives improved liquid property results
6
Simulating Gas Handling at Oil Production Facilities
Oil characterization by PIONA vs straight chain CN data
Little difference in gas production & analysis between two cases
Credible difference in oil properties
Need best oil properties for stabilization designs & meeting transport specs
Off gas flow from a stabilizer will impact facility & gas/handling design
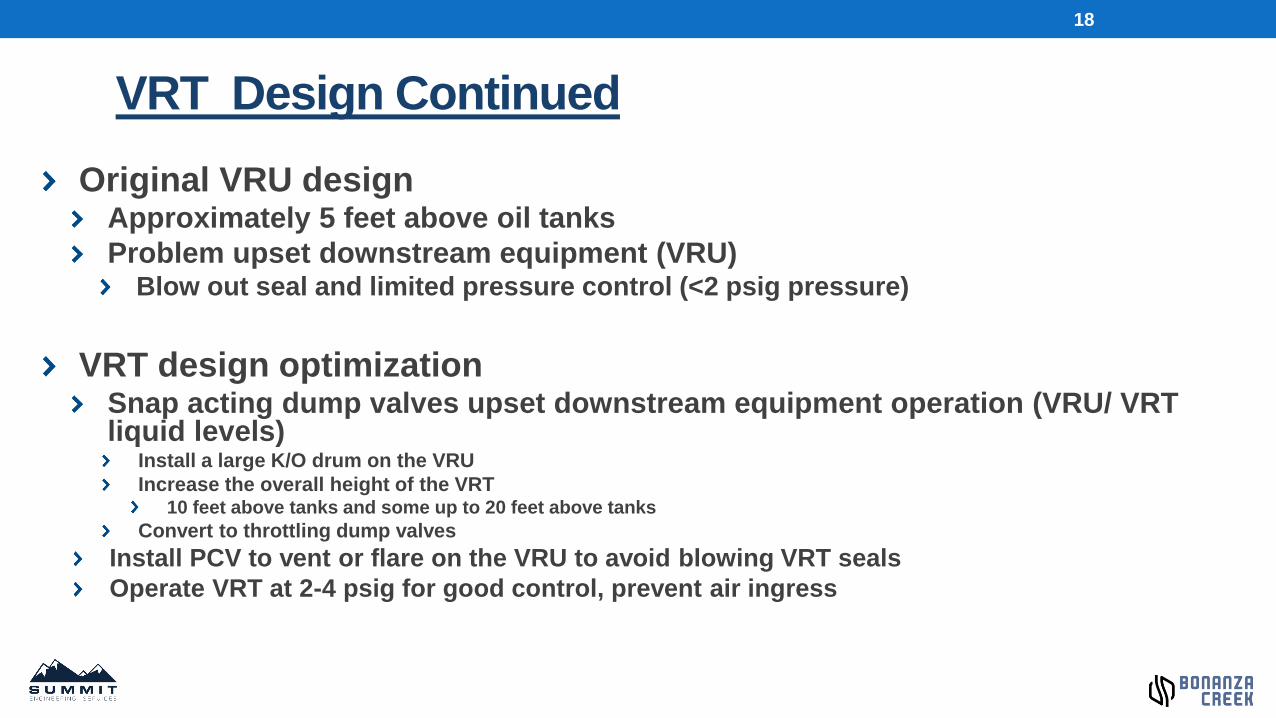
Increase the overall height of the VRT10 feet above tanks and some up to 20 feet above tanks
Convert to throttling dump valves
Install PCV to vent or flare on the VRU to avoid blowing VRT seals
Operate VRT at 2-4 psig for good control, prevent air ingress
18
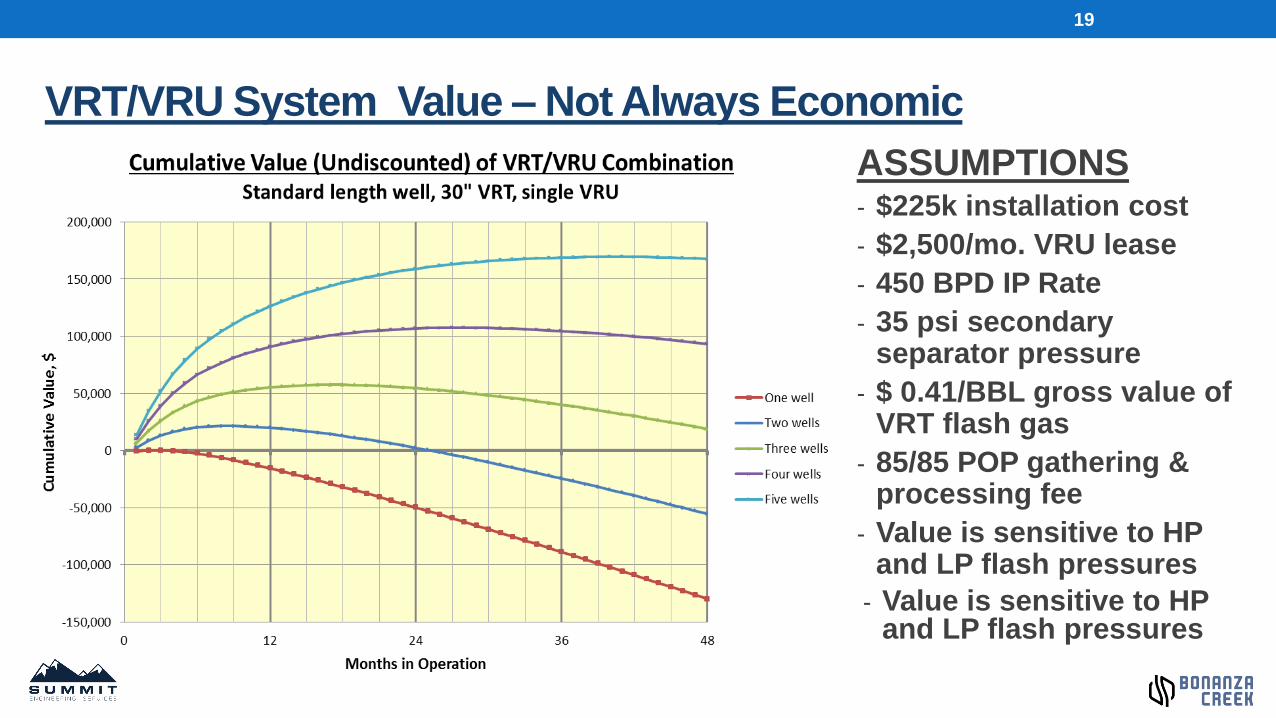
VRT/VRU System Value – Not Always Economic
ASSUMPTIONS- $225k installation cost
- $2,500/mo. VRU lease
- 450 BPD IP Rate
- 35 psi secondary separator pressure
- $ 0.41/BBL gross value of VRT flash gas
- 85/85 POP gathering & processing fee
- Value is sensitive to HP and LP flash pressures
19
- Value is sensitive to HP and LP flash pressures
Tips on Shale Oil Gas Handling Facility Design
Heavy gas condenses, can build large recycleMaintain higher temps from VRU coolers with temperature controller
Use HPS gas for compressor recycle; helps clear out heavy gas
Air ingress can bust oxygen specificationUse HPS gas for VRU recycle, keep VRU running (no on/off operation)
NEVER use VRU’s to pull vapors from storage tanks
20
Tips on Shale Oil Gas Handling Facility Design
(continued)
ECD capacity VRT/VRU’s capture 90-95% of flash gas
ECD’s sized to handle low volume, also full VRU/VRT volume when VRU down
Design for flexibility Peak vs decline operation
Strategic drilling (offset) to optimize facility sizing and cost
21
Closing & Questions
Overall there are many opportunities available to better design and operate gas handling equipment.
During this low-price oil environment, it is critical to use this time and available resources to minimize the capital cost of these production facilities and improve the economics of the well.