88
Design of Goods and Services
Design of Goods and Services
OM (Fall 2016)
2
Outline
► Global Company Profile: Regal Marine
► Goods and Services Selection► Generating New Products► Product Development► Issues for Product Design► Product Development Continuum

OM (Fall 2016)
3
Outline - Continued
► Defining a Product► Documents for Production► Service Design► Application of Decision Trees to
Product Design► Transition to Production

OM (Fall 2016)
4
► Global market► 3-dimensional CAD system
► Reduced product development time► Reduced problems with tooling► Reduced problems in production
► Assembly line production► JIT
Regal Marine
OM (Fall 2016)
5
Learning Objectives
5.1 Define product life cycle5.2 Describe a product development system5.3 Build a house of quality5.4 Explain how time-based competition is
implemented by OM
When you complete this chapter you should be able to :
OM (Fall 2016)
6
Learning Objectives
5.5 Describe how goods and services are defined by OM
5.6 Describe the documents needed for production
5.7 Explain how the customer participates in the design and delivery of services
5.8 Apply decision trees to product issues
When you complete this chapter you should be able to :
OM (Fall 2016)
7
► Organizations exist to provide goods or services to society
► Great products are the key to success► Top organizations typically focus on core
products► Customers buy satisfaction, not just a
physical good or particular service► Fundamental to an organization's
strategy with implications throughout the operations function
Goods and Services Selection

OM (Fall 2016)
8
► Limited and predicable life cycles requires constantly looking for, designing, and developing new products
► Utilize strong communication among customer, product, processes, and suppliers
► New products generate substantial revenue
Goods and Services Selection
OM (Fall 2016)
9
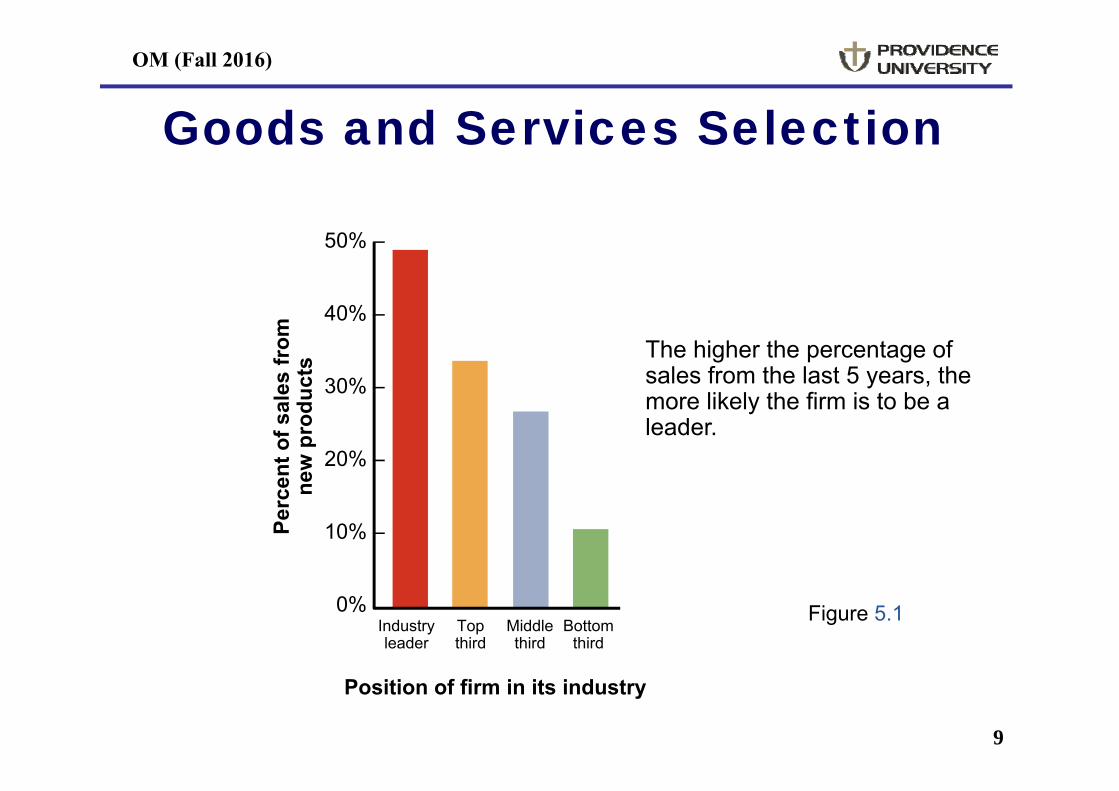
Goods and Services Selection
Figure 5.1
The higher the percentage of sales from the last 5 years, the more likely the firm is to be a leader.
50% –
40% –
30% –
20% –
10% –
0% –Industry leader
Top third
Middle third
Bottom third
Position of firm in its industry
Perc
ent o
f sal
es fr
om
new
pro
duct
s
OM (Fall 2016)
10
The objective of the product decision is to develop and implement a
product strategy that meets the demands of the marketplace with a
competitive advantage
Product Decision

OM (Fall 2016)
11
Product Strategy Options
► Differentiation► Shouldice Hospital
► Low cost► Taco Bell
► Rapid response► Toyota

OM (Fall 2016)
12
Product Life Cycles
► May be any length from a few days to decades
► The operations function must be able to introduce new products successfully

OM (Fall 2016)
13
Product Life Cycle
Cost of development and productionSales revenue
ProfitLossLoss
Figure 5.2
Introduction Growth Maturity Decline
$

OM (Fall 2016)
14
Life Cycle and Strategy
Introductory Phase► Fine tuning may warrant
unusual expenses for1) Research2) Product development3) Process modification and
enhancement4) Supplier development
OM (Fall 2016)
15
Product Life Cycle
Growth Phase
► Product design begins to stabilize
► Effective forecasting of capacity becomes necessary
► Adding or enhancing capacity may be necessary
OM (Fall 2016)
16
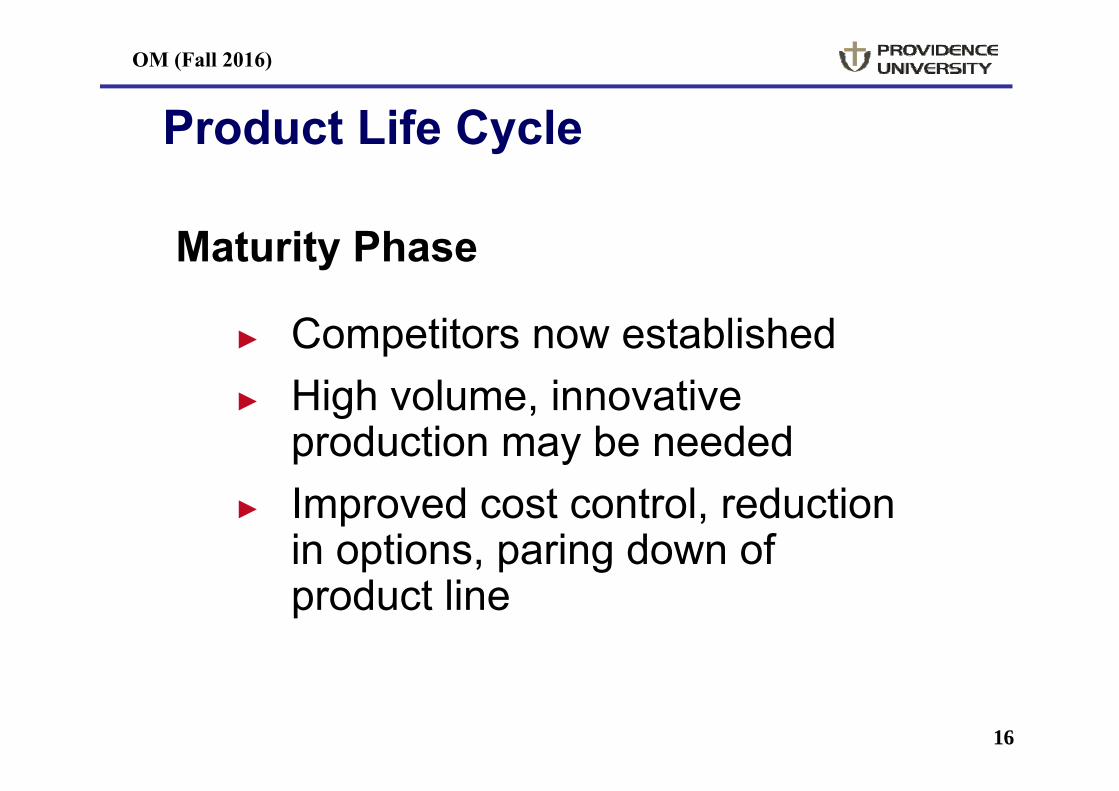
Product Life Cycle
Maturity Phase
► Competitors now established► High volume, innovative
production may be needed► Improved cost control, reduction
in options, paring down of product line
OM (Fall 2016)
17
Product Life Cycle
Decline Phase
► Unless product makes a special contribution to the organization, must plan to terminate offering

OM (Fall 2016)
18
Product Life Cycle Costs
Costs incurred
Costs committed
Ease of change
Concept Detailed Manufacturing Distribution,design design service,
prototype and disposal
Perc
ent o
f tot
al c
ost
100 –
80 –
60 –
40 –
20 –
0 –

OM (Fall 2016)
19
Product-by-Value Analysis
► Lists products in descending order of their individual dollar contribution to the firm
► Lists the total annual dollar contribution of the product
► Helps management evaluate alternative strategies

OM (Fall 2016)
20
Generating New Products
1. Understanding the customer2. Economic change3. Sociological and demographic
change4. Technological change5. Political and legal change6. Market practice, professional
standards, suppliers, distributors
OM (Fall 2016)
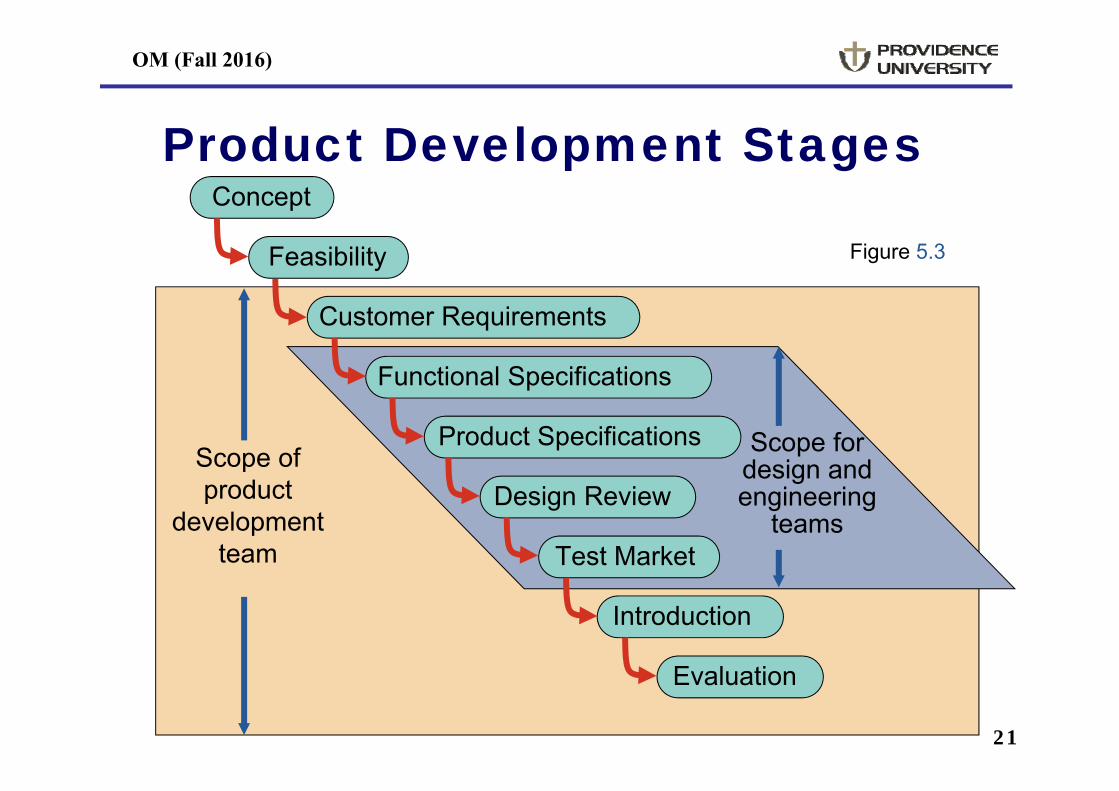
21
Product Development Stages
Scope of product
development team
Scope for design and engineering
teams
Evaluation
Introduction
Test Market
Functional Specifications
Design Review
Product Specifications
Customer Requirements
Feasibility
Concept
Figure 5.3

OM (Fall 2016)
22
Quality Function Deployment
► Quality function deployment (QFD)► Determine what will satisfy the customer► Translate those customer desires into the
target design► House of quality
► Utilize a planning matrix to relate customer wants to how the firm is going to meet those wants

OM (Fall 2016)
23
Quality Function Deployment
1. Identify customer wants2. Identify how the good/service will satisfy customer
wants3. Relate customer wants to product hows4. Identify relationships between the firm’s hows5. Develop our importance ratings6. Evaluate competing products7. Compare performance to desirable technical
attributes
OM (Fall 2016)
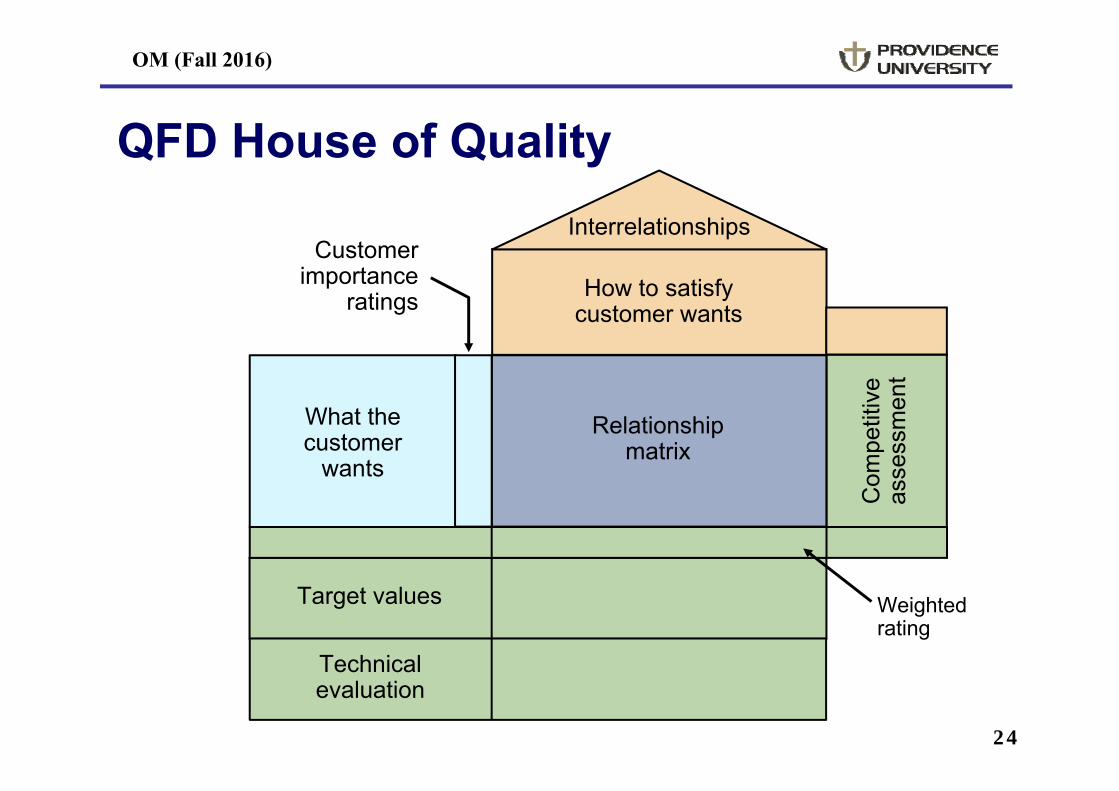
24
QFD House of Quality
Relationshipmatrix
How to satisfycustomer wants
Interrelationships
Com
petit
ive
asse
ssm
ent
Technicalevaluation
Target values
What the customer
wants
Customer importance
ratings
Weighted rating
OM (Fall 2016)
25
House of Quality Example
Your team has been charged with designing a new camera for Great Cameras, Inc.The first action is to construct a House of Quality

OM (Fall 2016)
26
House of Quality Example
Customerimportance
rating(5 = highest)
Lightweight 3
Easy to use 4
Reliable 5
Easy to hold steady 2
High resolution 1
What the customer wants
What the Customer
WantsRelationship
Matrix
TechnicalAttributes and
Evaluation
How to SatisfyCustomer Wants
Interrelationships
Anal
ysis
of
Com
petit
ors
OM (Fall 2016)
27
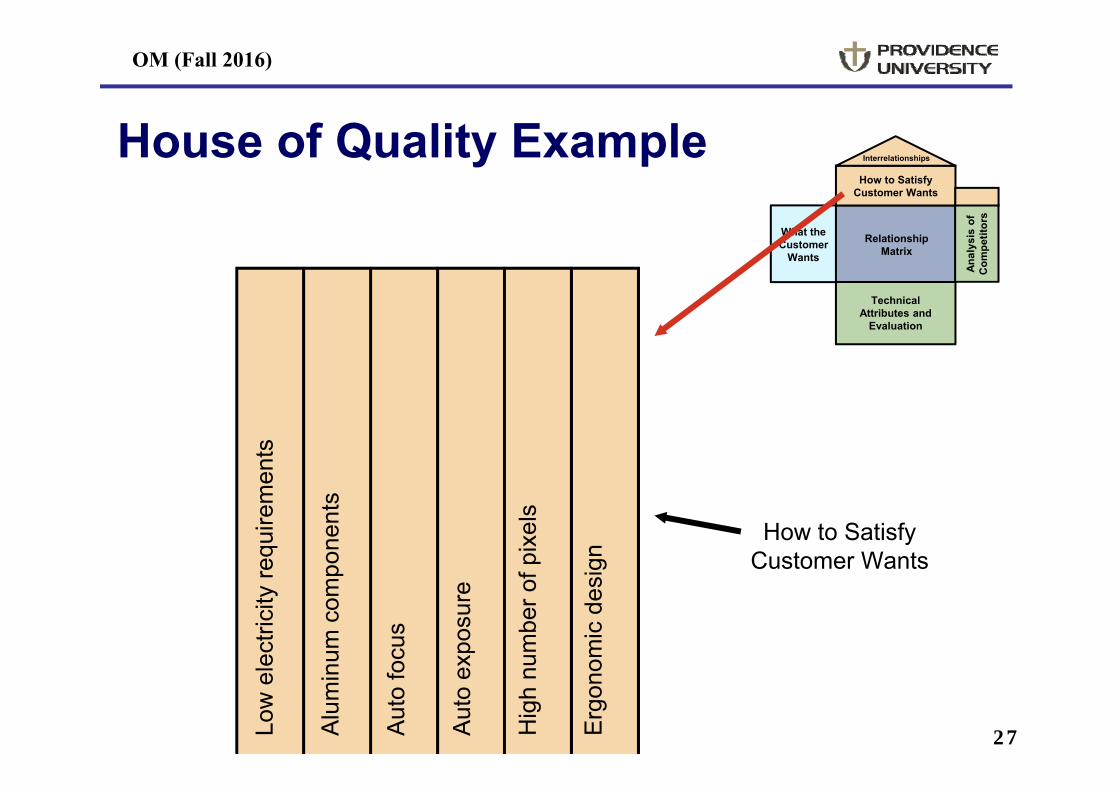
House of Quality ExampleWhat the Customer
WantsRelationship
Matrix
TechnicalAttributes and
Evaluation
How to SatisfyCustomer Wants
Interrelationships
Anal
ysis
of
Com
petit
ors
Low
ele
ctric
ity re
quire
men
ts
Alum
inum
com
pone
nts
Auto
focu
s
Auto
exp
osur
e
Hig
h nu
mbe
r of p
ixel
s
Ergo
nom
ic d
esig
n
How to SatisfyCustomer Wants

OM (Fall 2016)
28
House of Quality Example
Lightweight 3
Easy to use 4
Reliable 5
Easy to hold steady 2
High resolution 1
What the Customer
WantsRelationship
Matrix
TechnicalAttributes and
Evaluation
How to SatisfyCustomer Wants
Interrelationships
Anal
ysis
of
Com
petit
ors
High relationship
Medium relationship
Low relationship
Relationship matrix

OM (Fall 2016)
29
House of Quality Example
Low
ele
ctric
ity re
quire
men
ts
Alum
inum
com
pone
nts
Auto
focu
s
Auto
exp
osur
e
Hig
h nu
mbe
r of p
ixel
s
Ergo
nom
ic d
esig
n
Relationships between the things we can do
What the Customer
WantsRelationship
Matrix
TechnicalAttributes and
Evaluation
How to SatisfyCustomer Wants
Interrelationships
Anal
ysis
of
Com
petit
ors

OM (Fall 2016)
30
House of Quality Example
Weighted rating
Lightweight 3
Easy to use 4
Reliable 5
Easy to hold steady 2
High resolution 1
Our importance ratings 22 9 27 27 32 25
What the Customer
WantsRelationship
Matrix
TechnicalAttributes and
Evaluation
How to SatisfyCustomer Wants
Interrelationships
Anal
ysis
of
Com
petit
ors

OM (Fall 2016)
31
House of Quality Example
Com
pany
A
Com
pany
B
G P
G P
F G
G P
P P
Lightweight 3
Easy to use 4
Reliable 5
Easy to hold steady 2
High resolution 1
Our importance ratings 22 5
How well do competing products meet customer wants
What the Customer
WantsRelationship
Matrix
TechnicalAttributes and
Evaluation
How to SatisfyCustomer Wants
Interrelationships
Anal
ysis
of
Com
petit
ors
OM (Fall 2016)
32
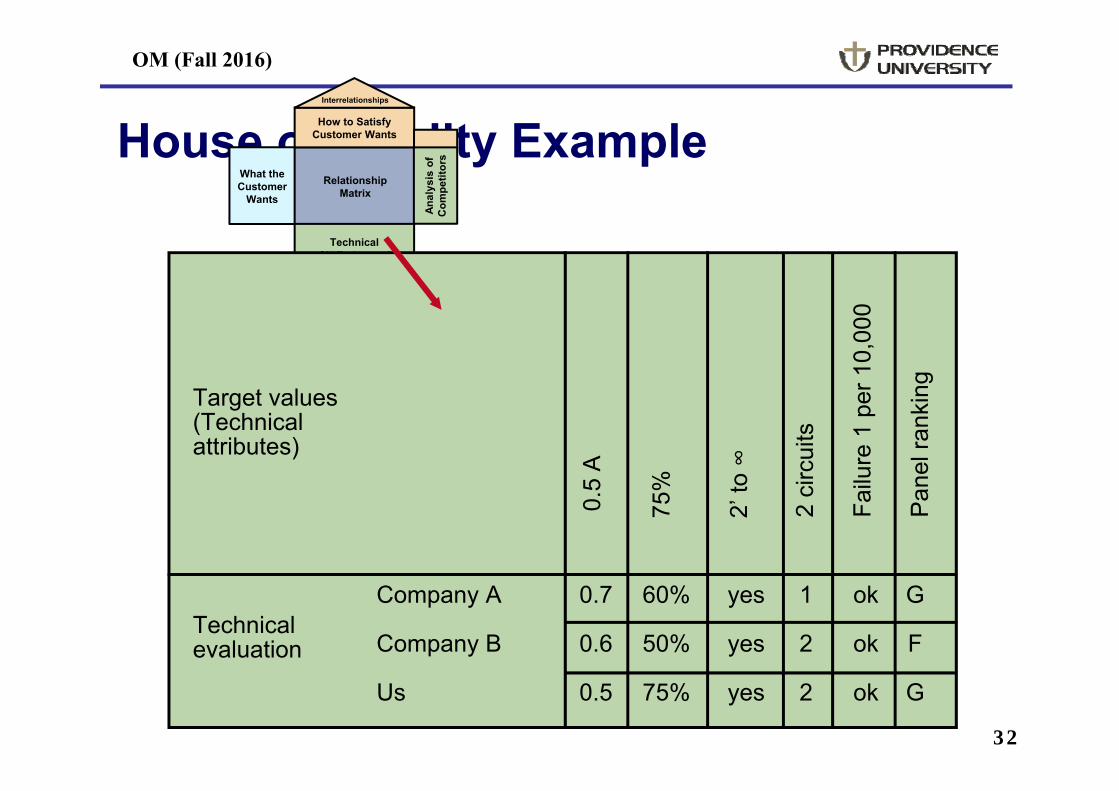
House of Quality ExampleWhat the Customer
WantsRelationship
Matrix
TechnicalAttributes and
Evaluation
How to SatisfyCustomer Wants
Interrelationships
Anal
ysis
of
Com
petit
ors
Target values(Technical attributes)
Technical evaluation
Company A 0.7 60% yes 1 ok G
Company B 0.6 50% yes 2 ok F
Us 0.5 75% yes 2 ok G
2 ci
rcui
ts
Failu
re 1
per
10,
000
Pane
l ran
king
0.5
A
75%
2’ to
∞
OM (Fall 2016)
33
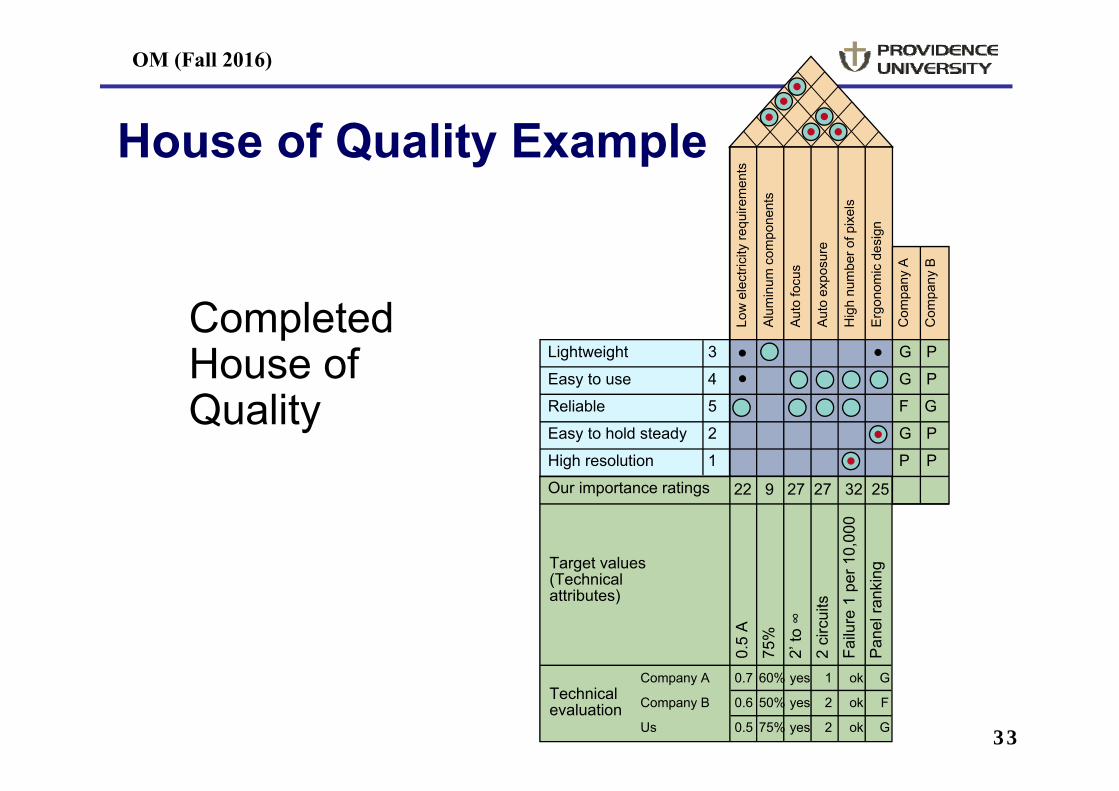
House of Quality Example
Completed House of Quality
Low
ele
ctric
ity re
quire
men
ts
Alum
inum
com
pone
nts
Auto
focu
s
Auto
exp
osur
e
Hig
h nu
mbe
r of p
ixel
s
Ergo
nom
ic d
esig
n
Com
pany
A
Com
pany
B
Lightweight 3Easy to use 4Reliable 5Easy to hold steady 2High resolution 1Our importance ratings
G PG PF GG PP P
Target values(Technical attributes)
Technical evaluation
Company A 0.7 60% yes 1 ok G
Company B 0.6 50% yes 2 ok F
Us 0.5 75% yes 2 ok G0.
5 A
75%
2’ to
∞2
circ
uits
Failu
re 1
per
10,
000
Pane
l ran
king
22 9 27 27 32 25

OM (Fall 2016)
34
House of Quality Sequence
Figure 5.4
Deploying resources through the organization in response to customer requirements
Prod
uctio
n pr
oces
s
Quality plan
House 4
Spec
ific
com
pone
nts
Production process
House 3
Des
ign
char
acte
ristic
s
Specific components
House 2
Cus
tom
er
requ
irem
ents
Design characteristics
House 1

OM (Fall 2016)
35
Organizing for Product Development
► Traditionally – distinct departments► Duties and responsibilities are defined► Difficult to foster forward thinking
► A Champion► Product manager drives the product
through the product development system and related organizations

OM (Fall 2016)
36
Organizing for Product Development► Team approach
► Cross functional – representatives from all disciplines or functions
► Product development teams, design for manufacturability teams, value engineering teams
► Japanese “whole organization” approach
► No organizational divisions
OM (Fall 2016)
37
Organizing for Product Development► Product development teams
► Market requirements to product success► Cross functional teams often involving
vendors► Open, highly participative environment
► Concurrent engineering► Simultaneous performance of product
development stages

OM (Fall 2016)
38
Manufacturability andValue Engineering
► Benefits:1. Reduced complexity of the product2. Reduction of environmental impact3. Additional standardization of components4. Improvement of functional aspects of the product5. Improved job design and job safety6. Improved maintainability (serviceability) of the
product7. Robust design

OM (Fall 2016)
39
Cost Reduction of a Bracket via Value Engineering
Figure 5.5
OM (Fall 2016)
40
Issues for Product Design
► Robust design► Modular design► Computer-aided design (CAD)► Computer-aided manufacturing (CAM)► Virtual reality technology► Value analysis► Sustainability and Life Cycle Assessment
(LCA)

OM (Fall 2016)
41
Robust Design
► Product is designed so that small variations in production or assembly do not adversely affect the product
► Typically results in lower cost and higher quality

OM (Fall 2016)
42
Modular Design
► Products designed in easily segmented components
► Adds flexibility to both production and marketing
► Improved ability to satisfy customer requirements
OM (Fall 2016)
43
► Using computers to design products and prepare engineering documentation
► Shorter development cycles, improved accuracy, lower cost
► Information and designs can be deployed worldwide
Computer Aided Design (CAD)
OM (Fall 2016)
44
► 3-D Object Modeling► Small prototype development
► Design for Manufacturing and Assembly (DFMA)
► Solve manufacturing problems during the design stage
► CAD through the internet► International data exchange through STEP► 3-D printing
Extensions of CAD
OM (Fall 2016)
45
Computer-Aided Manufacturing (CAM)
► Utilizing specialized computers and program to control manufacturing equipment
► Often driven by the CAD system (CAD/CAM)
OM (Fall 2016)
46
1. Product quality2. Shorter design time3. Production cost reductions4. Database availability5. New range of capabilities
Benefits of CAD/CAM
OM (Fall 2016)
47
Virtual Reality Technology
► Computer technology used to develop an interactive, 3-D model of a product from the basic CAD data
► Allows people to ‘see’ the finished design before a physical model is built
► Very effective in large-scale designs such as plant layout

OM (Fall 2016)
48
Value Analysis
► Focuses on design improvement during production
► Seeks improvements leading either to a better product or a product which can be produced more economically with less environmental impact

OM (Fall 2016)
49
Sustainability and Life Cycle Assessment (LCA)
► Sustainability means meeting the needs of the present without compromising the ability of future generations to meet their needs
► LCA is a formal evaluation of the environmental impact of a product

OM (Fall 2016)
50
Product Development Continuum
► Product life cycles are becoming shorter and the rate of technological change is increasing
► Developing new products faster can result in a competitive advantage
► Time-based competition

OM (Fall 2016)
51
Product Development Continuum
Internal Cost of product development SharedLengthy Speed of product development Rapid and/
or ExistingHigh Risk of product development Shared
External Development StrategiesAlliances
Joint venturesPurchase technology or expertiseby acquiring the developer
Internal Development StrategiesMigrations of existing products
Enhancements to existing productsNew internally developed products
Figure 5.6
OM (Fall 2016)
52
Product Development Continuum
► Purchasing technology by acquiring a firm
► Speeds development► Issues concern the fit between the
acquired organization and product and the host
► Joint Ventures► Both organizations learn► Risks are shared
OM (Fall 2016)
53
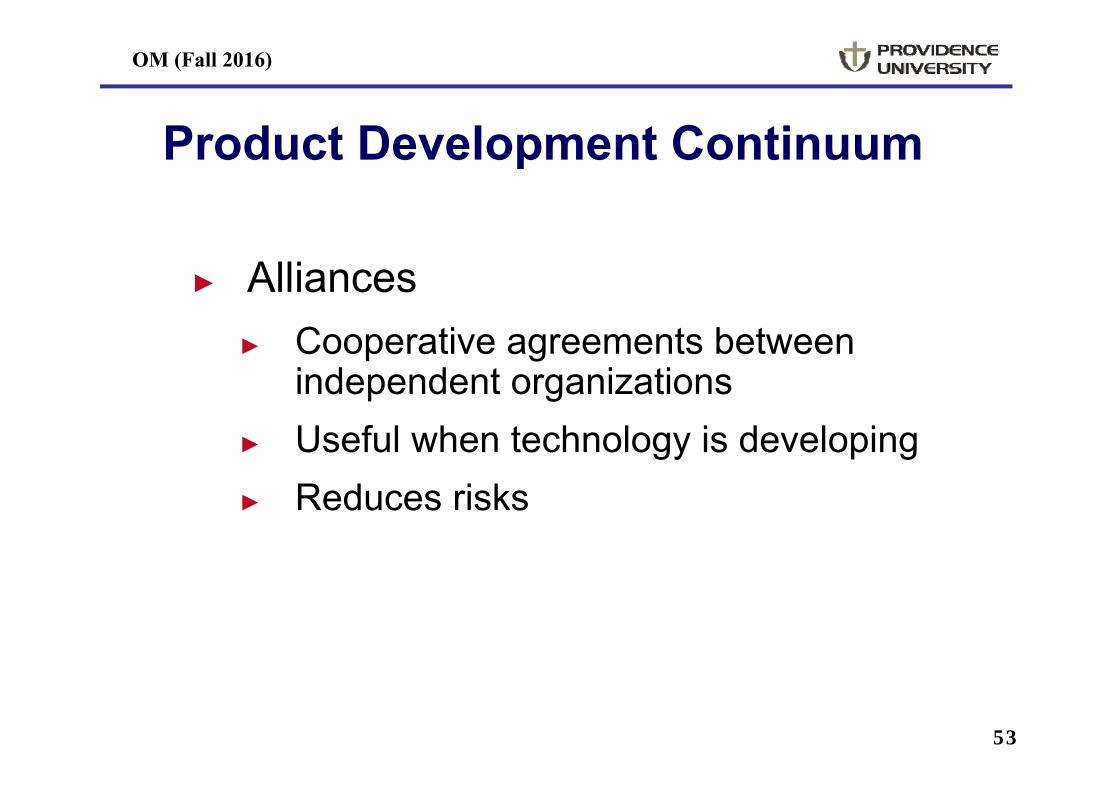
Product Development Continuum
► Alliances► Cooperative agreements between
independent organizations► Useful when technology is developing► Reduces risks
OM (Fall 2016)
54
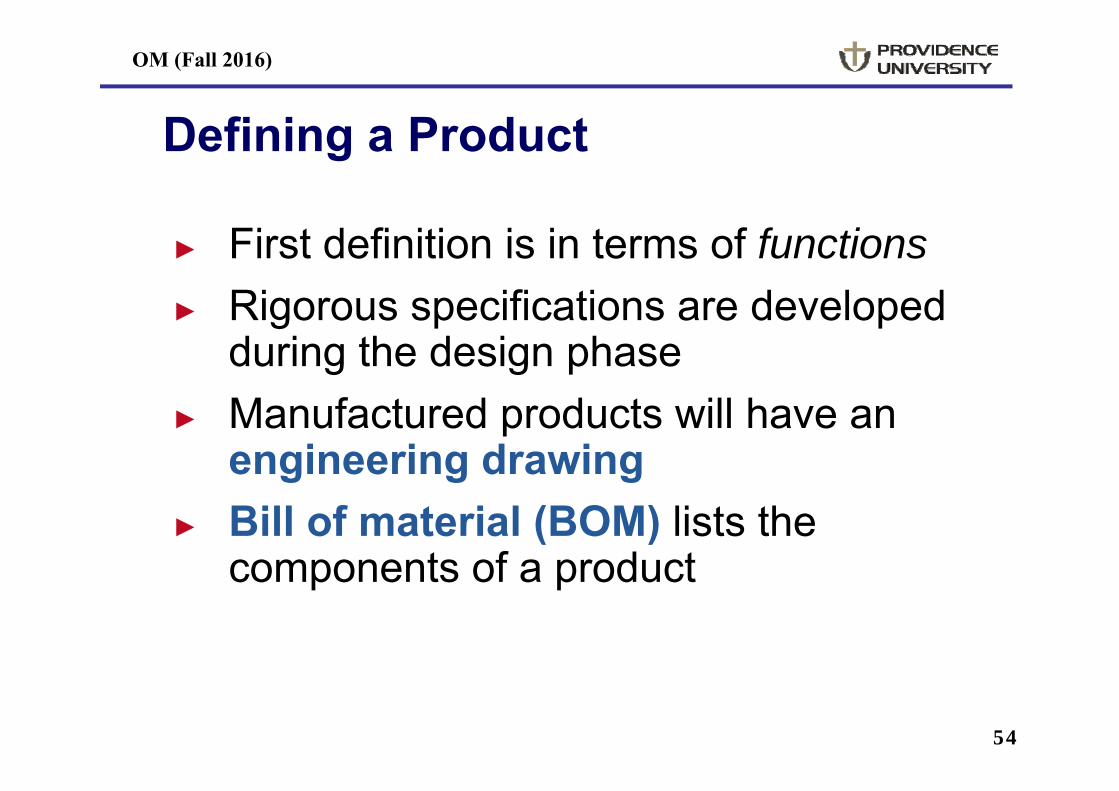
Defining a Product
► First definition is in terms of functions► Rigorous specifications are developed
during the design phase► Manufactured products will have an
engineering drawing► Bill of material (BOM) lists the
components of a product

OM (Fall 2016)
55
Monterey Jack Cheese(a) U.S. grade AA. Monterey cheese shall conform to the following
requirements:(1) Flavor. Is fine and highly pleasing, free from undesirable flavors and odors.
May possess a very slight acid or feed flavor.(2) Body and texture. A plug drawn from the cheese shall be reasonably firm.
It shall have numerous small mechanical openings evenly distributed throughout the plug. It shall not possess sweet holes, yeast holes, or other gas holes.
(3) Color. Shall have a natural, uniform, bright and attractive appearance.(4) Finish and appearance—bandaged and
paraffin-dipped. The rind shall be sound, firm, and smooth providing a good protection to the cheese.
Code of Federal Regulation, Parts 53 to 109, General Service Administration
OM (Fall 2016)
56
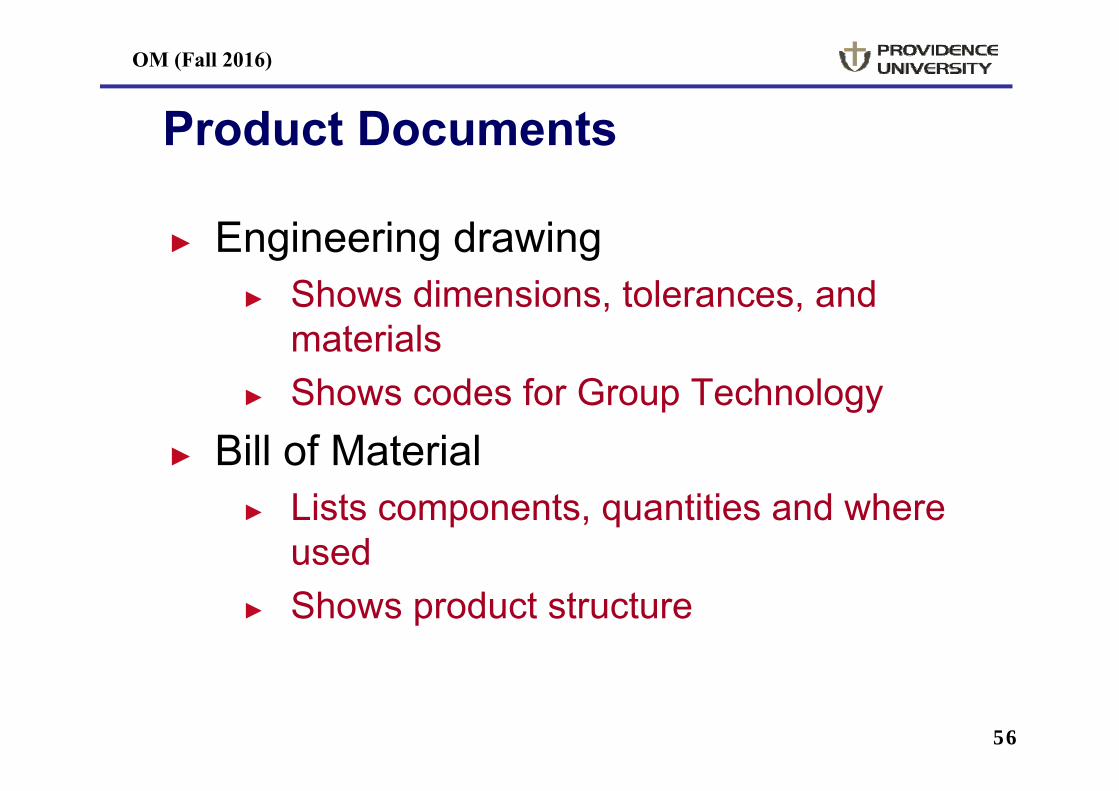
► Engineering drawing► Shows dimensions, tolerances, and
materials► Shows codes for Group Technology
► Bill of Material ► Lists components, quantities and where
used► Shows product structure
Product Documents
OM (Fall 2016)
57
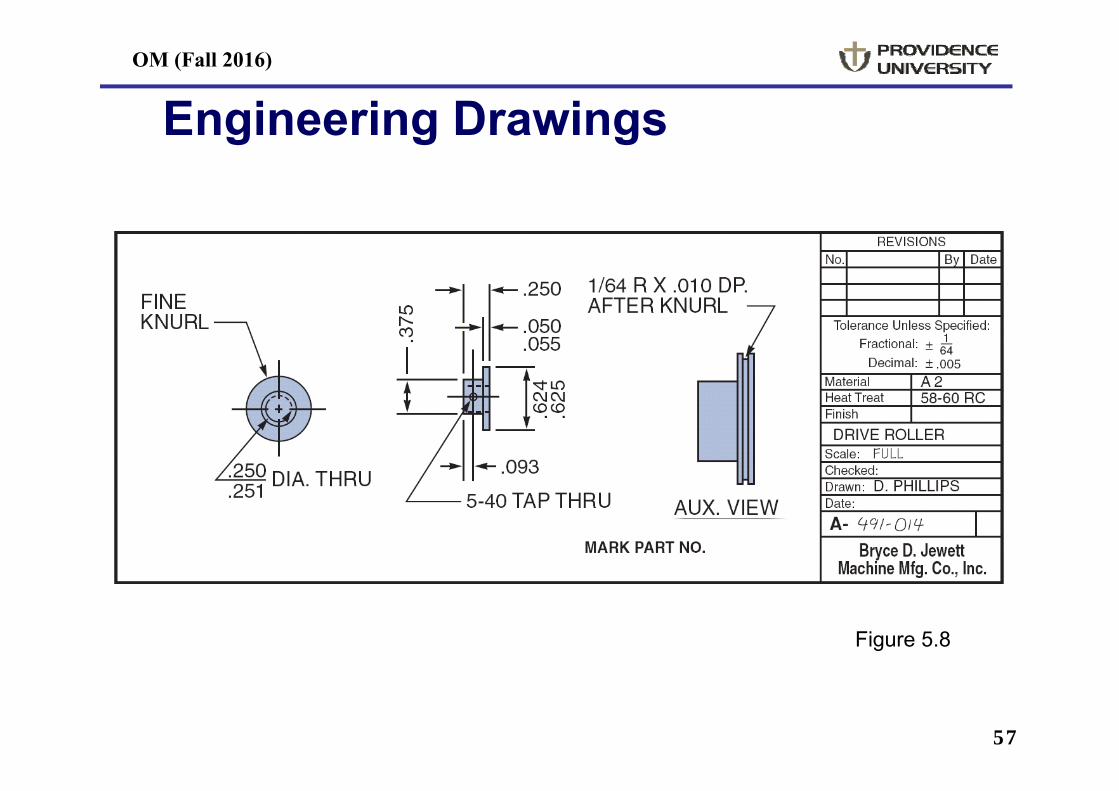
Engineering Drawings
Figure 5.8

OM (Fall 2016)
58
Bills of MaterialBOM for a Panel Weldment
NUMBER DESCRIPTION QTY
A 60-71 PANEL WELDM’T 1
A 60-7 LOWER ROLLER ASSM. 1R 60-17 ROLLER 1R 60-428 PIN 1P 60-2 LOCKNUT 1
A 60-72 GUIDE ASSM. REAR 1R 60-57-1 SUPPORT ANGLE 1A 60-4 ROLLER ASSM. 102-50-1150 BOLT 1
A 60-73 GUIDE ASSM. FRONT 1A 60-74 SUPPORT WELDM’T 1R 60-99 WEAR PLATE 102-50-1150 BOLT 1 Figure 5.9 (a)

OM (Fall 2016)
59
Bills of MaterialHard Rock Cafe’s Hickory BBQ Bacon Cheeseburger
DESCRIPTION QTY
Bun 1Hamburger patty 8 oz.Cheddar cheese 2 slicesBacon 2 stripsBBQ onions 1/2 cupHickory BBQ sauce 1 oz.Burger set
Lettuce 1 leafTomato 1 sliceRed onion 4 ringsPickle 1 slice
French fries 5 oz.Seasoned salt 1 tsp.11-inch plate 1HRC flag 1
Figure 5.9 (b)

OM (Fall 2016)
60
Make-or-Buy Decisions
• Produce components themselves or buy from an outside source
• Variations in– Quality– Cost– Delivery schedules
• Critical to product definition
OM (Fall 2016)
61
► Parts grouped into families with similar characteristics
► Coding system describes processing and physical characteristics
► Part families can be produced in dedicated manufacturing cells
Group Technology
OM (Fall 2016)
62
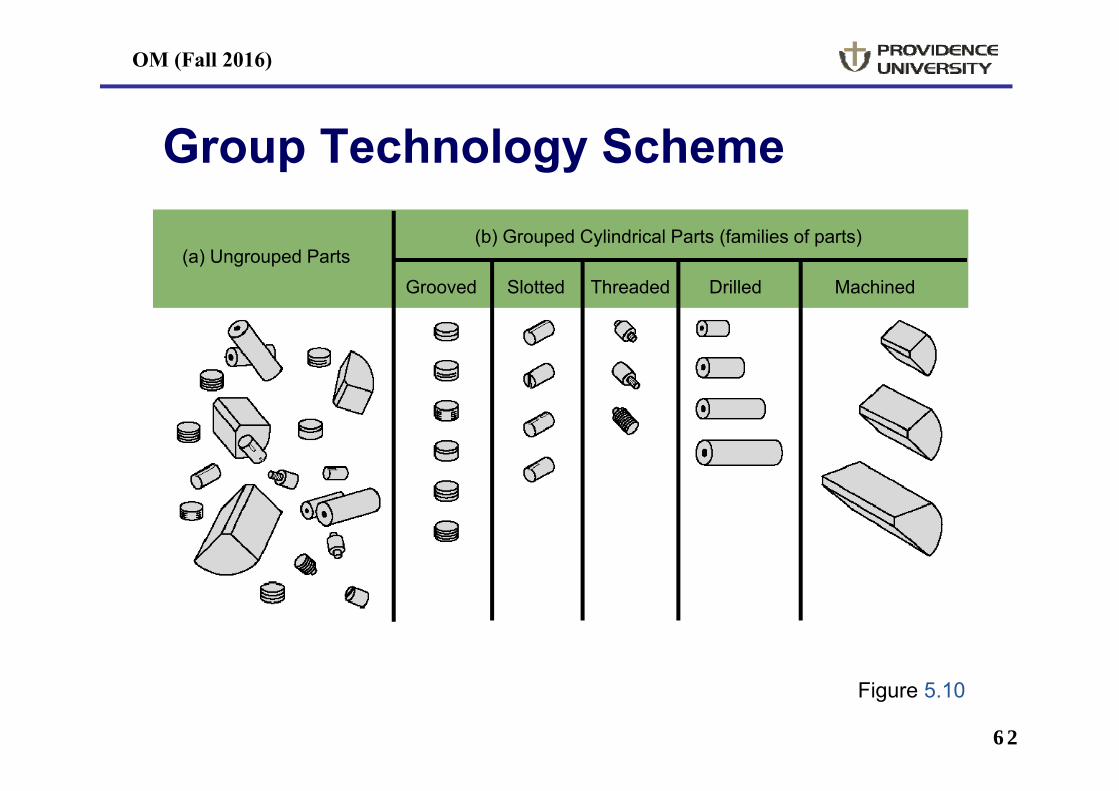
Group Technology Scheme
Figure 5.10
(a) Ungrouped Parts(b) Grouped Cylindrical Parts (families of parts)
Grooved Slotted Threaded Drilled Machined

OM (Fall 2016)
63
1. Improved design2. Reduced raw material and purchases3. Simplified production planning and
control4. Improved layout, routing, and machine
loading5. Reduced tooling setup time, work-in-
process, and production time
Group Technology Benefits

OM (Fall 2016)
64
Documents for Production
► Assembly drawing► Assembly chart► Route sheet► Work order► Engineering change notices (ECNs)
OM (Fall 2016)
65
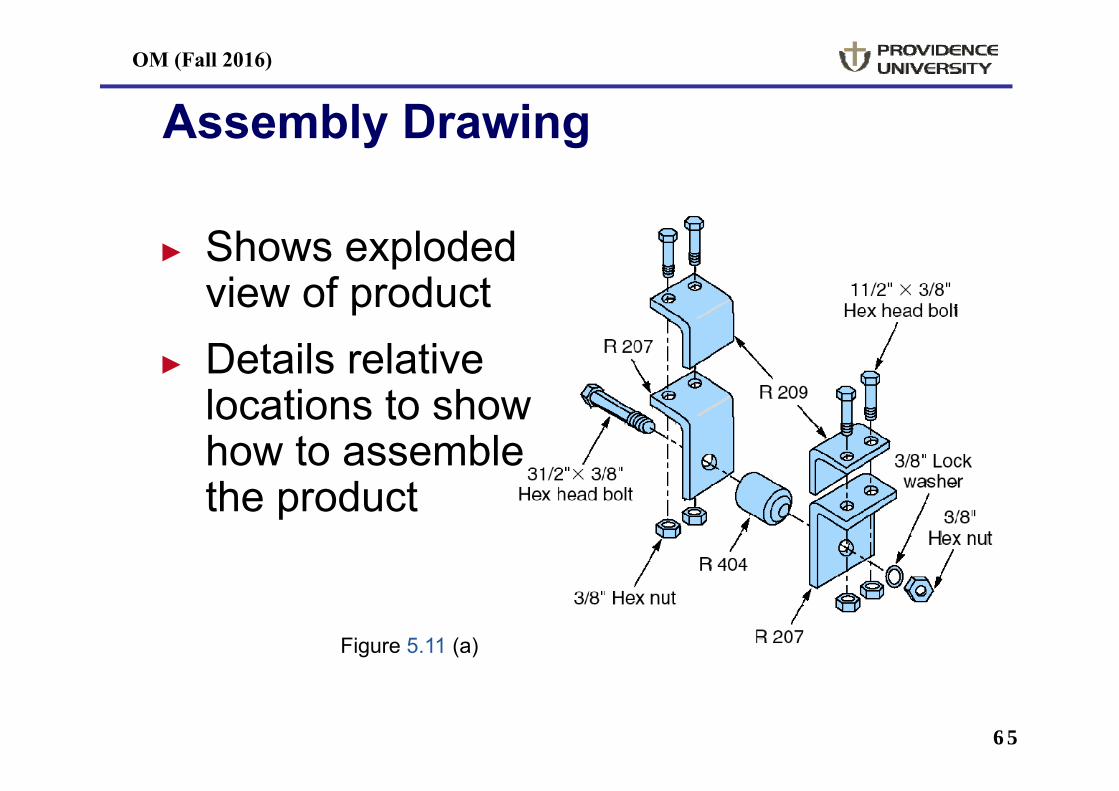
Assembly Drawing
► Shows exploded view of product
► Details relative locations to show how to assemble the product
Figure 5.11 (a)

OM (Fall 2016)
66
Assembly Chart1
2
3
4
5
6
7
8
9
10
11
R 209 Angle
R 207 Angle
Bolts w/nuts (2)
R 209 Angle
R 207 Angle
Bolt w/nut
R 404 Roller
Lock washer
Part number tag
Box w/packing material
Bolts w/nuts (2)
SA1
SA2
A1
A2
A3
A4
A5
Leftbracket
assembly
Rightbracket
assembly
Poka-yoke inspection
Figure 5.11 (b)
Identifies the point of production where components flow into subassemblies and ultimately into the final product

OM (Fall 2016)
67
Route SheetLists the operations and times required to produce a component
Setup OperationProcess Machine Operations Time Time/Unit
1 Auto Insert 2 Insert Component 1.5 .4Set 56
2 Manual Insert Component .5 2.3Insert 1 Set 12C
3 Wave Solder Solder all 1.5 4.1components to board
4 Test 4 Circuit integrity .25 .5test 4GY

OM (Fall 2016)
68
Work Order
Instructions to produce a given quantity of a particular item, usually to a schedule
Work Order
Item Quantity Start Date Due Date
Production DeliveryDept Location
157C 125 5/2/16 5/4/16
F32 Dept K11
OM (Fall 2016)
69
Engineering Change Notice (ECN)
► A correction or modification to a product’s definition or documentation
► Engineering drawings► Bill of material
Quite common with long product life cycles, long manufacturing lead times, or rapidly
changing technologies
OM (Fall 2016)
70
Configuration Management
► The need to manage ECNs has led to the development of configuration management systems
► A product’s planned and changing components are accurately identified
► Control and accountability for change are identified and maintained
OM (Fall 2016)
71
Product Life-Cycle Management (PLM)► Integrated software that brings together
most, if not all, elements of product design and manufacture
► Product design► CAD/CAM► DFMA► Product routing► Materials
► Layout► Assembly► Maintenance► Environmental

OM (Fall 2016)
72
Service Design
► Service typically includes direct interaction with the customer
► Process – chain – network (PCN) analysis focuses on the ways in which processes can be designed to optimize interaction between firms and their customers
OM (Fall 2016)
73
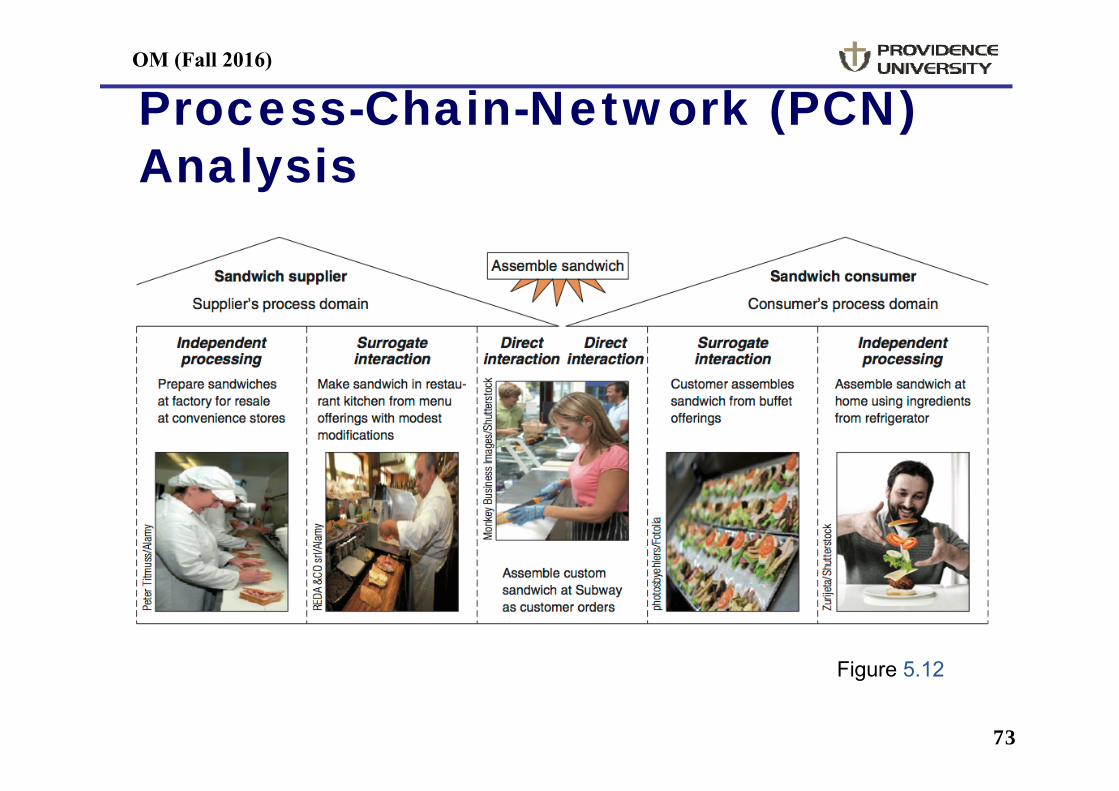
Process-Chain-Network (PCN) Analysis
Figure 5.12

OM (Fall 2016)
74
Process-Chain-Network (PCN) Analysis
1. Direct interaction region includes process steps that involve interaction between participants
2. The surrogate (substitute) interaction region includes process steps in which one participant is acting on another participant’s resources
3. The independent processing region includes steps in which the supplier and/or the customer is acting on resources where each has maximum control

OM (Fall 2016)
75
Process-Chain-Network (PCN) Analysis
▶ All three regions have similar operating issues but the appropriate way of handling the issues differs across regions – service operations exist only within the area of direct and surrogate interaction
▶ PCN analysis provides insight to aid in positioning and designing processes that can achieve strategic objectives
OM (Fall 2016)
76
Adding Service Efficiency
▶ Service productivity is notoriously low partially because of customer involvement in the design or deliveryof the service, or both
▶ Complicates product design

OM (Fall 2016)
77
Adding Service Efficiency
▶ Limit the options▶ Improves efficiency and ability to meet
customer expectations▶ Delay customization▶ Modularization
▶ Eases customization of a service
OM (Fall 2016)
78
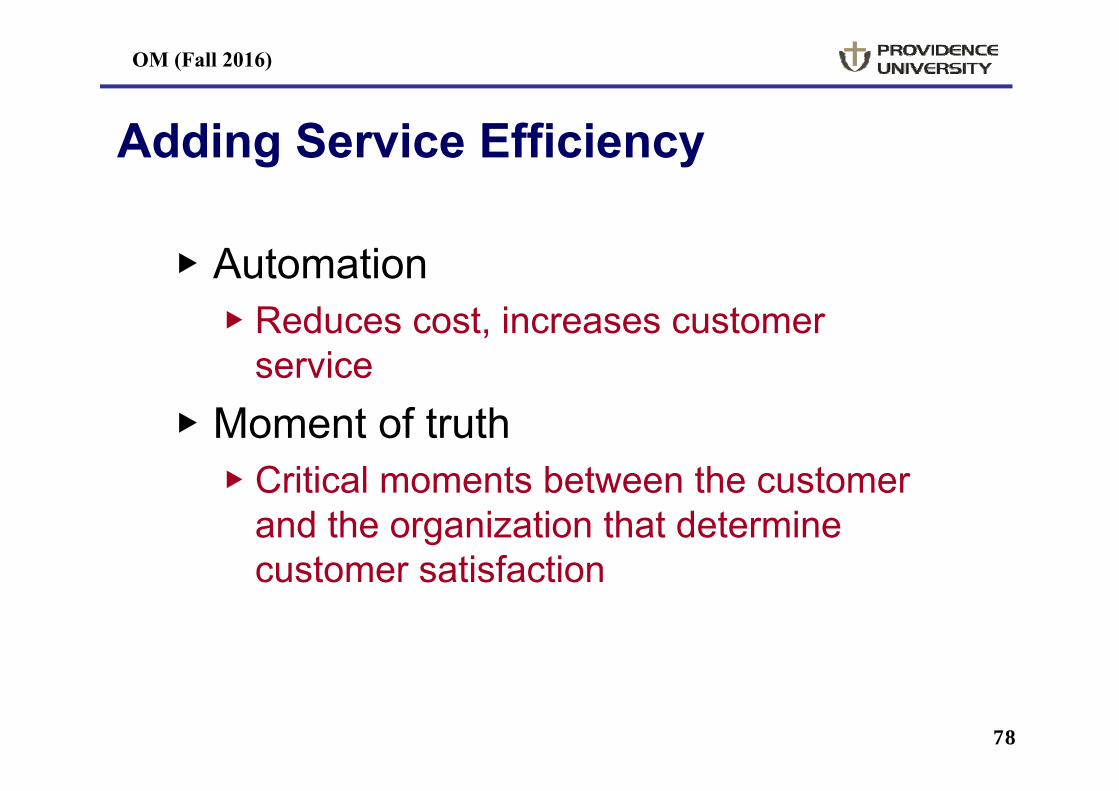
Adding Service Efficiency
▶ Automation▶ Reduces cost, increases customer
service▶ Moment of truth
▶ Critical moments between the customer and the organization that determine customer satisfaction

OM (Fall 2016)
79
Documents for Services
► High levels of customer interaction necessitates different documentation
► Often explicit job instructions ► Scripts and storyboards are other
techniques

OM (Fall 2016)
80
First Bank Corp. Drive-up Teller Service Guidelines
• Be especially discreet when talking to the customer through the microphone.
• Provide written instructions for customers who must fill out forms you provide.
• Mark lines to be completed or attach a note with instructions.• Always say “please” and “thank you” when speaking through the
microphone.• Establish eye contact with the customer if the distance allows it.• If a transaction requires that the customer park the car and come
into the lobby, apologize for the inconvenience.

OM (Fall 2016)
81
Application of Decision Trees to Product Design
► Particularly useful when there are a series of decisions and outcomes that lead to other decisions and outcomes

OM (Fall 2016)
82
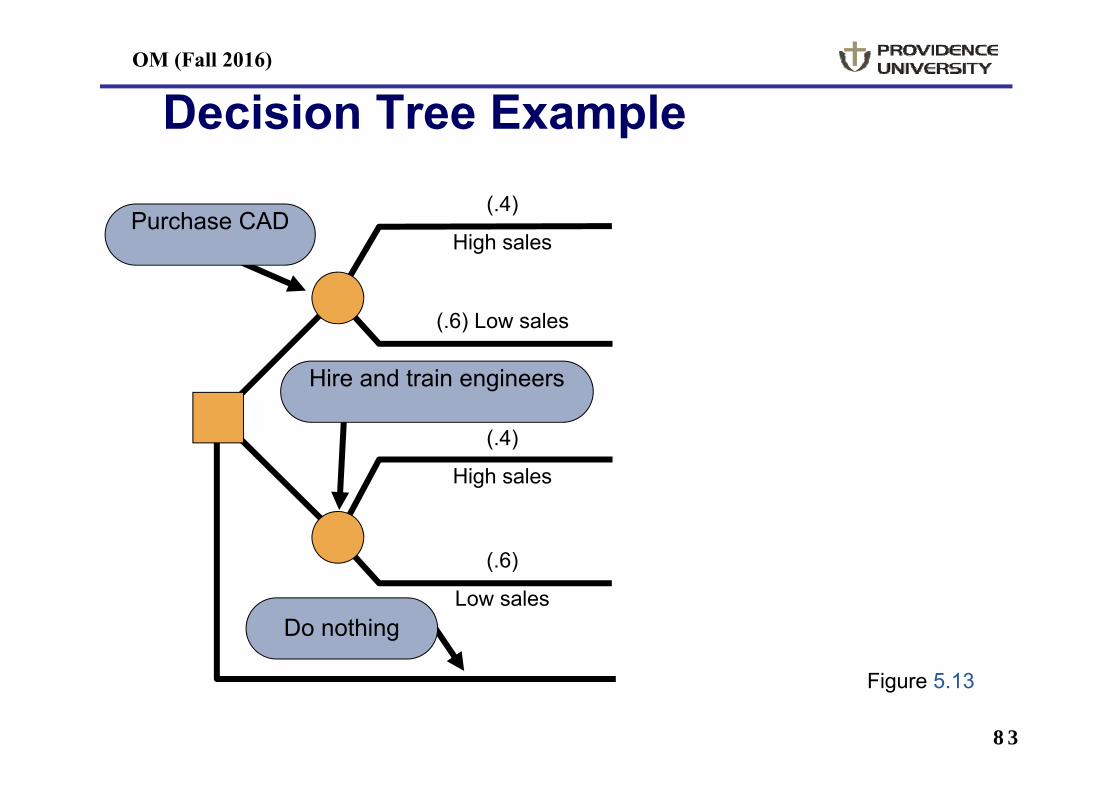
Application of Decision Trees to Product Design
1. Include all possible alternatives and states of nature – including “doing nothing”
2. Enter payoffs at end of branch3. Determine the expected value of each
branch and “prune” the tree to find the alternative with the best expected value
Procedure
OM (Fall 2016)
83
Decision Tree Example
(.6)
Low sales
(.4)
High sales
(.6) Low sales
(.4)
High salesPurchase CAD
Hire and train engineers
Do nothing
Figure 5.13

OM (Fall 2016)
84
Decision Tree Example
(.6) Low sales
(.4)
High salesPurchase CAD
(.6)
Low sales
(.4)
High sales
Hire and train engineers
Do nothing
$2,500,000 Revenue– 1,000,000 Mfg cost ($40 x 25,000)
– 500,000 CAD cost$1,000,000 Net
$800,000 Revenue– 320,000 Mfg cost ($40 x 8,000)– 500,000 CAD cost– $20,000 Net loss
EMV (purchase CAD system) = (.4)($1,000,000) + (.6)(– $20,000)
Figure 5.13

OM (Fall 2016)
85
Decision Tree Example
(.6) Low sales
(.4)
High salesPurchase CAD
(.6)
Low sales
(.4)
High sales
Hire and train engineers
Do nothing
$2,500,000 Revenue– 1,000,000 Mfg cost ($40 x 25,000)
– 500,000 CAD cost$1,000,000 Net
$800,000 Revenue– 320,000 Mfg cost ($40 x 8,000)– 500,000 CAD cost– $20,000 Net loss
$388,000
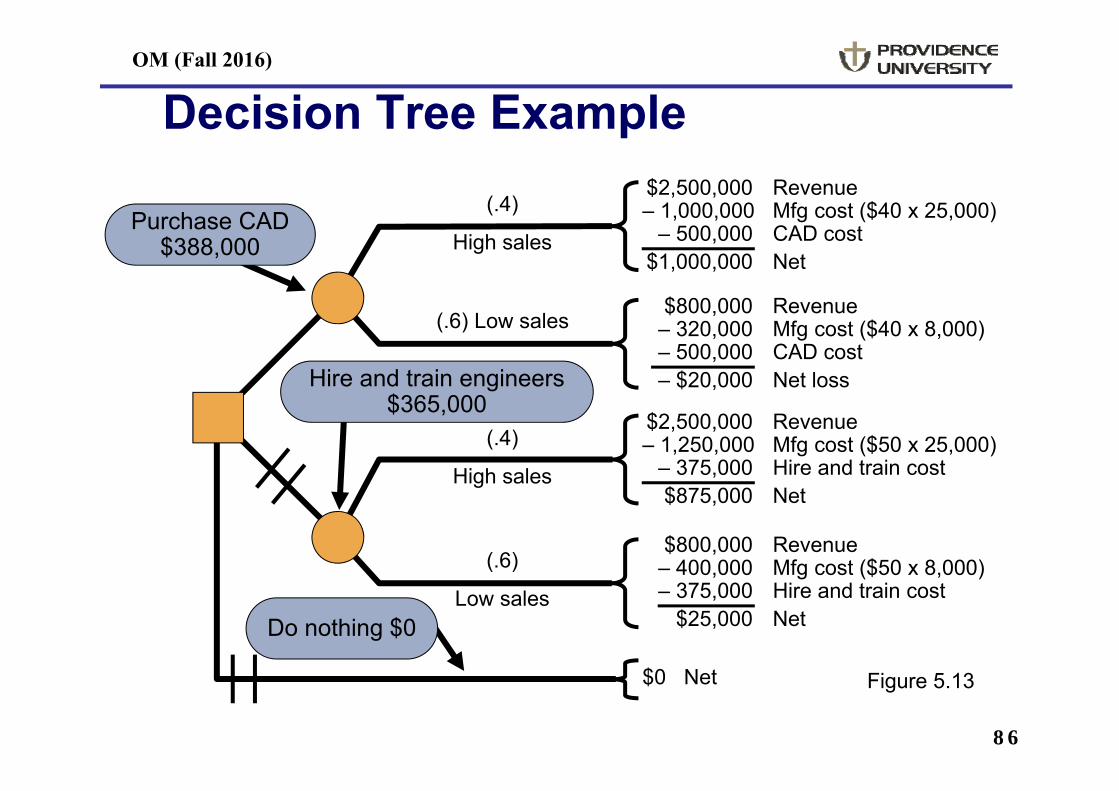
EMV (purchase CAD system) = (.4)($1,000,000) + (.6)(– $20,000)= $388,000
Figure 5.13
OM (Fall 2016)
86
(.6)
Low sales
(.4)
High sales
(.6) Low sales
(.4)
High sales
Decision Tree Example
Purchase CAD$388,000
Hire and train engineers$365,000
Do nothing $0
$0 Net
$800,000 Revenue– 400,000 Mfg cost ($50 x 8,000)– 375,000 Hire and train cost
$25,000 Net
$2,500,000 Revenue– 1,250,000 Mfg cost ($50 x 25,000)
– 375,000 Hire and train cost$875,000 Net
$2,500,000 Revenue– 1,000,000 Mfg cost ($40 x 25,000)
– 500,000 CAD cost$1,000,000 Net
$800,000 Revenue– 320,000 Mfg cost ($40 x 8,000)– 500,000 CAD cost– $20,000 Net loss
Figure 5.13
OM (Fall 2016)
87
Transition to Production
► Know when to move to production► Product development can be viewed as
evolutionary and never complete► Product must move from design to production
in a timely manner► Most products have a trial production period
to insure producibility► Develop tooling, quality control, training► Ensures successful production
OM (Fall 2016)
88
Transition to Production
► Responsibility must also transition as the product moves through its life cycle
► Line management takes over from design► Three common approaches to managing
transition► Project managers► Product development teams► Integrate product development and
manufacturing organizations


