39
Wastewater Management Process Design and Economic Considerations

Wastewater Management
Process Design and Economic
Considerations
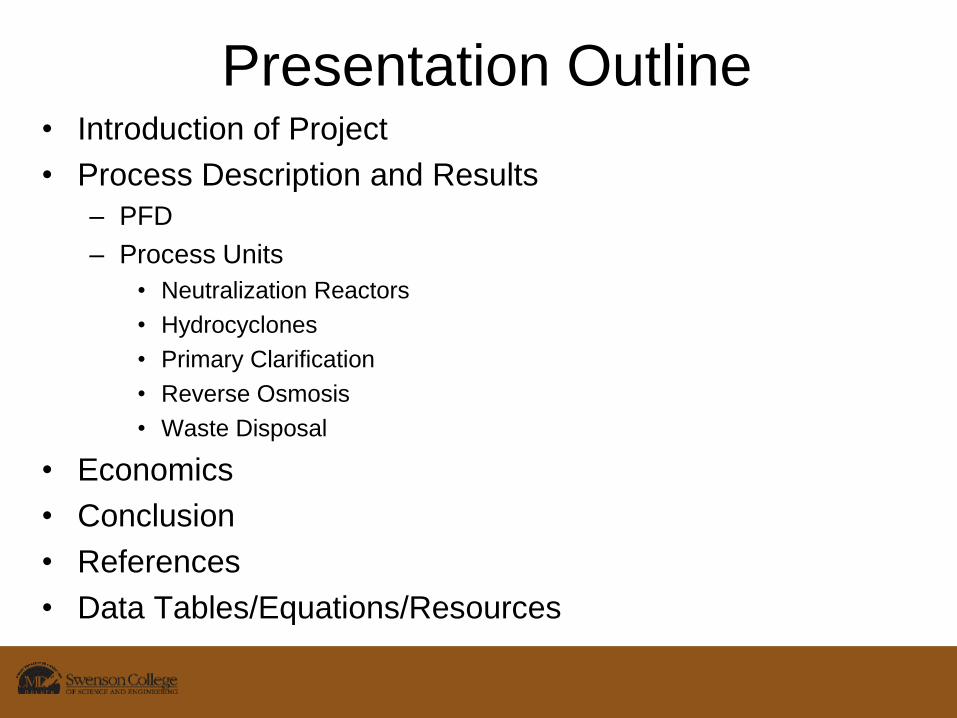
Presentation Outline• Introduction of Project
• Process Description and Results
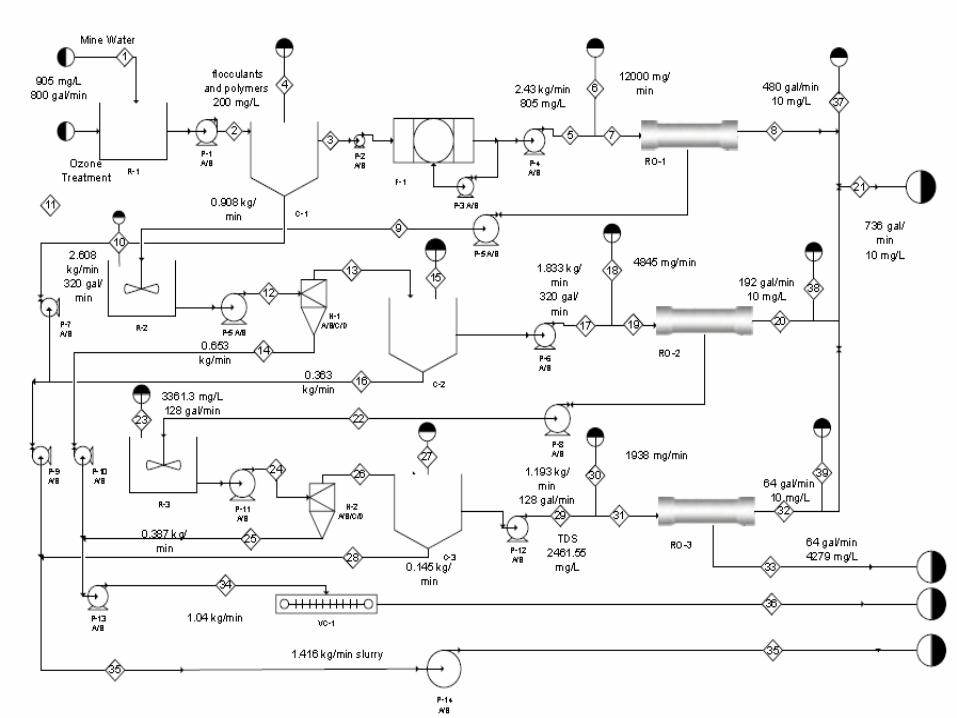
– PFD
– Process Units
• Neutralization Reactors
• Hydrocyclones
• Primary Clarification
• Reverse Osmosis
• Waste Disposal
• Economics
• Conclusion
• References
• Data Tables/Equations/Resources
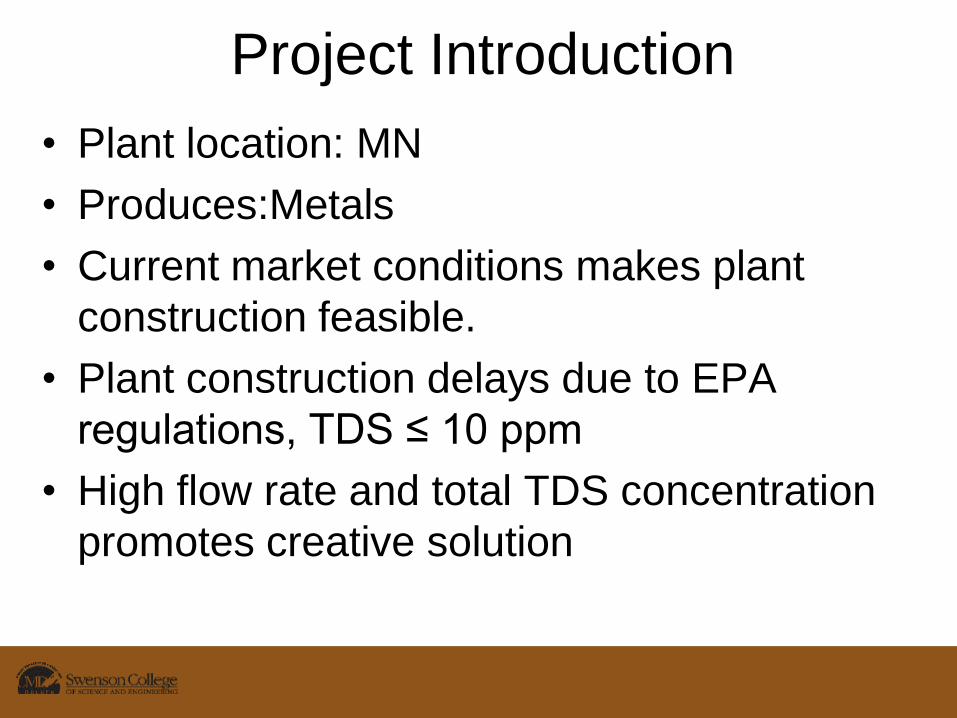
Project Introduction
• Plant location: MN
• Produces:Metals
• Current market conditions makes plant
construction feasible.
• Plant construction delays due to EPA
regulations, TDS ≤ 10 ppm
• High flow rate and total TDS concentration
promotes creative solution

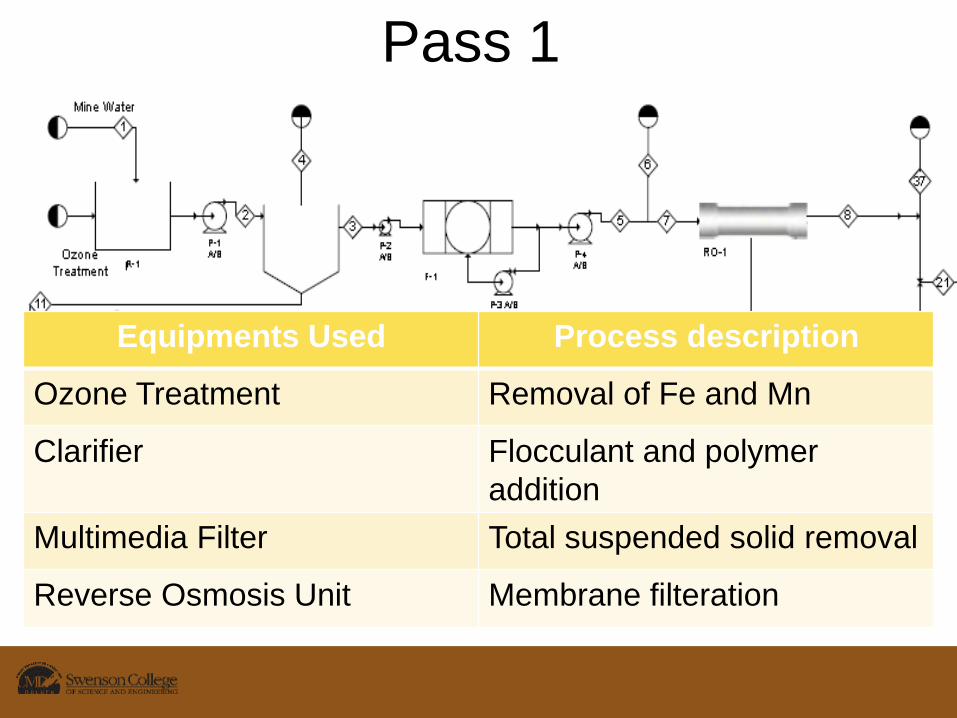
Pass 1
Equipments Used Process description
Ozone Treatment Removal of Fe and Mn
Clarifier Flocculant and polymer
addition
Multimedia Filter Total suspended solid removal
Reverse Osmosis Unit Membrane filteration
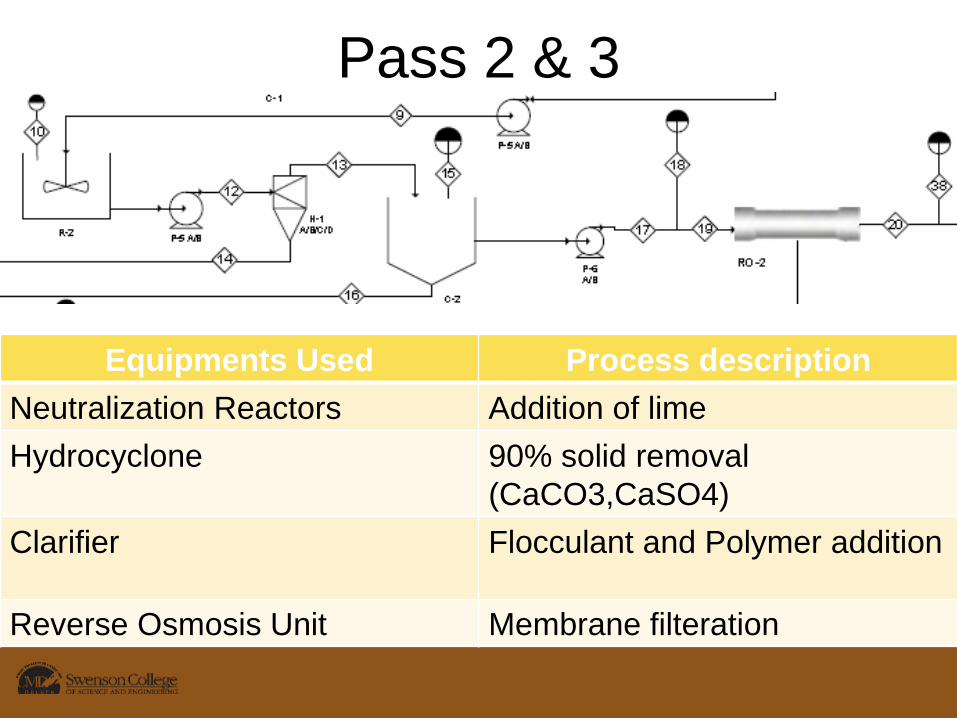
Pass 2 & 3
Equipments Used Process description
Neutralization Reactors Addition of lime
Hydrocyclone 90% solid removal
(CaCO3,CaSO4)
Clarifier Flocculant and Polymer addition
Reverse Osmosis Unit Membrane filteration
Experimental Design
• Geochemical modeling Aqueous geochemical modeling
Equilibrium concentrations (or activities) of chemical species in solution
Saturation indices (SI's) of solid phases in equilibrium with a solution.
Design software used PHREEQ from USGS
Calculation of the effects of mixing of waters,
Saturation index of the compounds higher than 1 precipitate out
Changing the solution's temperature, Eh, or pH, etc
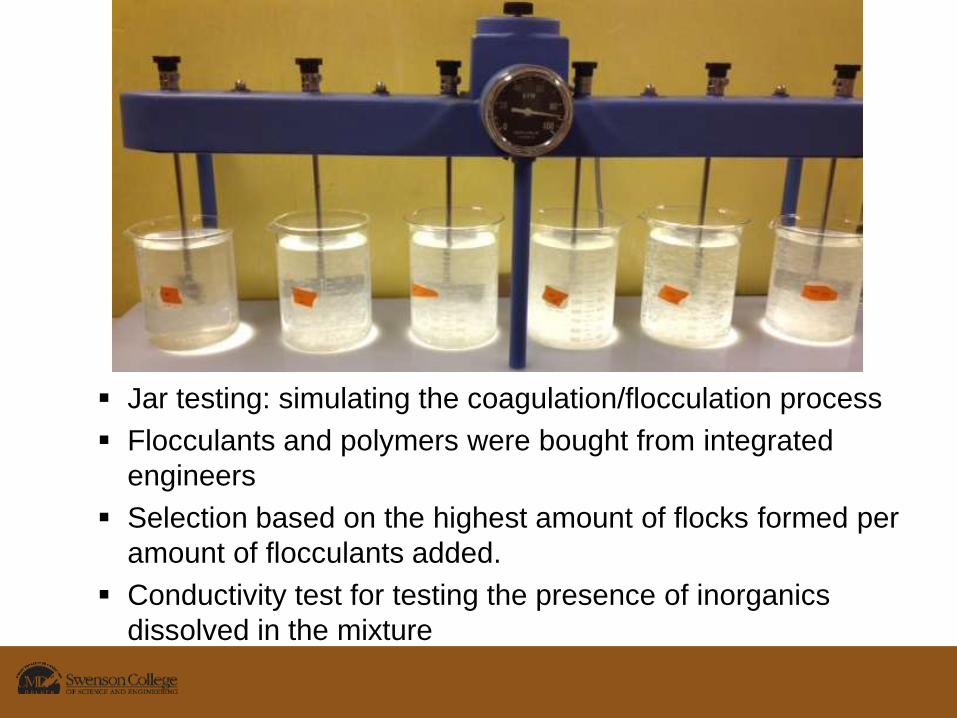
Jar testing: simulating the coagulation/flocculation process
Flocculants and polymers were bought from integrated
engineers
Selection based on the highest amount of flocks formed per
amount of flocculants added.
Conductivity test for testing the presence of inorganics
dissolved in the mixture
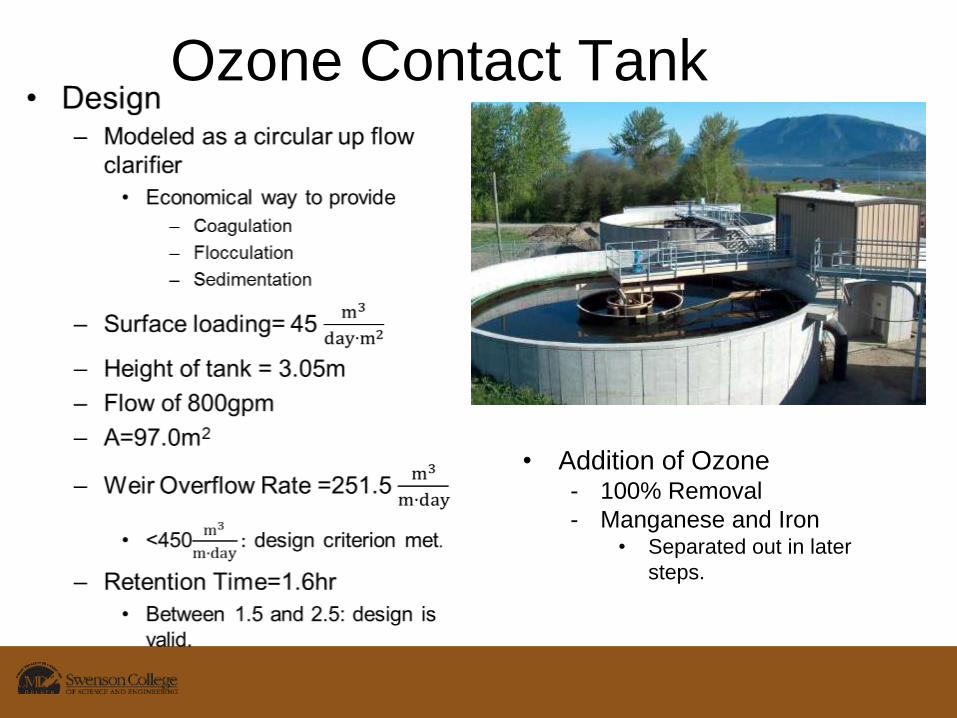
Ozone Contact Tank
• Addition of Ozone- 100% Removal
- Manganese and Iron • Separated out in later
steps.
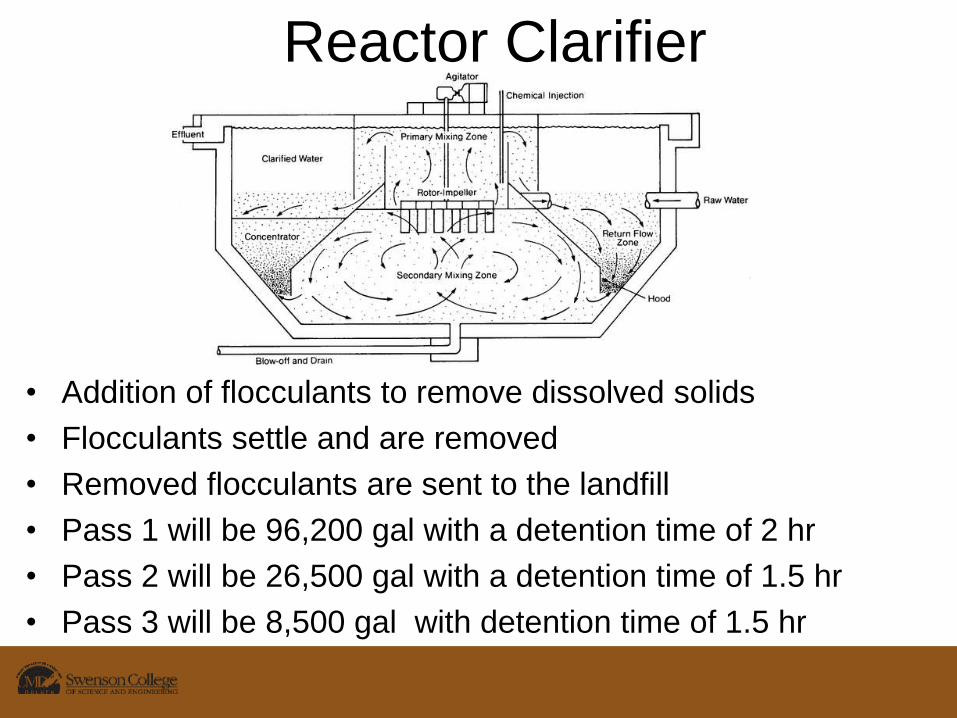
Reactor Clarifier
• Addition of flocculants to remove dissolved solids
• Flocculants settle and are removed
• Removed flocculants are sent to the landfill
• Pass 1 will be 96,200 gal with a detention time of 2 hr
• Pass 2 will be 26,500 gal with a detention time of 1.5 hr
• Pass 3 will be 8,500 gal with detention time of 1.5 hr

Sand Filter• Either dual coal-sand or tri-
media coal-sand-garnet.
• It has an effective high rate filtration process with long filter runs.
• It is a proven and widely accepted filtration process.
• Helps remove more suspended solids before going to the RO unit.
• Sized for 800gpm
• Area 80.0 ft2
• Backwash velocity calculated after filter media is chosen.
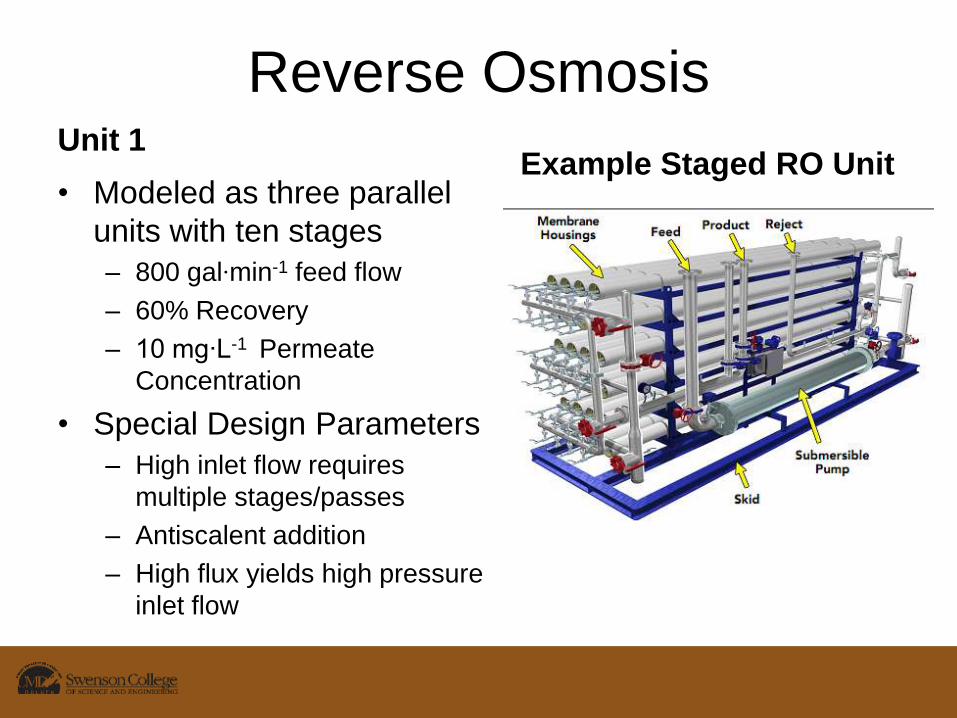
Reverse OsmosisUnit 1
• Modeled as three parallel
units with ten stages
– 800 gal∙min-1 feed flow
– 60% Recovery
– 10 mg∙L-1 Permeate
Concentration
• Special Design Parameters
– High inlet flow requires
multiple stages/passes
– Antiscalent addition
– High flux yields high pressure
inlet flow
Example Staged RO Unit
Reverse Osmosis
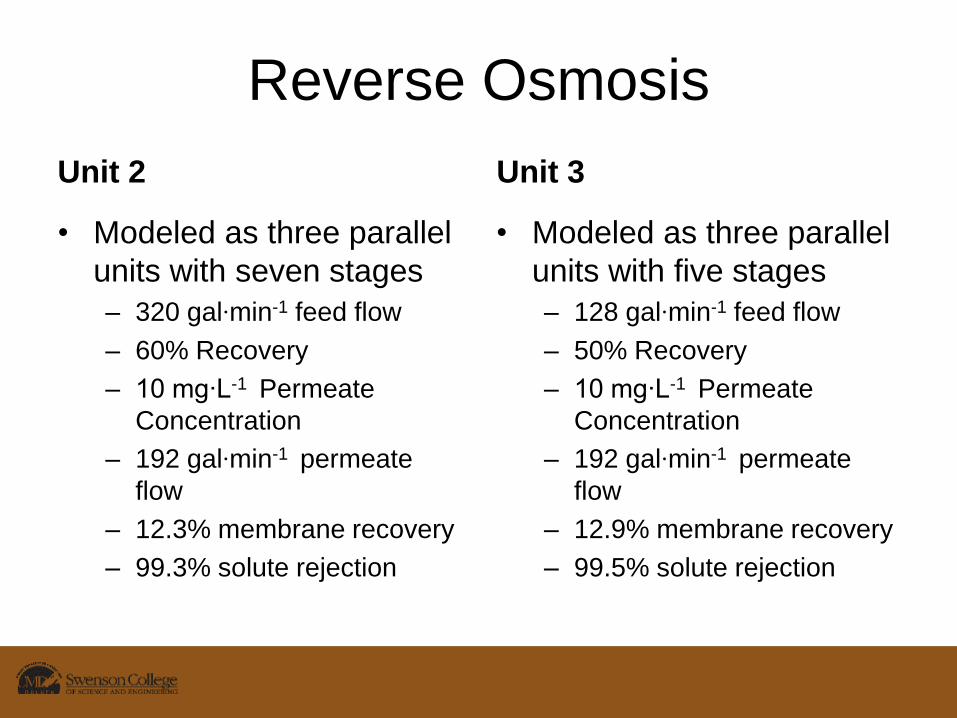
Unit 2
• Modeled as three parallel
units with seven stages
– 320 gal∙min-1 feed flow
– 60% Recovery
– 10 mg∙L-1 Permeate
Concentration
– 192 gal∙min-1 permeate
flow
– 12.3% membrane recovery
– 99.3% solute rejection
Unit 3
• Modeled as three parallel
units with five stages
– 128 gal∙min-1 feed flow
– 50% Recovery
– 10 mg∙L-1 Permeate
Concentration
– 192 gal∙min-1 permeate
flow
– 12.9% membrane recovery
– 99.5% solute rejection
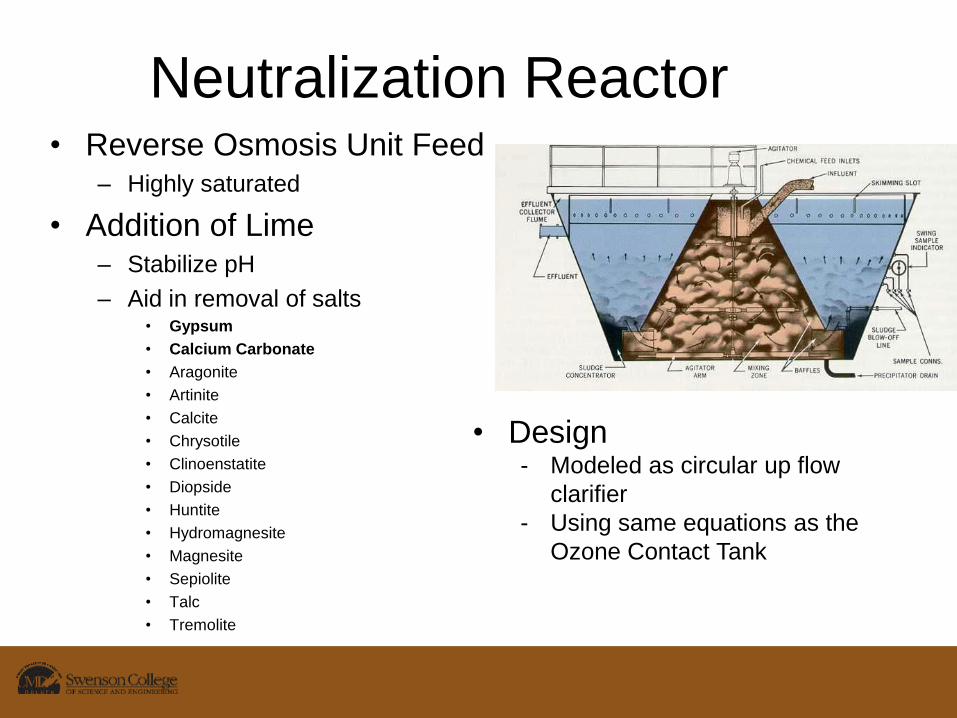
Neutralization Reactor• Reverse Osmosis Unit Feed
– Highly saturated
• Addition of Lime– Stabilize pH
– Aid in removal of salts• Gypsum
• Calcium Carbonate
• Aragonite
• Artinite
• Calcite
• Chrysotile
• Clinoenstatite
• Diopside
• Huntite
• Hydromagnesite
• Magnesite
• Sepiolite
• Talc
• Tremolite
• Design- Modeled as circular up flow
clarifier
- Using same equations as the
Ozone Contact Tank

Hydrocyclones
• Removes solids in the
waste stream
• The removed solids are
land filled
• 16 in. with1,600 hp shaft
will be used for Pass 2
• 12 in. with 360 hp shaft
will be used for Pass 3
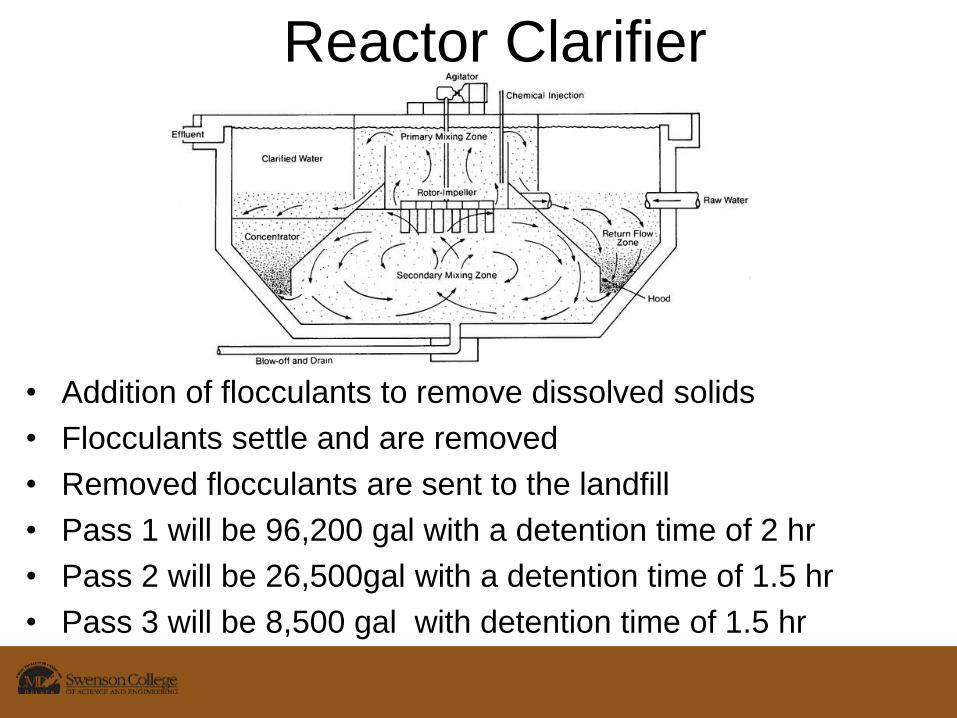
Reactor Clarifier
• Addition of flocculants to remove dissolved solids
• Flocculants settle and are removed
• Removed flocculants are sent to the landfill
• Pass 1 will be 96,200 gal with a detention time of 2 hr
• Pass 2 will be 26,500gal with a detention time of 1.5 hr
• Pass 3 will be 8,500 gal with detention time of 1.5 hr

Landfill design
• Hazardous waste landfill must have a double linear
• Can not be located in wetland on a floodplain
• Cover is placed on top when landfill is closed
• All leachate is collected and treated
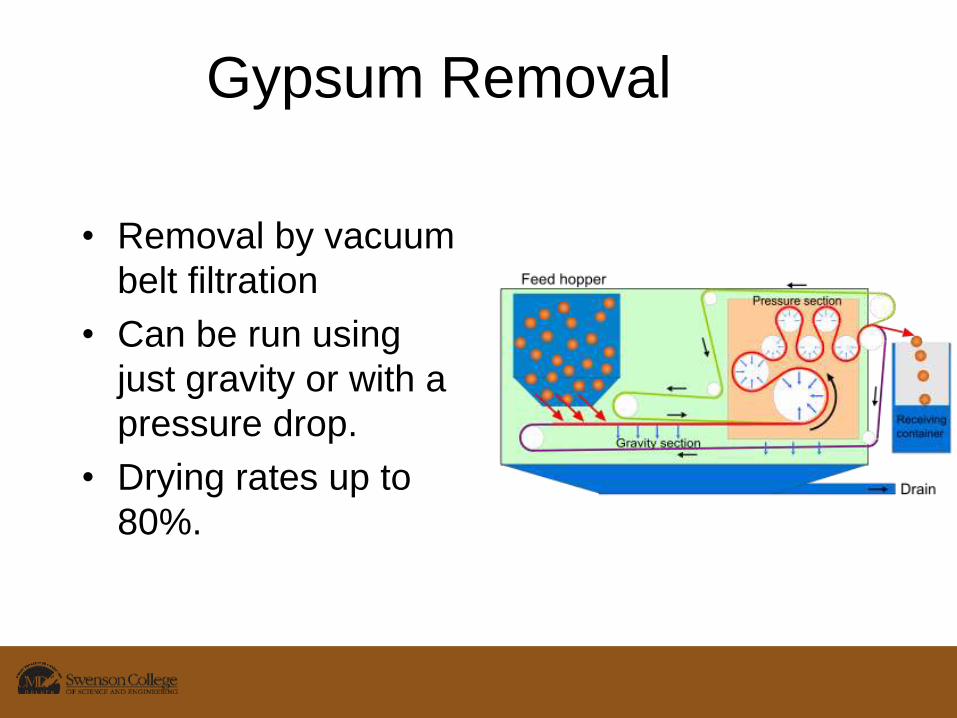
Gypsum Removal
• Removal by vacuum
belt filtration
• Can be run using
just gravity or with a
pressure drop.
• Drying rates up to
80%.
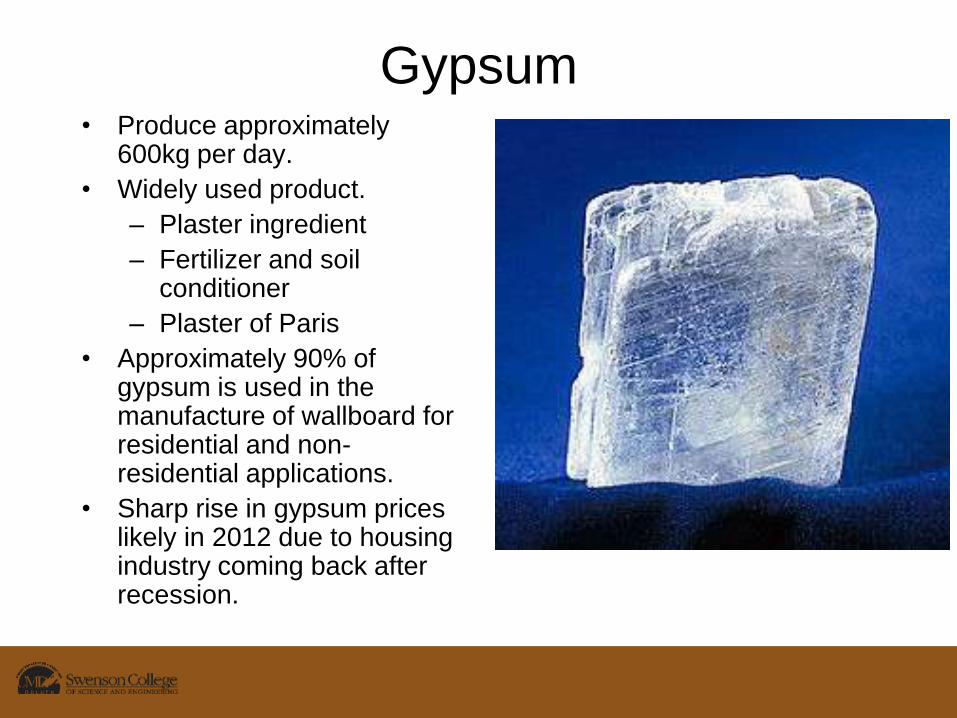
Gypsum• Produce approximately
600kg per day.
• Widely used product.
– Plaster ingredient
– Fertilizer and soil conditioner
– Plaster of Paris
• Approximately 90% of gypsum is used in the manufacture of wallboard for residential and non-residential applications.
• Sharp rise in gypsum prices likely in 2012 due to housing industry coming back after recession.

Economics
• No future estimate– not significant in production
of profitable material.
• Gypsum– produced and sold to offset
some of the cost.
• Energy Cost – Evaporator
• $9million per year
Capital Cost, $2,823,190.
00
Operating and Maintenance
Cost, $1,560,654.00
Chemica Cost, $3,292,489.
88
Flocculation Clarifier, $798,600.
00
Neutralization Clarifier, $651,425.
00
Reverse Osmosis, $790,000
.00
Hydrocyclone, $34,084.00
Multimedia Filter, $160,000.00
Vacuum BeltFilter, $389,081
.00
Recomendations
• Flocculants and polymers for Clarifiers
• Automated process
• Pilot plant for the process
• Scaling up the process according to
fluctuation
Conclusions
• Reverse Osmosis unit over other ideas
– Evaporator
– Recrystallizer
– Carbon nano-tubes
• Should now be EPA compliant
• Profitability associated with other areas of the mine
References• BRUCE HUTTON, I. K. (2007). OPERATING AND MAINTENANCE EXPERIENCE
AT THE. Johanusburg: Anglo steel.
• Brunfelt, P. C. (2012, April). Project Discussion. (A. Shah, Interviewer)
• Iverson, D. (2012, April). Cost of the Reverse Osmosis. (A. shah, Interviewer)
• NETAFIM USA. (2010). Hydrocyclone separators for gold mine. Fresno, CA 93727: NETAFIM USA.
• Russell, D. (2012, April). Cost Of antiscalent Spectraguard 350. (A. Shah, Interviewer)
• SHARMA, J. R. (May 2010). DEVELOPMENT OF A PRELIMINARY COST ESTIMATION METHOD FOR. Arlington: THE UNIVERSITY OF TEXAS AT ARLINGTON.
• Kahan, I (2009) “eMalahleni Water Reclamation Plant – Towards Zero Waste” WISA Membrane Technology, Conference 2009
• Kawamura, S. (2000). Integrated Design and Operation of Water Treatment Facilities. John Wiley & Sons, Inc., New York.
• Groudev, Stoyan. "Safe Management of Mining Waste and Waste Facilities." http://www.safemanmin.eu/. N.p., 2008. Web. 30 Apr 2012.
• LaGrega, Michael. Hazardous Waste Management. 2nd. waveland press inc, 2010.

Appendix
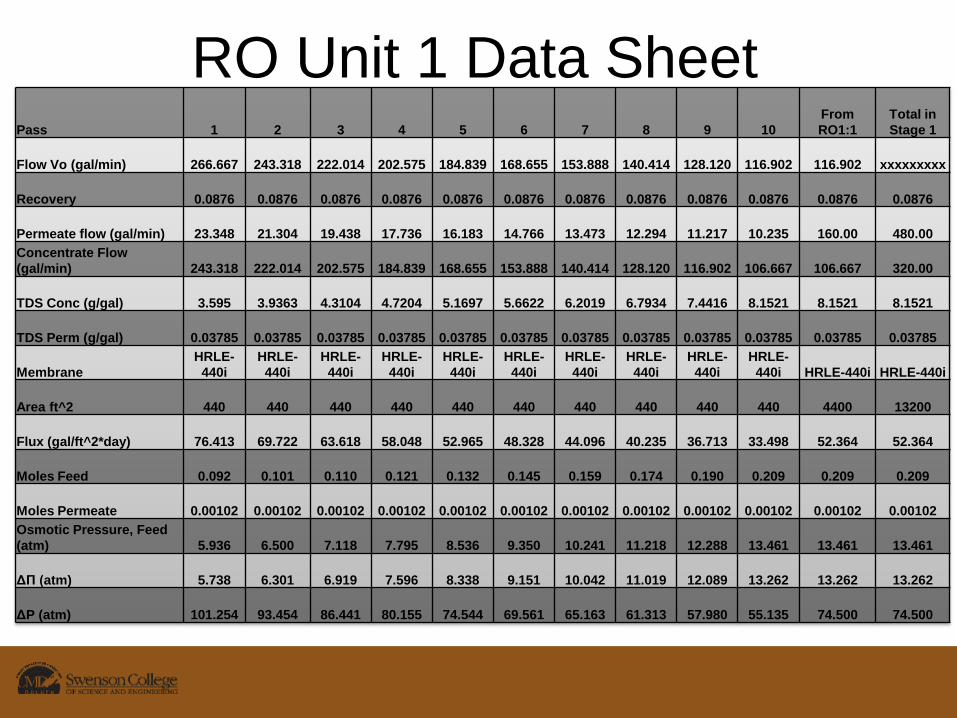
RO Unit 1 Data SheetPass 1 2 3 4 5 6 7 8 9 10
From
RO1:1
Total in
Stage 1
Flow Vo (gal/min) 266.667 243.318 222.014 202.575 184.839 168.655 153.888 140.414 128.120 116.902 116.902 xxxxxxxxx
Recovery 0.0876 0.0876 0.0876 0.0876 0.0876 0.0876 0.0876 0.0876 0.0876 0.0876 0.0876 0.0876
Permeate flow (gal/min) 23.348 21.304 19.438 17.736 16.183 14.766 13.473 12.294 11.217 10.235 160.00 480.00
Concentrate Flow
(gal/min) 243.318 222.014 202.575 184.839 168.655 153.888 140.414 128.120 116.902 106.667 106.667 320.00
TDS Conc (g/gal) 3.595 3.9363 4.3104 4.7204 5.1697 5.6622 6.2019 6.7934 7.4416 8.1521 8.1521 8.1521
TDS Perm (g/gal) 0.03785 0.03785 0.03785 0.03785 0.03785 0.03785 0.03785 0.03785 0.03785 0.03785 0.03785 0.03785
Membrane
HRLE-
440i
HRLE-
440i
HRLE-
440i
HRLE-
440i
HRLE-
440i
HRLE-
440i
HRLE-
440i
HRLE-
440i
HRLE-
440i
HRLE-
440i HRLE-440i HRLE-440i
Area ft^2 440 440 440 440 440 440 440 440 440 440 4400 13200
Flux (gal/ft^2*day) 76.413 69.722 63.618 58.048 52.965 48.328 44.096 40.235 36.713 33.498 52.364 52.364
Moles Feed 0.092 0.101 0.110 0.121 0.132 0.145 0.159 0.174 0.190 0.209 0.209 0.209
Moles Permeate 0.00102 0.00102 0.00102 0.00102 0.00102 0.00102 0.00102 0.00102 0.00102 0.00102 0.00102 0.00102
Osmotic Pressure, Feed
(atm) 5.936 6.500 7.118 7.795 8.536 9.350 10.241 11.218 12.288 13.461 13.461 13.461
ΔΠ (atm) 5.738 6.301 6.919 7.596 8.338 9.151 10.042 11.019 12.089 13.262 13.262 13.262
ΔP (atm) 101.254 93.454 86.441 80.155 74.544 69.561 65.163 61.313 57.980 55.135 74.500 74.500
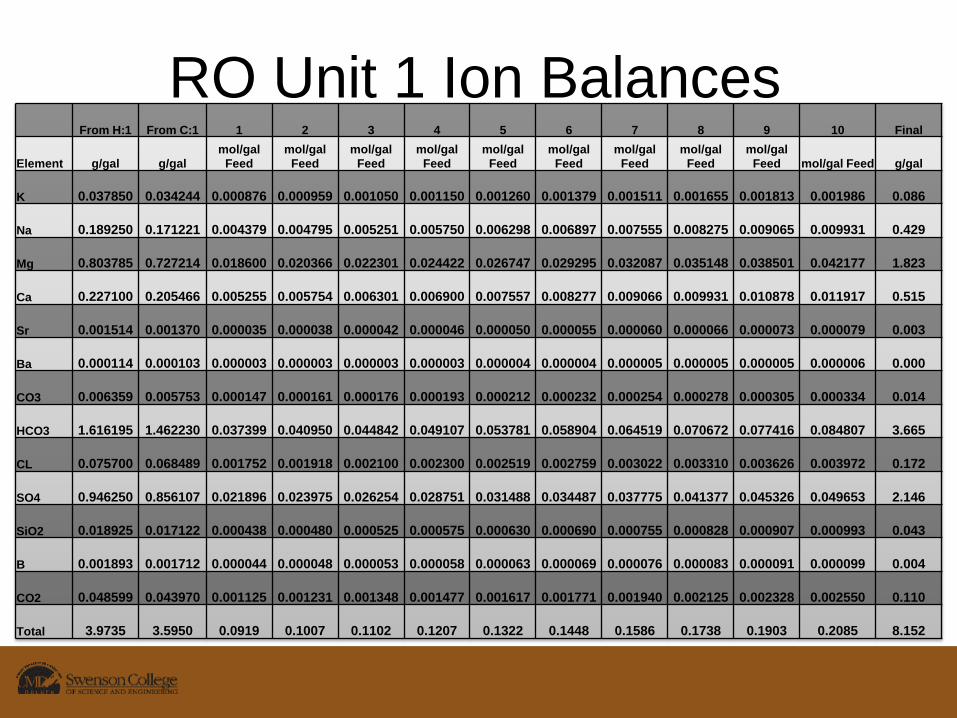
RO Unit 1 Ion BalancesFrom H:1 From C:1 1 2 3 4 5 6 7 8 9 10 Final
Element g/gal g/gal
mol/gal
Feed
mol/gal
Feed
mol/gal
Feed
mol/gal
Feed
mol/gal
Feed
mol/gal
Feed
mol/gal
Feed
mol/gal
Feed
mol/gal
Feed mol/gal Feed g/gal
K 0.037850 0.034244 0.000876 0.000959 0.001050 0.001150 0.001260 0.001379 0.001511 0.001655 0.001813 0.001986 0.086
Na 0.189250 0.171221 0.004379 0.004795 0.005251 0.005750 0.006298 0.006897 0.007555 0.008275 0.009065 0.009931 0.429
Mg 0.803785 0.727214 0.018600 0.020366 0.022301 0.024422 0.026747 0.029295 0.032087 0.035148 0.038501 0.042177 1.823
Ca 0.227100 0.205466 0.005255 0.005754 0.006301 0.006900 0.007557 0.008277 0.009066 0.009931 0.010878 0.011917 0.515
Sr 0.001514 0.001370 0.000035 0.000038 0.000042 0.000046 0.000050 0.000055 0.000060 0.000066 0.000073 0.000079 0.003
Ba 0.000114 0.000103 0.000003 0.000003 0.000003 0.000003 0.000004 0.000004 0.000005 0.000005 0.000005 0.000006 0.000
CO3 0.006359 0.005753 0.000147 0.000161 0.000176 0.000193 0.000212 0.000232 0.000254 0.000278 0.000305 0.000334 0.014
HCO3 1.616195 1.462230 0.037399 0.040950 0.044842 0.049107 0.053781 0.058904 0.064519 0.070672 0.077416 0.084807 3.665
CL 0.075700 0.068489 0.001752 0.001918 0.002100 0.002300 0.002519 0.002759 0.003022 0.003310 0.003626 0.003972 0.172
SO4 0.946250 0.856107 0.021896 0.023975 0.026254 0.028751 0.031488 0.034487 0.037775 0.041377 0.045326 0.049653 2.146
SiO2 0.018925 0.017122 0.000438 0.000480 0.000525 0.000575 0.000630 0.000690 0.000755 0.000828 0.000907 0.000993 0.043
B 0.001893 0.001712 0.000044 0.000048 0.000053 0.000058 0.000063 0.000069 0.000076 0.000083 0.000091 0.000099 0.004
CO2 0.048599 0.043970 0.001125 0.001231 0.001348 0.001477 0.001617 0.001771 0.001940 0.002125 0.002328 0.002550 0.110
Total 3.9735 3.5950 0.0919 0.1007 0.1102 0.1207 0.1322 0.1448 0.1586 0.1738 0.1903 0.2085 8.152
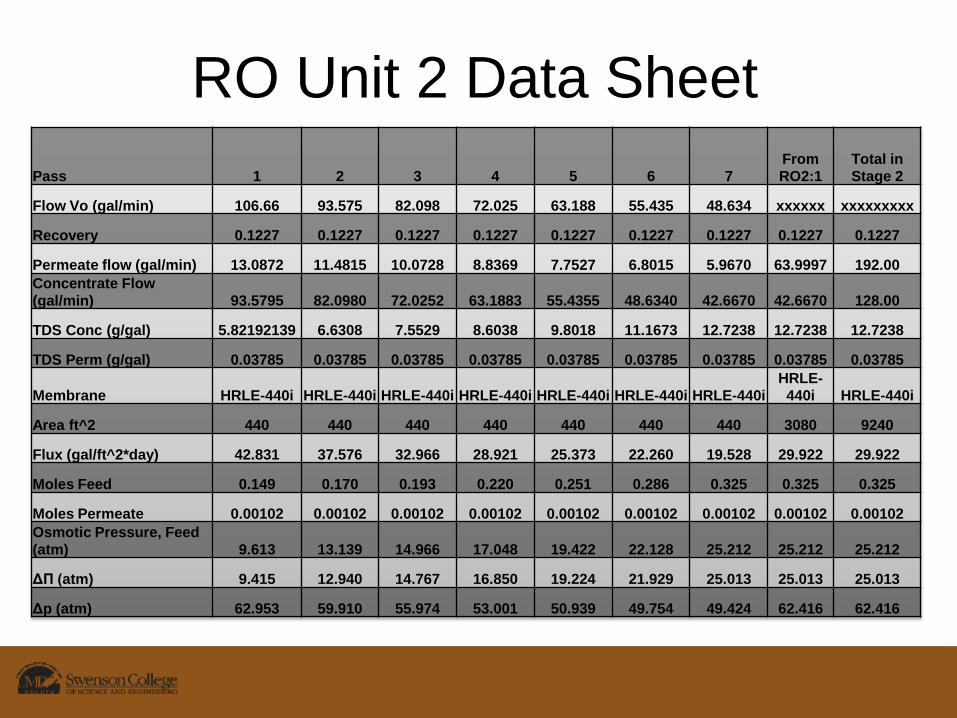
RO Unit 2 Data Sheet
Pass 1 2 3 4 5 6 7
From
RO2:1
Total in
Stage 2
Flow Vo (gal/min) 106.66 93.575 82.098 72.025 63.188 55.435 48.634 xxxxxx xxxxxxxxx
Recovery 0.1227 0.1227 0.1227 0.1227 0.1227 0.1227 0.1227 0.1227 0.1227
Permeate flow (gal/min) 13.0872 11.4815 10.0728 8.8369 7.7527 6.8015 5.9670 63.9997 192.00
Concentrate Flow
(gal/min) 93.5795 82.0980 72.0252 63.1883 55.4355 48.6340 42.6670 42.6670 128.00
TDS Conc (g/gal) 5.82192139 6.6308 7.5529 8.6038 9.8018 11.1673 12.7238 12.7238 12.7238
TDS Perm (g/gal) 0.03785 0.03785 0.03785 0.03785 0.03785 0.03785 0.03785 0.03785 0.03785
Membrane HRLE-440i HRLE-440i HRLE-440i HRLE-440i HRLE-440i HRLE-440i HRLE-440i
HRLE-
440i HRLE-440i
Area ft^2 440 440 440 440 440 440 440 3080 9240
Flux (gal/ft^2*day) 42.831 37.576 32.966 28.921 25.373 22.260 19.528 29.922 29.922
Moles Feed 0.149 0.170 0.193 0.220 0.251 0.286 0.325 0.325 0.325
Moles Permeate 0.00102 0.00102 0.00102 0.00102 0.00102 0.00102 0.00102 0.00102 0.00102
Osmotic Pressure, Feed
(atm) 9.613 13.139 14.966 17.048 19.422 22.128 25.212 25.212 25.212
ΔΠ (atm) 9.415 12.940 14.767 16.850 19.224 21.929 25.013 25.013 25.013
Δp (atm) 62.953 59.910 55.974 53.001 50.939 49.754 49.424 62.416 62.416
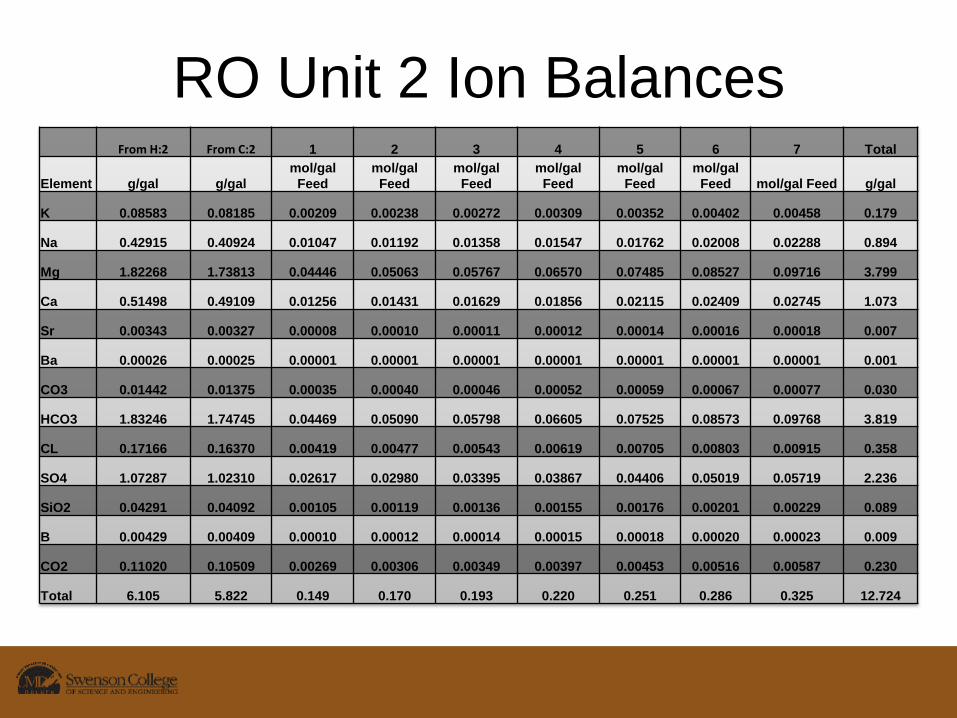
RO Unit 2 Ion BalancesFrom H:2 From C:2 1 2 3 4 5 6 7 Total
Element g/gal g/gal
mol/gal
Feed
mol/gal
Feed
mol/gal
Feed
mol/gal
Feed
mol/gal
Feed
mol/gal
Feed mol/gal Feed g/gal
K 0.08583 0.08185 0.00209 0.00238 0.00272 0.00309 0.00352 0.00402 0.00458 0.179
Na 0.42915 0.40924 0.01047 0.01192 0.01358 0.01547 0.01762 0.02008 0.02288 0.894
Mg 1.82268 1.73813 0.04446 0.05063 0.05767 0.06570 0.07485 0.08527 0.09716 3.799
Ca 0.51498 0.49109 0.01256 0.01431 0.01629 0.01856 0.02115 0.02409 0.02745 1.073
Sr 0.00343 0.00327 0.00008 0.00010 0.00011 0.00012 0.00014 0.00016 0.00018 0.007
Ba 0.00026 0.00025 0.00001 0.00001 0.00001 0.00001 0.00001 0.00001 0.00001 0.001
CO3 0.01442 0.01375 0.00035 0.00040 0.00046 0.00052 0.00059 0.00067 0.00077 0.030
HCO3 1.83246 1.74745 0.04469 0.05090 0.05798 0.06605 0.07525 0.08573 0.09768 3.819
CL 0.17166 0.16370 0.00419 0.00477 0.00543 0.00619 0.00705 0.00803 0.00915 0.358
SO4 1.07287 1.02310 0.02617 0.02980 0.03395 0.03867 0.04406 0.05019 0.05719 2.236
SiO2 0.04291 0.04092 0.00105 0.00119 0.00136 0.00155 0.00176 0.00201 0.00229 0.089
B 0.00429 0.00409 0.00010 0.00012 0.00014 0.00015 0.00018 0.00020 0.00023 0.009
CO2 0.11020 0.10509 0.00269 0.00306 0.00349 0.00397 0.00453 0.00516 0.00587 0.230
Total 6.105 5.822 0.149 0.170 0.193 0.220 0.251 0.286 0.325 12.724

RO Unit 3 Data Sheet
Pass 1 2 3 4 5 From RO3:1
Total in
Stage 3
Flow Vo (gal/min) 42.667 37.144 32.336 28.150 24.506 xxxxxx xxxxxxxxx
Recovery 0.1294 0.1294 0.1294 0.1294 0.1294 0.1294 0.1294
Permeate flow (gal/min) 5.523 4.808 4.186 3.644 3.172 21.333 64.00
Concentrate Flow (gal/min) 37.144 32.336 28.150 24.506 21.334 21.334 64.00
TDS Conc (g/gal) 9.318 10.698 12.283 14.103 16.195 16.195 16.195
TDS Perm (g/gal) 0.03785 0.03785 0.03785 0.03785 0.03785 0.03785 0.03785
Membrane HRLE-440i HRLE-440i HRLE-440i HRLE-440i HRLE-440i HRLE-440i HRLE-440i
Area ft^2 440 440 440 440 440 2200 6600
Flux (gal/ft^2*day) 18.075 15.736 13.699 11.925 10.382 13.963 13.963
Moles Feed 0.2383 0.2736 0.3142 0.3607 0.4142 0.4142 0.4142
Moles Permeate 0.00102 0.00102 0.00102 0.00102 0.00102 0.00102 0.00102
Osmotic Pressure, Feed
(atm) 15.386 17.664 20.282 23.288 26.742 26.742 26.742
ΔΠ (atm) 15.186 17.465 20.082 23.089 26.542 26.542 26.542
ΔP (atm) 37.781 37.134 37.206 37.995 39.519 43.996 43.996

RO Unit 3 Ion Balances
From R:3 From C:3 1 2 3 4 5 Total
Element g/gal g/gal mol/gal Feed mol/gal Feed mol/gal Feed mol/gal Feed mol/gal Feed g/gal
K 0.17888 0.17190 0.00440 0.00505 0.00580 0.00665 0.00764 0.2988
Na 0.89439 0.85948 0.02198 0.02524 0.02898 0.03327 0.03821 1.4938
Mg 3.79866 3.65038 0.09336 0.10719 0.12307 0.14132 0.16227 6.3446
Ca 1.07327 1.03137 0.02638 0.03029 0.03477 0.03993 0.04585 1.7926
Sr 0.00716 0.00688 0.00018 0.00020 0.00023 0.00027 0.00031 0.0120
Ba 0.00054 0.00052 0.00001 0.00002 0.00002 0.00002 0.00002 0.0009
CO3 0.03005 0.02888 0.00074 0.00085 0.00097 0.00112 0.00128 0.0502
HCO3 1.90952 1.83498 0.04693 0.05388 0.06187 0.07104 0.08157 3.1893
CL 0.35776 0.34379 0.00879 0.01010 0.01159 0.01331 0.01528 0.5975
SO4 1.11799 1.07435 0.02748 0.03155 0.03622 0.04159 0.04776 1.8673
SiO2 0.08944 0.08595 0.00220 0.00252 0.00290 0.00333 0.00382 0.1494
B 0.00894 0.00859 0.00022 0.00025 0.00029 0.00033 0.00038 0.0149
CO2 0.22968 0.22071 0.00565 0.00648 0.00744 0.00854 0.00981 0.3836
Total 9.696 9.318 0.2383 0.2736 0.3142 0.3607 0.4142 16.195

Surface Complexation
Principles• Fully considers variable charge surfaces. # of sorption of
sites is constant but their individual charge, & total surface charge, vary as a function of solution composition
• Similar to aqueous complexation/speciation
• A mix of anions, cations & neutral species can sorb
• Accounts for electrostatic work required to transport species through the “diffuse layer” (similar to an activity coefficient correction) Gouy-Chapman theory

Surface complexation equations
• 1st deprotonation reaction:
+ 0 +
2
0
1
2
SOH SOH H
app
a
SOH HK
SOH
2nd deprotonation
reaction:0 - +
2 0
SOH SO H
app
a
SO HK
SOH
Divalent cation complexation
0 2+ + +
0 2
SOH M SOM H
app
M
SOM HK
SOH M

Upflow Clarifier Equations

Sand Filter
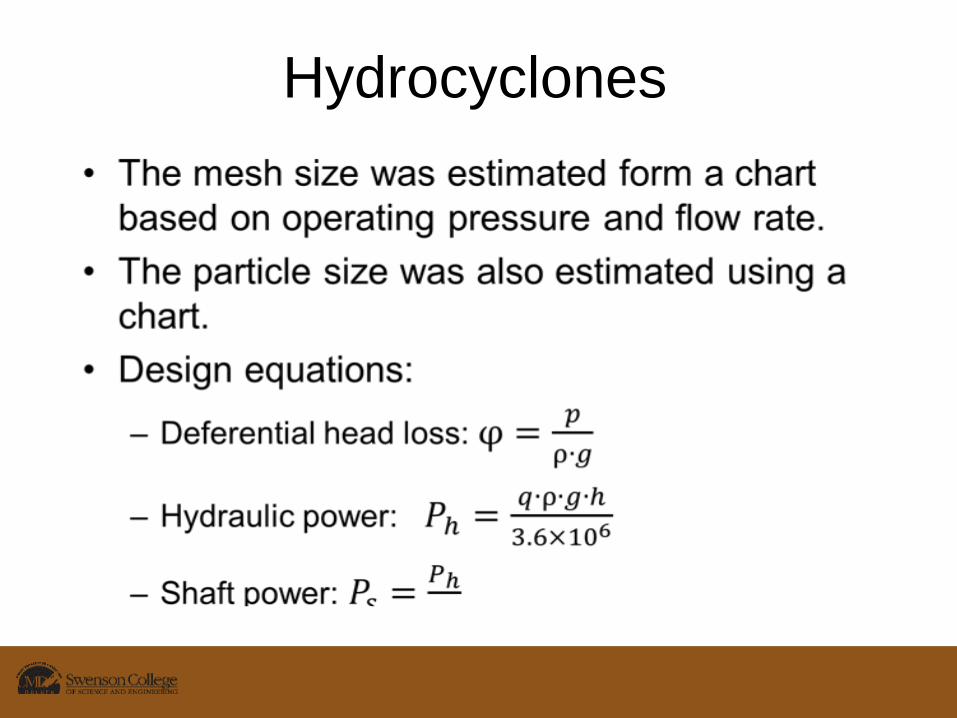
Hydrocyclones
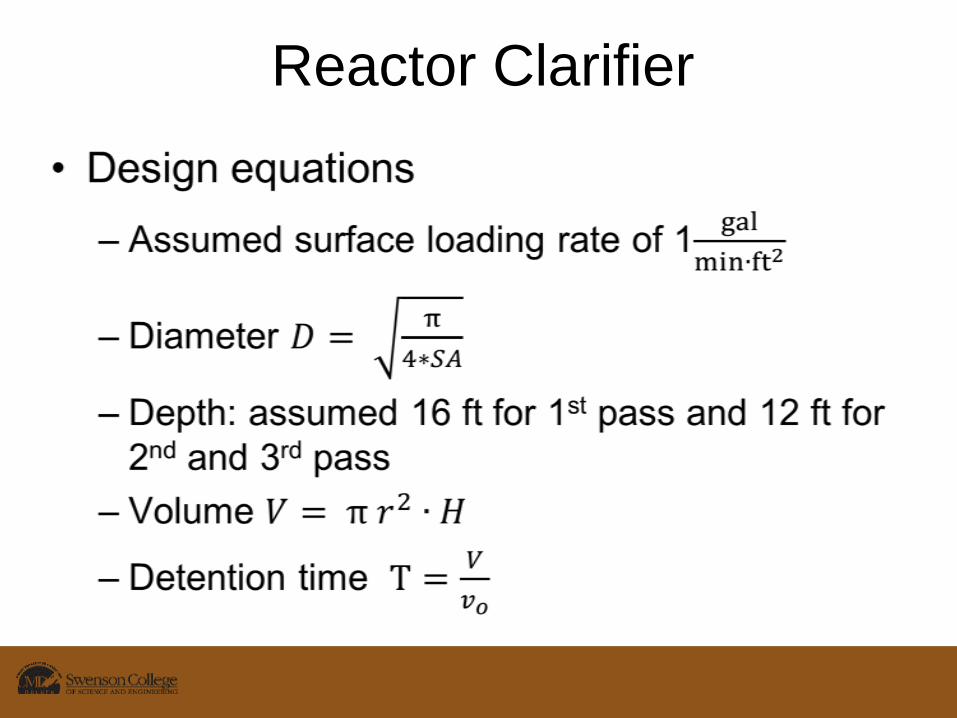
Reactor Clarifier
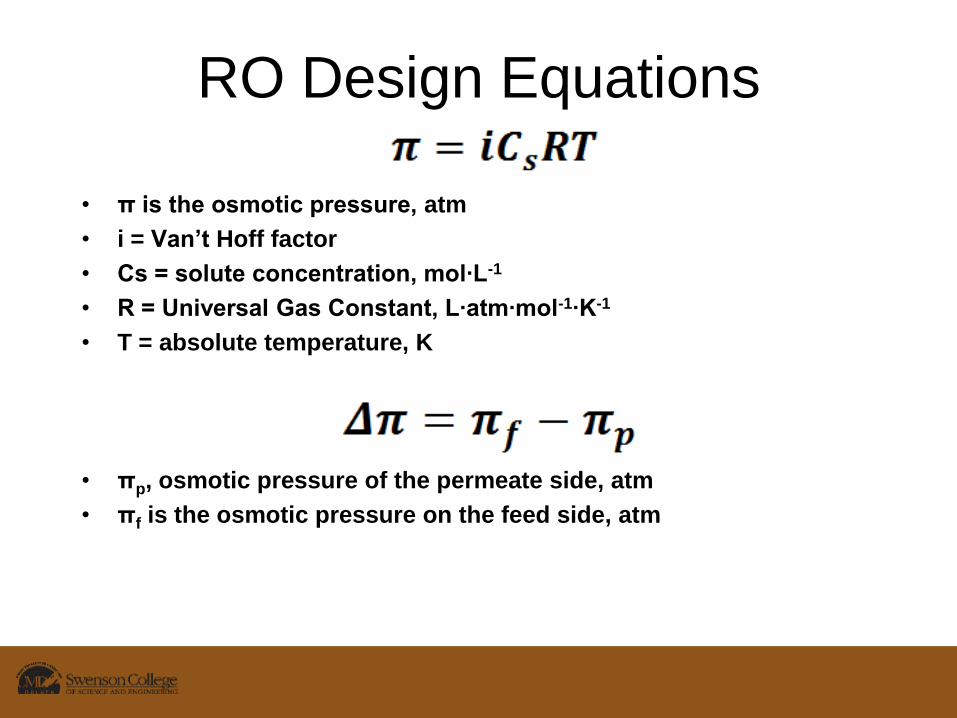
RO Design Equations
• π is the osmotic pressure, atm
• i = Van’t Hoff factor
• Cs = solute concentration, mol∙L-1
• R = Universal Gas Constant, L∙atm∙mol-1∙K-1
• T = absolute temperature, K
• πp, osmotic pressure of the permeate side, atm
• πf is the osmotic pressure on the feed side, atm

RO Design Equations
• Jp = permeate flux, gal∙ft-2∙day-1
• qp = permeate flow, gal∙day-1
• Am is the membrane surface area, ft2
• Aw = membrane water permeability coefficient ,gal∙ft-2∙day-1∙atm-1
• ΔP = Pressure drop in atm.


