15
DesignCon 2015 Critical Memory Performance Metrics for DDR4 Systems Barbara P Aichinger, FuturePlus Systems Corporation [email protected]
| Date post: | 25-Jul-2015 |
| Category: |
Engineering |
| Upload: | barbara-aichinger |
| View: | 124 times |
| Download: | 1 times |
DesignCon 2015
Critical Memory Performance Metrics
for DDR4 Systems
Barbara P Aichinger, FuturePlus Systems Corporation

P a g e | 2
Abstract
Is DDR4 the end of the DDR line of memory technologies? If so then stretching DDR4 to give that
much more performance is critical. Discussed in this paper is how to measure the intricate performance
metrics of your DDR4 system and why they matter. Understanding these critical parameters can lead to
better system design, memory controller architecture and software design. Metrics such as Power
Management, Page Hits, Bank Group and Bank Utilization, Multiple Open Bank Analysis, Data Bus
Utilization and overhead on a DDR4 memory bus will be demonstrated and discussed.
Author Biography
Barbara P. Aichinger holds a BSEE from the University of Akron, Ohio and a MSEE from the
University of Massachusetts. She is a co-founder of FuturePlus Systems and is currently the Vice
President of New Business Development. Barbara has extensive experience with computer architecture
and system design that includes both hardware and software. She is widely published in the area of
computer test and most recently has authored several papers on DDR Memory Errors and Performance.
Her LinkedIn profile can be found at http://www.linkedin.com/pub/barbara-aichinger/3/3a/463/

P a g e | 3
Introduction
Second only to the speed of the processor, memory subsystems design dominates a server’s
performance. The three traditional metrics of Latency, Bandwidth and Power Management are no
longer enough to categorize the performance of modern memory subsystems. Memory channels are
increasing in speed and the protocol is becoming more complex. As such, new metrics need to be
employed to understand and categorize memory subsystem traffic. By studying the complex, and what
is assumed to be random, traffic patterns, we can begin to design and architect the next generation of
memory subsystems and servers. To do this we need to employ some advanced methods of analysis.
The methods employed in the past use a traditional logic analysis approach where only small fractions of
a microsecond of memory bus traffic are captured with minutes of dead time between those snapshots
trace the cycle by cycle traffic. The resulting traces are then off loaded and an extensive post processing
to glean performance metrics is performed. This process is expensive due to several reasons: logic
analyzers that operate at these speeds are easily in excess of US$100,000 and deep trace depth is
expensive and in some cases add an additional US$30,000 to the cost of the analyzer. After the data has
been acquired there is the manpower to write the software that performs the analysis. In addition, this
method is incomplete as the vast majority of traffic is not analyzed due to the inadequate trace depth and
dead time between acquisitions. Thus a new method needed to be derived. That method is the use of
high speed counters inside an FPGA. The system can be probed using traditional means of a DIMM
interposer, probing only the Address/Command and Control signals, and the logic analyzer replaced
with a specialized unit that counts all of the metrics that would normally be gleaned from the terabytes
of traced data. Thus no trace memory is needed and the counters provide greatly improved results at a
fraction of the cost and can provide the metrics for longer periods of time. Such a product is now
commercially available and is called the DDR Detective® from FuturePlus Systems. To illustrate the
metrics described we used the DDR Detective® in an ASUS X99 DDR4 based system. A single 8GB 2
Rank DIMM was instrumented using a DDR4 DIMM interposer . The clock rate for the channel was
1067 MHz which results in 2133 MT/s (mega transfers per second). The x86 Memtest was run in order
to create memory bus traffic.
Figure 1: DDR4 Memory Performance Metrics illustrated on an ASUS X99 System using the DDR Detective® from FuturePlus Systems

P a g e | 4
What Memory bus signals need to be monitored
DDR memory busses since the original DDR and now up to DDR4 have similar architectures and
protocol. Each successive generation has increase protocol complexity and speed, however one thing
has remained constant and that is that the Address, Command and Control signals are the only ones that
need to be monitored in order to glean the important performance metrics. The double data rate DQ
signals and associated DQS strobes indeed carry important information, but that information occurs at a
predictable rate and time via the protocol determined by the Address, Command and Control signals. In
addition, the data carried on the DQ data signals is not recognizable as it is encoded for signal integrity
and in many cases the bits are rearranged out of order for ease of motherboard signal routing. So from a
performance perspective it is not important to know the value of the DQ data signals, it is only important
to know how often these signals are valid and for how long.
Traditional Memory Performance Metrics
Unfortunately there are no industry standards that define computer memory performance metrics but
there are three commonly used ones and they are: Bandwidth, Latency and Power Management. The
last one becoming increasingly more dominate as data centers try to reduce their power consumption. In
a recent posting it was explained that a savings of a single watt per server can add millions of dollars to
Facebook’s bottom line. Since DDR4 has extensive power management features built into its protocol,
Power Management is one reason supporters of DDR4 tout its superiority over the previous generation
DDR3.
Bandwidth
The most easily recognizable and most common metric used in describing performance of computer
memory is Bandwidth. Per Webster’s Dictionary it is:
For DDR4 memory there are two ‘busses’: Address/Command and Control abbreviated A/C/C and the
DQ/DQS double data rate data bus simply referred to as the Data Bus. However it is only the Data Bus
that determines useful Bandwidth since the A/C/C is merely overhead that facilitates not only the
direction, Read or Write, but the maintenance commands for the DRAM.
P a g e | 5
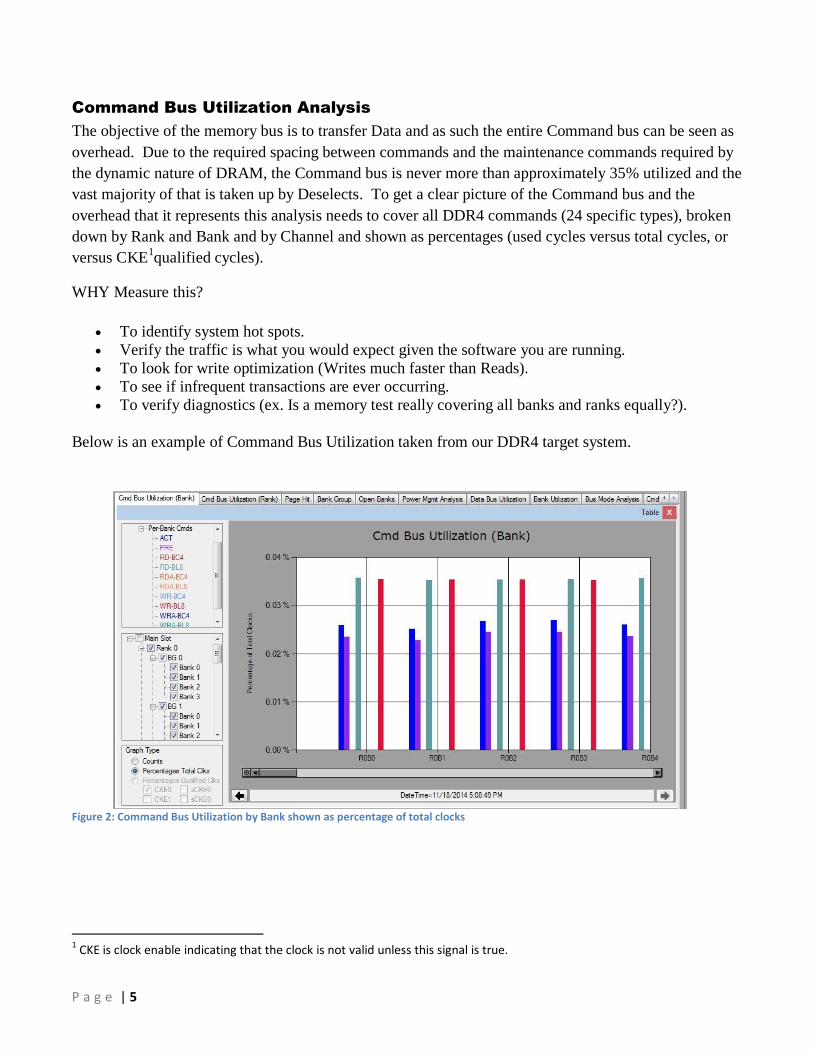
Command Bus Utilization Analysis
The objective of the memory bus is to transfer Data and as such the entire Command bus can be seen as
overhead. Due to the required spacing between commands and the maintenance commands required by
the dynamic nature of DRAM, the Command bus is never more than approximately 35% utilized and the
vast majority of that is taken up by Deselects. To get a clear picture of the Command bus and the
overhead that it represents this analysis needs to cover all DDR4 commands (24 specific types), broken
down by Rank and Bank and by Channel and shown as percentages (used cycles versus total cycles, or
versus CKE1qualified cycles).
WHY Measure this?
To identify system hot spots.
Verify the traffic is what you would expect given the software you are running.
To look for write optimization (Writes much faster than Reads).
To see if infrequent transactions are ever occurring.
To verify diagnostics (ex. Is a memory test really covering all banks and ranks equally?).
Below is an example of Command Bus Utilization taken from our DDR4 target system.
Figure 2: Command Bus Utilization by Bank shown as percentage of total clocks
1 CKE is clock enable indicating that the clock is not valid unless this signal is true.

P a g e | 6
Figure 3: Command Bus Utilizations with Deselects shown
Figure 4: Command Bus Utilization by Rank with Deselects removed to show other transactions
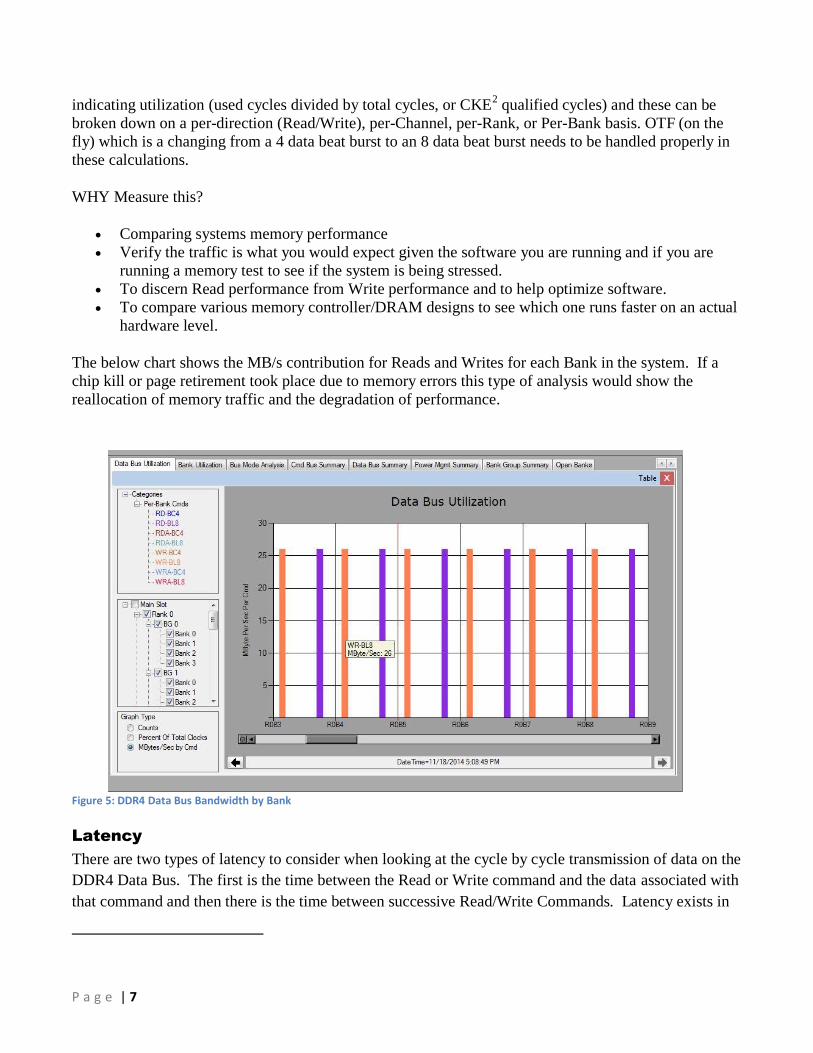
Data Bus Utilization Analysis
This is the heart of any memory subsystem performance measurement. How much data can be passed
within a second. Data bus utilizations can be expressed as rates (MB per Sec) or as percentages
P a g e | 7
indicating utilization (used cycles divided by total cycles, or CKE2 qualified cycles) and these can be
broken down on a per-direction (Read/Write), per-Channel, per-Rank, or Per-Bank basis. OTF (on the
fly) which is a changing from a 4 data beat burst to an 8 data beat burst needs to be handled properly in
these calculations.
WHY Measure this?
Comparing systems memory performance
Verify the traffic is what you would expect given the software you are running and if you are
running a memory test to see if the system is being stressed.
To discern Read performance from Write performance and to help optimize software.
To compare various memory controller/DRAM designs to see which one runs faster on an actual
hardware level.
The below chart shows the MB/s contribution for Reads and Writes for each Bank in the system. If a
chip kill or page retirement took place due to memory errors this type of analysis would show the
reallocation of memory traffic and the degradation of performance.
Figure 5: DDR4 Data Bus Bandwidth by Bank
Latency
There are two types of latency to consider when looking at the cycle by cycle transmission of data on the
DDR4 Data Bus. The first is the time between the Read or Write command and the data associated with
that command and then there is the time between successive Read/Write Commands. Latency exists in
P a g e | 8
these two cases in order to give the DRAM time to find, in the case of a READ, and accept in the case of
a Write, the data. The time between successive transactions is because the DRAM needs to recover
from the previous operation before it can accept a new one. Latency is a key factor in determining
Bandwidth.
Power Management
For DDR4 there are several ways to help reduce power consumption. They are:
PreCharge Power Down
Active Power Down
Self Refresh
Max Power Savings
Reducing the frequency and stopping the clock
Key metrics here are not only the entering of these states but how long the memory stays in these states.
In addition, additional power savings can be had if the clock is stopped during these power saving
modes. Measurement and analysis of these events is key to maximum power savings. These metrics
should show percentages (used cycles versus total cycles, or versus CKE qualified cycles) and be broken
down on a Channel, Slot, and Rank basis. Another key metric would be the amount of seconds or cycles
spent in each mode.
Why measure this?
Cost Savings
Memory Controller Code changes to increase power savings can be evaluated and verified
Software efficiency: comparing two pieces of code that accomplish the same task functionally
may be different with regards to power management.

P a g e | 9
Figure 6: DDR4 System Power Management Analysis
New Metrics
Due to the advancements in FPGA technology, FPGA based test equipment can now count every cycle,
transaction and time spent in almost all important events. This allows memory subsystem performance
measurements to be expanded to give greater insight into DDR4 performance. These new metrics are:
Bus Modes Analysis
Page Hit Analysis
Multiple Open Banks Analysis
Bank Group Analysis
Bank Utilization Analysis

P a g e | 10
Bus Modes Analysis
For DDR4 there are 11 different modes and these metrics are Rank based. These include the following:
Reset, Idle, Active, Precharge Power Down, Active Power Down, Maximum Power Down Mode, Self-
Refresh, DLL Disable, Write Leveling, MPR Mode (also known as Read leveling or Read training), and
VREF Training Mode. To make the best use of this measurement these modes should be represented by
the amount of time spent in each mode as Time (in seconds), or percentages (time spent in mode divided
by elapsed time).
WHY Measure this?
Gives engineers a relative measure as to how often various modes are entered and for what
length of time the system spends in these overhead states.
General Verification of the JEDEC specified modes of operation.
To quickly look for infrequent events.
A quick analysis of no boot scenarios.
To isolate problems in Memory Validation.
Power Management is included in this metric so it may seem like a redundant measurement but the new
insight gained is in the additional modes and how they all interrelate. Below is an example
measurement on our example DDR4 system. The real insight is gained by the second by second
playback to show the movement of the system in and out of these various modes.
Figure 7: Bus Mode Analysis shows Idle, Active and Power Management states in a single view

P a g e | 11
Page Hit Analysis
Page Hit and Miss is often a metric used to describe caching architectures. In this context a Hit is when
the page was already open and the Read/Write transaction occurred. A Miss is when an Activate3 had to
occur just prior in order to open the page. Opening a page takes time and burns power. An Unused is
when the page was opened and then closed with no transaction targeting it. Memory Controllers use
various locality of data algorithms to keep pages open to improve performance. That is, they open pages
ahead of time in order to improve Hit rate. If they guess wrong and a page was not needed it ends up
being closed without being used. This not only hurts performance because it takes time to open and
close pages, but it wastes power as an open page burns more than a closed one. To gain maximum
insight this should be broken down on a per-direction (Read or Write), per-Channel, per-Rank or per-
Bank basis. Below is an example measurement of this metric.
Figure 8: DDR4 Page Hit, Miss and Unused Analysis
WHY Measure this?
A page is an allocated space in memory that the controller must 'open' prior to reading or writing
to. If pages are allocated and never used performance and power is wasted. Measuring this
gives insight into various page allocation algorithms.
Software targeting different applications can act very differently with regards to memory page
allocation. By understanding this metric different memory architectures and software can be
designed for a better performance match.
3 Per the JEDEC DDR4 standard an Activate command opens a row (also referred to as a page) and a Precharge command closes it.
P a g e | 12
To compare various memory controller/DRAM designs to see which one runs faster with various
software applications.
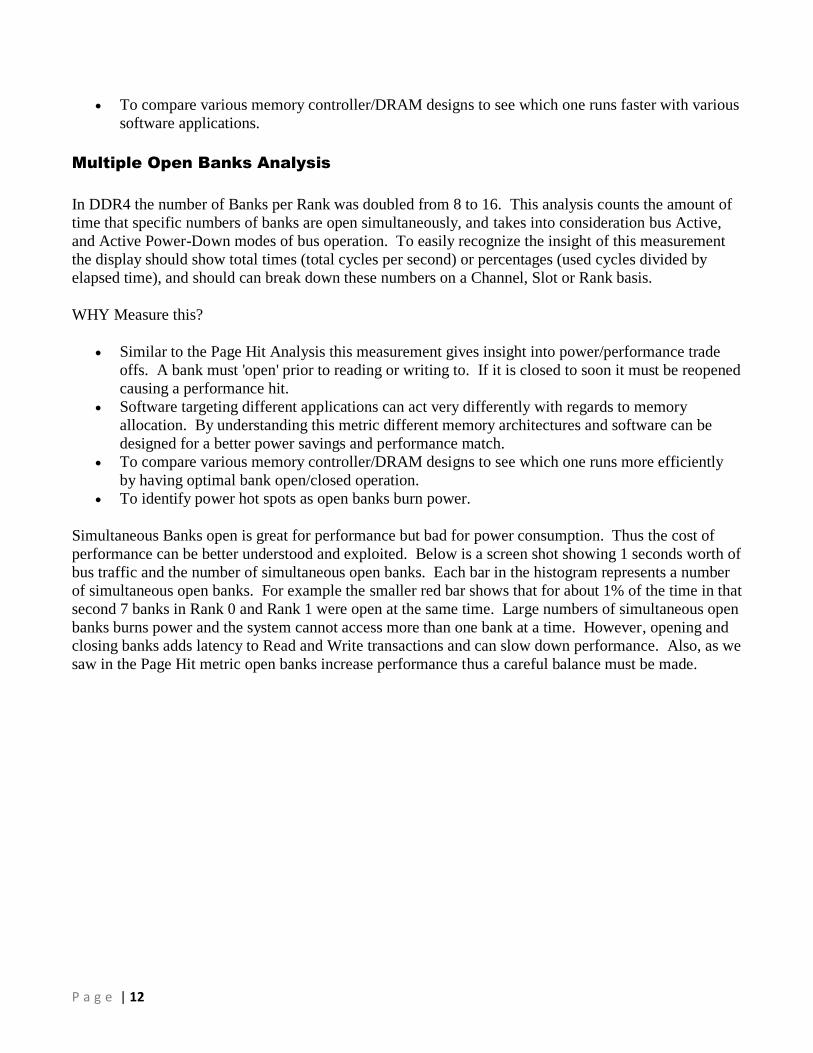
Multiple Open Banks Analysis
In DDR4 the number of Banks per Rank was doubled from 8 to 16. This analysis counts the amount of
time that specific numbers of banks are open simultaneously, and takes into consideration bus Active,
and Active Power-Down modes of bus operation. To easily recognize the insight of this measurement
the display should show total times (total cycles per second) or percentages (used cycles divided by
elapsed time), and should can break down these numbers on a Channel, Slot or Rank basis.
WHY Measure this?
Similar to the Page Hit Analysis this measurement gives insight into power/performance trade
offs. A bank must 'open' prior to reading or writing to. If it is closed to soon it must be reopened
causing a performance hit.
Software targeting different applications can act very differently with regards to memory
allocation. By understanding this metric different memory architectures and software can be
designed for a better power savings and performance match.
To compare various memory controller/DRAM designs to see which one runs more efficiently
by having optimal bank open/closed operation.
To identify power hot spots as open banks burn power.
Simultaneous Banks open is great for performance but bad for power consumption. Thus the cost of
performance can be better understood and exploited. Below is a screen shot showing 1 seconds worth of
bus traffic and the number of simultaneous open banks. Each bar in the histogram represents a number
of simultaneous open banks. For example the smaller red bar shows that for about 1% of the time in that
second 7 banks in Rank 0 and Rank 1 were open at the same time. Large numbers of simultaneous open
banks burns power and the system cannot access more than one bank at a time. However, opening and
closing banks adds latency to Read and Write transactions and can slow down performance. Also, as we
saw in the Page Hit metric open banks increase performance thus a careful balance must be made.
P a g e | 13
Figure 9: Bank Open Analysis shows the number of banks that were open at the same time and for how long.
Bank Utilization Analysis
Bank Utilization Analysis gives a broader picture of how many cycles or what percentage of time a bank
is open. As previously mentioned open banks are good for performance, but not for power
consumption. This can be measured as the amount of time, in seconds, or cycles (per second) that each
bank is Active (open). Percentages are also useful (Active time divided by elapsed time, or Active
cycles versus qualified cycles).
WHY Measure this?
To identify system hot spots.
Verify the traffic is what you would expect given the software you are running.
To look for underutilized portions of memory (why have it if it never gets used!).
To verify if diagnostic software is really touching every bank.
Below is a chart showing Bank Utilization on our example DDR4 system.
7 banks open
simultaneously

P a g e | 14
Figure 10: Bank Utilization shows how long during the last second each bank was open or 'active'.
Bank Group Analysis
In DDR4 the concept of a Bank Group was created. A Bank Group consists of four Banks and since
there are 16 Banks per Rank there are 4 Bank Groups per Rank for DDR4. This analysis looks at
consecutive Read/Write operations to see how many stay within the Bank Group, which is not favored
for performance. Consecutive transactions to different Bank Groups results in lower latency thus
improves performance.4 Consecutive transactions to the same Bank Group must be spaced by an
additional clock cycle thus are discouraged. By understanding the nature of consecutive transactions
memory controller parameters, on a workload basis, can be tuned to optimize performance.
The 8 categories are:
Read to Read same Bank Group
Read to Write same Bank Group
Write to Write same Bank Group
Write to Read same Bank Group
Read to Read different Bank Group
Read to Write different Bank Group
Write to Write different Bank Group
Write to Read different Bank Group
4 This is because the JEDEC standard dictates this increased spacing between consecutive transactions targeting the same Bank Group.

P a g e | 15
The below chart shows one seconds worth of capture for this metric. The display can calculate and
show rates (events per second) or percentages and breaks down these numbers on a Rank basis.
Figure 11: Bank Group Analysis shows the rate at which consecutive transactions take the performance path of going to different bank groups or the performance hit of going to the same bank group.
Summary
This paper has examined the traditional performance metrics of Bandwidth, Latency and Power
Management and explained why they are important and how to measure them on a DDR4 based
memory subsystem. It also has suggested new performance metrics that if used can make DDR4 a
robust, cost effective and long lived technology for Cloud Computing Servers. By understanding the
role of each portion of the subsystem, the DRAM, the Memory Controller and the Software Application
we can make changes that increase performance and lower costs. But before we make those changes we
must first thoroughly characterize the memory subsystem performance to insure that the changes made
result in increased performance and/or power savings. In addition, we can use these new metrics to
perform detailed workload analysis on a second by second basis in order to create architectures that
perform best based on workload. This type of analysis can also lead to a hardware implementation,
memory controller settings and algorithms that are personalized to a specific workload versus a generic
one size fits all approach that currently exists.

![DesignCon 2014 - SiSoft...1 DesignCon 2014 How Design of Experiments Saved my CEI VSR 28G Design Richard Allred, SiSoft [rallred@sisoft.com] Barry Katz, SiSoft Ishwar Hosagrahar, Inphi](https://static.documents.pub/doc/80x56/5f19284848bb9016ff191954/designcon-2014-sisoft-1-designcon-2014-how-design-of-experiments-saved-my.jpg)


