DESIGNING TURBINE ENDWALLS FOR DEPOSITION RESISTANCE WITH 1400C COMBUSTOR EXIT TEMPERATURES AND SYNGAS WATER VAPOR LEVELS Brian Casaday, Josh Webb, Carlos Bonilla Dr. Ali Ameri, Dr. Jeffrey Bons “THE” OHIO STATE UNIVERSITY Robert Laycock, Dr. Thomas Fletcher “THE” BRIGHAM YOUNG UNIVERSITY (3-year grant awarded Oct 2008 – 6 Month Extension) 1
Transcript
DESIGNING TURBINE ENDWALLS
FOR DEPOSITION RESISTANCE
WITH 1400C COMBUSTOR EXIT
TEMPERATURES AND SYNGAS
WATER VAPOR LEVELS
Brian Casaday, Josh Webb, Carlos Bonilla
Dr. Ali Ameri, Dr. Jeffrey Bons
“THE” OHIO STATE UNIVERSITY
Robert Laycock, Dr. Thomas Fletcher
“THE” BRIGHAM YOUNG UNIVERSITY
(3-year grant awarded Oct 2008 – 6 Month Extension)1
MOTIVATION/NEED
2
• Operational Issues
-Fuel flexibility (range of feedstock heat release)
-Diluent use (e.g. steam)
-Filtration requirements
• Technical Challenges
- Higher firing temperature
- Increased heat transfer (steam diluent)
- Potential for increased levels of airborne contaminants
- Deposition rate increases with temperature
- Advanced cooling, greater reliance
OBJECTIVES
3
The objectives of this work are to study turbine deposition
at elevated gas temperatures and water vapor levels
AND
explore modifications to turbine endwall geometries that
reduce the potential for degradation due to deposition.
The effort includes both experimental and computational
components, with work divided into three phases.
1) Modeling and Experimental Validation
2) CFD and Experimental Endwall Design Study
3) CFD Design Study with Cooling & Experiments with
Steam
RESEARCH TEAM
4
Dr. Thomas FletcherProfessorDepartment of Chemical EngineeringBrigham Young UniversityProvo, UT
Dr. Jeffrey BonsProfessorDepartment of Mechanical and Aerospace EngineeringOhio State UniversityColumbus, OH
Dr. Ali AmeriResearch ScientistDepartment of Mechanical and Aerospace EngineeringOhio State UniversityColumbus, OH
TEAM LEADFocus: Experimental Heat Transfer and Deposition Measurements in OSU Turbine Reacting Flow Rig
Co-PIFocus: Deposition Model Development and Heat Transfer CFD
Co-PIFocus: Experimental Work in BYU’s Turbine Accelerated Deposition Facility with Elevated Temperatures (1400C) and Steam Injection
• Film cooling from vane casing and hub (density ratio 1.6-2.0)
• Ash particulate feed in combustion chamber (10
m MMD)
6
Steel Base
Equilibration Tube
Cone
Spool Piece
View Section
Viewports
Transition Piece
Sealing System
Vane Holder
OSU’s Turbine Reacting Flow Facility (TuRFR)
7
Film Cooling Supply
Circular to Rectangular Transition
Top Section/
Vane container
Rectangular to Annular Transition
Vane Holder and Upstream Conditioning
Interchangeable Dilution Plates for Pattern Factors
Dilution Jet Supply
8
OSU - TuRFR
Film Cooling Inlet
Dilution Jet
Inlet
Vane Specific
Hardware
Common
Hardware
Camera
Image
Typical TuRFR Test Profile
9
0
500
1000
1500
2000
2500
0 1 2 3 4
Tt4
[d
egr
ee
s F]
Time [hr]
Ash
Par
ticu
late
In
ject
ion
After
Before
10
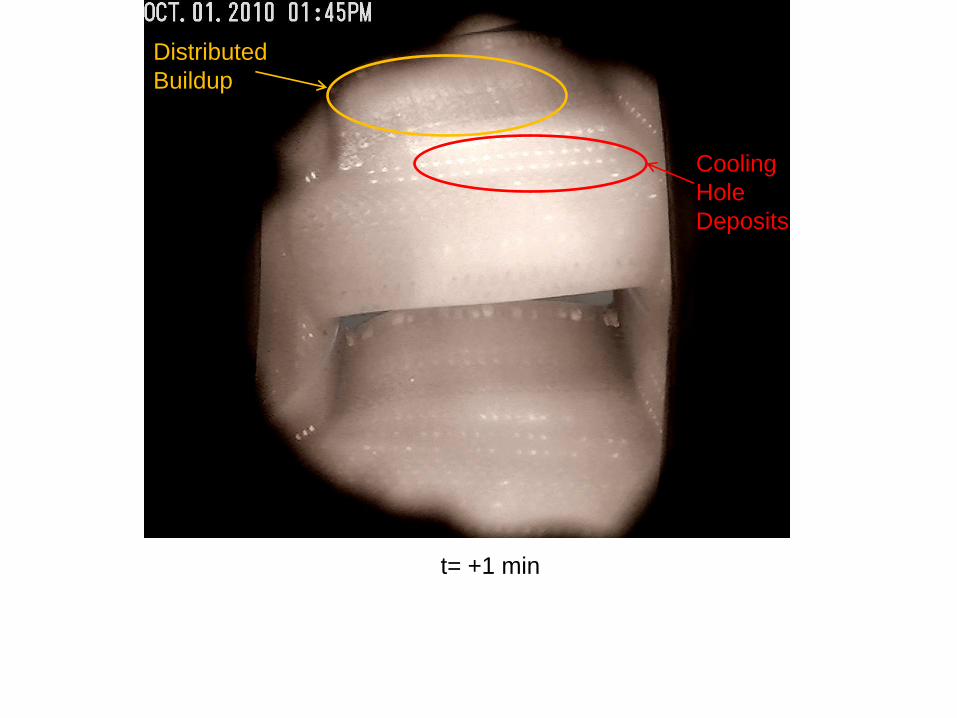
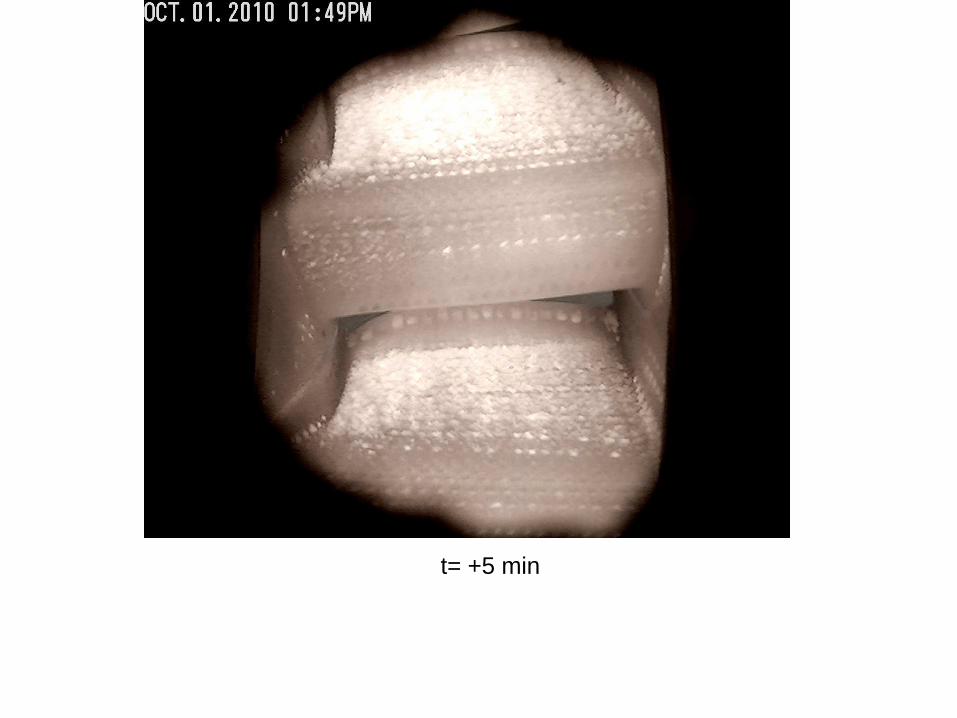
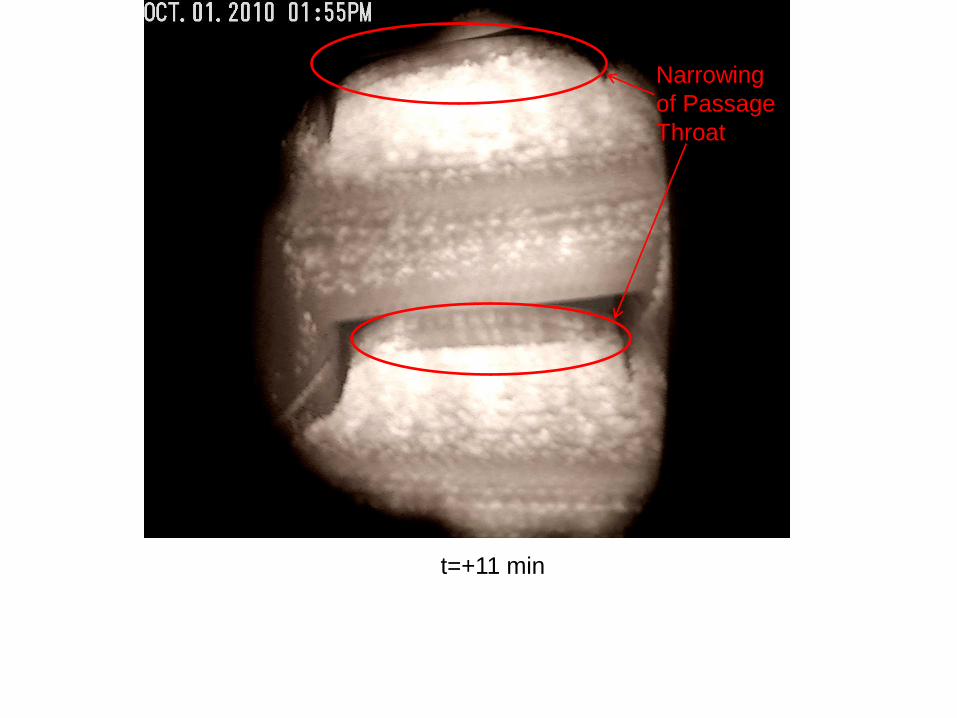
TuRFR Results
Typical Test Run
Test on 10/1/10
Wyoming (Jim Bridger Power Station)
Sub-Bituminous Ash (from BYU)
Test Conditions: ~1900 F; M=0.09; No Cooling
t=0 sec
t= +30 sec
t= +1 min
Distributed
Buildup
Cooling
Hole
Deposits
t= +2 min
t= +3 min
t=+4 min
t= +5 min
t=+6 min
t=+7 min
t=+8 min
t=+9 min
t=+10 min
t=+11 min
Narrowing
of Passage
Throat
Final Deposit Image
OBSERVATIONS
•Deposit builds from mid-chord on pressure
surface forward to leading edge.
•Film cooling holes are sites for deposition
initiation (whether or not they are blowing)
• Narrowing of passage throat
Test on 10/1/10
Wyoming (Jim Bridger Power Station)
Sub-Bituminous Ash (from BYU)
Test Conditions: ~1900 F; M=0.09;
No Film Cooling
Post Test Diagnostics
25
• Scanning Electron Microscopy reveals deposit structure.• Xray Diffraction Spectroscopy reveals deposit chemistry.• Courtesy of Dr. Padture’s student, Andrew Gledhill
Deposit Microscopy
Pre Test Scan
Post Test Scan
Surface Metrology
Deposit height indicated in contour map relative to Pre-
Test Datum
26
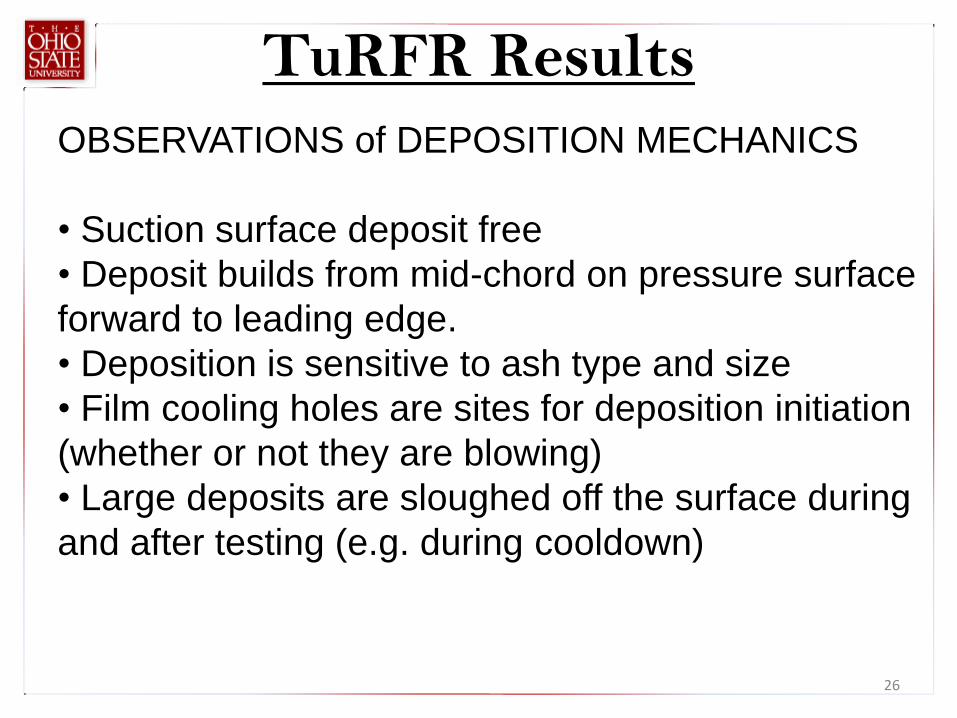
TuRFR Results
OBSERVATIONS of DEPOSITION MECHANICS
• Suction surface deposit free
• Deposit builds from mid-chord on pressure surface
forward to leading edge.
• Deposition is sensitive to ash type and size
• Film cooling holes are sites for deposition initiation
(whether or not they are blowing)
• Large deposits are sloughed off the surface during
and after testing (e.g. during cooldown)
Ash Deposition Modeling
• Flow solution using FLUENT– Commercially available– Solves discretized flow equations to
predict fluid dynamics– k- turbulence model
• Deposition Models – developed in C language and
incorporated as User-Defined Functions in Fluent
• Turbine grid made using GridPro– VKI Turbine Vane– GE-E3 Turbine Vane
28
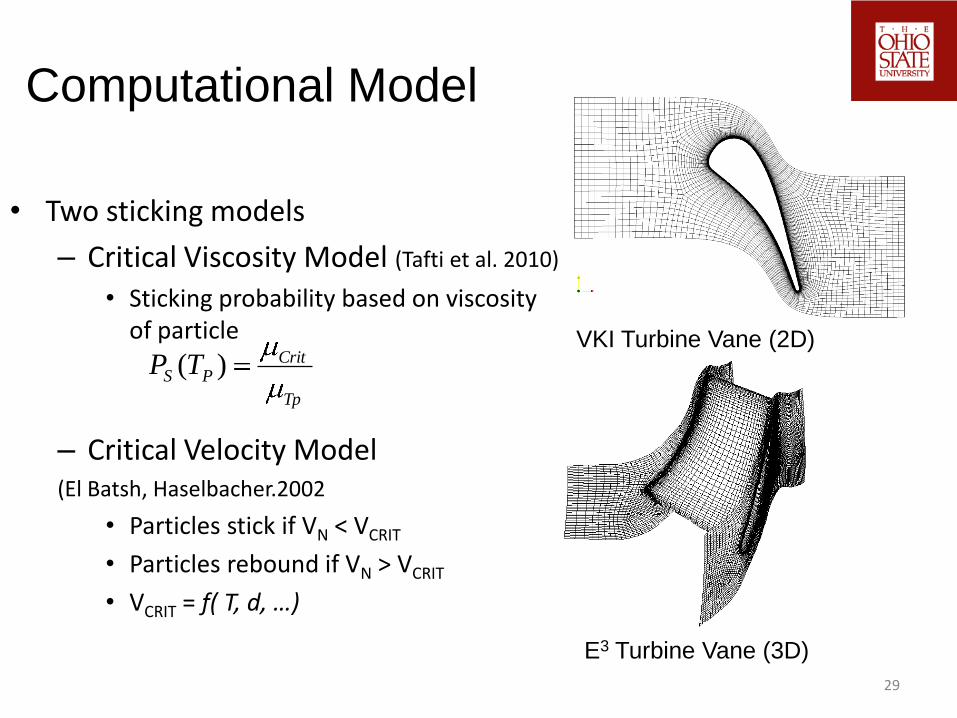
VKI Turbine Vane (2D)
E3 Turbine Vane (3D)
Computational Model
• Two sticking models
– Critical Viscosity Model (Tafti et al. 2010)
• Sticking probability based on viscosity of particle
– Critical Velocity Model (El Batsh, Haselbacher.2002
• Particles stick if VN < VCRIT
• Particles rebound if VN > VCRIT
• VCRIT = f( T, d, …)
29
VKI Turbine Vane (2D)
E3 Turbine Vane (3D)
Computational Model
Tp
CritPS TP )(
Particle Trajectories
30
1 μm particles
(Stk = 0.01)10 μm particles
(Stk = 1.0)
50 μm particles
(Stk = 25)
c
ipp
kl
VdSt
18
2
• Small particles less likely to impact surface
• Particles larger than 10 m (Stk = 1) nearly 100%
likely to impact surface• Particles not allowed to
rebound or impact multiple times
31
10-1
100
101
102
0
10
20
30
40
50
60
70
80
90
100
Stk
Imp
act E
ffic
ien
cy %
1 10 100
0
10
20
30
40
50
60
70
80
90
100
diameter ( m)
Simulation Results-Particle Size Effect
Simulation Results-Particle Size Effect
32
• Multiple impacts allowed• Impact efficiencies similar for both models• Large particles impact surface multiple times• Sticking efficiencies very different for each model
10-1
100
101
102
0
10
20
30
40
50
60
70
80
90
100
Stk
Stickin
g E
ffic
ien
cy %
Critical Velocity
Critical Viscosity
1 10 100
0
10
20
30
40
50
60
70
80
90
100
diameter ( m)
10-1
100
101
102
0
20
40
60
80
100
120
140
160
180
200
Stk
Imp
act E
ffic
ien
cy %
Critical Velocity
Critical Viscosity
1 10 100
0
40
80
120
160
200
diameter ( m)
Simulation Results-Particle Size Effect
33
10-1
100
101
102
0
10
20
30
40
50
60
70
80
90
100
Stk
Ca
ptu
re E
ffic
ien
cy %
Critical Velocity
Critical Viscosity
1 10 100
0
10
20
30
40
50
60
70
80
90
100
diameter ( m)• Critical Velocity model
predicts range of particles likely to stick (Stk from 0.05 to 1.0)
• Critical Viscosity model predicts larger particles more likely to stick
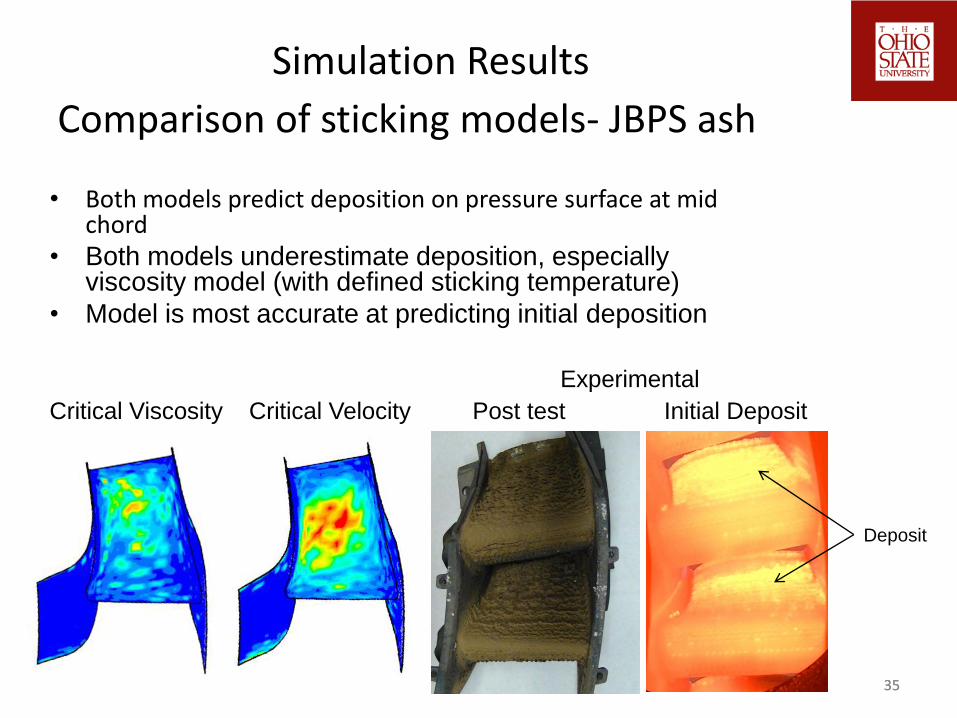
Simulation Results
Comparison of sticking models- JBPS ash
34
Critical VelocityCritical Viscosity
Total Injected
#
Impact
Efficiency %
Sticking
Efficiency %
Capture
Efficiency %
Critical Velocity
Model18900 112 10.6 12.0
Critical
Viscosity Model18900 124 6.2 7.7
Experimental - - - ~20.0
Experimental
Deposit
Post test Initial Deposit
Simulation Results
35
• Both models predict deposition on pressure surface at mid chord
• Both models underestimate deposition, especially viscosity model (with defined sticking temperature)
• Model is most accurate at predicting initial deposition
• Hub endwall was redesigned with less severe inlet angle
NG
V
Radia
l
Location
Axial Location
Case Endwall
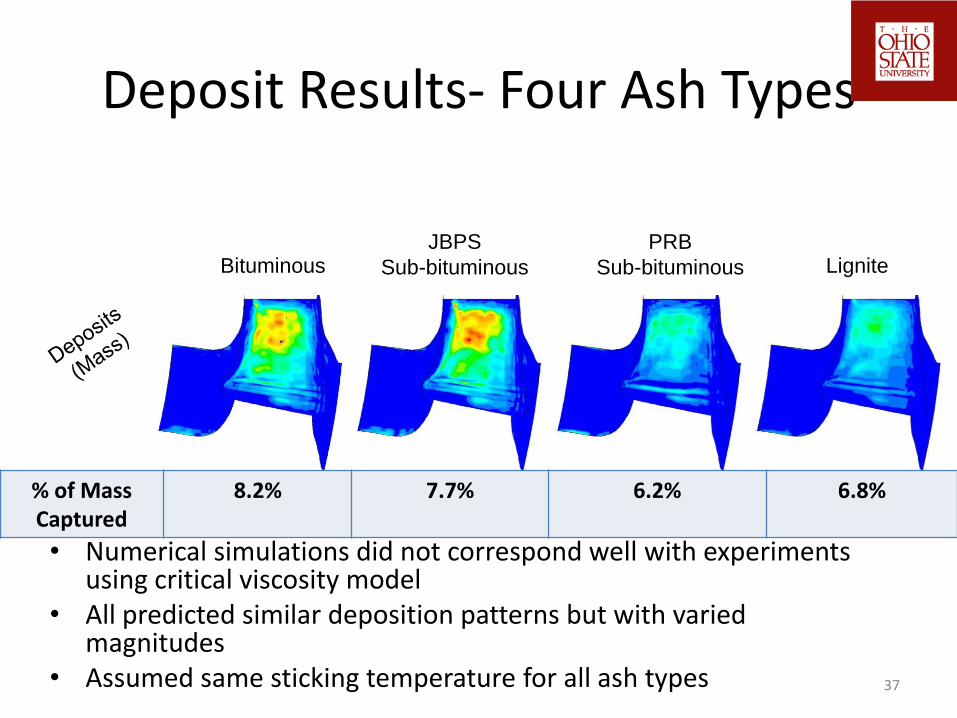
• Results showed slight difference in deposition rates
• Difference likely due to extended inletboundary condition affecting passage flow fields, rather than endwall modification
Ou
tle
t
Inle
t
Inle
t
Endwall Modifications
• Endwall extended upstream• Inlet planes identical• Allowed for more realistic
turbulent dispersion of particles
NG
V
Radia
l
Location
Axial Location
• Deposition rates identical for both extended endwalldesigns
Ou
tle
t
Ne
w I
nle
t
Old
In
let
Old
In
let
Case Endwall
Flat Endwall Studies
• Investigate how particulate deposits on endwalls.
• Ran tests using a flat plate with a cylindrical leading edge
• Rolls Royce high pressure vane with flat endwalls
x (in) Contours are deposition rate in mm/g
y (
in)
-1 -0.5 0 0.5 1 1.5 2-1
-0.5
0
0.5
1
0
0.02
0.04
0.06
0.08
0.1
angle (deg)
z (
in)
0 15 30 45 60 75 900
0.1
0.2
0.3
0.4
0.5
0.6
0.7
0.8
0.9
1
0
0.01
0.02
0.03
0.04
0.05
0.06
0.07
0.08
0.09
0.1
g
mm
Flat Endwall Studies – Flat Plate Leading Edge
5 micron Particles, Stk = 0.25 Re = 12.7K
Leading Edge Deposition (by angle)
Endwall Deposition
Part
icle
Concentr
ation
-0.25 Inches from Leading Edge
X (in)
Y (
in)
0 0.1 0.2 0.3 0.4 0.5 0.6 0.7 0.8 0.9 10
0.1
0.2
0.3
0.4
0.5
0.6
0.7
0.8
0.9
1
Part
icle
Concentr
ation
0.25 Inches from Leading Edge
X (in)
Y (
in)
0 0.1 0.2 0.3 0.4 0.5 0.6 0.7 0.8 0.9 10
0.1
0.2
0.3
0.4
0.5
0.6
0.7
0.8
0.9
1
Part
icle
Concentr
ation
0.75 Inches from Leading Edge
X (in)
Y (
in)
0 0.1 0.2 0.3 0.4 0.5 0.6 0.7 0.8 0.9 10
0.1
0.2
0.3
0.4
0.5
0.6
0.7
0.8
0.9
1
Part
icle
Concentr
ation
1.25 Inches from Leading Edge
X (in)
Y (
in)
0 0.1 0.2 0.3 0.4 0.5 0.6 0.7 0.8 0.9 10
0.1
0.2
0.3
0.4
0.5
0.6
0.7
0.8
0.9
1
x (in) Contours are deposition rate in mm/g
y (
in)
-1 -0.5 0 0.5 1 1.5 2-1
-0.5
0
0.5
1
0
0.02
0.04
0.06
0.08
0.1
Flat Endwall Studies – Particle Concentration
Pla
te
Pla
te
Pla
te
• Largest Deposition rates near leading edge.• Even these deposition rates on endwalls are generally less than half of the magnitude of deposition on leading edges (or pressure surface).• Larger particles responsible for deposition on vane surfaces. Alternatively, smaller particles are more susceptible to deposit on endwalls.• Vane deposition dominated by inertial impaction. Endwall deposition due to turbulent dispersion, secondary flows, or particle concentration.
Deposition Rate in mm/g
x (m)
y (
m)
-0.02 -0.01 0 0.01 0.02-0.03
-0.02
-0.01
0
0.01
0.02
0.03
0.04
0.05
0.06
0
0.005
0.01
0.015
0.02
0.025
0.03
0.035
0.04
0.045
0.05
Flat Endwall Studies – Vane Endwall
x (in) Contours are deposition rate in mm/g
y (
in)
-1 -0.5 0 0.5 1 1.5 2-1
-0.5
0
0.5
1
0
0.02
0.04
0.06
0.08
0.1
g
mm
5 micron Particles, Stk = 0.25 Re = 12.7K
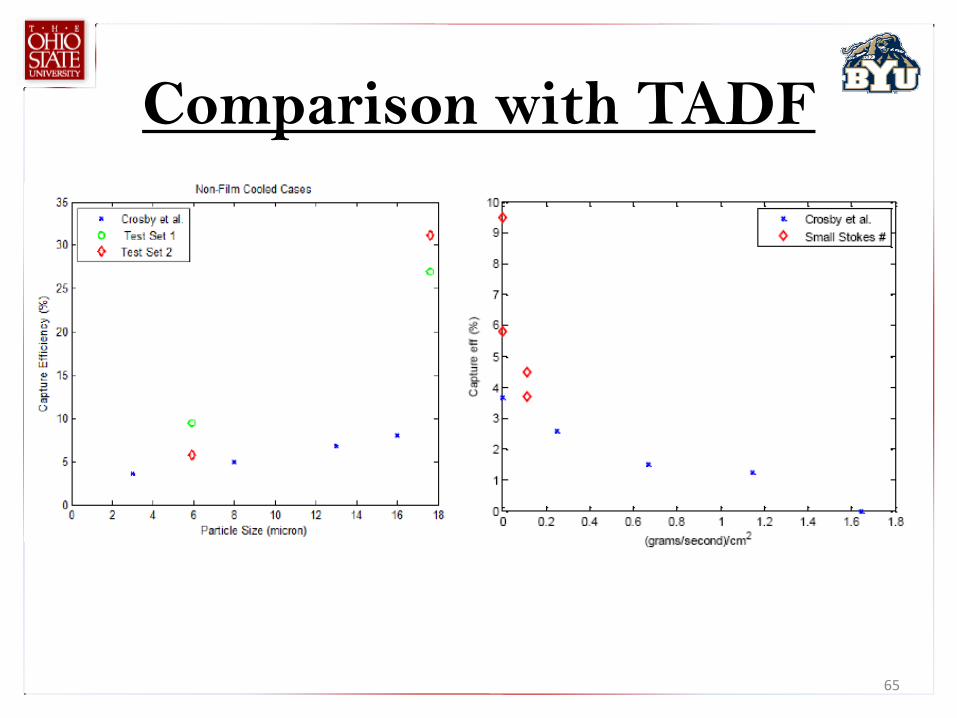
Flat Endwall Studies – Comparison with Experiments
Lawson, Thole (2011)
Deposition Rate in mm/g
x (m)y (
m)
-0.02 -0.01 0 0.01 0.02-0.03
-0.02
-0.01
0
0.01
0.02
0.03
0.04
0.05
0.06
0
0.005
0.01
0.015
0.02
0.025
0.03
0.035
0.04
0.045
0.05
Faired Cylinder TuRFR test
• Leading edge endwalldeposition and secondary flow patterns observable in experiments, especially with low Stk number
• Endwall deposition minor compared to leading edge.
Flow
Film Cooling –Transpiration Cooling
50
1400
1000
1300
1200
1100
900
Temperature (K)
-0.02 -0.01 0 0.01 0.02 0.03 0.04 0.05
-0.05
-0.04
-0.03
-0.02
-0.01
0
-0.02 -0.01 0 0.01 0.02 0.03 0.04 0.05
-0.05
-0.04
-0.03
-0.02
-0.01
0
• Film cooling reduced deposition by 80% for 6 m diameter particles
• Reduced trailing edge deposition for small Stk particles, but not as much as is seen in experiments.
• Little change for large Stk
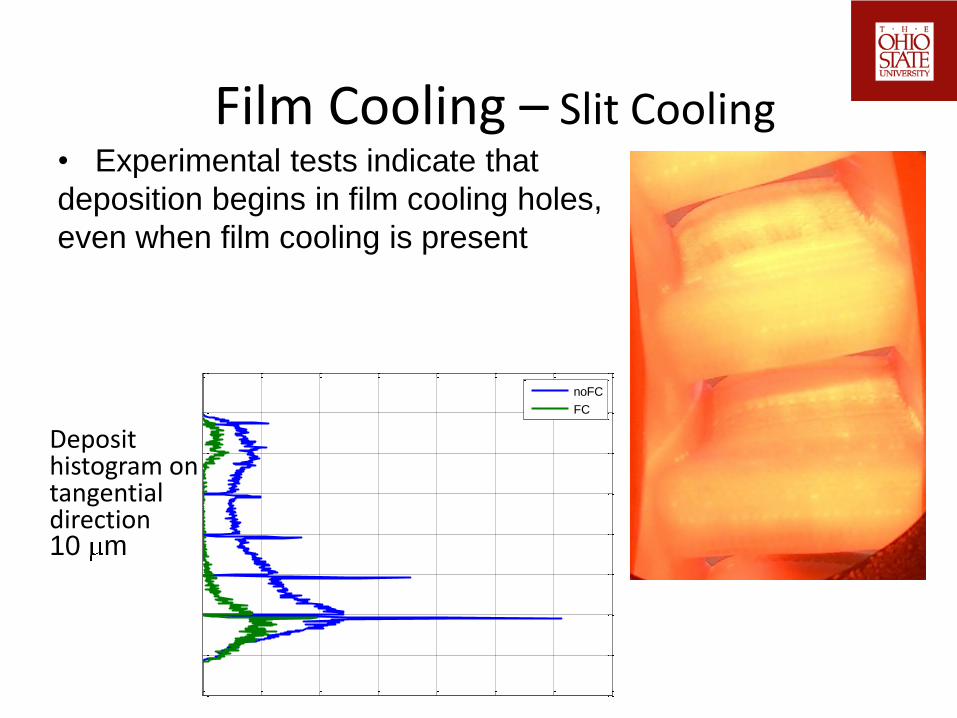
Film Cooling – Slit Cooling• Similar results as transpiration cooling
• Leeward side of film cooling “holes” are
sites for much larger deposition rates.
• Average deposition not significantly
changed in hole locale
• Same limitations as transpiration
cooling.
0 50 100 150 200 250 300 350-0.06
-0.05
-0.04
-0.03
-0.02
-0.01
0
0.01
0.02
y (
m)
noFC
FC
Deposit histogram on tangential direction 10 m
Film Cooling – Slit Cooling• Experimental tests indicate that
deposition begins in film cooling holes,
even when film cooling is present
0 50 100 150 200 250 300 350-0.06
-0.05
-0.04
-0.03
-0.02
-0.01
0
0.01
0.02
y (
m)
noFC
FC
Deposit histogram on tangential direction 10 m
53
Effect of Stokes Number
and Film Cooling on
Deposition
Experimental Data
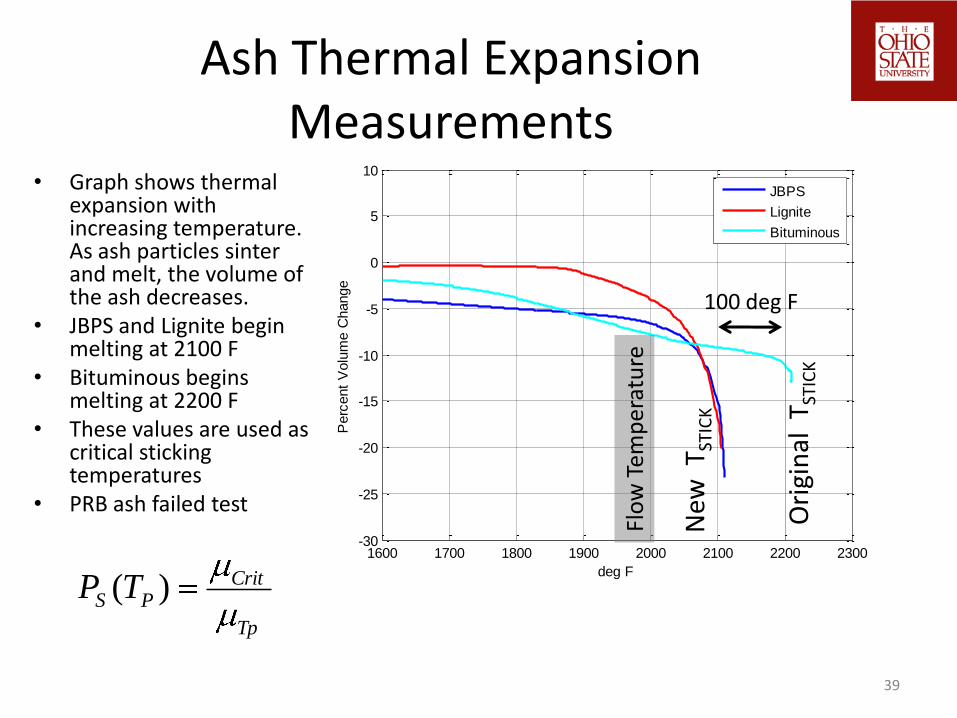
Ash Characterization
Averaged Particle Size Distributions for JBPS Coal Fly Ash