by Suzanne Fitzpatrick, Glen Bramley, Filip Sosenko and Janice Blenkinsopp with Jenny Wood, Sarah Johnsen, Mandy Littlewood and Beth Watts, I-SPHERE, Heriot-Watt University. Destitution in the UK 2018 This report identifies the number of people who were pushed into destitution during 2017, looking at the causes, solutions and context to destitution in the UK.
Transcript
by Suzanne Fitzpatrick, Glen Bramley, Filip Sosenko and Janice Blenkinsopp with Jenny Wood, Sarah Johnsen, Mandy Littlewood and Beth Watts,
I-SPHERE, Heriot-Watt University.
Destitution in the UK 2018
This report identifies the number of people who were pushed into destitution during 2017, looking at the causes, solutions and context to destitution in the UK.
June 2018 www.jrf.org.uk
Destitution in the UK 2018 Suzanne Fitzpatrick, Glen Bramley, Filip Sosenko and Janice Blenkinsopp with Jenny Wood, Sarah Johnsen, Mandy Littlewood and Beth Watts
It is unacceptable that anyone should face destitution in the UK. Yet this report estimates that over 1.5 million people, including 365,000 children, were destitute in the UK at some point during 2017. They could not afford to buy the bare essentials that we all need to eat, stay warm and dry, and keep clean. People experiencing long-term poverty were typically tipped into destitution by harsh debt recovery practices (mainly by public authorities and utilities companies); benefit delays, gaps and sanctions; financial and other pressures associated with poor health and disability; high costs of housing, fuel and other essentials; and, for some migrants, extremely low levels of benefits or no eligibility for benefits at all.
Actions • Universal Credit should ensure that benefit gaps, sanctions and freezes no longer drive large-scale
destitution among the UK working-age population.
• The Department for Work and Pensions and other public authorities must address the serious consequences of uncoordinated debt recovery practices that can leave people with almost nothing to live on.
• Local welfare assistance funds should be embedded across England to provide emergency relief for people facing destitution, drawing on the positive lessons of the national schemes in other UK countries.
• A decent level of subsistence benefits and accommodation should be made available to all people living in the UK, regardless of age or immigration status, so that no-one goes hungry or is forced to live on the streets.
We can solve UK poverty JRF is working with governments, businesses, communities, charities and individuals to solve UK poverty. Destitution in the UK 2018 is a key focus of our strategy to solve UK poverty.
i
Contents
List of abbreviations 1
Executive summary 2
1 Introduction 6
Background 6
Study aims 7
Report structure 7
Report context 7
2 Methods 8
Overview 8
The definition of destitution 8
Quantitative research 10
Qualitative research 12
3 The scale and distribution of destitution in the UK in 2017 13
Introduction 13
National estimates of destitution and change since 2015 13
Unpacking the definition of destitution 14
The profile of people affected by destitution 16
Housing and living arrangements 18
The three main destitute sub-groups 20
The geography of destitution 23
Conclusion 26
4 Routes into destitution in the UK 27
Introduction 27
Destitute respondents' experiences over the past 12 months 27
Sustained low income 29
Debt-related issues 30
Benefit-related issues 33
Disability- and sickness-related issues 36
Employment-related issues 36
Relationship breakdown 37
Factors specific to migrants 37
Conclusion 38
5 Coping with, and moving on from, destitution 39
ii
Introduction 39
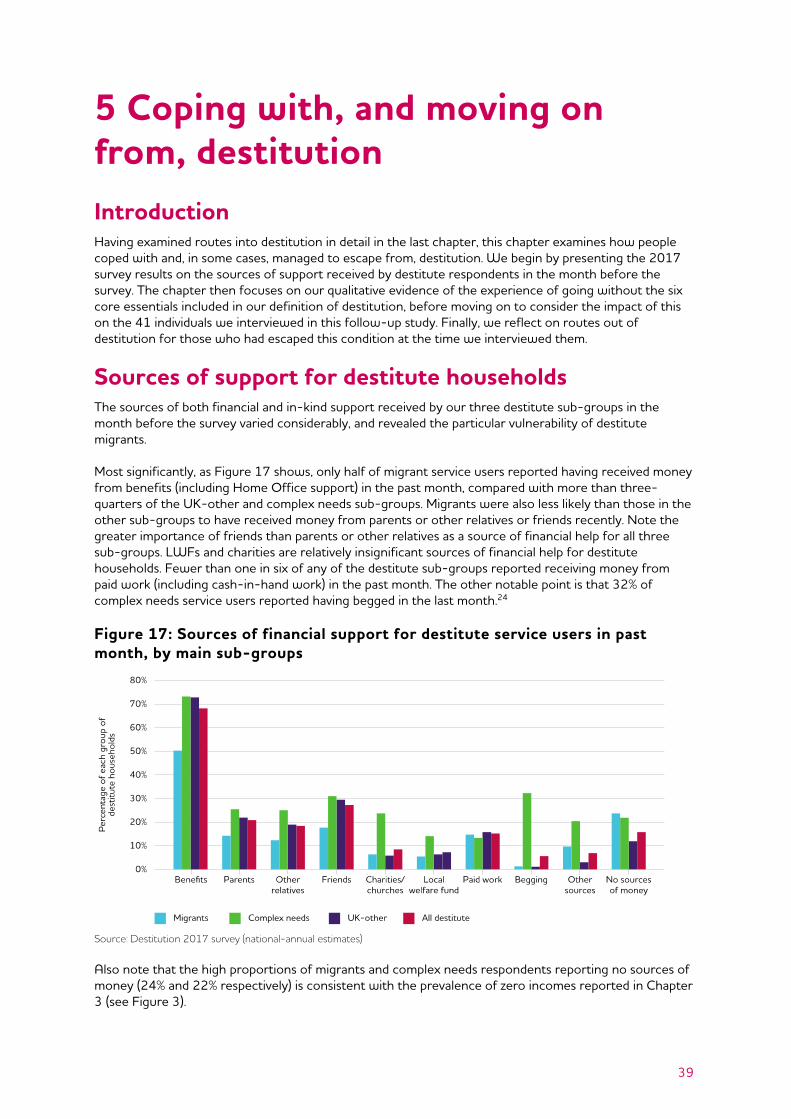
Sources of support for destitute households 39
Experiences of destitution 40
The impact of destitution 44
Routes out of destitution 47
Conclusion 49
6 Conclusions 50
Introduction 50
The scale and trends in destitution 50
Routes into destitution 50
Coping with, and finding a route out of, destitution 51
Policy implications 52
Notes 54
References 56
Appendix 1: Questionnaire 2017 59
Appendix 2: Topic guide for qualitative interviews 67
Acknowledgements 70
About the authors 71
List of figures
1 Definitional breakdown of destitute households 14
2 Essentials lacked in preceding month 15
3 Banded weekly income level of destitute households 15
4 Household type of destitute, severely poor and all UK households 16
5 Broad age groups of destitute, severely poor and all UK households 17
6 Summary of migration profile of destitute households 17
7 Status categories for destitute respondents who had applied for
asylum, 2017 and 2015 comparison in original case study areas and
services
18
8 Current living arrangements of destitute respondents 19
9 Housing tenure of destitute, severely poor and all households 19
10 Household type composition of three main sub-groups of destitute
households
20
11 Age group of three main sub-groups of destitute household heads 21
iii
12 Deprivations over past month reported by three main sub-groups of
destitute households 21
13 Income levels reported by three main sub-groups of destitute
households 22
14 Living arrangements by three main sub-groups of destitute
households 22
15 Expected rate of destitution based on secondary indicators in decile
bands 24
16 Problems/issues experienced in last 12 months by destitute service
users in three main sub-groups (grouped problems) 28
17 Sources of financial support for destitute service users in past month,
by main sub-groups 39
18 Sources of in-kind support for destitute service users in past month,
by main sub-groups 40
List of tables
1 Comparing the features of the destitution 2015 and 2017 surveys 10
2 Top decile of local authorities in expected destitution rates, showing
deciles for each component 25
1
List of abbreviations BHPS British Household Panel Survey CEE Central and Eastern Europe CPAG Child Poverty Action Group DHP Discretionary housing payment DLA Disability Living Allowance DRO Debt Relief Order DWP Department for Work and Pensions EEA European Economic Area ESA Employment Support Allowance EU European Union FRS Family Resources Survey GB Great Britain HMRC Her Majesty's Revenue and Customs JRF Joseph Rowntree Foundation JSA Jobseeker’s Allowance LFS Labour Force Survey LWF 1 Local welfare funds1 MIS Minimum Income Standard NRPF No recourse to public funds PIP Personal Independence Payment PSE UK Poverty and Social Exclusion Survey (2012) UKHLS UK Household Longitudinal Study (‘Understanding Society’) WRAG Work-related activity group UC Universal Credit
2
Executive summary Key points It is unacceptable that anyone should face destitution in the UK. Yet this report estimates that 1,550,000 people, including 365,000 children, were destitute in the UK at some point during 2017. This means they could not afford to buy the bare essentials we all need to eat, stay warm and dry, and keep clean. Destitution typically occurs against a backdrop of sustained poverty and long-term hardship. People are generally pushed from severe poverty into absolute destitution by some combination of debt, benefit and health problems. Other key triggers include unaffordable housing and, for some migrants, extremely low levels of benefits or no eligibility for benefits at all. While some migrant groups face disproportionate risks of destitution, three-quarters of those destitute in the UK were born here. Risks of destitution are concentrated among younger single men under 35 years old. Almost all destitute people live in rented accommodation or are staying in temporary or shared arrangements or are sleeping rough. Very few home-owners or older people are affected by destitution. Destitution is clustered mainly in northern cities with a history of de-industrialisation, together with a number of London boroughs and other places with a similar history of de-industrialisation. Levels of destitution have declined by approximately 25% since 2015. This trend is almost certainly associated with a significant recent fall in Jobseeker’s Allowance sanctions. However, there is a very real risk that destitution will rise again if Universal Credit continues to roll out with its currently high sanction rate.
Introduction This report examines the scale, nature and drivers of destitution in the UK in 2017, updating a similar study in 2015. It is based on in-depth case studies of destitution in 16 locations across the UK, including a user survey of 103 crisis services, and in-depth interviews with 41 people affected by destitution. Secondary analysis of existing quantitative gave us national-level estimates.
The people affected by destitution We estimate that approximately 1,550,000 people, 365,000 of them children, were destitute in UK at some point in 2017. This estimate focuses exclusively on people in touch with crisis services whose circumstances fitted a strict definition of destitution endorsed by the general public (see below).
Definition of destitution
People are destitute if: a) They have lacked two or more of these six essentials over the past month, because they cannot afford them:
shelter (have slept rough for one or more nights) food (have had fewer than two meals a day for two or more days) heating their home (have been unable to do this for five or more days) lighting their home (have been unable to do this for five or more days) clothing and footwear (appropriate for weather) basic toiletries (soap, shampoo, toothpaste, toothbrush).
3
To check that the reason for going without these essential items was that they could not afford them we: asked respondents if this was the reason; checked that their income was below the standard relative poverty line (ie 60% of median income 'after housing costs' for the relevant household size); and checked that they had no or negligible savings. OR b. Their income is so extremely low that they are unable to purchase these essentials for themselves. We set the relevant weekly 'extremely low' income thresholds by averaging: the actual spend on these essentials of the poorest 10% of the population; 80% of the JRF 'Minimum Income Standard' costs for equivalent items; and the amount that the general public thought was required for a relevant sized household to avoid destitution. The resulting (after housing costs) weekly amounts were £70 for a single adult living alone, £90 for a lone parent with one child, £100 for a couple, and £140 for a couple with two children. We also checked that households had insufficient savings to make up for the income shortfall.
While some groups of migrants face disproportionate risks of destitution, 75% of those destitute in the UK in 2017 were born here. The highest risks of destitution are faced by single men aged under 35. Destitution or severe poverty are both extremely rare in the 65-plus age group. Two-thirds of destitute households live in their own house or flat, with the remaining one-third staying in some form of temporary or shared accommodation or sleeping rough. Most of those with their own accommodation live in social housing (60%), 35% are in the private rented sector, while home-ownership is a rarity (3%). Destitution is clustered in northern cities with a history of de-industrialisation, and in several London boroughs. Rates of destitution are low in affluent suburban and rural or small town districts in the southern part of England.
Routes into destitution There is no single cause of destitution, but several interacting factors. For the ‘UK-other’ (not migrant and without complex needs) destitute group, who are 68% of the total, the crushing effect of multiple debts, and harsh recovery practices on the part of public authorities, is particularly strong. Benefit gaps, delays and freezes, as well as sanctions, are key triggers to destitution. Disability and ill-health are common complicating factors. Housing Benefit restrictions mean that people have to 'top up' rental payments from their (already inadequate) subsistence benefits, intended to cover other necessities, such as food and fuel. For a minority of the UK-other group, low-paid, insecure employment and erratic pay interact with gaps in benefits to leave them destitute. For a small subset, relationship breakdown, usually combined with debt and housing difficulties, played a role. For the complex needs group (15% of the total destitute population, one-third of whom are migrants), debt, benefit and health issues were equally if not more present in their routes into destitution. But their problems were compounded by high levels of relationship breakdown (including domestic violence), experience of drug or alcohol problems, being in trouble with the police, and, in some cases, eviction and housing problems. Routes into destitution for many migrants without complex needs (16% of the destitute population) shared some similarities with those of UK-born service users. However, they often faced distinctive difficulties, including lack of access to the UK labour market, benefit eligibility restrictions, or extremely low levels of benefits. This position has deteriorated for both vulnerable EEA migrants and asylum seekers since 2015.
4
The experience of destitution The most common item lacked by destitute service users was food (reported by 62%), followed by toiletries (47%), clothing (46%), and heating (42%). The least common deprivations were lacking lighting at home (20%) and shelter, with 16% of destitute service users having recently slept rough. Nearly half of all destitute households reported lacking three or more of these essentials in the month before they were surveyed. People in the complex needs group, especially those that were migrants, reported the highest overall levels of deprivation. There was qualitative evidence of physical health and social relationships being adversely affected by destitution, but the predominant impact seemed to be on mental health. Depression, severe stress and anxiety were commonly reported, with a few interviewees admitting to having suicidal thoughts. Factors triggering destitution such as debt, job loss, or benefit delays and sanctions, were often highly stressful in themselves, while the resulting lack of essentials and inability to maintain a sense of personal dignity further undermined mental health and wellbeing. There has been a reduction in the support available to destitute households over the past two years. In particular, the proportion of destitute service users reporting no source of money at all has increased. This situation was particularly common among the migrant and complex needs destitute groups (24% and 22% respectively). A rise in income from paid work may suggest an increase in ‘in-work destitution’, although from a low base. A sharp fall in the proportion of destitute service users reporting in-kind help from local welfare funds (down 28 percentage points since 2015) is consistent with wider evidence on the erosion of these funds across England, as cash-strapped local authorities are forced to cut back on non-statutory expenditure. At the same time, a large increase in those relying on in-kind help from charities/churches (up 21% percentage points) is particularly concerning given evidence of the humiliation this entails. Another striking finding in the 2017 survey was that half of all migrant respondents reported receiving no in-kind help at all.
Routes out of destitution Resolving benefit issues was often the key determining factor in escaping destitution. This could mean the ending of a benefit delay or sanction, or a change in benefit eligibility status, including securing sickness or disability benefits. But bringing debts, fuel or housing costs under control also featured heavily in the accounts of the UK-other interviewees who were no longer destitute, albeit often still severely poor, and in a couple of cases securing paid work had made all the difference. All the migrants who had managed to exit destitution had found employment.
Trends in destitution Destitution levels have declined by approximately 25% since 2015. Several factors seem likely to account for this. In particular, there has been a dramatic fall in Jobseeker’s Allowance benefit sanctions; our original study found that these were a significant factor in destitution. However, sanctioning rates are much higher in Universal Credit across all age groups, so if it continues to be rolled out on the current model we might expect sanctions-prompted destitution to rise again. The period to April 2017, when our survey took place, also saw jobs expanding and unemployment falling. As a further important factor, overall migration has fallen and in particular migration from some new EU member states, a group potentially vulnerable to destitution, has fallen noticeably. However, there are countervailing factors including a rise in refugee and asylum-seeking migrants and a rise in homelessness.
5
Policy implications • Ensuring that benefit sanctions, gaps and freezes no longer drive large-scale destitution among the
UK working-age population should be a core aim of the roll-out of Universal Credit.
• The Department for Work and Pensions and other public authorities must address the serious consequences of uncoordinated debt recovery practices across organisations that leave people with practically nothing to live on.
• It is imperative that local welfare assistance schemes are embedded across England to provide emergency relief for people facing destitution. These schemes should adhere to national minimum standards, drawing on the positive lessons from the national schemes maintained in the other UK countries.
• A decent level of subsistence benefits and accommodation should be available to all people living in the UK, regardless of age or immigration status.
• Social landlords should play a central role in preventing and alleviating tenants’ destitution.
• The particular vulnerability of sick and disabled people to destitution should be the subject of focused policy attention.
6
1 Introduction
Background 'Destitution' denotes the circumstances facing people who cannot afford to buy the absolute essentials that we all need to eat, stay warm and dry, and keep clean. The original Destitution in the UK study, conducted in 2015 with the main report published in 2016, was prompted by a perception in some quarters that this phenomenon was increasing sharply in the period running up to 2015 (Fitzpatrick et al, 2016). Media attention devoted to the prevalence of extreme hardship, and to the increased use of food banks in particular, was indicative of an escalation in these concerns (Cooper and Dumpleton, 2013; Cooper et al, 2014; Sippitt and Ashworth-Hayes, 2015). Yet quantitative evidence on the scale, trends and distribution of destitution in contemporary UK was difficult to come by, as was data on the characteristics of those affected and the impact that this experience has on them. At the same time, religious leaders, charities, politicians and researchers had made a connection between destitution and developments in immigration and asylum policy (Allsopp et al, 2014; Petch et al, 2015), welfare reform and administration (Watts et al, 2014), homelessness policy and services for those with complex needs (Fitzpatrick et al, 2016). But the evidence to directly link these policy and social developments to pathways into and out of destitution was patchy, incomplete and often heavily disputed. Since our original study many of these concerns have amplified. Further changes in immigration legislation, with impacts in the housing, social welfare and employment spheres, have ‘…explicitly sought to create a difficult environment for those that the government deems have no legal right to be in the UK’ (Malfait et al, 2017, p.6). This ‘hostile environment’ has further restricted the support available to vulnerable asylum seekers, refugees, European Economic Area (EEA) and other migrants, and has been associated in recent reports with an increase in destitution among refused asylum seekers in particular (NACCOM, 2017; see also British Red Cross, 2016; NICRAS, 2016; Malfait et al, 2017; Refugee Council, 2017). At the same time, the programme of welfare reform since 2010 continues to erode the value of working-age social security entitlements, with all the main working-age benefits now frozen at 2015/16 cash values until 2019/20 (Hood and Norris Keiller, 2016; Child Poverty Action Group, 2017, p.36; Portes and Reed, 2017). This benefit freeze is by far the most important element in the £12 billion of further savings in welfare spend planned during this parliamentary session, and is consequently a pre-eminent factor in the rise in UK child poverty predicted to occur between now and 2021/22 (Hood and Waters, 2017). Restrictions in housing allowances mean Housing Benefit and Local Housing Allowance is less likely to fully cover claimants' rental payments, who may then have to top these up from basic income maintenance benefits which are declining in value year-on-year. There are widespread concerns about both the structure and administration of the Universal Credit regime being rolled out across the UK, that will eventually replace most UK working-age benefits, including its possible implications for exacerbating homelessness risks (Fitzpatrick et al, 2018) and demand for foodbank help (Jitendra et al, 2017). While there has been a substantial fall in levels of benefit sanctioning of Jobseeker’s Allowance (JSA) claimants since the historic peak in 2013 (National Audit Office, 2016a), Universal Credit will see a further tightening of conditionality in several respects, prompting concerns that another spike in sanctions may occur (Webster, 2017). Early evidence using official statistics shows Universal Credit sanctions being applied at a much higher rate than JSA sanctions, across all age groups (Webster, 2017), and the total number rising so rapidly that, by 2017, they already outnumbered total JSA sanctions (Bramley et al, 2018). While this may in part be due to a different approach in JSA that could underestimate how many people are losing their benefits entirely, it is not yet clear why sanctioning appears to be higher in Universal Credit. There are also rising concerns about the associations between poverty and 'exclusionary' forms of low-paid and insecure work (Bailey, 2018), particularly for those working on zero-hour contracts or described as working in the ‘gig economy’ (Taylor, 2017). Thus the impact of welfare reform is felt alongside many people experiencing declining and stagnant incomes at the bottom end of the labour
7
market which, together with the rising cost of living, can leave people without sufficient income to cover basic living needs costs (Downing and Kennedy, 2014; Tinson et al, 2016; CPAG, 2017; Cribb et al, 2017; Bramley and Bailey, 2018). The extreme poverty, insecurity and vulnerability of the population using Trussell Trust food banks, among whom single men, lone parents and people with disabilities are over-represented, has been comprehensively demonstrated in a recent large-scale survey (Loopstra and Lalor, 2017). A number of high-profile contributions to this debate have also been made by the All-Party Parliamentary Group on Hunger and Food Poverty, chaired by Frank Field (Forsey and Mason, 2016). One report from the Group argues that:
“Aside from the number of people relying on food banks, the number of children arriving at school hungry is beginning to emerge as a most visible indicator of our nation’s vulnerability to hunger.” (Forsey 2016, p.17).
Prompted by concerns about Universal Credit, along with the rise in food poverty, Field commented recently that:
“...many people at the bottom of the pile who fall on hard times are slipping through holes in the nation’s safety net – some are even forced through those holes by the modern welfare state…[The]…state has become a generator of destitution.” (Field, 2017)
Study aims Our original study estimated that 1.25 million people experienced destitution in the UK at some point during 2015, the great majority of whom were born here (Fitzpatrick et al, 2016). Destitution was not usually a one-off, transient episode, but generally occurred in a context of severe poverty and hardship over a considerable period. Episodes of destitution were typically triggered by some combination of debt, benefit, health and/or housing affordability issues and, for some migrants, exclusion from access to benefits and/or the UK labour market. People affected by destitution universally felt 'humiliated' and 'demeaned' by having to seek help with basic material needs like food, clothes and toiletries from charitable organisations, friends or family. This follow-up study set out to:
• provide an updated and refined national estimate of the overall scale of destitution in the UK for 2017
• identify any emerging trends with respect to the overall prevalence, distribution and nature of destitution in the UK
• deepen our understanding of the drivers of destitution in the UK and the experiences of those directly affected.
Report structure After we summarise the methodology used in this follow-up study in Chapter 2, including setting out the definition of destitution that is used throughout this research, Chapter 3 presents the core statistical findings on the scale, distribution and trends in destitution in the UK in 2017. Drawing on both our qualitative and quantitative data, Chapter 4 updates our analysis of routes into destitution, while Chapter 5 focuses on the experiences and impacts of destitution on those directly affected, and the routes out of this condition taken by those who have managed to escape it. Finally, Chapter 6 presents the overall conclusions of this follow-up study.
Report context While this follow-up study, like the original, is tightly focused on the extreme state of material and/or income deprivation represented by the concept of destitution, the authors recognise that this experience
8
sits within the much broader context of severe and other forms of poverty and hardship faced by many people across the UK. The findings should be read alongside the evidence presented in the Joseph Rowntree Foundation's strategy We can solve poverty in the UK (JRF, 2016), as well as other major sources of evidence about poverty, disadvantage and need in the UK, for example the UK Poverty and Social Exclusion Survey (Lansley and Mack, 2015; Bramley and Bailey, 2018), and Households Below Average Incomes (Department for Work and Pensions, 2017).
9
2 Methods Overview The original Destitution in the UK project involved a wide array of methods including: an extensive literature review; interviews with 50 key experts; an omnibus survey2 of 2,000 members of the public; analysis of more than 40 quantitative datasets; and in-depth case studies of destitution in 10 locations across the UK (Fitzpatrick et al, 2015; 2016). This follow-up study repeated key quantitative and qualitative elements of the original study, in modified form, as summarised below, and discussed in detail in the accompanying technical report (Bramley et al, 2018). It also employed the consensus-based definition of destitution, established in the interim report of the original study (Fitzpatrick et al, 2015), and described in the next section.
The definition of destitution The expert-informed, publicly-endorsed definition of destitution applied in both the 2015 and 2017 study is presented in Box 1 (for an account of how this definition was arrived at see the interim report of the original study, Fitzpatrick et al, 2015).
Box 1: Definition of destitution
People are destitute if: a) They have lacked two or more of these six essentials over the past month, because they cannot afford them:
shelter (have slept rough for one or more nights) food (have had fewer than two meals a day for two or more days) heating their home (have been unable to do this for five or more days) lighting their home (have been unable to do this for five or more days) clothing and footwear (appropriate for weather) basic toiletries (soap, shampoo, toothpaste, toothbrush).
To check that the reason for going without these essential items was that they could not afford them we: asked respondents if this was the reason; checked that their income was below the standard relative poverty line (ie 60% of median income 'after housing costs' for the relevant household size); and checked that they had no or negligible savings. OR b. Their income is so extremely low that they are unable to purchase these essentials for themselves. We set the relevant weekly 'extremely low' income thresholds by averaging: the actual spend on these essentials of the poorest 10% of the population; 80% of the JRF Minimum Income Standard costs for equivalent items; and the amount that the general public thought was required for a relevant sized household to avoid destitution. The resulting (after housing costs) weekly amounts were £70 for a single adult living alone, £90 for a lone parent with one child, £100 for a couple, and £140 for a couple with two children. We also checked that households had insufficient savings to make up for the income shortfall.
10
In essence, this consensus-based definition of destitution seeks to capture people who cannot afford to buy the absolute essentials that we all need to eat, stay warm and dry, and keep clean. With regard to its primary 'material deprivation' criteria ('a' in Box 1), the six essential items specified, the lack of two or more of them, and the relevant duration of lack for each specific item, were all endorsed by clear majorities of the general public in a survey we did as part of the original study. The secondary (alternative) 'extremely low income' criteria ('b' in Box 1), also endorsed by the public in the survey, is not intended to provide a new 'poverty' line. Rather, it indicates an income level below which people cannot meet their core material needs for basic physiological functioning from their own resources. This criteria was introduced because the survey established that a majority of the public took the view that people who were only able to meet their essential living needs with help from charities, for example, should be considered destitute.
Quantitative research As in the 2015 study, the development of core national estimates of destitution involved a number of interconnected steps (see Fitzpatrick et al, 2016). The first and most critical step was a one-week survey of the users of crisis services in 16 UK areas chosen to ensure an appropriate range of expected incidence of destitution, mix of urban/rural attributes, and size/type of migrant populations. This survey, and some changes it embodies, are described more fully below. The second step was to estimate the total number of users of relevant crisis services across all 16 case study areas, and how many were destitute, over the week, as well providing a profile of their characteristics and experiences. The third step was to gather, review and analyse a wide range of existing statistical datasets to generate indicators of groups and factors associated with high risks of destitution, covering every local authority in Great Britain (GB).3 The fourth step was to compare our survey-based estimates for the 15 GB4 areas with predicted rates of destitution based on the secondary indicators, and to calibrate the latter indicators for consistency with the average survey findings. The fifth and final step used information in the survey about repeated use of the particular service sampled, as well as use of other relevant services, over the last year, to generate estimates of the total number of unique destitute service users over a year.
The survey We repeated the one-week survey almost exactly two years after the original 2015 survey, in March/April 2017. The essential character and many features of the 2017 survey were the same, although there were some significant developments which improved both the information collected and the coverage of areas and types of service, as summarised in Table1 (see the technical report for full details (Bramley et al, 2018)). Table 1: Comparing the features of the destitution 2015 and 2017 surveys
Feature 2015 2017
Number of case study areas 10 16 (original 10 + additional 6)
Number of participating services 63 103 (including 52 of the 63 that participated in 2015)
Total questionnaires returned 2,009 2,905
11
Feature 2015 2017
Changes to questionnaire design N/A
Additional/revised questions on: living circumstances, physical/mental health,
alcohol/drugs, offending, income, and use of other services
Management of fieldwork Delivered entirely by Heriot-Watt team
Delivered primarily by Kantar Public, allowing increased presence in services
during the survey period
Changes in analysis N/ARefinement of definition of the three main analytical sub-groups ('complex
needs', 'migrants', 'UK-other')
The improved scope and robustness of the 2017 survey can be gauged from the fact that it involved 103 services, across 16 case study areas, and generated 2,905 questionnaire returns (with a 52% response rate). This was a considerable advance on the 2015 survey, which had involved 63 services, across 10 case study areas, generating 2,009 questionnaire returns (with a 60% response rate). As can be seen, the 2017 survey used all 10 of the original case study areas and most of the same agencies, with substitutes used only in limited cases were services had closed, changed or were for some reason unable to co-operate at the time of the second survey. The original 10 case study areas were Glasgow, Bournemouth, Ealing (London), Fife, Newham (London), Nottingham, Peterborough, Swansea, Wiltshire5 and Belfast. Six additional case study areas were added, selected to ensure better coverage of ‘middle’ and ‘better off’ England, including more rural areas. These additional areas were Cheshire West and Chester; County Durham6; East Hertfordshire and North Hertfordshire districts; Herefordshire; Kirklees; and Lewes and Rother. One specific and highly relevant form of statutory service, local welfare funds (LWF), was included within the study scope alongside voluntary sector crisis services. All the issues covered in the 2015 questionnaire were also covered in 2017.7 However, some detailed changes were made: new questions were added on living/accommodation circumstances; new or more detailed questions were inserted on experiences over the past 12 months, including about serious physical health problems, mental health problems, alcohol or drugs problems, and getting in trouble with the police; improved question wording was used on income; and a different approach was adopted to the question about 'use of other services'. All these changes to the questionnaire were subject to careful cognitive testing (see revised questionnaire at Appendix 1, and an account of cognitive testing process in the technical report (Bramley et al, 2018). Another important difference in the conduct of the 2017 study was that a major national survey research organisation, Kantar Public, was a key partner, taking main responsibility for cognitive testing of the questionnaire and fieldwork tasks. Kantar interviewers were present in all services which wanted to have them to help service users complete the questionnaire. Previously this had been done by researchers from Heriot-Watt University, but with less full coverage of all service sessions and somewhat greater reliance on services themselves to administer the questionnaire. Mainly as a result of these new or changed elements in the way data was collected, we could examine certain issues more closely, leading to some improvements in the analysis:
• the breakdown between the three main analytical sub-groupings used in the original report – 'migrants', 'complex needs' and 'UK-other' (see Fitzpatrick et al, 2016) – was amended slightly, with a more precise definition of complex needs due to the additional questions on accommodation status, substance misuse and involvement with the police in the 2017 survey
• this new, more refined definition allowed us to classify migrants with complex needs in the 'complex needs' category rather than in the 'migrant' category
• more people answered the revised questions about use of other services, so we have more confidence about the way we can use this information to help to estimate the ‘annual’ totals of destitution from the weekly estimates.
12
There is naturally great interest in how the destitution numbers are changing, particularly since the previous survey in 2015. In practice, we believe that the best indicator of change in destitution numbers is obtained by comparing the results in 2017 with those in 2015 for the 52 agencies in the 10 original study areas which took part in the survey in both years. This is the basis on which we present our findings on change over time throughout the report. However, the headline ‘national annual’ numbers cannot be precisely compared with those published for 2015 because of the methodological improvements summarised above. We would argue that the 2017 annual estimates are more accurate than those for 2015 at the national level as a result of these improvements in both scope and rigour.
Qualitative research In the original study in-depth interviews were undertaken with 80 destitute respondents, selected to reflect the overall population of destitute service users, as revealed by the initial survey analysis. These semi-structured qualitative interviews were recorded and fully transcribed (with permission), and thematically coded and analysed using Nvivo software. This qualitative data was extremely valuable in deepening our understanding of the drivers of destitution as well as the experiences and perceptions of those directly affected. In this follow-up study, 418 in-depth interviews were undertaken with a selected sample of destitute respondents to the 2017 survey who agreed to be re-contacted for interview. Again, these semi-structured qualitative interviews were recorded and fully transcribed (with permission), and thematically coded and analysed using Nvivo software. As in 2015, these interviews explored routes into and out of destitution in the UK, but also paid particular attention to issues of interest that emerged from the original study, most notably the debt recovery practices of public authorities and utility companies (see also the separate JRF-funded study, Barker et al (2018)) and access to legal and other forms of advice (see below and Mc Keever et al, (2018)). We sought to ensure a balance of gender, household type and age across the qualitative sample that broadly reflected the destitute population as a whole in 2017 (see Chapter 3). This was achieved with just over half the sample male, over half living in single-person households, and over half in the 25–45 age bracket. Migrants to the UK comprised almost one-third of the sample, as desired. However, we sought to capture more successfully the particular experiences of EAA migrants than in the 2015 study, where most of the migrants interviewed had experience of the asylum system. Nonetheless, we still struggled to reach this group in 2017, interviewing only four EEA migrants in the end.9 Given the extensive evidence base on the experiences of UK nationals who experience street homelessness and have complex needs (for example, Bramley et al, 2015; Mackie et al, 2017), it was decided to focus most of the non-migrant interviews on the much less well researched (and much more numerous) 'UK-other' sub-group. In total, six of this year's interviewees had complex needs according to our new, more refined definition (see Chapter 3), three of whom were migrants and three of whom were UK nationals. The intention was to conduct interviews across all 16 case study areas, with most from the original, mainly larger case study sites, but ensuring that a reasonable number of cases were drawn from the 'middle' and 'prosperous' England areas. In the end eight interviewees were drawn from the new case study areas. The Legal Education Foundation and JRF commissioned Ulster University to conduct a bespoke analysis of these qualitative interviews to explore the links between access to legal advice and representation (or lack thereof) and pathways into and out of destitution. Explicit informed consent was sought from interviewees to share (on an anonymised basis) their interview transcripts with the Ulster University team. The topic guide (see Appendix 2) picked up a series of lines of inquiry of particular interest to the legal specialists at Ulster University. But it should be noted that, given the existence of a separate report on access to legal justice and destitution (McKeever et al, 2018), we do not explore that theme in depth in the present report (see also Petch et al, 2015).
13
3 The scale and distribution of destitution in the UK in 2017 Introduction A key objective of this research was to establish with authority how many people were destitute in the UK in 2017. This chapter therefore begins by presenting our national UK estimates10 for destitution, derived from the methodology summarised in Chapter 2, and reflecting on changes since 2015, before detailing how this estimate maps onto the definition of destitution also discussed in Chapter 2 (see Box 1). The next section presents the overall profile of all those affected by destitution in the UK, and then their living situation, before examining in more detail the position of three key sub-groups of the destitute population this study focused on: 'migrants' (without complex needs); 'complex needs'; and 'UK-other'. Finally, the geographical distribution of destitution across the UK is discussed.
National estimates of destitution and change since 2015 Using the methods set out in Chapter 2, we estimate that the total number of destitute households in the UK in touch with voluntary sector crisis services or local welfare funds in a representative week in 2017 was 132,550. These households contained 184,000 people of whom 41,000 were children. Over the whole of 2017, we estimate the number of households experiencing destitution in UK, and using these services, to be 785,000, involving 1,550,000 people of whom 365,000 were children. It is worth reiterating that both these weekly and annual estimates are conservative, based on a strict application of our consensus-based definition (see Box 1 in Chapter 2) and focused exclusively on those cases that come to the attention of voluntary sector crisis services or local welfare funds. Destitute households which do not contact any crisis services, or contact only other statutory services, could not be captured using our methodology, and we also omitted very small services. Complexity of the research design also means that they are subject to margins of error of the order of +/-20% (see technical report (Bramley et al, 2018)). As noted in the previous chapter, the best way of measuring change since 2015 is to look at the weekly snapshot figures for those services in the original 10 areas included in both surveys. Based on this comparison, our best estimate of the change in destitution in UK over this two-year period is a reduction of -25%. This is our central trend estimate, but taking into account various sources of uncertainty the true figure could potentially lie in a range of -11% to -32% (see technical report (Bramley et al, 2018)). We believe there are several factors for this decline. In particular, there has been a notable fall in the number of Jobseeker’s Allowance (JSA) sanctions (Webster, 2017), and a key finding of our original study was that sanctions were a significant factor in destitution (Fitzpatrick et al, 2016). Monthly sanction rates for JSA claimants peaked at 7.5% in 2013, before falling back to around 3% by the end of 2015 (National Audit Office, 2016a). It appears that, through administrative and managerial action, rather than through announced policy change, the DWP has effectively reduced the vigour of the sanctions regime for JSA (National Audit Office, 2016a). However, the total number of Universal Credit sanctions has risen rapidly and consequently we might expect to see sanctions-prompted destitution to start to expand again. In August 2017, Webster commented:
“Over the period August 2015 to March 2017, the rate of UC sanctions was 7.4% of claimants per month. This is three times the rate of 2.5% for JSA... Because of DWP backlogs, at present it is impossible to say whether there is a trend in the UC sanction rate, but the overall rate of sanction on unemployed people is likely to rise simply because of the continuing transfer of claimants to the high-sanctioning UC.” (Webster, 2017, p.1)
14
In his most recent analysis Webster (2018) notes that the monthly rate of Universal Credit sanctions has 'fluctuated wildly' (p.1), and while it appears now to have fallen (possibly to around 4–4.5% before challenges) this remains very high by historical standards, and far in excess of the current JSA rate (now stabilised at around 1.7%). In the period up to April 2017, when our survey was done, jobs had been expanding and unemployment was falling. As a further important factor, overall migration has fallen in the period following the Brexit referendum. In particular, migration from some new EU member states, a group potentially vulnerable to destitution, has fallen sharply (ONS, 2018). However, there are countervailing factors including a rise in refugee and asylum-seeking migrants and a rise in homelessness (Bramley, 2017; Fitzpatrick et al, 2018). These trends are all discussed in greater detail in the technical report (Bramley et al, 2018). Finally, while our contention is that destitution has fallen in the UK over the past two years, our headline annual estimate is in fact higher for 2017 (1,550,000 people affected) than for 2015 (1,252,000 people affected (see Fitzpatrick et al, 2016)). This is explained by the enhanced comprehensiveness and robustness of our 2017 estimate, as a result of the improvements in survey design and coverage discussed in Chapter 2 (and see technical report (Bramley et al, 2018)). In other words, the 2015 figure was probably an underestimate, and the 2017 is a more realistic, although still conservative, figure.
Unpacking the definition of destitution As discussed in Chapter 2, the definition of destitution used in this study has two elements (see Box 1):
• people were considered destitute if they had lacked two or more of a basket of six essentials over the past month, because they could not afford them (the 'deprivation' criteria);
or
• if their income was so low that they were unable to purchase these essentials for themselves (the 'extremely low income' criteria).
As can be seen from Figure 1, nearly 35% of all those we defined as destitute were both deprived as defined above and on an extremely low income; almost 33% had an extremely low income only (so had not been deprived as defined above over the past month); and nearly 33% had been deprived only over the past month (so had an income above the extremely low level, although below the general poverty line – which is defined as below 60% of national median net equivalised income after housing costs).
Figure 1: Definitional breakdown of destitute households
Figure 2 shows which particular essentials destitute service users lacked. As can be seen, the most common items lacked were food (62%) followed by clothes and toiletries (46%), and the least common
15
were lacking lighting at home (20%) and shelter, with 16% reporting having slept rough within the last month. Looking at the results for those services in the original 10 areas of the survey in both years, while lack of clothes, heating and lighting had dropped slightly in frequency, rough sleeping and lacking food remained at the same level. The pattern thus seems to be broadly stable. Figure 2: Essentials lacked in preceding month
Of the total number of essentials lacked by destitute service users, 34% lacked one or none, 22% lacked two, 18% lacked three, 15% lacked four, and 12% lacked five or six. In other words, approaching half of destitute service users (45%) lacked three or more of the essential items in the month before survey. Figure 1 shows that 68% of the population of destitute service users had incomes below the 'extremely low income' threshold we set for our secondary destitution criteria. In fact, at least 22% had no income at all, and 61% had incomes of less than £70 per week.11 Figure 3 shows that the great majority of the remaining respondents had income levels that were only slightly higher.12 For example only 4% reported having incomes above £140 a week (after housing costs). Figure 3: Banded weekly income level of destitute households (after housing costs)
Note: just over 10% of the destitute cases involved households which did not give income information but which reported lacking three or more of the key essentials and having no savings, and so were classified as destitute. These extremely low incomes are even lower, in both nominal and real terms, than in 2015. In part, this might reflect the reworded question on income giving more accurate data, as it was made clearer that it was a post-housing costs income that was required (see technical report (Bramley et al, 2018)). It is also
16
worth noting that these self-reported income levels are broadly in line with relevant benefit levels, especially for the predominant single working-age household type (see below). We therefore have no reason to doubt their essential accuracy.
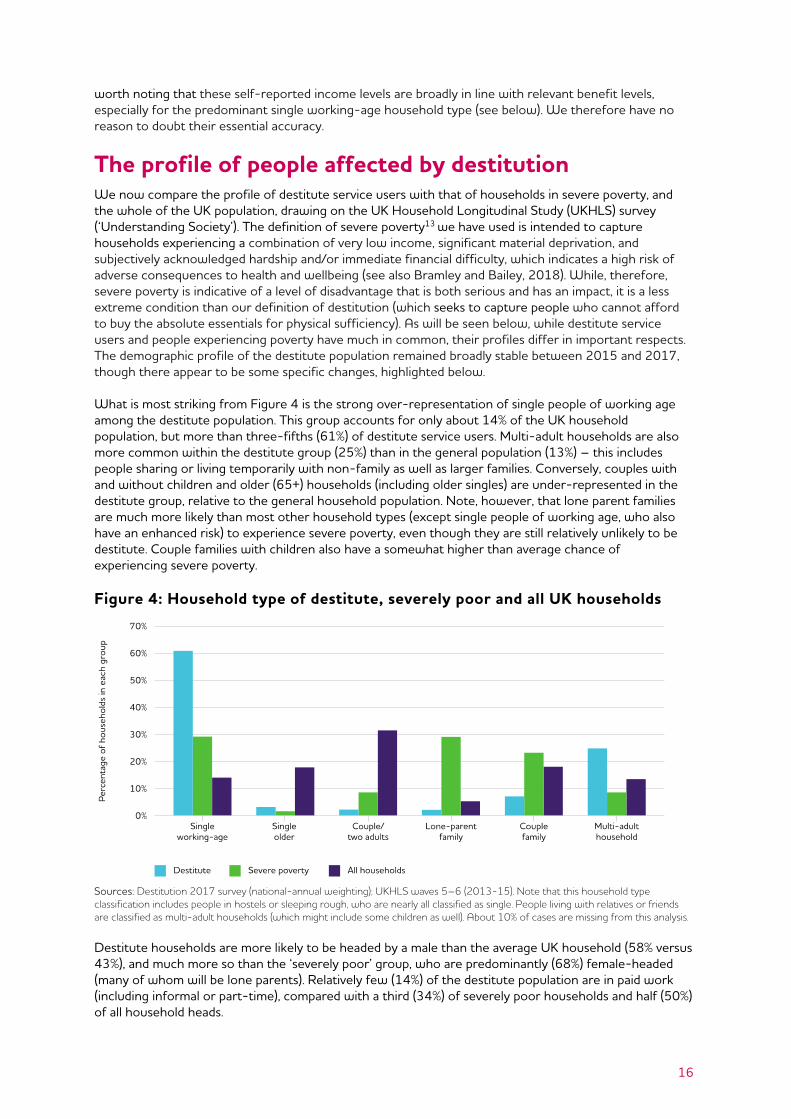
The profile of people affected by destitution We now compare the profile of destitute service users with that of households in severe poverty, and the whole of the UK population, drawing on the UK Household Longitudinal Study (UKHLS) survey (‘Understanding Society’). The definition of severe poverty13 we have used is intended to capture households experiencing a combination of very low income, significant material deprivation, and subjectively acknowledged hardship and/or immediate financial difficulty, which indicates a high risk of adverse consequences to health and wellbeing (see also Bramley and Bailey, 2018). While, therefore, severe poverty is indicative of a level of disadvantage that is both serious and has an impact, it is a less extreme condition than our definition of destitution (which seeks to capture people who cannot afford to buy the absolute essentials for physical sufficiency). As will be seen below, while destitute service users and people experiencing poverty have much in common, their profiles differ in important respects. The demographic profile of the destitute population remained broadly stable between 2015 and 2017, though there appear to be some specific changes, highlighted below. What is most striking from Figure 4 is the strong over-representation of single people of working age among the destitute population. This group accounts for only about 14% of the UK household population, but more than three-fifths (61%) of destitute service users. Multi-adult households are also more common within the destitute group (25%) than in the general population (13%) – this includes people sharing or living temporarily with non-family as well as larger families. Conversely, couples with and without children and older (65+) households (including older singles) are under-represented in the destitute group, relative to the general household population. Note, however, that lone parent families are much more likely than most other household types (except single people of working age, who also have an enhanced risk) to experience severe poverty, even though they are still relatively unlikely to be destitute. Couple families with children also have a somewhat higher than average chance of experiencing severe poverty. Figure 4: Household type of destitute, severely poor and all UK households
Sources: Destitution 2017 survey (national-annual weighting); UKHLS waves 5–6 (2013-15). Note that this household type classification includes people in hostels or sleeping rough, who are nearly all classified as single. People living with relatives or friends are classified as multi-adult households (which might include some children as well). About 10% of cases are missing from this analysis.
Destitute households are more likely to be headed by a male than the average UK household (58% versus 43%), and much more so than the ‘severely poor’ group, who are predominantly (68%) female-headed (many of whom will be lone parents). Relatively few (14%) of the destitute population are in paid work (including informal or part-time), compared with a third (34%) of severely poor households and half (50%) of all household heads.
17
The destitute group and the wider severe poverty group are both likely to be younger than the general population, as shown in Figure 5. The proportionate risk of destitution is greatest for households headed by someone under 25, but the largest numbers of destitute heads of household are to be found in the 25 to 34 age group. Destitution or severe poverty are both extremely rare in the 65+ age group.
Figure 5: Broad age groups of destitute, severely poor and all UK households
As Figure 6 shows, a quarter of destitute households (25%) in 2017 were headed by a migrant to the UK. This is only slightly higher than the share of all working-age adults who are non-UK-born (23%, or 21% of working-age household heads). It is thus clear that the great majority of destitute households in the UK in 2017 were born here. Figure 6: Summary of migration profile of destitute households
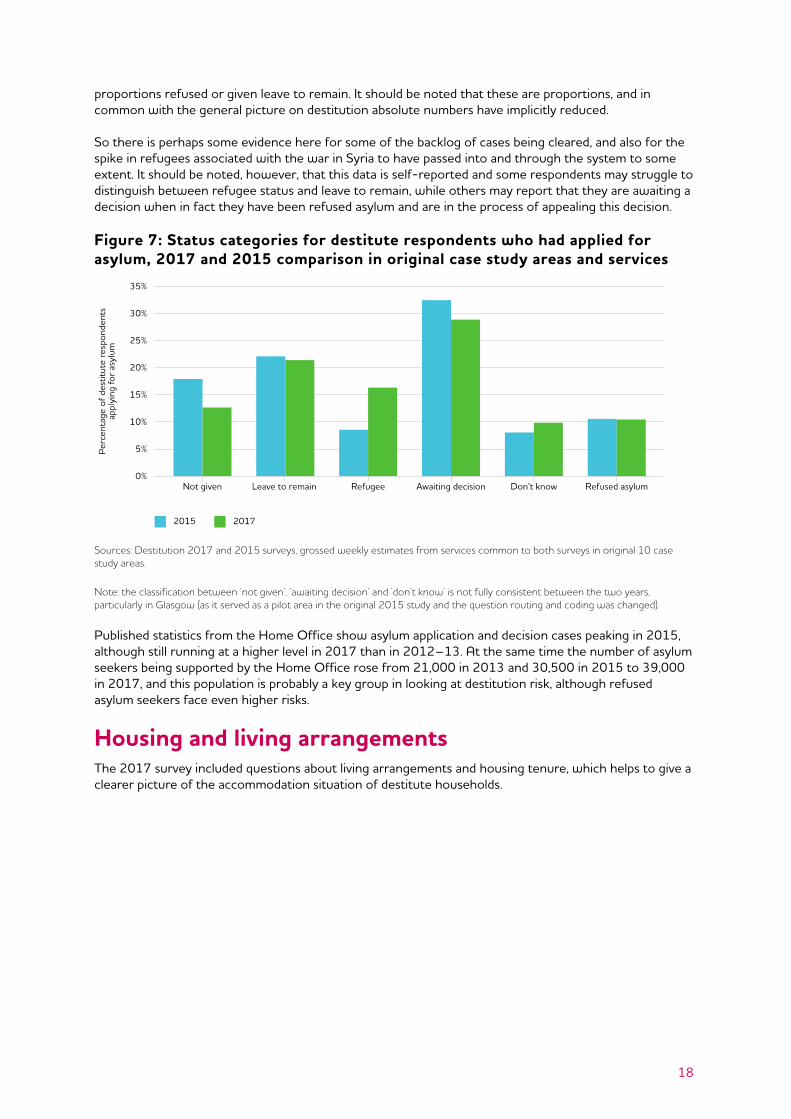
As noted above, for changes between 2015 and 2017 we prefer to focus on the original 10 case study areas using weekly data for the 52 agencies which were the same in both surveys. This comparison shows that the change in share of migrants, overall and for each of the categories shown in Figure 6 was minimal (not statistically significant). There is no evidence here of any marked change in the profile of destitute migrants in terms of the balance between those from the European Economic Area (EEA), those with experience of the asylum system, and other backgrounds. Given the findings on change in overall destitute numbers, that implies that there was some absolute decline in destitute migrants as well. Figure 7 gives more detail on the status of those destitute survey respondents who said that had claimed asylum. Again, so that we can better compare with 2015, it is based on the original 10 case study areas, selecting services common to both surveys. This evidence suggests an increase in the proportion with refugee status and a decline in those awaiting decision or not giving an answer, with little change in the
18
proportions refused or given leave to remain. It should be noted that these are proportions, and in common with the general picture on destitution absolute numbers have implicitly reduced. So there is perhaps some evidence here for some of the backlog of cases being cleared, and also for the spike in refugees associated with the war in Syria to have passed into and through the system to some extent. It should be noted, however, that this data is self-reported and some respondents may struggle to distinguish between refugee status and leave to remain, while others may report that they are awaiting a decision when in fact they have been refused asylum and are in the process of appealing this decision. Figure 7: Status categories for destitute respondents who had applied for asylum, 2017 and 2015 comparison in original case study areas and services
Sources: Destitution 2017 and 2015 surveys, grossed weekly estimates from services common to both surveys in original 10 case study areas.
Note: the classification between ‘not given’, ‘awaiting decision’ and ‘don’t know’ is not fully consistent between the two years, particularly in Glasgow (as it served as a pilot area in the original 2015 study and the question routing and coding was changed).
Published statistics from the Home Office show asylum application and decision cases peaking in 2015, although still running at a higher level in 2017 than in 2012–13. At the same time the number of asylum seekers being supported by the Home Office rose from 21,000 in 2013 and 30,500 in 2015 to 39,000 in 2017, and this population is probably a key group in looking at destitution risk, although refused asylum seekers face even higher risks.
Housing and living arrangements The 2017 survey included questions about living arrangements and housing tenure, which helps to give a clearer picture of the accommodation situation of destitute households.
19
Figure 8: Current living arrangements of destitute respondents
Figure 8 demonstrates that roughly two-thirds of all destitute households were living in a flat or house of their own (nearly all rented rather than owned). Much smaller proportions (5% to 10%) reported the following arrangements: living in a temporary flat/house provided by local authority or other support agency; staying with partners, parents, other relatives or friends; being resident in a hostel or refuge; sleeping rough; or living in ‘other’ circumstances. Figure 9 shows the housing tenure breakdown for those destitute households living in their own flat or house. For comparison it also shows the UK-wide tenure of households in severe poverty, and all households, based on the UKHLS. As can be seen, the tenure of destitute households is similar to that of severely poor households, with over 60% in social renting, about 35% in private renting, and only 3% in home-ownership. So while 'half the poor' may be home-owners (one-third after housing costs are taken into account) (Wallace et al, 2018), it is most certainly not the case that 'half the destitute' are – the concentration in social housing, and to a lesser extent private rented housing, is abundantly clear. The same can be said for severe poverty, with 85% of those affected in a rental tenure, as are 77% of those who suffer from a combination of relative low income after housing costs and lacking three or more of the material items used in official government survey (based on UKHLS 2013–14). Figure 9: Housing tenure of destitute, severely poor and all households
Note: For destitute households this only refers to those who have their own flat or house.
20
The three main destitute sub-groups As noted above, for most of our analysis we adopted a broad three-way classification of destitute households, defined as follows:
• complex needs – anyone who reported experience of two or more of: homelessness, substance misuse, offending, domestic violence or begging
• migrants – anyone born outside the UK (who did not have complex needs as just defined)
• UK-other – respondents not falling into the preceding two categories (ie UK-born without complex needs).
This sub-group breakdown is similar to that used in the 2015 survey report (Fitzpatrick et al, 2016), but differs in the definition of complex needs (more precise) and the inclusion of relevant migrants in the complex needs group (see Bramley et al, 2018 for details). In 2017, 15% of destitute households had complex needs (of whom one-third were migrants14), 16% were migrants (without complex needs), and the remaining 68% were UK-other households. Our analysis indicates varying demographic and other patterns across these three main sub-groups. While women comprised around 45% of service users in two groupings, but rather less in the complex needs group (40%), there were clear distinctions with regard to household type between these sub-populations, as Figures 10 and 11 indicate. Single person households were the most numerous in all three sub-groups, but they completely dominated the complex needs group, while comprising more than half of destitute migrants. On the other hand, one-fifth of destitute migrants lived in couple or lone-parent households with children, compared with only one in ten of the UK-other group, and a very small proportion of those with complex needs.
Figure 10: Household type composition of three main sub-groups of destitute households
As Figure 11 shows, there is not much difference in the age profiles, with all three groups having about 46% of respondents aged under 35. Relatively few destitute migrants appear to be under 25 but a higher proportion are aged 25–34. The complex need group are rather more likely to be aged 35–44 while the UK-other group are more likely to be in aged 45–64. There are few retirement-age cases in any of the groups, and almost none in complex needs.
21
Figure 11: Age group of three main sub-groups of destitute household heads
The pattern of deprivations varied somewhat across our three principal sub-groups, as shown in Figure 12. Figure 12: Deprivations over past month reported by three main sub-groups of destitute households
It is clear from Figure 12 that the complex needs group is more deprived across all categories than both the other sub-groups. One particularly striking finding is that that over half (55%) of all the complex needs group had slept rough over the past month. Migrants with complex needs have an even higher risk of suffering deprivation than the UK-born group with complex needs, and are especially likely to lack suitable clothes (82%) and to have slept rough in the past month (70%). Figure 13 provides a breakdown of income levels by these main sub-groups. Over a third of both destitute migrants and complex needs subgroups (36–37%) reported no income at all, as did 17% of the UK-other group. Otherwise, all three groups were similarly likely to have low incomes in the ranges up to £140 a week, with the UK-other group marginally more likely to have a slightly higher income.
22
Figure 13: Income levels reported by three main sub-groups of destitute households (after housing costs)
There are wide differences between the groups in the living arrangements recorded (see Figure 14). The UK-other group are largely ‘housed’, three-quarters in their own flat/house, only 2% in a house/flat provided on a temporary basis, and 10% with partner, other family or friends. Around 10% are homeless in the sense of being in hostel, sleeping rough or (some cases of) ‘other' accommodation. Just under three-fifths of migrants have their own house/flat, with a larger proportion (13%) in a house/flat provided on a temporary basis (this will include many of those currently seeking asylum). Migrants appear to have a similarly low proportion sleeping rough or in hostels (10%) but a higher proportion in the ‘other’ category (13%). The complex needs group have a very contrasting pattern, with 51% ‘homeless’ including 21% sleeping rough and 27% in hostels, and a further 9% in a flat/house provided on a temporary basis. Only a minority of just under a third (32%) have a flat or house of their own. Figure 14: Living arrangements by three main sub-groups of destitute households
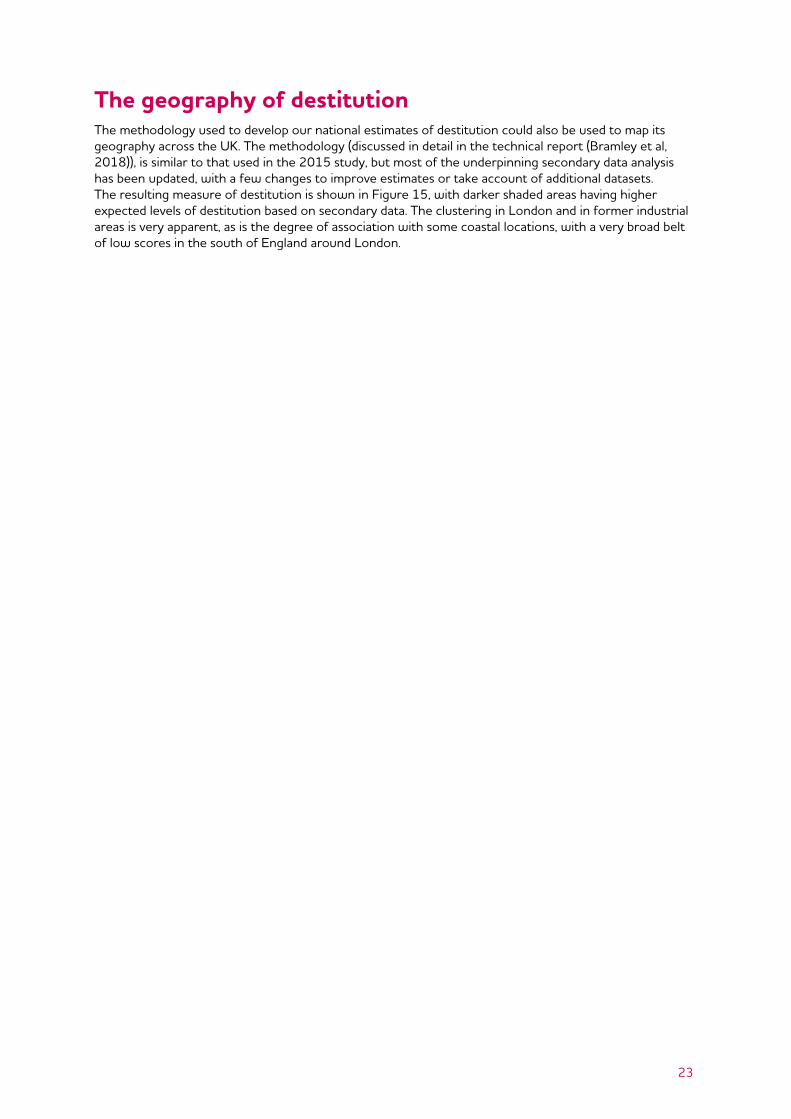
The geography of destitution The methodology used to develop our national estimates of destitution could also be used to map its geography across the UK. The methodology (discussed in detail in the technical report (Bramley et al, 2018)), is similar to that used in the 2015 study, but most of the underpinning secondary data analysis has been updated, with a few changes to improve estimates or take account of additional datasets. The resulting measure of destitution is shown in Figure 15, with darker shaded areas having higher expected levels of destitution based on secondary data. The clustering in London and in former industrial areas is very apparent, as is the degree of association with some coastal locations, with a very broad belt of low scores in the south of England around London.
24
Figure 15: Expected rate of destitution based on secondary indicators in decile bands
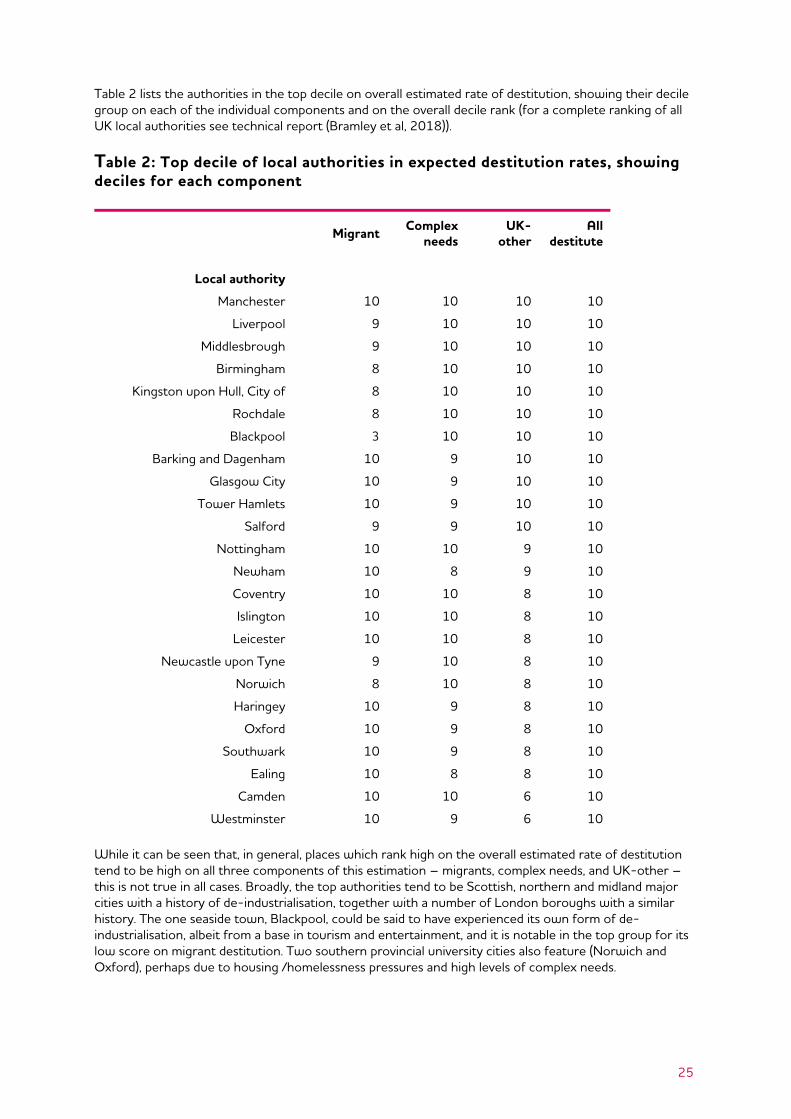
Table 2 lists the authorities in the top decile on overall estimated rate of destitution, showing their decile group on each of the individual components and on the overall decile rank (for a complete ranking of all UK local authorities see technical report (Bramley et al, 2018)).
Table 2: Top decile of local authorities in expected destitution rates, showing deciles for each component
Migrant Complex needs
UK- other
All destitute
Local authority
Manchester 10 10 10 10
Liverpool 9 10 10 10
Middlesbrough 9 10 10 10
Birmingham 8 10 10 10
Kingston upon Hull, City of 8 10 10 10
Rochdale 8 10 10 10
Blackpool 3 10 10 10
Barking and Dagenham 10 9 10 10
Glasgow City 10 9 10 10
Tower Hamlets 10 9 10 10
Salford 9 9 10 10
Nottingham 10 10 9 10
Newham 10 8 9 10
Coventry 10 10 8 10
Islington 10 10 8 10
Leicester 10 10 8 10
Newcastle upon Tyne 9 10 8 10
Norwich 8 10 8 10
Haringey 10 9 8 10
Oxford 10 9 8 10
Southwark 10 9 8 10
Ealing 10 8 8 10
Camden 10 10 6 10
Westminster 10 9 6 10 While it can be seen that, in general, places which rank high on the overall estimated rate of destitution tend to be high on all three components of this estimation – migrants, complex needs, and UK-other – this is not true in all cases. Broadly, the top authorities tend to be Scottish, northern and midland major cities with a history of de-industrialisation, together with a number of London boroughs with a similar history. The one seaside town, Blackpool, could be said to have experienced its own form of de-industrialisation, albeit from a base in tourism and entertainment, and it is notable in the top group for its low score on migrant destitution. Two southern provincial university cities also feature (Norwich and Oxford), perhaps due to housing /homelessness pressures and high levels of complex needs.
26
Conclusion We estimate that during 2017 the number of households experiencing destitution and using crisis services across the UK was 785,000, involving 1,550,000 people of whom 365,000 were children. Thanks to improved coverage and methodology changes, we believe the national annual estimates are more robust than those made for 2015 but are nonetheless subject to a margin of error of +/-20%. Based on comparisons for the same service agencies in the original 10 case study areas only, our central estimate is that there was a 25% fall in destitute service users from 2015 to 2017 (the true figure could potentially lie in a range of -11% to -32%). Based on other evidence in this survey and wider evidence, we suggest that this net reduction results from a sharp reduction in benefit sanctions in this period, favourable labour market conditions and some changes in migration. The most common deprivations for destitute households were food (62%) and clothing and toiletries (46–47%), while nearly half lacked three or more essentials. The demographic profile of destitution is similar to that reported in 2015. Three-fifths of destitute households are single adults while others are single people staying with other households. Destitute households are more likely to be headed by a male, younger than average, and relatively unlikely to be working, but the share of migrants is only slightly above the population average. Two-thirds of destitute households live in a house or flat of their own, and of these most are in social housing, with home-ownership a rarity. In all, 15% of destitute households have complex needs (of whom one-third are migrants), 16% are migrants (without complex needs), and the remaining 68% are UK-other households. The profiles of these three groups are broadly similar in many demographic respects, but the complex needs group tends to be more deprived (especially migrants with complex needs), while the UK-other group are more likely to have their own (almost always rented) home. The geography of destitution is similar to that reported in 2015, with a strong emphasis on major cities and former industrial areas. Destitution has a relatively low incidence in prosperous parts of the south of England outside London.
27
4 Routes into destitution in the UK Introduction This chapter considers the main routes into destitution in the UK. The cause of destitution is a controversial subject, and it is always a challenge in any social scientific context to prove causation. But as noted on the original 2015 study, the combination of the quantitative data generated by the survey on destitute service users' experiences over the past 12 months (which alerts us to potential causal factors) and our qualitative interviews with destitute households (which enabled in-depth inquiries about the nature of any relationship between these experiences and the onset of destitution) enabled us to identify the relevant triggers for destitution and the factors that contribute to them. As we noted in 2015, the picture of routes into destitution emerging from this data is a complex one, with no predominant, single cause. Rather, the main pattern is that of several interacting factors undermining the ability of people living on extremely modest resources to meet their essential needs in particular circumstances. This remained the case in 2017. However, some variation between the patterns in 2015 and 2017 are noted, both in the survey findings on destitute service users' experiences over the past 12 months, and the qualitative data derived from the 41 in-depth interviews conducted. We begin by presenting the survey results in 2017, before reviewing the main themes which emerged from the qualitative evidence, including the relationship between destitution and sustained low income; debt-related issues; benefit-related issues; disability-related issues; employment-related issues; relationship breakdown; and issues specific to migrants.
Destitute respondents' experiences over the past 12 months We asked respondents about a range of experiences over the previous 12 months that the existing literature and our key informant interviews suggested may contribute to routes into destitution. This list was expanded compared with the 2015 survey (see Chapter 2 and Appendix 1). As we would expect, there were differing experiences between our three main sub-groups, as shown in Figure 16. Financial problems were very common among the destitute population as a whole (57% reported these15) but especially among UK-other service users (62%) and also those with complex needs (57%). Serious debt affected fewer respondents than getting behind on bills, but was still a significant phenomenon, reported by around three in ten of the UK-other and complex needs groups. Health problems are the second most commonly reported type of problem after finance/debt, affecting more than two-fifths of all destitute (43%) and UK-other (42%) groups, but as many as 67% of the complex need group (see also Loopstra and Lalor, 2017). The 2017 questionnaire specified mental and physical health problems separately, and it is noteworthy that mental health problems were more commonly cited overall (34% versus 21%) by both UK-other and complex need groups. It is not surprising that mental health problems are particularly associated with the complex need group, but still striking to see that 64% of this group mentioned such problems. Migrants presented a contrasting picture, with only three in ten mentioning health problems, and only half of this group (16% of all migrants) specifying mental health issues. Problems with the benefit system remain important, again affecting around two in five of all destitute (39%) and UK-other (41%) groups, and more than half of the complex need group (53%). These problems arise from both delays (29%) and sanctions (21%). Adding to previous evidence that benefit sanctions disproportionately affect homeless and other vulnerable groups (Batty et al, 2015), they were particularly common among the complex needs group (35%). Given that migrants are less likely than UK-born respondents to be receiving benefits (as many have no recourse to public funds), it is unsurprising that they reported experience of benefit problems less often (23%).
28
Significantly less common overall were relationship issues, affecting a quarter of all destitute households (24%), including issues with people's relationship with family (16%), divorce/separation (9%) and domestic violence (8%). However, these problems were much more prevalent in the complex needs group, where nearly two-thirds (64%) mentioned one or more of these. For this group, concerningly, domestic violence loomed very large (40%) (see also Bramley et al, 2015; JRF, 2016). For both the UK-other and migrant groups, rates of reported domestic violence were radically lower (4% and 0% respectively). Next in frequency were problems relating to loss of jobs, pay or hours of work, affecting a fifth of all destitute households (21%). These affects were slightly more common for migrants and complex needs cases. Next after that came drug, alcohol or offending problems, a new category introduced in the 2017 survey. While these issues were reported by only 17% of all destitute respondents, they featured for no less than 75% of complex needs cases. This is not surprising, as our definition of complex needs takes account of these reported problems (though someone would have to report both substance and offending, or one of these and at least one other of homelessness, begging or domestic violence, to be classified as complex needs). The two least reported types of problem were eviction problems (10% overall, but 23% of complex need cases) and migration-related issues, including coming to the UK in the last year or having a problem with the right to remain in UK (7% overall, but 23% of migrants and 16% of complex needs). Figure 16: Problems/issues experienced in last 12 months by destitute service users in three main sub-groups (grouped problems)
Despite this picture of a battery of adverse experiences over the previous year, particularly for the complex needs group, it is also noteworthy that 15% of all destitute cases reported none of these experiences. This was almost unknown for the complex needs group but was more or less equally the case for migrant and UK-other destitute. This may indicate that our list of experiences was not sufficiently exhaustive to cover all the relevant possibilities. But our qualitative evidence both in 2015 and 2017 indicates that, for some people, life is a long-term struggle and they are always in a position of being close to destitution where it doesn’t take much to push them over. As noted in Chapter 3, the most robust way to identify change over time is to focus on 'like-with-like' comparison of the 52 agencies in the 10 original case study areas which took part in both surveys. This reveals that the pattern is one whereby some types of problems have reduced in their prevalence somewhat among destitute service users, while others have remained at a similar level. In particular, benefit sanctions appear to have reduced (from 27% to 19%), as have benefit delays (35% to 29%). As
29
discussed in Chapter 3, this finding on sanctions ties in with a broader national picture of relevant trends (National Audit Office, 2016a; Webster, 2017), and helps to confirm one of our hypotheses about their important role as a key driver of destitution. The remainder of this chapter uses the qualitative interview data to investigate how, if at all, these experiences contribute to service users' routes into destitution, alongside any other contributory factors not covered in the questionnaire. As noted in Chapter 2, the demographic profile of these interviewees broadly reflected that of the destitute population as a whole. Of the 41 qualitative interviewees in 2017, 26 were in our UK-other sub-group, nine were migrants (without complex needs), and six were respondents with complex needs (three of whom were UK-born and three of whom were migrants to the UK). This selection reflected our desire in the 2017 study to focus particularly on the issues facing the UK-other group in the UK, whose experiences of destitution are less well researched than those of the complex needs group (especially those who are street homeless) and the migrant group (especially asylum seekers).
Sustained low income As in the 2015 study, destitution in 2017 seemed to stem most often from a gradual weakening in people's ability to make ends meet on a very low income, culminating in their being unable to get essential goods in particular circumstances. While 'shock' factors could also be highly relevant, typically debt or benefit-related (see below), it was the long-term erosion in interviewees' capacity to withstand even minor financial shocks that pushed them into absolute destitution. As noted in Chapter 1, this backdrop of sustained low income on the part of the destitute population has been exacerbated by the ongoing cash freeze on working-age benefits affecting all of the main income-replacement benefits (Hood and Norris Keiller, 2016; CPAG, 2017). At the same time, restrictions in housing allowances, in particular the under-occupation penalty (often referred to as the Bedroom Tax or spare room subsidy), and freezes in Local Housing Allowance rates, mean many claimants are now having to 'top up' their rental payments by dipping into their subsistence benefits intended to cover other necessities, such as food and fuel. These and myriad other benefit cuts implemented as part of the UK government's austerity programme was the background to destitution for many interviewees in 2017:
“I…moved into this property because I had to move out of the other property, and I'm getting …Housing Benefit through Universal Credit, but they don't cover the whole of the rent, my rent's £380 and they cover £280. So, I have to add on £100 out of my benefits each month, which is quite hard because I'm getting less money than I should as well, because I'm getting deductions coming out and all the water bills and it's just getting a bit – it's got on top [of me] … I've used it [food bank] about five, six times.” Female, 25–45, UK-other “I had to pay £120 a month, out of my own pocket towards my rent… Mentally it was a real strain, a real strain. If it wasn't for friends and family, I don't know if I'd still be here to be honest… Then, the embarrassment as well, ending up like that at my age. Having to go to the food bank for the first time, for me… I never thought I'd end up going to somewhere like that. I always thought, yes, that I'd be okay, and I'd get through it somehow. When I had to go to the food bank, it became quite often at one point. I was going there pretty much every week, because I had nothing.” Male, 25–45, UK-other
Many UK-other interviewees faced a tangle of interacting issues, including debt, health, and benefit problems which, against a backdrop of prolonged very low income and unaffordable housing costs, simply left them too little to get by on:
“I'm making up the rent arrears, as well as paying Bedroom Tax, which is £17 a week. Straight away £44 goes out of our benefits to Bedroom Tax and arrears…. We moved into the food bank a few weeks ago…. The reason why we started going was because I'd been really poorly and hospitalised, and then I moved away...for six months to a residential programme to recover. I had my PIP [Personal Independence Payment] stopped, and we can barely afford to get by, we couldn't afford to live... we're paying this Bedroom Tax…It was just all a nightmare…” Female, 25–45, UK-other
30
The further squeeze on access to benefits for migrant groups since 2015, including asylum seekers and EEA migrants, was noted in Chapter 1. Several migrants interviewed also stressed that their income was so persistently low that they struggled to pay for necessities, including rent and food, even when receiving the standard rate of UK benefits (and of course many migrants receive a much lower rate of benefits or have no recourse to public funds at all, as discussed further below):
“…to live with that £75 is not easy. It was very, very difficult because during that period… Most of my shopping was based on the shops that are like, pound shops or the supermarkets that give you offers.” Male, over 45, UK-other
As discussed in Chapter 5, overall access to support for destitute migrants seems to have weakened since 2015. A mark of just how desperate the position is for some in this group is the finding that 5 of the 12 migrants interviewed in 2017 had slept rough in the month before the survey. As in 2015, complex needs interviewees often struggled to satisfy the conditions attached to their benefit claims (see also Batty et al, 2015), meaning that they could be left with no cash for extended periods:
“About a month I think… [I was sanctioned] …because they [Jobcentre] couldn't find out where I was and what I was doing, where I was living or nothing, so I contacted them and said, “look, this is where I am, this is where I'm staying” … A lot of people didn't like me. I had to go into hiding…Back then I used it [a food bank] about every week really.” Male, 25–45, complex needs
Some in the complex needs sub-group, lacking family or other forms of support, had evidently spent many years periodically going without food and other necessities:
“I've gone a few days [without food]. As long I've got my coffee, do you know, I'm not bothered.” Female, 25–45, UK – complex needs
Debt-related issues Debt and arrears, particularly to public authorities, emerged as a major issue in the 2015 study, frequently triggering or contributing to destitution in a fairly directly. Arrears on rent, Council Tax and, to a lesser extent, utilities including water, gas and electricity, alongside court fines, were again a prominent theme in our 2017 interviews. In this follow-up study we took the opportunity to explore in greater depth some particular aspects of the links between debt and destitution: third-party deductions; use of 'risky' lenders (payday lenders, unlicensed money lenders, and doorstep lenders); and the implications of various debt relief 'solutions' (see also Barker et al, 2018) However, a general point to emphasise is that, even when an individual is just about managing to ‘keep their head above water’ with their everyday bills alongside paying back modest arrears, there could be little left for necessities, easily pulling them under into destitution:
“It's really hard when you try to make sure that everybody has a little tiny bit of everything. What's left is not much to live on like for food or anything.” Female, over 45, UK-other “All of them. I can't pay them; electric, gas, Council Tax. I'm not working so how am I supposed to pay any bills? They're expecting the same amount to be paid that I was paying when I was working and I'm on nowhere near the same amount of money. So, at some point I've just had to stop paying them because I wasn't living properly, I wasn't eating, I'm going to the doctors for my tests and they're saying I've lost weight.” Male, 25–45, UK-other
31
Third-party deductions 'Third-party deductions’ can be taken from ‘legacy’ benefits (existing means-tested benefits being replaced with Universal Credit) to cover 'priority debts' connected to maintaining and sustaining a home, such as arrears of rent, Council Tax, fuel and water, and to recover court fines. Third-party deductions have been cited by some debt advice charities as a potentially useful and affordable way of paying for arrears from these 'preferred creditors' (eg StepChange, 2017), so long as due consideration is given to other arrears, payments and commitments the claimant may have. However, when taken out of household benefits alongside deductions imposed by the DWP to recover prior loans, benefit advances or recovery of overpayments (see further below), the deductions leave people with so little income that they are rendered destitute:
“…the money for the social loan…and the Council Tax…I'm not 100 per cent sure how much they're taking out…if it's £10 a fortnight, I don't mind that. I think it was mainly the social loan, they were trying to take like £80…so I'm still left with not much, but a little bit every fortnight… I'm on about £35 every two weeks.” Female, 25–45, UK-other
The same respondent explained how a third-party deduction, along with repayment of a budgeting loan16, had left her with a tiny amount to live on, so she had to use a foodbank:
“…they was only leaving me £4.90 a fortnight for Income Support because the deductions, the Council Tax, I had a loan, social loan to get by with the kids…” Female, 25–45, UK-other
Under legacy benefits, total deductions must not exceed 25% of the claimant’s personal allowance without their consent. Under Universal Credit, however, total third-party deductions can now equal 40% of the standard allowance for all those eligible for benefit and can be higher where the DWP believes it would be in the claimant’s interests to pay more.17 Under both Universal Credit and legacy benefits, most charges are fixed at 5% of the personal/standard allowance (subject to these overall caps). However, under Universal Credit only, third-party deductions for rent, service charges and overpayments associated with rental payments will be deducted at a rate of between 10% and 20% of the standard allowance (whereas housing-related deductions taken from legacy benefits are fixed at 5% of the personal allowance). Another important change under Universal Credit is that claimants under 25 can also now be subject to third-party deductions (deductions under legacy benefits are restricted to claimants over 25). Three interviewees found that, after they moved onto Universal Credit, their third-party deductions levels had increased significantly (see also Legal Action Group, 2016):
“…because I had some arrears, which I knew nothing about until they told me. So, I've got to pay all that back, so I'm living on about maybe £200 for a month and by the time I pay out my electric, or what debts I've got, it leaves me with nothing, so I've got to rely on the food bank or neighbours for food.” Female 25–45, UK-other
However, we also came across instances where third-party deductions could have been sought by preferred creditors, who instead chose to pursue their debt in an alternative way. Utility companies, for example, have the option of putting prepayment meters in the homes of consumers in arrears, with debts and standard charges being deducted alongside charges for current use. There is evidence that this can leave clients choosing not to top up the meter at all over certain periods (self-disconnecting) (Vyas, 2014). Ten interviewees had prepayment meters, of whom seven were paying off arrears and reported being unable to top up their meters sufficiently to get sufficient fuel for at least some of the time. One interviewee without a prepayment meter commented:
“…if we had had a prepayment meter last week, we would not have had any electricity.” Male, over 45, UK-other
32
Likewise, although Council Tax arrears of over eight weeks can be requested through third-party deductions, two interviewees stated that their local authority had instead pursued their arrears through the courts. This meant that court fees were added to their existing debt, making it even more difficult to pay for necessities such as food (see also House of Commons and Pensions Committee, 2016; Ollerenshaw, 2016). In one case an interviewee had recently taken custody of her grandchildren but was without adequate funds to support them until the Child Benefit and Child Tax Credit was sorted out. The school was supporting her with food bank vouchers and at the same time the council was taking her to court for Council Tax arrears she could not afford to pay:
“…the Council Tax…they're saying over the payments, “we're taking you back to court”. “What are you taking me to court for? I haven't got the money.” Honest to God…but if you can't pay it in the first place, and they then stick £140, at one point somebody had put on. How do they then expect you to pay that because now they've put it up another £140 even more?” Female, over 45, UK-other
‘Risky’ lenders (payday lenders, doorstop lenders, unlicensed moneylenders) Since the financial crisis that began in 2008, most mainstream forms of credit have been difficult to access for those on very low incomes (Henry and Morris, 2017), and there was rather more evidence in 2017 than in 2015 of interviewees using non-mainstream 'risky' lenders, with consequent difficulties in repayment that led to them not being able to afford necessities. For example, four interviewees in 2017 reported using a high cost form of credit from payday lenders. One explained that delays with Universal Credit and DWP deductions for overpayments and budgeting loans (see further below), had meant she could not pay her rent and felt forced to turn to a payday lender to avoid eviction:
“... [the payday loan company] … wouldn't hold the interest or anything. …one of the loans that was originally £180 ended up being a £500 loan by the time I came to actually start to pay it back.” Female, under 25, UK-other
In another case, a payday loan was used to pay for the funeral of a close family member, and the repayments proved unmanageable:
“I did have a payday…[loan]… but that was because my dad died, and the funeral was £4,000. So, it was trying to find that money, otherwise we weren't able to bury my dad. We've ended up in debt for a reason…by the time I got made redundant…I didn't have a choice, I couldn't pay any more... it's robbing Peter to pay Paul – that's literally the way we have to live…it's a constant juggling act. …And there's always something more important, that's the problem – you know, the food or the bills; so rather than getting more and more into debt or not having food on the table, it's a toss-up... we've been able to use the food bank a few times…” Female, 25–45, UK-other
Another issue highlighted by two interviewees was ‘doorstep lenders’, who not only charge very high interest rates, but also effectively have first call on any money that debtors receive (after third-party deductions) because they time their visits to coincide with claimants receiving their benefits. It has been reported elsewhere (Falconer and Lane, 2017) that those finding it difficult to repay loans are often offered a new loan to cover the debt, and to help pay weekly sums, and can find themselves in a cycle of debt which is very difficult to escape. This was the case for one of our interviewees:
“When I was younger like when I opened bank accounts and stuff I was getting loans, getting loans off them and stuff and just obviously couldn't afford to pay them back. I kept putting them off, couldn't afford to pay them back and then ended up getting a Provident loan which obviously you get, I got £500 and I got myself, you know, a lot of debt…I haven't paid it back yet…they come and knock on your door every week. I've actually had a letter off
33
them saying that they were going to get the bailiffs involved…about two months ago, but I keep getting letters and text messages off of the bailiff's company saying it's my final warning, but to be honest, I've just been ignoring them…” Female, 25–45, UK-other
Finally, one interviewee reported having been panicked by large-scale Council Tax arrears and associated court fees into seeking help from an unlicensed moneylender:
“…because obviously I had the bailiffs at the door, I didn't know what to do. I've not got no stuff for that amount that he was saying, but he threatened to take everything, and my kids was there listening to it all. They were threatening to take my settees the lot... I've settled some of it…the person ended up breaking my telly, which was £300... I did get threats from him because he's not a nice person, you'd say he was loan shark. So, he gave me a bit of trouble…” Female, 25–45, UK-other
Debt relief solutions Some interviewees had sought debt advice and as a result had pursued debt relief 'solutions' of various kinds, most commonly Debt Relief Orders (DROs). DROs are a low-cost form of insolvency aimed at those on very low incomes, with few assets and debts of less than £20,000 (only available in England, Wales and Northern Ireland, but Scotland has a similar arrangement). A DRO costs £90 with the fee paid directly to the Insolvency Service. Some of those we spoke to had accessed the DRO fees through ‘crowdfunding’, putting their details on a charity website.18 Others had borrowed from a family member to cover the cost of a DRO fee:
“Yes, £90 each…I borrowed it off my aunt…Well my aunt, she gave me £90, and then lent me £90 [for my wife’s DRO] so I paid her £90 back…it's better than going bankrupt because going bankrupt is about £850 I think.” Male, over 45, UK-other
However, even once a DRO had been taken out, this did not necessarily guarantee that creditors that had been part of the DRO stopped trying to recover the money they were owed in another way (though they are barred from doing so during a 12-month period). For example, one interviewee with a DRO noted that arrears were still being deducted by the utility company through the prepayment meter:
“…we noticed that this was happening, because we were putting, like, £50 in a month, and it was going in three weeks, so we was having to find more money…it was a prepayment meter…they have to refund the whole lot, which, reluctantly, they did. It took them 12 weeks to refund it, and three cheques.” Male, 25–45, UK-other
It should also be noted that payments recovered by the DWP for benefit advances (see below) are considered ‘payments on account’ and therefore not subject to the insolvency remedy (DWP, 2018). Personal bankruptcy (sequestration in Scotland) was also explored by some respondents as a solution to their debt problems, but was more expensive than DROs and unaffordable for those on extremely low incomes:
“…their main plan at that point was heading me down the ‘go bankruptcy route’ unless I got into work. Now, really, I couldn't get into work at that point; I just wasn't well enough. So, I was starting to think in terms of bankruptcy. But that's when I found out that I needed at least £250 and that I couldn't access that money.” Male, over 45, UK-other
Benefit-related issues While, as already discussed above, and in line with national trends (National Audit Office, 2016a; Webster, 2017), benefit sanctions appeared to have declined among our respondents in 2017, for the minority affected (seven interviewees reported at least one period of benefit sanctions) this still caused a major income shock, requiring them to seek help for basic necessities from family members and charities:
34
“I went to the vicar quite a lot and he helped me with food and stuff, and chip shops were giving us free food, chips and fish and chips free.” Male, 25–45, complex needs “… I was just asking my mum to pay the gas and electric and I used the food bank.” Male, 25–45, UK-other
“…at the time I was going through sanction and stuff like that because I was on Jobseeker's Allowance, and because of illness it wasn't being managed. I wasn't eating properly, I wasn't sleeping properly. I kept missing appointments. I didn't have any money to go to the Jobcentre. The Jobcentre was far, it was all the way in town...” Male, 25–45, UK-other
A more widespread concern than sanctions, however, was delays and gaps in getting benefit. While these issues affected interviewees claiming, or moving between, a range of benefits, they do seem to have been exacerbated in 2017 by the roll-out of Universal Credit, especially given the period (at the time of fieldwork19) of at least five to six weeks before the first payment was made following a claim (see also Loopstra, 2018 and Jitendra et al, 2017 who note a rise in food bank use in areas where Universal Credit has been fully rolled out). Although only five of those interviewed in 2017 reported that they were now claiming Universal Credit, the additional difficulties this posed for these claimants was evident. During the period that claimants were awaiting their first Universal Credit payment, those with no savings were unable to make payments towards their rents, debts or to cover necessities such as food and heating, and so found themselves needing to seek emergency help:
“…it was food banks, friends, family. It was pretty much a case of, almost begging, I suppose, which made… Because, I'm quite a proud person, I like to try and sort as much as I can myself. I don't necessarily like asking for help, but it was at the stage where we had no choice.” Male, 25–45, UK-other
“…[DWP] gave me an emergency payment at some point, but there was an awful long wait…I was going to food banks when the cupboard was already empty…” Male, over 45, UK-other “They made me go eight weeks without any money…I did have to live basically out of a food bank… [and]… how can I pay for heating and that when I didn't have any money coming in?” Male, 25–45, UK-other
From January 2018, claimants can ask for a Universal Credit Advance of up to 100% of any expected benefit payment (DWP, 2018).20 However, this is reliant on an affordability assessment, which takes into account that the advance usually has to be paid back within a six-month period (this can be extended to 12 months in exceptional circumstance).21 Benefit advances are especially high risk for those who, like so many of our interviewees, have pre-existing debts:
“This year … [using the food bank] …it has been due to waiting for the Universal Credit coming through…I started off that six-week period with zero …I did get a benefit advance. But it's not your weekly benefit … you've got to pay it back. But if you think for six weeks you can only get half of your benefit…at the time because I've got something like £25,000 worth of creditors chasing me for money. So, I was kind of living on about … £30 a week because I was that keen to just get them off my back and just pay – I was only, like, paying them £1 or something.” Male, over 45, UK–other
The fact that benefit advances are paid back from ongoing benefit can also reduce an individual’s ability to pay for necessities:
“…you could get an advance, if you need it quickly, but then that advance comes out whatever money you're getting. So, you're still not left with very much at the end, by the time you pay everything back, your loan or advance, or whatever it is, by the time you pay it back, you're not left with much.” Female, 25–45, UK-other
35
As with benefit advances, benefit overpayments, even where they resulted from a DWP error, can be recovered at source from future benefit payments. The standard rate of deduction from legacy benefits for an overpayment is £11.10 a week with a higher rate of £29.60 a week where the claimant is accepting an administrative penalty.22 Under Universal Credit, the standard rate of deduction is 15% of the personal standard allowance and the higher rate is 40%. Usually only one overpayment is deducted at a time. However, where there are overpayments with different authorities such as the DWP, HMRC (of Tax Credits) and the local authority (of Housing Benefit), they can all be claimed at the same time. With legacy benefits this means three overpayments could be deducted so long as this left the claimant 10 pence (or over) a week or 1 pence (or over) in the assessment period for Universal Credit. One interviewee explained how a DWP mistake resulted in a large overpayment of benefit which, combined with a delay in payments of Universal Credit, resulted in their running up substantial rent arrears:
“I got took to court with it [rent arrears and overpayment], even though I explained that it wasn't my fault... So, I had no income, I was waiting for Universal Credit to actually authorise my payments and everything else and they should have done the backdate, I got nothing… I got told I had to agree to pay £3.70 [court judgement] a week or I would lose my property... we were using a food bank in our local area…[and]…[w]e borrowed off my partner's dad, so we owe my partner's dad a fair bit of money as well.” Female, under 25, UK-other
The combined effect of these various at-source deductions on benefits, which are in any case eroding in value year-on-year, can be to restrict the ability of households on very low incomes to prioritise necessities. Some interviewees described how, even once they were getting Universal Credit, they still didn’t have enough money to heat their home and pay for food:
“Quite a while I've been on it [Universal Credit] … It's just been really difficult, just to try and cope… but it's like the food element is like, I've got to rely on the food bank, to get food, or I would be having none of it [food]. I'd have no food…” Female, 25–45, UK – other
A final Universal Credit-related issue is the ending of automatic direct payment of rent to social landlords,23 which was highlighted by one interviewee as a key 'shock' factor driving her into arrears and destitution:
“I was on that [Universal Credit] when I first moved in here, and I've had no end of problems with that because they told me that they paid the Housing Benefit element straight over to [the council] and then what was put into my bank account was my disposable income for the month for myself. Well, it turned out that actually they were putting all elements of it into my bank account, but when I was only receiving £350 a month, I didn't understand how that was supposed to cover me living and my rent…so I've got a massive bill for rent arrears now, that I have to pay back… [during this time] we were entitled to a food parcel.” Female, under 25, UK-other
A more general point is that it was clear that chopping and changing of income from benefits, even if the amounts involved are relatively small, could cause significant stress and a risk of destitution for those just getting by and no more. One interviewee explained that he was able to manage, even on a very small income, as long as the payments stayed constant, as this meant he could confidently commit to payments for outstanding debt and bills:
“One is that if you're trying to get stability, you can get stability on benefits as long as you are on the same benefit for at least three monthly payments. This is the first time this very week that I have had three benefit payments monthly paid. The other seven months I've had an advance, which I didn't know how much I was going to get, because you don't. You're just in the lap of the gods…The only other [payment] was back in January, which was ESA [Employment Support Allowance], which was a fortnightly payment. So, I've had one fortnightly payment, one benefit advance and three payments. Now, no matter how much progress you are making either mentally or physically, it's like trying to organise things on a sinking ship.” Male, over 45, UK-other
36
Disability and sickness-related issues As shown in Figure 16, serious physical health and mental health problems were reported by almost half of all destitute respondents in 2017 and were especially common among the UK-born respondents. It is also clear from Loopstra and Lalor's (2017) large-scale survey of people using Trussell Trust food banks, that disabled people are at a highly disproportionate risk of destitution in the UK. As with the 2015 research, loss of disability or sickness-related benefits was a key income shock triggering destitution, reported by one-quarter of all interviewees. Most in this group had been migrated from Employment Support Allowance (ESA) onto Jobseeker’s Allowance (JSA) or Universal Credit, after being assessed as fit for work. This usually meant both that they received a lower rate of benefit, and also faced a much higher degree of conditionality, with an associated increased risk of being sanctioned:
“[I'm on] Universal Credit now. I was on ESA support group but, because they're getting stricter, they've kicked me off and they've told me apply for a postman's job…Say 300 yards, the walk is – if it's uphill – I stop every lamppost to get my breath back. I can't do it… It was the dole who told me in the first place to go to Citizens Advice, and Citizens Advice told me to go to the foodbank…” Male, 25–45, UK-other
Three respondents had also lost their Disability Living Allowance/Personal Independence Payments (DLA/PIP), after being reassessed as fit for work, together with their Disability Premium or Severe Disability Premium on their main income-related benefit. The amounts of money involved could be very substantial. For example, one interviewee who was an amputee and wore a prosthetic leg, and used crutches to get about, lost £237.75 a week in total:
“…I lost my DLA, it was taken away. So that was…£73 a week, instead of hundreds and something a week, so yes, that was a struggle as well… I know I'm still disabled. I'm still the same. I'm actually getting worse, but there's nothing I can do…[I] did a mandatory [reconsideration] and I got refused for that as well, even though I had more documentation, and I'm still waiting for an appeal date…but, it's apparently taking a long time. It's the courts that are clogged up at the moment… Yes, quite a few times [I used a food bank] ...I was struggling for a while on the money I was getting, but they don't want me to use it [food bank] too often now, because they [local church food bank] said I must budget on the money I get” Male, over 45, UK-other
Employment-related issues As noted in Figure 16, employment-related issues were reported by one-fifth of all destitute service users over the past year, and were also evident for four of our qualitative interviewees. For some of these interviewees, moving on and off benefits had left large gaps in income, meaning that they had to borrow to buy everyday necessities:
“I’ve been in and out of work, but I'm not working at the moment… because I've obviously come off the benefit and then I've had to make a new claim and then it takes up to six weeks to get money and then the whole six weeks I've had nothing, so I've had to borrow money from here, there and everywhere, and yes it's got me into debt and stuff.”
Female, 25–45, UK-other
This situation can be made worse when wages for low-paid work are paid erratically: “I work just 20-odd hours a week… it's not permanent… I hadn't been paid from October until December… we were all surviving on minimum wage, and the wages at the time were, best days, sporadic. Of course, it just all – it's dominos, isn't it? You know, get one week behind, and it goes into the next week and whatever. So, I had to borrow some money off my mum and dad, unfortunately. We don't live that extravagant. It's sort of hand to mouth, really…. I was only getting 16 hours a week as it was. It was £106... I was struggling to get
37
that… get paid on time. That's the secret. It's not a lot of money, but it gets paid on time, and you can budget and run your life properly, you know?” Male, over 45, UK-other
Relationship breakdown In 2017, relationship issues were reported by a quarter of all destitute households over the past year (see Figure 16). Four interviewees reported that a relationship breakdown played a part in their experience of destitution. A key scenario here was being left with unmanageable debt by an ex-partner:
“…my ex-wife run up quite substantial debts, but I thought they were getting paid, but apparently not…if you include everything all together it'll be in the region of £10,000…everybody just wants me to go into a payment plan and we just don't have the money.” Male, over 45, UK-other
“…my ex-partner left me with loads and loads of arrears on the rent. I'm making up the rent arrears, as well as paying Bedroom Tax, which is £17 a week. Straight away £44 goes out of our benefits to Bedroom Tax and arrears… [the food bank] …get quite a lot from them, as I say, we couldn't have got by without them. Especially with the essentials and few extra bits that they gave us.” Female, 25–45, UK-other
In two cases, interviewees had experienced a period of homelessness that they also attributed directly to their relationship breakdown:
“I'd split up with an ex-wife and I was homeless, so I got moved into a local hostel, and now I'm in a shared house…. Awful, so, yes, everything was up in the air. I didn't have a roof over my head, so… The council moved me about 40 miles away from where I was… I stayed with a mate for a couple of weeks, but they've got kids. I didn't want to be a burden on their sofa, so I was spending most of my time in a barn.” Male, 25–45, UK-other
Factors specific to migrants As in 2015, only a minority (14%) of destitute migrants responding to the 2017 survey had come to live in the UK over the past year, indicating that the issues they faced were longstanding ones and not short-term, transitional difficulties. The asylum seekers we interviewed in 2017 had very similar issues to those in 2015, including the very low levels of Section 95 and Section 4 benefits paid via the Home Office, and their inability to access the labour market (see Fitzpatrick et al, 2016). The despair of one interviewee was evident when she commented briefly on how little money she and her family live on while navigating the UK asylum system:
“They said I'm not entitled to anything, at the moment. Well…I do receive…money … It's £35 per person for one week [but rent is not covered].”
Female, 25–45, migrant
As noted in Chapter 1, there has also been a further squeeze on access to benefits for EEA migrants since 2015. One interviewee commented on this:
“I applied for Jobseeker's Allowance, but I was waiting like two months to get through with the funds, because they were counting something, and there was something wrong with my case...the Housing Benefit refused me because I am from EU, and there is a new law that EU members, unemployed EU members are not entitled to Housing Benefit, so I was really depressed at that time... I can't afford food sometimes, even, so if my kids wanted to eat something I couldn't give them this.” Female, 25–45, migrant
38
Conclusion It was clear from both the qualitative and quantitative research in 2017 that the key triggers for the UK-other sub-group of the destitute population – operating against a backdrop of persistent low income – were usually debt, benefit and health issues, very often found in some sort of tangled combination in people's lives. While sanctions remained a relevant concern in 2017, it was evident that the income shocks of greatest import were often benefit delays and gaps, including the now five-week period between making a Universal Credit claim and receiving payment. The migration of people from sickness and disability benefits onto Universal Credit and JSA also continued to cause difficulties for vulnerable claimants who not only lost considerable amounts in benefit income, but also faced much higher risks of benefit sanctions than on their previous benefits. The long-term, sustained and crushing effect of multiple debts, and sometimes harsh recovery practices, was a particular theme explored in more depth in this year's study (see also Barker et al, 2018). The implications for destitution when people are forced into third-party deductions and other debt repayment programmes which leave them unable to meet the bare necessities is clear. The more stringent third-party deduction arrangements being ushered in under Universal Credit are clearly a significant concern with regard to their potential impacts on levels of destitution, together with the apparent upturn in sanction rates under this regime. For a minority of UK-other interviewees, issues associated with low-paid, insecure employment and erratic pay also featured, and interacted with gaps in the benefits, to leave them destitute. For another small section of UK-other interviewees, relationship breakdown, usually in combination with debt and housing difficulties, had played a role in their destitution. For the complex needs group, while debt, benefit and health issues were equally if not more present, the survey data revealed that these issues were compounded by very high levels of relationship problems and breakdown (often involving domestic violence), experience of drug or alcohol or trouble with the police, and, to a lesser extent, eviction and housing problems. Again, as in 2015, it was clear from the more limited number of qualitative interviews conducted in 2017 that some in this group had lived a 'cashless' existence for extended periods of time, and as a result repeatedly found themselves lacking food or other necessities. Migrants' routes into destitution had many of the same features as those of UK-born interviewees, but they faced compounding difficulties. Benefit eligibility restrictions affecting some groups of migrants meant that they often had an income level much lower than that of our UK-born interviewees, or in a significant number of cases no eligibility for benefits at all. As discussed in Chapter 1, this position has deteriorated for both EEA migrants and asylum seekers since 2015. In one marker of just how desperate the position of some in this subgroup is, 5 out of the 12 migrants we interviewed in 2017 had slept rough in the past month.
39
5 Coping with, and moving on from, destitution Introduction Having examined routes into destitution in detail in the last chapter, this chapter examines how people coped with and, in some cases, managed to escape from, destitution. We begin by presenting the 2017 survey results on the sources of support received by destitute respondents in the month before the survey. The chapter then focuses on our qualitative evidence of the experience of going without the six core essentials included in our definition of destitution, before moving on to consider the impact of this on the 41 individuals we interviewed in this follow-up study. Finally, we reflect on routes out of destitution for those who had escaped this condition at the time we interviewed them.
Sources of support for destitute households The sources of both financial and in-kind support received by our three destitute sub-groups in the month before the survey varied considerably, and revealed the particular vulnerability of destitute migrants. Most significantly, as Figure 17 shows, only half of migrant service users reported having received money from benefits (including Home Office support) in the past month, compared with more than three-quarters of the UK-other and complex needs sub-groups. Migrants were also less likely than those in the other sub-groups to have received money from parents or other relatives or friends recently. Note the greater importance of friends than parents or other relatives as a source of financial help for all three sub-groups. LWFs and charities are relatively insignificant sources of financial help for destitute households. Fewer than one in six of any of the destitute sub-groups reported receiving money from paid work (including cash-in-hand work) in the past month. The other notable point is that 32% of complex needs service users reported having begged in the last month.24 Figure 17: Sources of financial support for destitute service users in past month, by main sub-groups
Also note that the high proportions of migrants and complex needs respondents reporting no sources of money (24% and 22% respectively) is consistent with the prevalence of zero incomes reported in Chapter 3 (see Figure 3).
40
Comparing just those services in common in the original 10 case study areas, between 2015 and 2017 there appears to have been a modest increase in several of the categories of financial support reported by destitute households, other than parents, benefits and begging (all relatively static), particularly paid work (+8 percentage points) and charities (+6 percentage points) but also an increase in those reporting no source of money (+8 percentage points). Clearly the increase in those with no source of cash indicates a deterioration in the position of destitute households since 2015, and these findings may also indicate some increase in ‘in-work destitution’, albeit from a low base. Figure 18 shows that destitute migrants were also less likely to report receipt of 'in-kind' support from most of these sources than UK-other or complex needs service users. Half of the migrants reported receiving no in-kind support at all. Charities appear to be a much more important source of in-kind than financial support for the migrant and complex needs sub-groups, and were more prominent than family, particularly for complex needs cases, who may often have become estranged from family. The most important charitable in-kind contribution, however, at least for UK-other cases, came through food banks, which are identified separately here.
Figure 18: Sources of in-kind support for destitute service users in past month, by main sub-groups
Again, using directly comparable data for 2015 and 2017, we identified some very striking changes in patterns of in-kind support. Specifically, there was a large increase in those reporting in-kind help from charities/churches (+21 percentage points, even after listing food banks separately), and some increase in help from friends (+7 percentage points), with a fall in help from relatives other than parents (-7 percentage points). However, the key finding was a very sharp drop in those reporting help from LWFs, of -28 percentage points. This decline in help from LWFs is in keeping with other evidence that these funds are being significantly reduced or closed down across many parts of England (National Audit Office, 2016b; Gibbons, 2017). The increased reliance on help from charities and faith groups reported in our 2017 study is also far from good news, given the humiliation experienced by people forced to seek out these sources to meet their basic material needs, and the clear message from the general public in our 2015 omnibus survey that reliance on such sources does not lessen but rather constitutes destitution (Fitzpatrick et al, 2016).
Experiences of destitution Food As in 2015, most destitute survey respondents (62%) in 2017 and most interviewees reported that they had experienced food deprivation in the month before survey (see Figure 2). The interviews revealed a range of degrees of food deprivation, from not eating for three days, to eating one meal a day, to eating a very stripped-down diet:
41
“I would say [the longest without food] maybe about three days.” Female, 25–45, UK-other “I am now waiting to get paid on Monday; I've got no bread, nothing in at the moment, so I can't have what I call my chip butties or anything.” Male, 25–45, UK-other “Sometimes it's just been one meal a day.” Female, 25–45, UK-other “For quite a while I'll have Rice Krispies for breakfast and maybe a banana and a bit of toast for my lunch and then Weetabix for my tea. I lived like that for quite a bit” Female, over 45, UK-other
As in 2015, it was very common for the UK-other interviewees to have used food banks. Although the effort and kindness of food bank volunteers was much appreciated, having to rely on charitable food prompted widespread feelings of humiliation and degradation (see also Fitzpatrick et al, 2016). What we heard from interviewees in 2017, but not in 2015, was an explicit observation that benefit levels have become so low that this income does not automatically protect people from destitution:
“I'd been homeless before now, on the dole, and I'd never had to have this food bank: I've got my own place on the dole and I've got to use the foodbank.” Male, 25–45, UK-other
As in 2015, parents universally spoke of trying to protect their children from going hungry, usually by themselves going without:
“I've mainly been living on soup just so my little boy can have what he needs really.” Female, 25–45, UK-other
Clothes Almost half (46%) of respondents in 2017 reported lacking suitable clothes or shoes for the weather (Figure 2), and several interviewees spoke of not having items appropriate for cold/wet conditions in particular:
“I've got one coat, I've got no jumpers or anything like that.” Female, 25–45, complex needs
‘The shoes I've got have got big holes in, but I can't afford to buy any more.” Female, 25–45, UK-other “It's freezing up here, I didn't realise how cold it was up here and I've literally got one pair of trainers...” Female, 25–45, UK-other
As in 2015, most interviewees had not received any help with getting suitable clothes, and they explained that opportunities for getting clothes from charitable organisations were much more limited than for getting free food. Even where opportunities did exist to get help with clothing, some interviewees spoke of not being eligible (‘it’s normally if you’ve got kids’) or that suitable items were not available:
“Well when I go to the church, obviously they do a clothes bank. So if they've had winter coats or whatever, depending on what they get, they'll put out on the rack. So you just help yourselves and very often when I go round there I will go through it and see if there's a suitable coat for myself, but nothing as yet, it depends what they get in.” Female, 25–45, UK-other
While some interviewees mentioned buying clothes in charity shops, for others even those prices were beyond the reach:
42
“How can I afford to go to a charity shop because they're expensive!” Female, 25–45, complex needs
Those unable to get free clothes or buy cheap ones were left with only one option – wearing old, sometimes worn-out and unsuitable clothing:
“I've got no money for clothes. I haven't bought any clothes for ages. It was absolutely impossible for me to buy clothes.” Male, 25–45, UK-other
Parents, again, spoke of prioritising children’s clothes over their own:
“…kind of, like, just grin and bear it, but, because, most important to both me and [partner’s name] is that the little man's got clothes, and weather-suitable clothes, so we kind of go without, obviously, in order that he's dressed, as such.”
Male, 25–45, UK-other “My little boy needs his wellies and stuff in this weather so I'd rather get his and get mine when I can eventually afford it.” Female, 25–45, UK-other
Children’s clothing was a major issue for parents because of the frequent need for new clothes as they grew. The expense of school uniforms was also mentioned as a particular challenge. Toiletries Lack of toiletries was reported by almost half of survey respondents (47%, see Figure 2), and by some UK-other interviewees in 2017. Those who relied on food banks spoke of usually being able to get toiletries from food banks. A few interviewees mentioned that some essential toiletries – such as nappies of a certain size or toilet paper – may not be available on each visit to a foodbank:
“The first time I went to the foodbank they gave me toilet roll, but last time I went they didn't have any. […] I went to a public toilet and stole some toilet roll to go home.” Female, 25–45, UK-other
Heating and lighting As in 2015, heating emerged as a far more common deprivation (42%), than lighting (20%) among the destitute survey respondents in 2017 (Figure 2). Not being able to heat their home also emerged as a primary deprivation among the interviewees in 2017, both in terms of its frequency and the severity of the experience:
“I can't afford to put the heat on for a long time in this flat, so therefore sometimes you wake up and you can't move because your back's in spasm because of the cold. It is freezing, absolutely freezing here.” Female, over 45, UK-other “I have a little thermostat from Age Concern. They say if it goes below 12 degrees you're risking hypothermia, which it often does.” Male, over 45, UK-other
Some of those with prepayment meters could not always heat their home even when they topped up the meter, as energy providers recover debt via such meters (see Chapter 4). This sometimes came as a shock to interviewees:
“‘About £32 has just disappeared off it [the meter]. I've got to go to Citizens Advice: “Where's it gone?”' Male, 25–45, UK-other
For a substantial minority of interviewees, their inability to heat their home adequately was related not only to affordability issues but also to very poor insulation:
43
“You can't keep warm because even when you put the heaters on, it's not actually heating the room up; you don't feel the heat. Me and my little dog tend to snuggle together in a blanket.” Female, over 45, UK-other “I just find too, because the fact the flat is poorly insulated, if I do put the heat on, it doesn't have a terribly big effect. So I would sleep with my jacket on.” Female, over 45, UK-other
Interviewees unable to keep their properties warm spoke of putting on as many warm clothes as possible, but some also tried to escape the situation by spending more time asleep. One interviewee who could not afford electricity to light his home resorted to using candles:
“There was times when my electric ran out and I didn't have electric for days. What I did, is I bought cheap candles from the pound shop and used them to light up my house.” Male, 25–45, UK-other
Shelter In the qualitative part of the 2017 study we decided to look in depth at the previously less well-evidenced experience of destitution among the UK-other group. As a result we interviewed relatively fewer migrants and people with complex needs this time round, and consequently accounts of rough sleeping were less frequently reported. However, it was again apparent that those who experienced staying in homeless hostels and shelters often disliked living alongside people with complex needs (Mackie et al, 2017). For this reason one such interviewee tried to minimise the time spent at the shelter:
“It's not friendly. Basically, I was staying at the library till eight o'clock. Then I'd get some sandwiches, and went back to [shelter’s name].” Male, 25–45, migrant
Additional essentials A substantial proportion of interviewees spoke of having at least one additional essential need, over and above the six items included in the very minimal 'basket of goods' used in our definition of destitution. This included situations such as a father having to travel daily to hospital over an extended period due to his new-born baby being unwell, or having additional travel expenses due to caring for a relative:
“I'm always saying to him [partner], you know, “We need to try and start saving”, but every time we have £10 or £20, it's got to go in the petrol... because... he's having to go to his mum's, so he needs that money for the petrol, and – [sighs] it's constant. It's always something.” Female, 25–45, UK-other
Several interviewees have also pointed out that having a job incurs additional expenditure, particularly paying for transport and having a mobile phone:
“The other thing ... because I was working and I needed my car for the work, driving there and back. It's keeping my car running as well, and because I've moved up here, it was just under £30 a month for the car insurance. That's gone up to £42 now because I've moved up here. Obviously, my phone and that as well. I can't not have my phone.” Female, over 45, UK-other
Those searching for work also saw it necessary to have a phone:
“Obviously, you can't phone employers if you haven't got a bit of credit on your phone.” Male, over 45, UK-other
Looking presentable at a job interview also creates additional needs for jobseekers:
44
“I keep always, keep myself positive. Let's get a job. The only thing that sometimes it's against me that I don't have a haircut because I don't have any money.” Male, over 45, migrant
As also noted in 2015, some interviewees had additional essential expenditure associated with physical or mental health conditions:
“I have Crohn's Disease […] quite a big thing that I need money for is all the medication and stuff.” Female, 25–45, UK-other
It was also clear that many interviewees lacked household items that most people would consider essential:
“My cooker shorted and blew up a few weeks ago, so I'm using my sister's little ring thing that she uses for camping and like I'm thinking at this juncture in time, it's Christmas coming and I haven't got a cooker.” Female, 25–45, UK-other “My house hasn't got any insulation. It's a studio flat, it has just basic cheap council double glazing, which doesn't really help because the windows freeze up at night. I haven't got any curtains.” Male, over 45, UK-other
The impact of destitution While a range of specific effects of destitution are presented below, it needs to be stressed interviewees were often affected on many levels:
“Just feeling, sometimes not wanting to be here, just breaking down, not going out, not wanting to speak to anyone, missing appointments, not on purpose, just because I can't face going out. My health, I've started to get alopecia, losing hair because I'm so stressed out, I constantly get migraines, sometimes I'm really ill, I can't get out of bed, I'm just constantly sick, and because I've got nothing inside me it's just horrible, it's just not nice at all.” Female, age 25–45, UK-other
Mental health The mental health of most interviewees had been affected by their destitute situation. The most common mental health disorders were depression, severe stress and anxiety, with a few interviewees admitting to having suicidal thoughts:
“…it's the way I felt. It's like nobody wanted me here, I wasn't worthy of being here, it's like everybody was against me, “Maybe I should just remove myself from this environment altogether”, and things like that, and it's more like, suicide thoughts.” Female, 25–45, UK-other “Mentally it was a real strain, a real strain. If it wasn't for friends and family, I don't know if I'd still be here to be honest… it felt like I was just getting struck down, left, right and centre. I was just tired of fighting all the time.” Male, 25–45, UK-other
Typically, the factors triggering destitution such as debt, job loss, or benefit delays and sanctions were stressful in themselves, while the resulting lack of essentials further exacerbated the associated stress and pressure. Debt in particular was a clear stressor for our interviewees:
“There was [debt on] water, gas, electric. There was a milk bill thing that I had over in [name of location]. I'd had a milkman coming, and then things got difficult, and then I couldn't pay the bill and it was going higher and higher. That was £80 odd for that from a milkman which I was really upset over that. It's not just a case of me saying, “Do you know what, I
45
really can't be bothered.” I have been so stressed. I wouldn't even come out my front door. I wouldn't open the curtains. I wouldn't get dressed. I was in a bad state.” Female, over 45, UK-other “Quite often, like with people coming to the door, I get panicky.” Female, 25–45, UK-other
Dealing with the benefit system was another prominent stressor, mainly because of the experience of benefit delays, administrative errors or benefit sanctions. This had left some interviewees with a very impaired sense of agency and control over their lives and capacity to meet their most essential needs:
“I worry all the time, is something going to happen about my benefits, like, what I can't do anything about. If something does happen then things will start building up like my loan then like my gas and electric will start running out and food will start running out and then it all gets on top of us.” Female, 25–45, UK-other
“Every time that you're going for a tribunal, you don't even know if you're ever going to have any money, and if you don't, you're left wondering, well, what the hell am I going to do now? You can't just be confident these days.” Female, over 45, UK-other
As well as the impact that triggers of destitution had on mental health, the sheer inability to afford essentials or to maintain a sense of personal dignity had its own undermining effects:
“I know my personal appearance probably leaves something to be desired. I don't look very glamorous and I haven't been to the hairdresser since Christmas 2008. I could afford to go to a hairdresser at that point, but since then, it’s not really been possible you know…certainly I think my self-esteem is lower than it could be, if I dressed better.” Female, over 45, complex needs
Furthermore, the mental health of some interviewees was affected by the lack of support they experienced or perceived when they found themselves destitute:
“A lot of other people were dismissive and left me to rot in the situation. This is why I got depressed, because I thought I was on my own.” Male, 25–45, UK-other
Destitution and mental ill-health could be implicated in a vicious circle, whereby destitution negatively impacted on mental health, and mental ill-health then made it more difficult to escape destitution because, for example, of a decreased ability to search for work:
“Obviously, depression, sometimes when I wake up, I feel like, I don't feel like doing anything for the day. During that period, when you have that kind of feeling, you don't seem to understand the feeling of how to sort a problem or do anything. All of the problems are actually mounting. Instead of sorting out the problems, it's all mounting.” Male, over 45, migrant “Yes, breaking down, being unable to return to work, basically stopping you from functioning, you know? It's a serious as that.” Male, over 45, UK-other
‘I suffer from depression anyway and I just went deep into depression.’ Female, over 45, UK-other
More broadly, there was a strong theme of destitution undermining people's confidence, leaving them dispirited, disheartened or resigned:
“I can't say, ‘Yes, I'm going to be confident I'm going to get the money and this is going to happen, that's going to happen’, because since I've been down here it's all gone horribly wrong. I don't know which way it's going to swing, to be honest.” Female, over 45, UK-other
46
“I think it has a big impact on my whole life, you know, not just health concerns, but also my own feeling of self-confidence, I think, that I don't feel very sort of, proud, or I'm not better than I really am, kind of thing. Yes, and I feel sometimes, I think more than anything is I feel kind of helpless, kind of powerless to change my circumstances.” Female, over 45, complex needs “I've lost all faith in everything. I just don't care anymore. I just don't think I'm going to get anything or everything will work out so that's just my attitude.” Male, 25–45, UK-other
Some interviewees expressed these feelings in terms of the profound sense of stigma they experienced when they found themselves destitute:
“I feel stigmatised every day …by my old friends and people in general.” Male, over 45, complex needs “I know people do look down on me, because I don't have a lot of money. In society generally, I think, people who are wealthy are more respected and better looked up to.” Female, over 45, migrant
Physical health As in 2015, some of the interviewees who reported not having enough to eat reported physical health effects, mainly in terms of weight loss:
“Of course it does [affect your physical health] because you're not eating to sustain you.” Female, over 45, UK-other “I lost quite a lot of weight.” Male, 25–45, UK-other “I wasn't living properly, I wasn't eating, I'm going to the doctors for my tests and they're saying I've lost weight.” Male, 25–45, UK-other
Not being able to afford the right kind of food was a significant issue for interviewees with physical conditions needing a special diet, such as diabetes. A few interviewees also reported that lack of warmth had affected their physical health:
“My legs ache first thing in the morning because of the cold. It's not until I've got them warmed up and all that – how can I put it? – started moving around in the warmth. They'll get better, but I can always feel pains in my legs.” Male, 25–45, UK-other “I had no gas, and it was wintertime and I'd gone to see a doctor, and she took my temperature and she got a bit of a shock, and it was my pulse rate as well that had slowed right down because like I thought I was warm, but I must have been like so, so cold.” Female, 25–45, UK-other
Mental ill-health (particularly stress) had an impact on some interviewees' physical health:
“When I am stressed that's when some of the pains start coming.” Female, 25–45, UK-other “Because I had blood pressure, the thing in terms of my health, it went up slightly higher because of that, because of the stress.” Male, over 45, migrant
47
Social relationships Finally, again as in 2015, several interviewees spoke of destitution having an impact on their ability to maintain social relationships. For some, this happened simply because they were unable to afford socialising:
“Well it [keeping up with the networks] is impossible. You can't afford to travel, you can't afford to do anything.” Male, over 45, UK-other
One interviewee’s account revealed that it is not only relationships with family and friends that may be affected by lack of money, but also the possibility of romantic relationships:
“The only thing I can do is window shopping. I dress myself properly here, but for example if I'm meeting a woman, then it's a little bit difficult because you don't have any money.” Male, over 45, migrant
For other interviewees, asking friends or family for help had made relationships with them awkward, even if only for the person asking for help:
“The first thing is, I really felt that because I'd never done this [asking friends for money] before, one thing that I was saying was that, if I was to go in and ask them, they'd say, ‘What happened to the money that you had before?’ Another thing that I also felt was that I'd be burdening them in some way. On the other hand, I have a feeling of that probably, they might look very low upon me... I felt a bit worried about that but then, I had no choice, I had to tell them the truth... even though I've already paid the money, but I still have the feeling...” Male, over 45, UK-other “I hated that [borrowing money from friends]. I hate asking for money. That's the worst thing when I had to actually do that. I hate that. I'm not feeling comfortable at all. Even my family, even my husband.” Female, 25–45, migrant
Routes out of destitution By the time we interviewed them, on average around six months after being surveyed, 17 of our 41 interviewees were no longer destitute. As in 2015, though, for many this simply meant that they had managed to get themselves back to a position of poverty or severe poverty, but at least they were no longer doing without the absolute essentials.
“They are better at the moment, yes. I mean it's still a struggle like, as I say, if anything sort of goes wrong, ie the cooker, then that's a big problem that you have. You can't just go, ‘Oh well, we'll go and buy a new cooker’, but you do learn to manage.” Female, 25–45, UK-other
Twelve out of the 17 interviewees who had escaped destitution were in the UK-other sub-group, and as in our earlier study, this improvement in their circumstances was often a direct consequence of resolving benefit issues. Very often these interviewees had received benefits advice from voluntary sector agencies:
“Because of the help we received from my benefits advisors, and he's been able to help us with applications for various benefits and stuff. Yes, I would say that's the reason, because we're getting extra support now... We're hopeful for the future, that this will continue. It is always a worry that we'll end up in that situation, but for the time being we're doing all right.” Female, 25–45, UK-other
In another case, it was constructive help from Jobcentre Plus staff that was acknowledged to have made the difference:
48
“... at one point one of the guys at the Jobcentre said, ‘You keep getting sanctioned. I know that you've got health problems and stuff like that. Maybe you should apply for ESA’ ... another gentleman suggested to me, ‘Apply for a PIP to get help out of the situation.’... because at the time they did the benefit cap and stuff like that, I had to pay £120 a month, out of my own pocket towards my rent. Everything was getting a bit on top. Due to certain people in the services, they actually got me help with Personal Independence Payments, or a plan for it, also a plan for Housing Discretionary Payments [DHPs].” Male, 25–45, UK-other
For others, getting their debts under control with a debt relief order (DRO) or through other means is what had made the key difference:
“Yes, because I was paying £5 for this and £20 for that and £1 for that and it all adds up, so all the debts, it was £60 or £70 a week that I haven't got, to find, probably more than that actually...[Now] I've got one debt I pay out of my bank... I just pay £5 a month on that out of my bank, that's what I've got.” Male, over 45, UK-other
In one case it was a combination of sorting out benefits, dealing with debts, and also having some help with bringing essential costs under control that had enabled their household to move onto a more even keel:
“Every time I got it down to sort of £200, it'd creep back up to £500, £600, £700... it's just never-ending, I couldn't get on top of it. Like I say, the fact that the same week, they finally said, “Yes, we've helped clear your debt”, and I'm now in credit again, because I always make payments anyway even if there's no bill. So that, and then the same week I was awarded PIP, so.... we now get discount with our water rates...we get a little bit of a discount [from the energy company] because of the disability, because it is – especially now it's coming up to winter – it's dire if we don't have hot water or heating.... like I say, the [energy company] awarded us that grant, because that was a massive stressor for me; and obviously being awarded PIP finally after the last couple of years. So slightly better in that sense, we're able to juggle a bit more than what we could have done before.” Female, 25–45, UK-other
For another interviewee, it was a combination of transferring from JSA to disability benefits, coupled with moving house, that had enabled him to escape destitution:
“...since moving out, I've never used the food bank. From when I moved into that accommodation, I feel grateful. I said to myself, I'm never going to go without electric again, or without food. I make sure that I've always got enough for electric.” Male, 25–45, UK-other
In two UK-other cases, the defining change had been that either the interviewee or their partner had managed to get work:
“...the situation's improved a lot since my partner started working... we've got the money to be able to go and do a shop and buy what we want, rather than going to the food bank and getting whatever it is that they've got.” Female, under 25, UK-other “[Employers are] really good as well. It's a family place… I work in care, and they're absolutely amazing. They're looking at putting me forward for my NVQ3. There's talks about me going for my nursing associates, as well.” Male, 25–45, UK-other
Four of the interviewees who had managed to leave destitution were migrants, three of them EEA migrants. In all four cases it was securing paid work that meant their circumstances had improved:
“After, they put me back on to the Jobseeker's Allowance. After a few weeks, I was employed.” Male, over 45, UK-other
49
“Well, I got a third job as well and, yes, I am doing more or less £1k a month.” Male, 24–45, migrant “Currently, I work full-time as an administrator.” Female, 25–45, migrant
Conclusion The sources of support reported by those coping with destitution in 2017 bore a strong resemblance to 2015, but there were some significant shifts, which generally indicated a deterioration in the position of destitute people over the past two years. There has been an increase in those reporting no source of financial support at all, particularly common among migrants and complex needs groups. A reported rise in income from paid work may suggest a possible increase in ‘in-work destitution’, albeit from a low base. A sharp fall in numbers reporting in-kind help from LWFs is consistent with wider evidence of the erosion of these funds across England, while a substantial reported rise in reliance on charity and faith groups for such help implies an ever more humiliating experience of destitution for people affected by this most serious form of deprivation. Also striking is that half of all migrants reported receiving no income from UK benefits, and again half reported no source of in-kind help at all. Qualitative evidence collected in 2017 revealed very similar experiences and impacts of destitution as the interviews conducted in 2015, with a particular focus in our fieldwork this time on the UK-other group. Under-eating or relying on limited diet from food banks was very common. Getting clothes suitable for cold/wet weather was a major problem for many interviewees, with many unable to get help with this locally. Alongside the fact that many interviewees could not afford to heat their homes to a comfortable level, poorly insulated homes was another theme in 2017. As in 2015, many respondents identified at least one additional essential need, such as medicine, or work- or care-related mobile phone or transport costs, over and above the six items included in our very minimal destitution 'basket of goods'. Notably, in 2017 more than in 2015 we heard people saying that their benefit income was not enough to pay for essentials, even if that income was uninterrupted by delays, waiting periods, sanctions or administrative errors. The impact of destitution on people's mental health was clearly significant. There was also qualitative evidence in 2017 of people's physical health and social relationships being adversely affected by destitution. Resolving benefit issues was, as in 2015, the key determining factor for those who had managed to escape destitution. But bringing debts, fuel or housing costs under control also featured heavily in the accounts of the UK-other interviewees, although and in a couple of cases it was securing paid work that had made all the difference.
50
6 Conclusions Introduction The upsurge in concern about 'destitution' in UK public and political debate noted in the run up to 2015 has, if anything, intensified since we published the original Destitution in the UK study (Fitzpatrick et al, 2016). This is related in part to further restrictions on the benefit entitlements and access to other forms of support for asylum seekers and EEA migrants in particular, alongside the ongoing squeeze on mainstream working-age benefits, and widespread concerns about both the structure and administration of Universal Credit. The continued increase in the number of people using food banks across Great Britain, and sharp increases in homelessness in England in particular, have also served to focus attention on those experiencing the most extreme forms of deprivation in the UK. In this context, the latest study, like the original 2015 one, has sought to offer robust data on the causes, scale, trends and distribution of destitution in the UK, as well as on the characteristics of those affected and the effects of this experience on them.
The scale and trends in destitution We estimate that 1,550,000 people, including 365,000 children, were destitute in the UK at some point during 2017. This means that they could not afford to buy the bare essentials that we all need to eat, stay warm and dry, and keep clean. These are conservative estimates, based on our strict definition of destitution, and focused exclusively on those cases that come to the attention of voluntary sector crisis services or LWFs. Destitute households which do not contact crisis services, or contact only statutory services, could not be captured using our methodology. Complexity of the research design also means that this estimate is subject to margins of error of +/-20%. We have argued that the most reliable way of measuring change since 2015 is to look at those services in the original 10 areas which were included in both surveys. Based on this comparison, our best estimate of the change in destitution in UK over this two-year period is a reduction of -25%. This is our central trend estimate, but taking into account various sources of uncertainty the true figure could potentially lie in a range of -11% to -32%. We are, however, confident that there has been a reduction. We believe there are several factors likely to account for this fall. In particular, there has been a notable fall in the number of JSA benefit sanctions, and a key finding of our original study was that these were a significant factor in destitution. However, sanctioning rates are now much higher in Universal Credit than in JSA, so if Universal Credit continues to be rolled out on the current model we can expect sanctions-prompted destitution to start to rise again. The period up until April 2017, when our survey took place, also saw jobs expanding and unemployment falling. As a further important factor, overall migration has fallen and in particular migration from some new EU member states, a group potentially vulnerable to destitution, has fallen noticeably. However, there are countervailing factors including a rise in refugee and asylum-seeking migrants and a rise in homelessness. Our evidence continues to indicate that the group most at risk of destitution in the contemporary UK is younger single men aged under 35. While some people born overseas face disproportionate risks of destitution when living in this country, the great majority of those destitute in the UK in 2017, as in 2015, were born here. The geography of destitution very closely matches that of poverty in general in the UK, apart from some particularities related to the location of key migrant groups, including asylum seekers. It is therefore clustered in former industrial areas, largely in the north of England and in the other UK countries, and in some London boroughs, with much lower rates found in affluent suburban and rural or small town districts in the southern part of England.
Routes into destitution It was clear from both the qualitative and quantitative research in 2017 that the key triggers for the UK-other sub-group of the destitute population – operating against a backdrop of persistent low income –
51
were usually debt, benefit, and health issues, very often found in some sort of tangled combination in people's lives. While sanctions remained a relevant concern in 2017, the 'income shocks' of greatest import were often benefit delays and gaps, including the five-week period that elapses between claiming and receiving Universal Credit. The migration of people from sickness and disability benefits onto Universal Credit and JSA also continued to cause many difficulties for vulnerable claimants who not only lost considerable amounts in benefit income, but also faced much higher risks of benefit sanctions than on their previous benefits. The long-term, sustained and crushing effect of multiple debts, and sometimes harsh and uncoordinated recovery practices, was a theme explored in more depth in this year's study (see also Barker et al, 2018). The implications for destitution when people are forced into third-party deductions and other debt repayment programmes which leave them insufficient margin to meet the bare necessities is clear. The more stringent deduction arrangements being ushered in under Universal Credit, along with the upturn in sanctioning rates, are also a significant concern because of their potential impacts on levels of destitution. For a minority of UK-other interviewees, issues associated with low-paid, insecure employment and erratic pay also featured, and interacted with gaps in benefits, to leave them destitute. For another small section of UK-other interviewees, relationship breakdown, usually in combination with debt and housing difficulties, had played a role in precipitating their destitution. For the complex needs group, while debt, benefit and health issues were equally if not more present, the data revealed that these issues were compounded by very high levels of relationship problems and breakdown (including involving domestic violence), experience of drug or alcohol problems, or being in trouble with the police, and, to a lesser extent, eviction and housing problems. Some in this group had lived a 'cashless' existence for extended periods of time, and as a result repeatedly found themselves lacking food or other necessities. Migrants' routes into destitution had many of the same features as those of UK-born interviewees, but they faced compounding difficulties. Benefit eligibility restrictions affecting some groups of migrants meant they often had an income level much lower than that of the UK-born interviewees, and in a significant number of cases were not eligible for benefits at all. This position has deteriorated for both EEA migrants and those who apply for asylum since 2015. In one marker of just how desperate the position of some in this sub-group is, five out of the 12 migrants we interviewed in 2017 had slept rough in the past month.
Coping with, and a finding a route out of, destitution The sources of support reported by those coping with destitution in 2017 bore a strong resemblance to 2015, but there were some important shifts. While there was a modest increase in income from charities and paid work (the latter possibly indicating a rise in 'in-work destitution'), there has been a rise across all sub-groups in those with no income at all. There was a sharp fall in reported levels of access to the LWF, and a rise in charities/churches, with a large and increasing proportion of migrants reporting no source of in-kind help at all. Overall these findings suggest a deterioration in the position of destitute groups over the past two years. The decline in in-kind help from LWF is consistent with other evidence that these funds are being withdrawn or radically reduced across England (see below). The increased reliance on assistance from charities and faith groups is also far from good news, given the humiliation reported by people forced to seek out these sources to meet their most fundamental physiological needs, and the clear message from the public in our 2015 omnibus survey that reliance on such sources does not lessen but rather constitutes destitution (Fitzpatrick et al, 2016). The most common deprivation reported by survey respondents was doing without food, and under-eating or relying on limited diet from food banks was a very frequent experience. Getting clothes suitable for cold/wet weather was also a major problem. Aside from the fact that many interviewees could not heat their homes when they needed to a comfortable level due to unaffordability, poorly insulated accommodation was a particularly strong theme in 2017. As in 2015, many respondents identified
52
ongoing or specific additional essential expenses, such as for medicines, work- or care-related transport or mobile phone costs. The impact of destitution on people's mental health was often mentioned and clearly very significant. People whose mental health has been affected by destitution sometimes seemed to find themselves in a vicious circle, whereby their poor mental health inhibited job-seeking and other actions that might help them escape destitution. There was qualitative evidence again in 2017 of people's physical health and social relationships being adversely affected by destitution, though the predominant impact did seem to be on mental health. For those interviewees (17 out of 41) who had managed to leave destitution, resolving benefit issues was, as in 2015, the key determining factor. But bringing debts, fuel or housing costs under control also featured heavily in the accounts of the UK-other interviewees who were no longer destitute, albeit often still severely poor, and in a couple of cases getting paid work had made all the difference. Four of those who had managed to move out of destitution were in the migrant sub-group. In all four cases they had found employment in the intervening period.
Policy implications Given the absence of a single 'route in' or cause of destitution, the findings of both the original Destitution in the UK study and this update report have implications for a wide range of areas of public policy, many of which were incorporated into the JRF strategy We can solve poverty in the UK (JRF, 2016). However, with the focus particularly on the UK-other group in the qualitative parts of the 2017 study, several key policy areas can be emphasised. First, and very positively, it seems very likely that the easing off in benefit (JSA) sanctions over the past few years has made quite a dent in the numbers made destitute. This is an important lesson to bear in mind in the context of the ratcheting up of the conditionality regime and heightened levels of sanctioning as the Universal Credit regime is fully rolled out. Second, and far less positively, it is clear that an array of other aspects of both the structure and administration of Universal Credit risk seriously exacerbating destitution. First and foremost here is the much criticised gap between Universal Credit claimants applying for benefit and receiving payment (even if now shortened to five weeks since the 'waiting days' were abolished, together with the limited but welcome two-week run-on of Housing Benefit for new Universal Credit claimants). However, there is also the potential for practices with harsh consequences around third-party deductions and recovery of benefit advances and overpayments to bite harder as Universal Credit rolls out. Third, it was notable that in 2017, more than in 2015, we heard people saying that their benefit income was not enough to afford essentials, even if that income was uninterrupted by delays, waiting periods, sanctions or administrative errors. This indicates that, quite aside from any specific concerns about the design of Universal Credit, the cash freeze on working-age means-tested benefits is affecting risks of destitution as living costs rise. It is important here to emphasise the sheer inadequacy of single adult income maintenance benefit rates, even before their erosion by inflation during the period of the freeze. Basic JSA rates are now so low that single claimants under 25 living alone are by definition destitute unless they have other sources of income, with single claimants over 25 barely better off (Fitzpatrick et al, 2016). Fourth, the findings of this study suggest that there is a vital role for local welfare fund schemes in the prevention of destitution, but that they are operating unevenly, and rapidly declining in England because of local government funding cuts (in Scotland, Wales and Northern Ireland schemes have been maintained). A recent report by the Centre for Responsible Credit found that 26 English local authorities have now closed their schemes and a further 41 have cut back spending by more than 60% (Gibbons, 2017; see also National Audit Office, 2016b). We have observed varying practice in our case studies, including some examples of good practice in terms of coordination of local welfare fund help with money and welfare benefits advice, arrears management, employment reintegration work, and liaison with the voluntary sector. It is imperative that local welfare funds are protected and reinstated across England, and
53
it would be helpful to consider rolling out a more general good practice model and minimal set of expectations for such services, drawing on the positive lessons of the national schemes that have been maintained elsewhere in the UK (see also Gibbons, 2017). Fifth, as explored in more detail in the Barker et al (2018) report, the role played by the debt and arrears recovery practices of a range of public sector and other creditors in pushing substantial numbers of people facing severe poverty into a position of destitution must be addressed. There is surely scope to develop a better policy response to address these unintended but serious consequences of public sector policy and practice. At the very least, the matter of third-party deductions, in combination with DWP deductions for benefit advances or overpayments, leaving people with virtually nothing to live on, must be a focus for more progressive policy approaches. Sixth, reinforcing points made by Loopstra and Lalor’s (2017) in their food bank research, it is clear that a major element in destitution in the UK is the particular vulnerabilities facing disabled and sick people. Very high levels of poor mental and physical health were revealed in the survey, narratives of poor health filtered across many of the accounts of interviewees, and the profound impacts of destitution on mental health in particular were all too obvious. There is a need for a bespoke focus on disability and sickness in policy, practice and research on destitution. Seventh, the strong concentration of destitute households in the social rented sector, and to a lesser extent the private rented sector, revealed by the 2017 survey is not a surprise, given the over-representation of those who are severely poor among social tenants in particular. But it does suggest an important role for social landlords in preventing and alleviating tenant destitution, as well as poverty and homelessness. This may be an area where partnerships with key national bodies like the National Housing Federation and Chartered Institute of Housing can play an important role in promoting good practice. Eighth, while somewhat de-emphasised in our 2017 qualitative study, it seems from the survey that not only have the benefit entitlements of vulnerable migrants, including asylum seekers and EEA migrants, weakened since 2015, so too have other forms of support. While the numbers of EEA migrants in the destitute and rough sleeping populations may decline, as overall levels of EEA migration to the UK decline, the numbers of refused and other asylum seekers in the most desperate straits seem to be increasing. Allowing asylum seekers to take up paid work would protect many from severe poverty and the risk of tipping into destitution. More broadly, this study in 2017 has shown, again, that destitution is intrinsically linked to broader poverty. Those experiencing destitution generally have long-term experience of poverty, driven by low income from work or benefits, high cost of essentials, and debts associated with paying for these essentials, and in many cases poor physical and mental health – factors which made them 'at risk' of destitution. But destitute people have usually experienced some additional factors – specific income shocks associated with the benefit system (delays, errors or sanctions), barriers posed by the immigration system (lack of access to the labour market, very limited or no benefit eligibility), lack of family support, and other adverse circumstances. When they recover from periods of destitution, many remain in poverty and vulnerable to finding themselves in that more extreme state again. Reducing destitution therefore requires action to address the drivers of poverty – unemployment, low-paid and insecure jobs, high living costs, and problems in the benefit system. Alongside this, better emergency support for those in crisis would help to relieve the most serious hardship. For some of the groups experiencing destitution, other policy areas need to be considered including debt, immigration, asylum, housing, homelessness, mental health, addictions, and complex needs. These are all areas addressed in the JRF strategy We can solve poverty in the UK, one core principle of which is that no one should ever be destitute in the UK, for even the shortest of periods (JRF, 2016). We hope this report contributes to this by furthering understanding of the problem, its causes and solutions.
54
Notes 1. This is a generic term we use to denote: local welfare assistance schemes in England, the
Scottish Welfare Fund, the Discretionary Assistance Fund in Wales and the discretionary Social Fund in Northern Ireland.
2. An omnibus survey is a general purpose interview survey which asks a representative sample of the adult population a standard set of general questions about their household plus sets of questions on particular topics commissioned by particular organisations.
3. A more limited set of indicators was used in Northern Ireland.
4. This process did not include the case study area in Northern Ireland (Belfast) for which a more limited set of data was available.
5. In Wiltshire the survey was conducted in only two of the former constituent districts (Salisbury and West Wiltshire) to keep travelling manageable.
6. In County Durham, as in Wiltshire, we confined the scope to part of the local authority area (three former districts comprising about half the population) to make the fieldwork manageable.
7. Apart from one subjective question which had not been particularly useful, and where in-depth qualitative interviews gave much more valuable insight.
8. The target was 40 interviewees but an additional interview was completed as result of the late contact by one interviewee whom we did not think we had been able to reach.
9. Our persistent difficulties in engaging EEA migrants in the interview stage of the research (though not in the survey) may be linked with the relative absence of a specialised civil society response to support this group (see Fitzpatrick et al 2016).
10. Note that while detailed estimates cannot be provided for each of the devolved nations, the overall geography of destitution in the UK is discussed below.
11. These are the minimum percentage of destitute households with these very low income levels; just over 10% of the destitute were cases which did not give income information but which reported lacking three or more of the key essentials and having no savings, and so were classified as destitute.
12. For simplicity, the income levels in this graph apply across all household sizes, but in the definition of destitution we set different thresholds for different household types, see Box 1.
13. In fact, differences in the precise variables available in the range of large-scale datasets employed in this analysis means that the detailed definition of 'severe poverty' we have used has to be adjusted somewhat at different points in this chapter. But we align these definitions as closely as possible, and all are designed to capture the concept noted in the main text above. Thus severe poverty as we have defined it in the UKLHS dataset is: (1) lacking one-third of key material essentials or having a housing need of overcrowding, concealed family, unsuitable for family or condition problem and can’t afford to buy a home; and (2) having less than 40% of the national median net equivalised household income after housing costs; and (3) experiencing financial difficulty, either having difficulty paying rent, or finding current financial situation very difficult, or expecting financial position get more difficult in future. See technical report for details.
55
14. This means that, in total, 22% of destitute households considered in the sub-group analysis were migrants (ie non-UK born). The discrepancy with the 25% proportion of migrants in the overall destitute population quoted above results from additional missing cases due to the more complex set of variables required to construct the sub-groups.
15. Note that some people interviewed in the 2015 study did go without necessities because they prioritised paying their bills above all else, and so were not behind on bills or in serious debt but were destitute (see Fitzpatrick et al 2016).
16. Budgeting Loans (Budgeting Advances – Universal Credit only) are interest free loans which can be paid on top of benefits to help pay for certain essentials and expenses for items such as furniture and clothing. A Budgeting Loan should normally be repaid within two years whereas a Budgeting Advance should normally be repaid within one year, extendable to 18 months in exceptional circumstances. The minimum amount that can be borrowed is £100 and the maximum is dependent on circumstances: up to a maximum of £348 if single; £464 if part of a couple and £812 where the household includes children.
17. In the case of fuel and water charges only, claimant consent is required if a third party deduction would take the aggregate sum deducted above 25% of the standard allowance.
18. As an aside, some interviewees discussed using ‘crowdfunding’ to pay for essential white goods, in the absence of support from the local welfare fund (see Chapter 5).
19. In the Autumn 2017 Budget it was announced that from 14 February 2018 all Universal Credit claimants would be entitled to benefit from the first day they claimed, removing the seven 'waiting days' that some had had to serve before they were entitled to the benefit. However, as Universal Credit is paid monthly in arrears, claimants can still wait up to five weeks to receive their first payment, allowing for the time it takes the payment to reach their bank account.
20. Before January 2018, Universal Credit advances of up to 50% of the likely entitlement were available.
21. The DWP has a Repayment Negotiation Framework, and where there is evidence of hardship, the repayment to them can be reduced or delayed (Department for Work and Pensions, 2018). The Department states in its guidance that: ‘It is the level of hardship and upset which is taken into account when considering an application.’ (p.38). There is no further guidance as to what 'level of upset' may mean.
22. The DWP, local authorities and HMRC can offer 'administrative penalties' by law to allow the claimant to avoid prosecution where an overpayment of benefit is caused by ‘an act or omission’ by the claimant in respect of their claim. The administrative penalty is payable on top of the overpayment.
23. Alternative payment arrangements, to allow housing costs to be paid to landlords, can be made if a claimant is unable to manage their monthly payment, and also when a tenant becomes more than two months in rent arrears.
24. Though do note that experience of begging is one element of the definition used for 'complex needs'.
56
References Allsopp, J., Sigona, N. and Phillimore, J. (2014) Poverty among refugees and asylum seekers in the UK. Institute for Research into
Superdiversity Working Paper Series, 01/14. Birmingham: University of Birmingham.
Bailey, N. (2018) ‘Employment, poverty and social exclusion’, in: Bramley, G. and Bailey, N. (eds) Poverty and social exclusion in the UK. Volume 2 – the dimensions of disadvantage, pp. 159–78. Bristol: Policy Press.
Barker, K., Ayrton, C., Petrie, I. and Tinson, A. (2018) Preventing destitution: policy and practice in the UK. York: JRF.
Batty, E., Beatty, C., Casey, R., Foden, M., McCarthy, L. and Reeve, K. (2015) Homeless people’s experiences of welfare conditionality and benefit sanctions. London: Crisis.
Bramley, G. (2017) Homelessness projections: core homelessness in Great Britain. Summary report. London: Crisis.
Bramley, G. and Bailey, N. (eds) (2018). Poverty and social exclusion in the UK. Volume 2 – the dimensions of disadvantage. Bristol: Policy Press.
Bramley, G., Fitzpatrick, S., Edwards, J., Ford, D., Johnsen, S., Sosenko, F. and Watkins, D. (2015) Hard edges: mapping severe and multiple disadvantage. London: Lankelly Chase Foundation.
Bramley, G., Sosenko. and Fitzpatrick, S. (2018) Destitution in the UK 2018 – technical report. Edinburgh: Heriot-Watt University. Available at: http://dx.doi.org/10.17861/BRAMLEY2018 (from 8 June 2018).
British Red Cross (2016) Destitution on the rise among refugees and asylum seekers. London: British Red Cross.
Cooper, N. and Dumpleton, S. (2013) Walking the breadline: the scandal of food poverty in 21st century Britain. Salford: Church Action on Poverty and Oxfam.
Cooper, N., Purcell, S. and Jackson, R. (2014) Below the breadline: The relentless rise of food poverty in Britain. Salford: Church Action on Poverty, Oxfam and the Trussell Trust.
Child Poverty Action Group (2017) The austerity generation: the impact of a decade of cuts on family incomes and child poverty. London: Child Poverty Action Group.
Cribb, J., Hood, A., Joyce, R. and Norris Keiller, A. (2017) Living standards, poverty and inequality in the UK: 2017. London: The Institute for Fiscal Studies.
Department for Work and Pensions (2017) Households Below Average Income. An analysis of the income distribution 1994/95 – 2015/16 (United Kingdom). London: DWP.
Department for Work and Pensions (2018) Benefit overpayment recovery guide: Version 2.20 February 2018. Available at: https://assets.publishing.service.gov.uk/government/uploads/system/uploads/attachment_data/file/683470/benefit-overpayment-recovery-guide.pdf (accessed 2 March 2018).
Downing, E. and Kennedy, S. (2014) Food banks and food poverty. London: House of Commons Library.
Falconer, A and Lane, J. (2017) Debt on your doorstep: Problem debt in the home credit market. London: Citizens Advice.
Field, F. (2017) 'Destitution is the new British disease: Destitution is on the rise.’ The Spectator, 28 October.
Fitzpatrick, S., Bramley, G., Blenkinsopp, J., Johnsen, S., Littlewood, M., Netto, G., Sosenko, F. and Watts, B. (2015) Destitution in the UK: an interim report. York: JRF.
Fitzpatrick, S., Bramley, G., Sosenko, F., Blenkinsopp, J., Johnsen, S., Littlewood, M., Netto, G. and Watts, B. (2016) Destitution in the UK. York: JRF.
Fitzpatrick, S., Pawson, H., Bramley, G., Wilcox, S., Watts, B. and Wood, J. (2018) The homelessness monitor: England 2018. London: Crisis.
Forsey, A. (2016) Britain’s not-so-hidden hunger. A progress report from the All-Party Parliamentary Group on Hunger. London: All-Party Parliamentary Group on Hunger.
Forsey, A. and Mason, L. (2016) A route map to ending hunger as we know it in the United Kingdom. Feeding Britain in 2015–16. London: All-Party Parliamentary Group on Hunger.
57
Gibbons, D. (2017) The decline of crisis and community care support in England: why a new approach is needed. London: Centre for Responsible Credit.
Henry, N. and Morris, J. (2017) Consumers, credit and scaling affordable lending: a literature and evidence review. Coventry: Coventry University.
Hood, A. and Norris Keiller, A. (2016) A survey of the UK benefit system. London: Institute for Fiscal Studies.
Hood, A. and Waters, T. (2017) Living standards, poverty and inequality in the UK: 2015–16 to 2021–22. London: Institute for Fiscal Studies.
House of Commons Work and Pensions Committee (2016) The local welfare safety net fifth report of session 2015–16. London: House of Commons.
Jitendra, A., Thorogood, E., Hadfield-Spoor, M. (2017) Early warnings: Universal Credit and foodbanks. London: The Trussell Trust. Available at: www.trusselltrust.org/wp-content/uploads/sites/2/2017/04/Early-Warnings-Universal-Credit-and-Foodbanks.pdf (accessed 2 March 2018).
Joseph Rowntree Foundation (2016) We can solve poverty in the UK. York: JRF.
Lansley, S. and Mack, J. (2015) Breadline Britain: the rise of mass poverty. London: Bloomsbury.
Legal Action Group (2016) Rent arrears deductions from Universal Credit payments cause extra hardship and should be reduced. Online editorial. Available at: www.lag.org.uk/article/202060/rent-arrears-deductions-from-universal-credit-payments-cause-extra-hardship-and-should-be-reduced (accessed 2 March 2018).
Loopstra, R. (2018) Does sanctioning of benefit claimants drive them to need help from food banks? Cambridge Core blog, 31 January. Available at: http://blog.journals.cambridge.org/2018/01/31/does-sanctioning-of-benefit-claimants-drive-them-to-need-help-from-food-banks (accessed 2 March 2018).
Loopstra, R. and Lalor, D. (2017) Financial insecurity, food insecurity, and disability: the profile of people receiving emergency food assistance from the Trussell Trust foodbank network in Britain. London: The Trussell Trust.
Mackie, P., Johnsen, S., and Wood, J. (2017). Ending rough sleeping: what works? An international evidence review. London: Crisis.
McKeever, G., Simpson, M. and Fitzpatrick, C. (2018) Destitution and paths to justice. London: Legal Education Foundation.
Malfait, R., Cottrell, S. and Scott-Flynn, N. (2017) Migrant destitution: survey and consultation: final report. London: Strategic Alliance on Migrant Destitution.
NACCOM (The No Accommodation Network) (2016–17) NACCOM annual report. Available at: https://naccom.org.uk/wp-content/uploads/2017/02/NACCOM-Annual-report-201617.pdf (accessed 2 March 2018).
National Audit Office (2016a). Benefit sanctions: report by the comptroller and auditor general. London: National Audit Office.
National Audit Office (2016b). Local welfare provision: local government report by the comptroller and auditor general. London: National Audit Office
NICRAS (Northern Ireland Community of Refugees and Asylum Seekers) (2016) The effects of destitution on refugees in Northern Ireland. Belfast: NICRAS.
Ollerenshaw, E. (2016) Three years on: an independent review of local Council Tax support schemes. London: Department for Communities and Local Government.
ONS (2018) Migration statistics quarterly report. Available at: www.ons.gov.uk/peoplepopulationandcommunity/populationandmigration/internationalmigration/bulletins/migrationstatisticsquarterlyreport/february2018 (accessed 2 March 2018).
Petch, H., Perry, J. and Lukes, S. (2015) How to improve support and services for destitute migrants. York: JRF.
Portes, J. and Reed, H. (2017) Distributional results for the impact of tax and welfare reforms between 2010–17, modelled in the 2021/22 tax year: Interim findings. Manchester: Equality and Human Rights Commission.
Refugee Council (2017) Refugees without refuge: Findings from a survey of newly recognised refugees. Stratford: Refugee Council.
StepChange Debt Charity (online) Debt Solutions. Available at: www.stepchange.org/debt-info/debt-solutions.aspx (accessed 2 March 2018).
58
Taylor, M. (2017) Good work: the Taylor review of modern work practices. London: Department for Business, Energy & Industrial Strategy.
Sippitt, A. and Ashworth-Hayes, S. (2015) Food banks, zero hours contracts and falling wages: are we worse off? London: Full Fact. Available at: https://fullfact.org/economy/food-banks-zero-hours-contracts-and-falling-wages-are-we-worse (accessed 2 March 2018).
Tinson, A., Ayrton, C., Barker, K., Born, T. B., Aldridge, H. and Kenway, P. (2016). Monitoring poverty and social exclusion 2016. York: JRF.
Vyas, D (2014) Topping-up or dropping-out: self-disconnection among prepayment meter users. London: Citizens Advice and Edinburgh: Citizens Advice Scotland.
Wallace, A., Rhodes, D. and Roth, F. (2018) Home-owners and poverty. York: JRF.
Watts, B., Fitzpatrick, S., Bramley, G. and Watkins, D. (2014) Welfare sanctions and conditionality in the UK. York: JRF.
Webster, D. (2018) Briefing: benefit sanctions statistics: Universal Credit, JSA, ESA and Income Support, February 2018. Glasgow: University of Glasgow.
Webster, D. (2017) Briefing: benefit sanctions statistics: JSA, ESA, Universal Credit and Income Support for lone parents, August 2017. Glasgow: University of Glasgow.
59
Appendix 1: questionnaire 2017
Q1. In the last month have you…
… had more than one day when you didn’t eat at all, or had only one meal, because you couldn't afford to buy enough food?
Yes No
…not been able to dress appropriately for the weather because you didn’t have suitable shoes or clothes and were unable to buy them?
Yes No
…gone without basic toiletries such as soap, shampoo, toothbrush, toothpaste or sanitary items because you couldn't afford to buy them?
Yes No
…not been able to afford to heat your home on more than four days across the month?
Yes No Not relevant to me
…not been able to afford to light your home on more than four days across the month?
Yes No Not relevant to me
… had to sleep rough for at least one night?
Yes No
We would like your help in research we are doing about what kinds of things people have to get by without. Heriot-Watt University is doing the research for the Joseph Rowntree Foundation, a charity that works to improve the situation of people in need. The questions should take about 10 minutes to answer, and if you need help, staff will assist you. Your answers are private and confidential. Participation is entirely voluntary and will not affect the service you receive in any way.
Getting by in the UK – a survey
How to fill in this questionnaire: Please use a black or blue pen mark your answers by putting a cross in the appropriate box to show your answer . If you have made a mistake or you change your mind please completely fill the box to show the mistake and then cross the correct answer.
English 1
CHESHIRE
Paid work (including cash-in-hand work)
Begging
Other
No source at all
Q3. In the last month, what was your total income after paying tax?
Please think of your household income if you live with family and your personal income if you do not live with family. Cross one
None at all
£1 - £69 a week
£70 - £99 a week
£100 - £139 a week
£140 - £199 a week
£200 - £299 a week
Over £300 a week
2
Q2. In the last month, have you received money from the following?
Cross all that apply
Benefits/Social Security
Parents
Other relatives
Friends
Charities/churches
Help in Emergencies for Local People (HELP) (run by the Council, sometimes called Crisis Loans/Social Fund)
Q4. Do you have to pay rent out of your personal or household income?
Yes No
Q5. How much rent do you pay?
Please write your rent in below to the nearest £ and select how often you pay.
Monthly Fortnightly Weekly
Foodbanks
Charities/churches
Other
None of these
Q7. How much money, if any, do you have in savings in a bank account?
None at all
Less than £200
£200-£999
£1,000 or more
GO TO QUESTION 6
3
£
Q6. In the last month, have you received help getting non-cash items such as food, clothing, toiletries, power-cards, or other items from the following… Cross all that apply
Parents
Other relatives
Friends
Help in Emergencies for Local People (HELP)
The next few questions are about things that have happened in the last year…
Q8. In the last 12 months, have you experienced any of the following? Cross all that apply
Benefit sanctions
Benefit delays
Getting behind on bills
Serious debt
Being evicted from your home
Losing a job
Reduced hours or a pay cut
Mental health problems
Serious physical health problems
Divorce or separation
Domestic violence
Alcohol or drug problems
Getting in trouble with the police
Coming to live in the UK
Problem with your right to live or work in the UK
Relationship with your parents/family breaking down
None of these things
Q9. In the last 12 months, how many times have you used the service you are at today?
Today is the first time
2-3 times
4-5 times
6-10 times
More than 10 times
I live here – this is a hostel, refuge, night shelter or temporary accommodation
4
Q10. In the last 12 months, how many times have you used any other services to get food, clothing, toiletries, power-cards, money or other necessities?
Q11. In the last 12 months for how long, if at all, have you stayed in any hostels, refuges, night shelters or other temporary accommodation? Cross one
Not at all
Up to 1 week
2 - 3 weeks
1 - 2 months
3 - 6 months
More than 6 months
Number of times used in
last 12 months
Not used in last 12 months
5
Foodbanks
‘Soup kitchen’ or ‘soup run’
Advice service (e.g. Citizens Advice, money advice, welfare advice, etc.)
Day centre or drop-in centre
Organisation supporting migrants
Help in Emergencies for Local People (HELP)
About You
Q12. Are you…
Male Female
Q13. How old are you? Write in
Q14. Do you live….
With family
With other people
Alone
Q15. How many family members live with you? Please write in
Number of other adults (aged 18 and over) living with you
Number of children (under 18) living with you
Q16. In what sort of place are you living at the moment? Cross one
Flat or house of your own, either rented or owned
A hostel, refuge, B&B, night shelter
A temporary flat/house arranged by council or support agency
Your partner’s, parent’s or other family/friend’s house
Sleeping rough
Other
6
Q17. If you are renting or own your home, please let us know whether you are:
…renting from a Council or Housing Association
…renting privately
…a homeowner or co-owner
…I am not a renter or owner
Q18. In which country were you born? Please write in
Q19. Have you ever applied for asylum in the UK?
Not applicable (I was born in the UK)
No
Yes
Q20. What is your current status?
Awaiting outcome of application
Refugee status
Leave to remain
Application refused
Not sure/cannot say
Please turn over…
7
Permission to re-contact you
We would like to talk to a small number of people in more detail about their circumstances and experiences. Involvement in this stage is also completely voluntary. If you are happy to speak to us, please write in your contact details.
First name
Surname
Phone number
Email address
MANY THANKS – PLEASE SEAL IN THE ENVELOPE PROVIDED AND GIVE TO STAFF
8
67
Appendix 2: Topic guide for qualitative interviews 1. Current situation • Where are you living at the moment? How long have you been living there? Where were you living
before that? Why did you leave there?
• Does anyone else live with you? (probe household composition).
• How do you 'get by' just now/what sources of income do you have? Probe: paid work, benefits (which ones; on Universal Credit yet?), family, friends, charitable organisations/religious organisations, other (eg begging, selling Big Issue)?
• If mention begging now/in questionnaire ask:
- Can I ask how and where you ask people for money? How long ago did you start doing this/how often do you do it? Why did you first start? What you spent/spend the money on?
2. Destitution definition Use starting blurb along lines of: ‘It’s helpful for us to know what things people have had to go without recently because they can't afford to pay for them. Can I ask, in the last month, have you done without.... [ask pages 1-3 in questionnaire]
• Is this the first time you/they had to do without [good] or has this happened before (probe: how long ago did it first happen, how often have you found yourself in that situation, etc.)
• Can I ask how it came about that you had to do without [good]?
• If more than one deprivation: Were you doing without all of these things at the same time or different times? Can you remember what order it happened in? Why did it happen that way round? (Trying to get at trade-offs/prioritisation)
• Did you seek help from anyone to try to get the things you needed? (Probe: parents, other family, friends, charities, religious bodies, food banks, Local Welfare Assistance Fund, social work department, housing association, etc.) How did you feel about seeking help from this source/relying on them to help you? What would you say was the most/least useful help provided? Why?
3. Relevant experiences • In your answers to the questionnaire, you indicated that in the twelve months before April, you had
experienced problems with [insert responses to question 8 in questionnaire]. Would you be willing to tell me a bit more about this/these problems?
• When did [problem] start? Is it still going on? Was this the first time you had experienced a problem of this kind? Did you see this problem coming, or was it unexpected?
• Can you remember what order these problems happened in? Were they linked at all? [try to establish chronology and whether one problem led to another].
• Were any of these problems linked to your having to do without the things we discussed/having no or hardly any income? [ie probe link with destitution]
• Can I just check, have you experienced any of these other things [remaining q8 problems] in the past 12 months? In the past 3 years? When did it start/still going on? Linked to the other problems you mentioned?
4. Accessing advice For each Q8 experience indicated by the respondent ask:
68
• When you first experienced this problem did you seek any advice/help? Where from? How useful was that? Did you seek any other advice/help further down the line? How useful did you find that?
• In the last 3 years, have you approached any of the following for help or advice? 1. Shelter 2. Citizens Advice 3. Consumer Direct 4. Community Legal Advice (accessible online only] 5. National Debtline 6. Solicitors 7. Law centres 8. Financial Services Ombudsman 9. Local Government Ombudsman 10. Local council 11. Local MP 12. Online (but not any of the above)
If not, have you heard of them/know anything about them? (And if seems appropriate) Any particular reason why you didn't approach them?
If yes, what made you decide to approach them? (probe: recommendation from friends and family? Saw advert/advert online? Approached previously about a different problem?). How helpful were they? Any problems/issues (eg cost, waiting time, attitude, responsiveness, accessibility, etc.)
If sought help from the internet: What search terms did you use? What sites did you visit/found useful?
• If sought advice from a solicitor or Shelter, Citizens Advice or a law centre, or went through Community Legal Advice website) Did you apply for legal aid/do you know if they applied for legal aid to help you?
• Have you ever had to visit a court or tribunal about this problem? Did you go on your own? Did you get any help or advice at the tribunal or immediately before? Can you remember who you got advice from (duty solicitor, member of staff from advice agency)? What was the outcome? Were you happy with the outcome? If so, why? If not, why not?
Then follow up with:
• In the last 3 years, have you approached any of these organisations [insert legal education foundation list] in relation to any other problem not mentioned before? [ie not Q8 experiences ticked].
• If yes and if it was broadly related to destitution, probe using the above questions.
5. Debt to authorities If the respondent is/has been in debt to authorities in the last 3 years (Council Tax, rent arrears if in council housing, old Social Fund loans, any benefit advances, benefit overpayments, etc) explore in what manner the authority has tried to reclaim the debt. In particular:
• In setting terms of repayment, has the authority taken into account the respondent’s ability to repay the debt?
• If the respondent tried to negotiate terms of repayment, has the authority been understanding/receptive?
• Has the repaying of debt caused destitution?
• Has the respondent got high-interest loans from other sources to repay that debt?
• If the respondent had two (or more) debts to two (or more) authorities, have those different authorities communicated with each other to coordinate the repayment so that the respondent was not over-burdened?
• Etc – anything that you think is relevant.
6. Impacts • Would you be able to tell me a bit more about how these problems/doing without these things have
affected you? (probe as appropriate):
physical/mental health (including sense of control over one’s life/hope / long-term prospects [if respondent says destitution impacted on health, ask how health was before destitution]
69
experiences of discrimination/stigma
ability to participate in labour market/caring roles/other societal contributions
social and support networks (positive/negative impacts – eg friendships stronger/weaker as a result of destitution).
7. Routes out • Would you say that your situation is better, worse or the same as around April this year? Why?
• If still destitute, how confident are you that your situation will improve? Why/why not? What would make a difference/give you confidence that things will change? (Probe if related to Q8 problems)
• If no longer destitute/situation improved, what made your situation better? [Probe external factors and own agency]. Are you worried that you that you might find yourself doing without again? Why/why not? (If appropriate) What is it that you are most concerned about? (Probe whether related to Q8 problems)
• Do see you see yourself facing similar [Q8 problems] in the future/if ongoing do you think they are likely to be resolved? If you had a problem like that again, would do the same thing, or something different? Would you seek advice? Who from?
70
Acknowledgements The authors would like to thank Chris Goulden for his highly supportive, encouraging and constructive approach to managing this project, and Helen Barnard and other colleagues at JRF for all their support with this work.. Our partners at Kantar Public went well above and beyond the call of duty in ensuring that the exceptionally challenging fieldwork element of this project was successfully delivered. Thanks also to Robert Joyce, Associate Director at the Institute for Fiscal Studies, for reviewing and providing advice on the technical report of the methodology for the project. We are also greatly indebted to the 'locality coordinators' and the 103 services who assisted us so ably with the survey – by far the most challenging aspect of the entire project. A range of administrative colleagues at Heriot-Watt University provided indispensable help in managing the tricky logistics of the project, and here we must single out Julie Brunton for particular thanks. Thanks also to the members of the Project Advisory Group for thoughtful comments on the draft. Finally, and most importantly, we would like to thank all the service users across the UK who responded to the survey, and most especially we are extremely grateful to all those with direct experience of destitution who took the time to participate in the in-depth interviews.
71
About the authors Dr Janice Blenkinsopp (CIHCM) has been a Research Associate at I-SPHERE (the Institute of Social Policy, Housing and Equalities Research) at Heriot-Watt University since 2014. Janice’s research interests include social and housing policy, social security, welfare reform, welfare regimes and inequalities. She has been a researcher on numerous research projects including the original Destitution in the UK study for JRF. Before embarking on her doctorate, she had many years’ experience as a rights advice practitioner, managing teams in both the housing association and local authority sectors. Glen Bramley is Professor of Urban Studies based in I-SPHERE at Heriot-Watt University. His research covers planning, housing need, affordability, local services, poverty, destitution, homelessness, and severe/multiple disadvantage. Recent publications include books on poverty and social exclusion and planning and the housing market. Suzanne Fitzpatrick took up her Research Professorship in Housing and Social Policy at Heriot-Watt University in July 2010, and is currently Director of I-SPHERE. Suzanne has published widely on the topics of homelessness, housing exclusion and social housing, and much of her work has an international comparative dimension. Suzanne is lead researcher on the Crisis/JRF Homelessness Monitor series. Professor Sarah Johnsen is a Professorial Fellow at I-SPHERE, Heriot-Watt University. Much of Sarah’s work focuses on homelessness and related forms of street culture (eg begging and street drinking). She has particular expertise in research focusing on severe and multiple disadvantage, the role of faith-based organisations in welfare provision, and ongoing interest in the practice and ethics of research involving vulnerable people. Mandy Littlewood is an Honorary Fellow with I-SPHERE, Heriot-Watt University. Her research interests include homelessness, housing need, affordability and poverty. Mandy’s current work includes analysis of severe and multiple deprivation in Scotland for the Lankelly Chase Foundation and a Social Bite funded study of temporary accommodation in Scotland for the Scottish Government’s Homelessness and Rough Sleeping Action Group (HARSAG). Dr Filip Sosenko is a Research Fellow at I-SPHERE, Heriot-Watt University. Filip specialises in research on destitution, food banks and severe and multiple disadvantage. His current work includes a quantitative investigation of gender differences among those affected by severe and multiple disadvantage in England, for the Lankelly Chase Foundation. Dr Beth Watts is a Senior Research Fellow at I-SPHERE, Heriot-Watt University. Her research interests include homelessness, youth homelessness, rough sleeping and complex needs, social housing, poverty and welfare conditionality. She has worked on the longitudinal Crisis/JRF-funded Homelessness Monitors research programme and a five-year ESRC-funded research project exploring the effectiveness and ethics of welfare conditionality. She completed her PhD comparing responses to homelessness in Scotland and Ireland in 2013 at the University of York. She has previously worked at The Young Foundation, the Joseph Rowntree Foundation and Shelter. Dr Jenny Wood is a Research Associate based in I-SPHERE, Heriot-Watt University. She contributes to a variety of research projects around poverty and homelessness in the UK, including the Homelessness Monitor series, a rapid systematic evidence review on what works to end rough sleeping, and a report on eradicating ‘core homelessness’ in Scotland’s four largest cities. Jenny’s research interests further include children’s rights in the built environment, for which she completed a PhD in 2016.