1 JEFSR Vol. 5 No. 1 2020 Detecting Differences Between Concealed and Unconcealed Emotions Using iMotions EMOTIENT Shelby Clark 1* , B.A and Dr. Shashi K. Jasra, 1 PhD. Abstract Biometric analysis is everywhere – even in our cell phone security through facial and fingerprint recognition. It has recently become widely useful in forensic settings as well, being used for facial, fingerprint/palmprint, iris, and voice identification 1 . Using the iMotions Facial Expression Analysis software, I looked at detection differences between concealed and unconcealed emotions when presented with various stimuli, specifically looking at the time in percentage that each emotion was elicited throughout the stimuli. Fourteen participants, eight females (F) and six males (M), were shown seven different videos aimed at eliciting specific emotions to be measured by the iMotions software. Prior to exposure to the stimuli, seven of these fourteen participants (4F, 3M) were asked to conceal their emotions while watching the following videos. The seven different emotions that were measured by the software include contempt, disgust, fear, joy, anger, surprise, and sadness. The alternative hypothesis states that individuals who concealed their emotions during presented stimuli will have significantly less detectable emotions elicited in comparison to individuals who were not asked to conceal their emotions. The null hypothesis states that there will be no significant difference between detectable emotions of individuals of the concealed group and the unconcealed group. There was no statistically significant difference of emotion detected between the overall concealed and unconcealed participant averages with regards to time (%) (p=0.07, a ≥0.05). Keywords: Biometric identification, facial expression analysis
Transcript
1 JEFSR Vol. 5 No. 1 2020
Detecting Differences Between Concealed and Unconcealed Emotions Using
iMotions EMOTIENT
Shelby Clark1*, B.A and Dr. Shashi K. Jasra, 1PhD.
Abstract
Biometric analysis is everywhere – even in our cell phone security through facial and fingerprint
recognition. It has recently become widely useful in forensic settings as well, being used for facial,
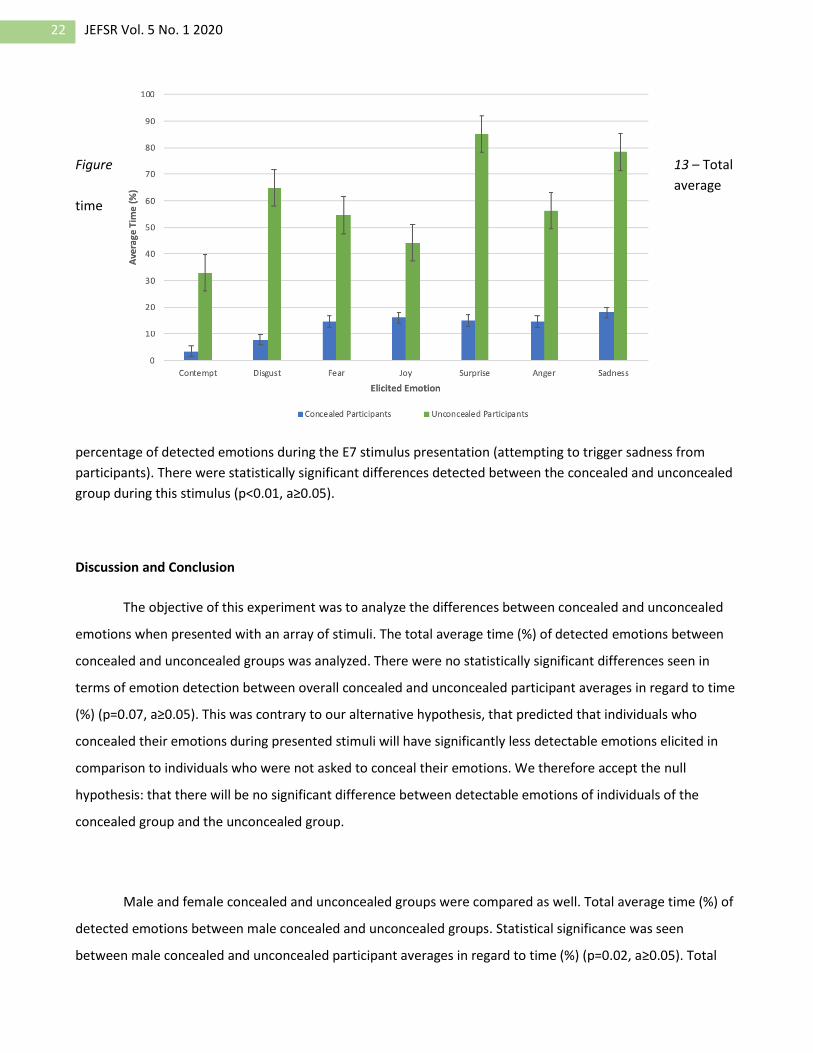
fingerprint/palmprint, iris, and voice identification1. Using the iMotions Facial Expression Analysis software, I
looked at detection differences between concealed and unconcealed emotions when presented with various
stimuli, specifically looking at the time in percentage that each emotion was elicited throughout the stimuli.
Fourteen participants, eight females (F) and six males (M), were shown seven different videos aimed at eliciting
specific emotions to be measured by the iMotions software. Prior to exposure to the stimuli, seven of these
fourteen participants (4F, 3M) were asked to conceal their emotions while watching the following videos. The
seven different emotions that were measured by the software include contempt, disgust, fear, joy, anger,
surprise, and sadness. The alternative hypothesis states that individuals who concealed their emotions during
presented stimuli will have significantly less detectable emotions elicited in comparison to individuals who
were not asked to conceal their emotions. The null hypothesis states that there will be no significant difference
between detectable emotions of individuals of the concealed group and the unconcealed group. There was no
statistically significant difference of emotion detected between the overall concealed and unconcealed
participant averages with regards to time (%) (p=0.07, a ≥0.05).
1 Forensic Sciences, Faculty of Science, University of Windsor, 401Sunset Avenue, Windsor Ontario *Communicating Author Contact: Shelby Clark, [email protected]
Introduction
The iMotions software describes biometrics as a way to investigate internal bodily signals that reveal
emotion and other signs of physiological arousal2. Applying this to a forensic setting, biometrics is the
automated recognition of individuals based on both biological and behavioural characteristics. Biometrics
ranges from facial, fingerprint/palmprint, iris, and voice identification1. This allows for identification because
certain biometric traits are specific to that individual.
The iMotions Facial Expression analysis uses an engine called Affectiva (AFFDEX). This engine identifies
thirty-three feature points on the face (e.g. points on the eyes, nose, mouth, etc.). The movements of these
facial feature points are tracked and analyzed throughout the presentation of stimuli. Specifically, this engine
identifies a smile, brow furrow & raise, frown, eye closure, nose wrinkle, various lip motions, chin raises, and
smirks. iMotions then interprets these expressions into seven basic emotions: joy, anger, surprise, fear,
contempt, sadness, and disgust. iMotions also measures positive, negative, and neutral expressions throughout
all stimuli3. Galvanic Skin Response (GSR) measures skin conductivity through the sweat glands in the skin being
activated which is commonly triggered by emotional stimulation. This allows researchers to measure emotional
stimulation when emotions may not be apparent through facial analysis4. An Eye Tracker is also included in this
iMotions software package, which tracks eye movement throughout presented stimuli and serves as a measure
of participant attention. It analyzes how long someone looks at something, and importantly, measures if a
participant is paying attention to the stimuli2. The combination of facial expression analysis, GSR, and eye
tracking allows for effective emotional analysis, and in this case, the differentiation between concealed and
unconcealed emotional expression.
Materials & Methods
- iMotions software suite (physiological and facial analysis software): version 7.0- iMotions Shimmer Kit: Galvanic Skin Response and Photoplethysmography biosensors- Logitech HD camera- Laptop with Bluetooth capability- GP3 Professional Bundle- Additional display monitor- Windows 10 Operating System
A recruitment e-mail was distributed by the science department secretary that advertised our research
to University of Windsor students. The e-mail contained general information about the study, with attached
consent forms and letters of information about both methods of the study. Participants were also recruited in
3 JEFSR Vol. 5 No. 1 2020
person through info page handouts, as well as postings in the common areas of campus. Fifteen participants
were attained for the study, with a 6:9 distribution of males and females. Fourteen participant’s data was used,
as participant R’s facial recording did not occur due to technical issues. Therefore, for data analysis, fourteen
participant’s data was used in analysis, with a 6:8 ration of male and female participants.
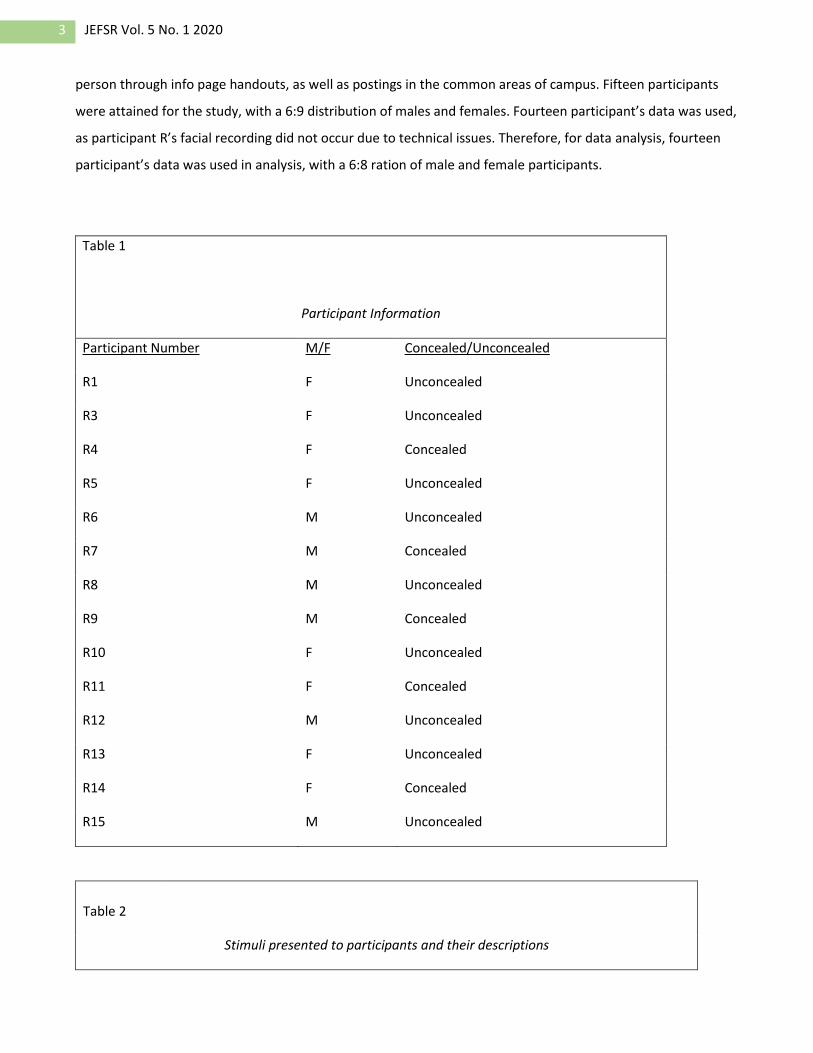
Table 1
Participant Information
Participant Number M/F Concealed/Unconcealed
R1 F Unconcealed
R3 F Unconcealed
R4 F Concealed
R5 F Unconcealed
R6 M Unconcealed
R7 M Concealed
R8 M Unconcealed
R9 M Concealed
R10 F Unconcealed
R11 F Concealed
R12 M Unconcealed
R13 F Unconcealed
R14 F Concealed
R15 M Unconcealed
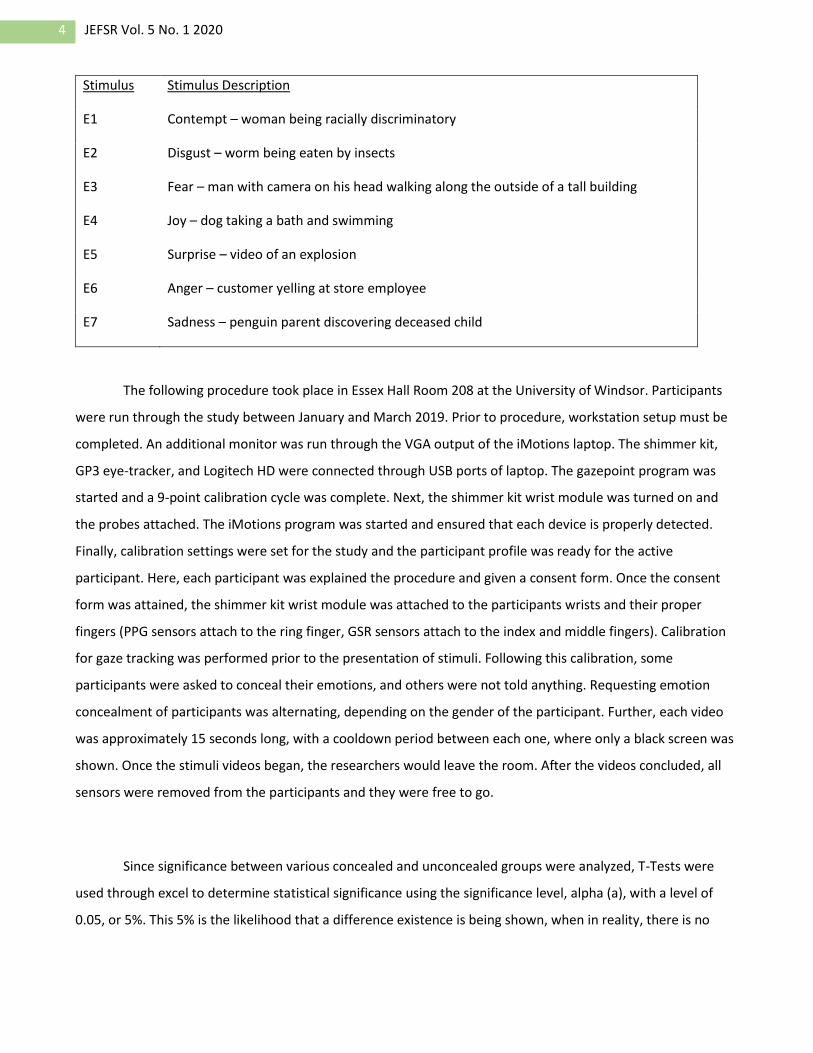
Table 2
Stimuli presented to participants and their descriptions
4 JEFSR Vol. 5 No. 1 2020
Stimulus Stimulus Description
E1 Contempt – woman being racially discriminatory
E2 Disgust – worm being eaten by insects
E3 Fear – man with camera on his head walking along the outside of a tall building

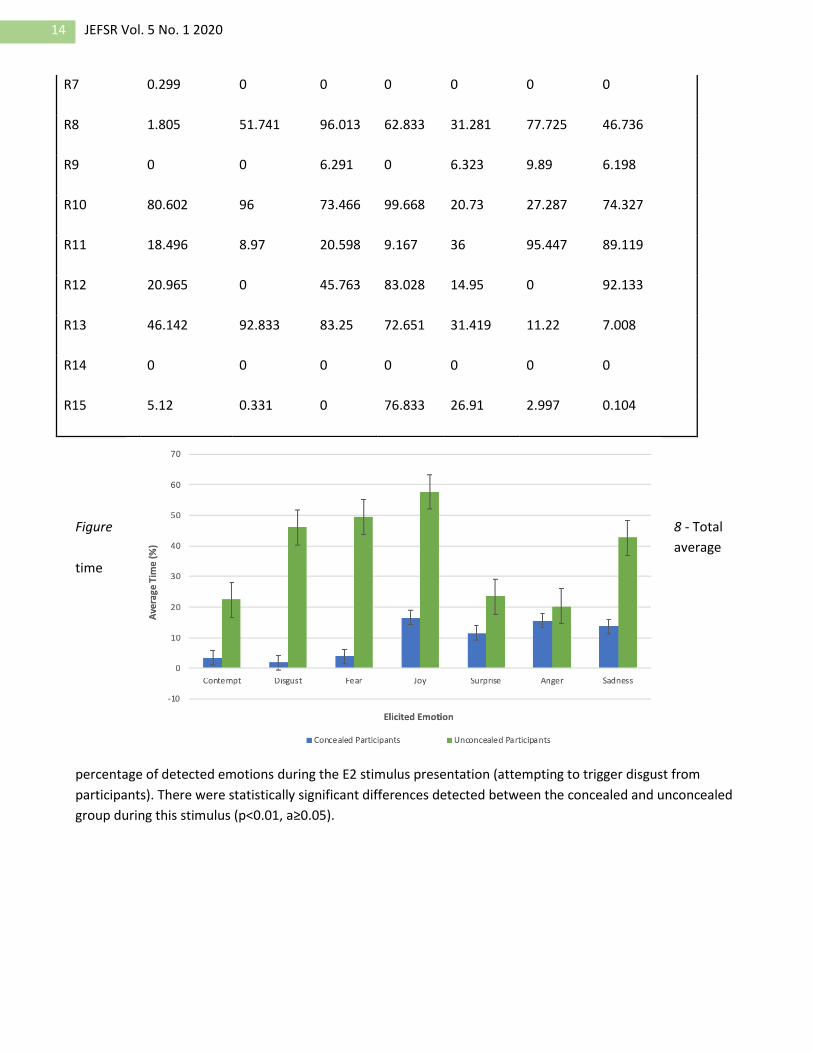


![Detecting Carbon Monoxide Poisoning Detecting Carbon ...2].pdf · Detecting Carbon Monoxide Poisoning Detecting Carbon Monoxide Poisoning. Detecting Carbon Monoxide Poisoning C arbon](https://static.documents.pub/doc/80x56/5f551747b859172cd56bb119/detecting-carbon-monoxide-poisoning-detecting-carbon-2pdf-detecting-carbon.jpg)
