Asian Journal of Business and Accounting 9(1), 2016 59 Detection and Analysis of Probable Earnings Manipulation by Firms in a Developing Country Tahmina Ahmed* and Jannatul Naima ABSTRACT Manuscript type: Research paper Research aims: This empirical work is to investigate the signs of manipulation of earnings in non-financial firms in Bangladesh. Design/ Methodology/ Approach: The financial data of 102 publicly listed and non-financial firms from the years 2010 to 2013 were collected. Using the Beneish model (1999) as an approach, data were analysed so as to obtain the M-Scores of these firms. Based on the M-Scores, they were then classified into two groups: likely manipulator firms and non-likely manipulator firms. An independent t-test was used to detect the signs of manipulation. Research findings: The outcome of the M-Scores reveals that the proportion of likely manipulator firms had declined over the years. The result of the independent t-test shows that inflating revenues, capitalising expenses, and overstating intangibles could serve as signals of earnings manipulation in firms in Bangladesh. Theoretical contribution/ Originality: The work of this study contributes to current literature through the identification of the signs of manipulation that is detected by the independent t-test. The results can thus help the country to distinguish between likely manipulator and non-likely manipulator firms. Practitioner/ Policy implications: The findings of this study can be used by investors for better investment decision-making. Based on the findings, it appears that regulators should ensure a more stringent monitoring policy on firms so as to decrease the likelihood of manipulation. * Corresponding author: Tahmina Ahmed is a Lecturer at the Department of Accounting & Information Systems, University of Dhaka, Bangladesh. Email: [email protected]. Jannatul Naima is a Lecturer at the Department of Accounting & Information Systems, University of Dhaka, Bangladesh. Email: [email protected].
Transcript
Asian Journal of Business and Accounting 9(1), 2016 59
Detection and Analysis of Probable Earnings Manipulation by Firms in a
Developing Country
Tahmina Ahmed* and Jannatul Naima
ABSTRACT
Manuscript type: Research paper Research aims: This empirical work is to investigate the signs of manipulation of earnings in non-financial firms in Bangladesh. Design/ Methodology/ Approach: The financial data of 102 publicly listed and non-financial firms from the years 2010 to 2013 were collected. Using the Beneish model (1999) as an approach, data were analysed so as to obtain the M-Scores of these firms. Based on the M-Scores, they were then classified into two groups: likely manipulator firms and non-likely manipulator firms. An independent t-test was used to detect the signs of manipulation. Research findings: The outcome of the M-Scores reveals that the proportion of likely manipulator firms had declined over the years. The result of the independent t-test shows that inflating revenues, capitalising expenses, and overstating intangibles could serve as signals of earnings manipulation in firms in Bangladesh. Theoretical contribution/ Originality: The work of this study contributes to current literature through the identification of the signs of manipulation that is detected by the independent t-test. The results can thus help the country to distinguish between likely manipulator and non-likely manipulator firms.Practitioner/ Policy implications: The findings of this study can be used by investors for better investment decision-making. Based on the findings, it appears that regulators should ensure a more stringent monitoring policy on firms so as to decrease the likelihood of manipulation.
* Corresponding author: Tahmina Ahmed is a Lecturer at the Department of Accounting & Information Systems, University of Dhaka, Bangladesh. Email: [email protected] Naima is a Lecturer at the Department of Accounting & Information Systems, University of Dhaka, Bangladesh. Email: [email protected].
Tahmina Ahmed and Jannatul Naima
Asian Journal of Business and Accounting 9(1), 201660
Research implications/ Limitations: This study only highlights the pattern of the manipulation of earnings in non-financial firms in Bangladesh. Further studies need to be conducted in order to detect the effect of changes in government regulations on manipulation of earnings in Bangladesh.
1. IntroductionThe subject of fraudulent reporting has become a popular area of study for academicians and researchers all around the world since the outbreak of news about scandals involving corporate giants like Enron, Waste Management and WorldCom. According to the Report of National Commission on Fraudulent Financial Reporting, fraudulent reporting is explained as “intentional or reckless conduct, whether act or omission, that results in materially misleading financial statements” (1987, p.2).
Since the outcome of fraudulent financial reporting can erode the confidence of investors and also affect a country’s economic condition, fraudulent financial reporting would serve as a good topical issue for research. In Bangladesh, such research is rarely conducted for various reasons hence, this paper would be one of the very few that could provide evidence which can give some indications of the quality of financial reporting of firms in Bangladesh, a country that is considered to be among the eleven emerging markets of the world (Goldman Sachs, 2007). As a country, Bangladesh has a Gross Domestic Product (GDP) growth that has been reported to be above six (6) per cent for four (4) fiscal years starting from the year 2011 and continuing to 2014 (CPD, 2014). Further, the Bangladesh Bank’s Financial Stability Report 2014 had recorded the highest foreign reserve of USD 21.5 billion which is an increase of 40.4 per cent from the previous year.
This study focuses on the quality of financial reporting of firms in non-financial industries, a sector which contributes much to the economy of Bangladesh. According to the Centre for Policy Dialogue, in terms of sector-wise contribution towards GDP growth, manufacturing firms had enjoyed a high growth of 10.3 per cent in the fiscal year of 2015. In addition, it was noted that the industry sector, which was mainly driven by manufacturing growth, had also contributed to the additional growth of 0.45 of a percentage point in the same year. Among the
Asian Journal of Business and Accounting 9(1), 2016 61
Detection and Analysis of Probable Earnings Manipulation by Firms in a Developing Country
main contributors of the industry were food, pharmaceuticals, medical chemicals, and non-metallic mineral products. Despite the slower growth of small scale manufacturing non-financial firms, it was found that jute, cotton, wearing apparels, leather and fabricated metal products had also performed relatively better (CPD, 2015). Similarly, the textile industry appears to be the second largest in the world (d’Ambrogio, 2014). Amidst all these progresses, Bangladesh is also aiming to attract more local and foreign investments into its non-financial sector, an area that demands quality and transparency in operation and fair reporting.
In looking at the manipulation of earnings in firms of Bangladesh, the current study is omitting the financial industry because of the peculiarities this industry possess, for instance, the difficulty to distinguish earnings management from capital management (Beatty & Liao, 2014). Moreover, the financial industry is also more regulated. Fama’s (1980) argument had noted that the separation of ownership and management works best when the market is competitive. In this study, the selected non-financial publicly traded firms are believed to be practising faithful business functions and the managers of these firms are deemed to be trying to maximise the shareholders’ wealth, thus data extracted would be more authentic.
In Bangladesh, the Dhaka Stock Exchange index reached its peak at 8,918.51 points on 5 December 2010, and the index fell more than 2,500 points to a low of 6,326.34 points on 20 January 2011. To investigate the cause of this debacle, the Bangladeshi Government formed a high-powered committee called the ‘Ibrahim Khaled Share Market Probe Committee’. Its aim was to identify several broad factors that could have caused the stock market’s disaster. The investigation revealed that one of the factors that had been the cause of the disaster was the manipulation of earnings in firms. The report found that non-financial firms were susceptible to manipulations (Ibrahim Khalid Share Market Probe Committee, 2011). It was also found that the punitive actions taken by the highest authoritative body, the Bangladesh Securities & Exchange Commission (BSEC), were inadequate. Further, among the top 50 gainers of the market at the time of the bull market, 80 per cent were non-financial firms. Such gains seen in the capital market is indicative of the market bubble formation which is linked to the manipulation of earnings by firms (see Cheng & Warfield, 2005). According to Cheng and Warfield (2005), managers with high equity incentives are more likely to engage in earnings management, a move taken for the purpose of increasing the value of the shares.
Tahmina Ahmed and Jannatul Naima
Asian Journal of Business and Accounting 9(1), 201662
After the share market debacle, the Bangladeshi Government began implementing several reforms to oversee the phenomenon including the introduction of the Corporate Governance Code of 2012, a code of practice that was developed for the purpose of strengthening the governance of listed firms. However, there has been little feedback on the effectiveness of the Code, particularly its impact on earnings manipulation. The current study is thus conducted so as to detect whether there was any decline of possible earnings manipulation by listed non-financial firms subsequent to the corrective measures taken by the Government in response to the 2010-2011 stock market debacle. This study hence, seeks to provide valuable insights into the quality of reporting of firms in non-financial industries by highlighting the possibility of fraudulent reporting. It is deduced that the findings of this study will be of help to investors who can then use the information to identify potential fraudulent firms in previous years when fraud had occurred. This will enable them to select more trustworthy firms for future investments. In addition, the information will also serve as an insight to the relevant authorities who can use it as an indication of any future bubble that is likely to occur in the share market.
This study contributes to extant literature in the following manner. First, no prior research has been conducted in this area to detect probable earnings manipulation by firms in Bangladesh. Secondly, this study attempts to contribute to literature by using the results of the Beneish model to test the factors stimulating earnings manipulation. Thus, it not only seeks to find the number of manipulating firms and the direction it indicates towards the trend or uniformity in such reporting pattern, but also to analyse the results which could help identify the factors influencing earnings manipulation. This study is an extension of previous studies which have used the Beneish model (Brewer, 2004; Beneish, Lee, & Nichols, 2011; Paolone & Magazzino, 2014).
The rest of this paper is organised as follows: Section 2 explains the prior literature and develops the hypotheses. Section 3 provides an explanation on the methodology employed. Section 4 presents and discusses the findings while Section 5 concludes.
2. Literature Review and Research QuestionsIn general, aggressive earnings management and fraudulent financial reporting are crucial issues to investigate for the purpose of investors’ protection. In that regard, authorities are constantly working on the best preventive measures and are constantly locked in a continuous battle
Asian Journal of Business and Accounting 9(1), 2016 63
Detection and Analysis of Probable Earnings Manipulation by Firms in a Developing Country
to look for ways to prevent fraud, one of which is through legislative actions. Earnings management, as a concept, is defined by Giroux (2006, p. 6) to include “the whole spectrum, from conservative through fraud, a huge range for accounting choices.” Consistent with this definition to relate fraudulent reporting with earnings management, Beasley (1996), Erickson, Hanlon, and Maydew (2006) and Zhao and Chen (2009) had employed financial reporting frauds as proxies for earnings management.
Although many researchers have argued that financial statement fraud is an outcome of earnings management (Akers, Giacomino, & Bellovary, 2007), it cannot be denied that earnings also can be manipulated within accounting standards. Organisations tend to engage in earnings management so as to avoid reporting losses as well as to conceal any financially distressed conditions (Cahan, 1992; Dechow, Sloan, & Sweeney, 1996; Burgstahler & Dichev, 1997; Lara, Osma, & Neophytou, 2009). Earnings management becomes illegal when the managers of such firms cross the limit of managing earnings within the scope of accounting principles. When this happens, it becomes unreliable for shareholders to take rational investment decisions. This type of earnings management also amounts to fraudulent financial reporting or fraudulent financial statements. According to Rezaee (2005, p.279), “Financial statement fraud is a deliberate attempt by corporations to deceive or mislead users of published financial statements, especially investors and creditors, by preparing and disseminating materially misstated financial statements”.
Researches on earnings manipulation tend to mostly focus on either the factors (Fama & Jensen, 1983a; 1983b; Baucus & Near, 1991; Alexander & Cohen, 1996; Aggarwal & Samwick, 1999; Mesquita & Smith, 2004; Lennox, Lisowsky, & Pittman, 2013; Vasudev, 2014) or the corrective measures to be taken (Beasley, 1996; Beneish, 2001; Sharma, 2004; Rezaee, 2005; Farber, 2005; Jansen, Ramnath, & Yohn, 2012). However, researches focusing on how to detect financial reporting fraud so that future financial scandals can be prevented, are far in between.
Among the many methods of detecting earnings manipulation are the accrual accounting models, started by Healy (1985), and developed by DeAngelo (1988) and Jones (1991). However, the Beneish model (1999), with probit and logit models, uses a set of different variables in addition to the accruals to detect manipulation (Ekrem, Mustafa, & Mehmet, 2015). The indicators of financial health, such as days’ sales in receivables, sales margins and asset quality are assessed in the Beneish model and this gives a broader view of earnings quality (Pustylnick, 2009).
Tahmina Ahmed and Jannatul Naima
Asian Journal of Business and Accounting 9(1), 201664
After the Enron scandal, the Beneish model received further recognition for its applicability and accuracy in predicting manipulation in firms. Brewer (2004) finds that the model in Beneish (1999), if used, could have flagged Enron as problematic in as early as 1998. Similarly, Beneish et al. (2011) show that the Beneish (1999) model is equally effective in detecting accounting frauds. They find that the model has the ability to separate firms whose accruals are more likely to persist from those whose accruals are more likely to reverse. Testing this model on 17 well known fraud cases involving non-financial firms which occurred from 1998 to 2002, they find 12 of them were flagged by the model.
In a recent study, Paolone and Magazzino (2014) examined the risk of earnings manipulation among Italian firms in the industrial sector (textile, food, clothing, automotive and metallurgic). The sector has been generating relevant revenue streams over the past decades. Using the Beneish model to test the existence of earnings manipulation within the firms, Paolone and Magazzino show that half of the firms analysed had a low probability of manipulating income.
Until now, there has been no research conducted in order to find probable manipulation in firms’ financials in Bangladesh. The role of non-financial firms in increasing the growth of GDP on one hand, and the involvement of such firms in the stock market debacle of 2010-2011 on the other hand, calls for an investigation of the financial reports of non-financial firms in this country. Besides, most previous studies have used the Beneish model only to detect manipulations (Brewer, 2004; Beneish et al., 2011; Paolone & Magazzino, 2014). The current study is an attempt to contribute to literature by using the results of the model to test the factors stimulating manipulations. Thus, it not only seeks to find the number of manipulating firms and indicate the trend or uniformity of such reporting pattern, but also to analyse the results so as to identify the influential factors acting behind the manipulation.
The current study adopts the Beneish model for the purpose of examining the following three research questions:
(1) How many non-financial firms are likely to manipulate their financial reportings in Bangladesh in the years 2011 to 2013?
(2) Is there any observed pattern in the reporting practices of firms likely to manipulate their financial reportings?
(3) What are the dominating ratios (parameters) that indicate that a firm is a likely manipulator?
Asian Journal of Business and Accounting 9(1), 2016 65
Detection and Analysis of Probable Earnings Manipulation by Firms in a Developing Country
3. Research Method
3.1 Research DesignTo address the research questions, this study’s research design is divided into two phases. The first phase uses the Beneish model to classify firms as likely manipulator firms and non-likely manipulator firms. The Beneish model is a mathematical model created by Messod Daniel Beneish who formulated an eight-variable model to identify the occurrence of financial fraud or tendency to engage in earnings manipulation. The M-Score is composed of eight ratios that capture either financial statement distortions that can result from earnings manipulation or indicate a predisposition to engage in earnings manipulation (Beneish & Nichols, 2005). An M-Score of less than -2.22 suggests that the firm is not likely to be a manipulator. An M-Score of greater than -2.22 signals that the firm is likely to be a manipulator (Beneish, 1999). According to Beneish, the result of his analysis shows that the model’s weighted and un-weighted probabilities of earnings manipulation are significantly associated with the existence of fraud because he could correctly identify 76 per cent manipulators, whilst only incorrectly identify 17.5 per cent of non-manipulators with his model. Beneish and Nichols (2005) further determined the probability of financial statement fraud by using five variables in the Beneish model. In the current study, Beneish’s (1999) eight-variable model is employed so as to find the result of the first research question. The model is as follows:
Where,DSRI = Days’ Sales in Receivable Index measured as the ratio of days’
sales in receivables in year t to year t-1. GMI = Gross Margin Index measured as the ratio of gross margin in
year t-1 to gross margin in year t.AQI = Asset Quality Index measured as the ratio of non-current assets
other than plant, property and equipment to total assets in year t to year t-1.
SGI = Ratio of Total Sales in year t to Total Sales in year t-1.DEPI = Depreciation Index measured as the ratio of the rate of
depreciation in year t-1 to the corresponding rate in year t.
Tahmina Ahmed and Jannatul Naima
Asian Journal of Business and Accounting 9(1), 201666
SGAI = Sales, General and Administrative Expenses Index measured as the ratio of SGA expenses in year t relative to year t-1.
LVGI = Leverage Index that is the ratio of total debt to total assets in year t relative to year t-1.
TATA = Ratio of Total Accruals of year t, calculated as the change in working capital accounts other than cash minus depreciation, to Total Assets in year t.
The eight-variable model of the Beneish M-Score is considered capable of unveiling the accounting manipulations and poor quality reporting. This study employs the widely used benchmark of -2.22 score (Beneish, 1999) for classifying the firms into two groups i.e. likely manipulator and non-likely manipulator in a given year.
The second phase of this research work comprises the use of statistical test for identifying the most significant ratios that led to such classification. An independent sample t-test was conducted between the two groups of likely manipulator firms and non-likely manipulator firms and this is done for each of the ratios considered under the Beneish model. As this test works with the average between two independent groups, it is capable of identifying the ratio(s) with the most significant difference. Thus, the dominating ratios that are indicative of a firm likely to manipulate its financials can be detected. This will be useful to regulators and investors as they could focus on these ratios in the financial statements of firms.
While prior studies that had used the Beneish model were primarily devoted to finding the manipulating firms of a country, the current study aims to reinforce the grouping of firms as likely manipulator firms and non-likely manipulator firms. Additionally, it also seeks to find the significant manipulating parameters. Thus, this study is considered to be adding value to the research arena.
3.2 Sample SelectionThe population of this study consists of non-financial firms whose shares are listed on the Dhaka Stock Exchange. The total number of non-financial firms in 2015 was 184. The initial selection consists of all these 184 non-financial firms. In order to calculate the M-Score for the year t, data for both the year t and t-1 are required. Moreover, to identify if the non-financial firms are still manipulative, the M-Scores for post-stock market crash years are required. Therefore, data were collected over a
Asian Journal of Business and Accounting 9(1), 2016 67
Detection and Analysis of Probable Earnings Manipulation by Firms in a Developing Country
period of four years from 2010 to 2013 for the calculation of M-Score for three consecutive years, 2011, 2012, and 2013.
A primary scrutiny was made to discard the firms that were listed only after 2010. There were 46 such firms. Hence, the sample size was reduced to 138. Further, 36 firms were omitted because their nature of business and accounting data were such that they did not fit in with the Beneish M-Score model. Thus, the final usable sample size was 102 firms. However, the financial statements of seven (7) firms for the year 2013 were unavailable. In addition, some firms did not report on items such as Other Long-Term Assets and Long-Term Debts, in their financial reports in certain sample years. As these items were necessary for measuring M-Score, these firms were not included in the analysis for those years. Thus, the number of firms analysed in the sample years differs. This study analysed 84 firms for year 2011, 86 firms for year 2012 and 81 firms for year 2013. 4. Results and Discussion
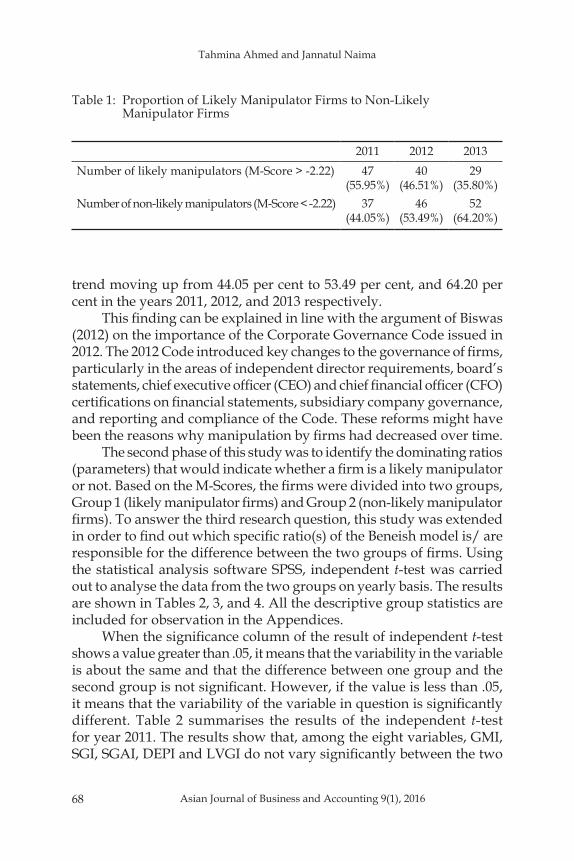
4.1 FindingsData were tested by using the eight-variable in the Beneish model, and the results are summarised in Table 1. The table provides the answer to the first research question which is to find out how many firms under consideration are likely to be manipulators. It also helps to find out whether there is any pattern in the overall scenario of manipulation over the study period from 2011 to 2013.
Table 1 also shows the number of firms that come under the group of likely manipulator firms and non-likely manipulator firms. For the purpose of classifying the firms into two groups, this study employs the broadly used benchmark of -2.22 score (Beneish, 1999). The results suggest that the proportion of likely manipulator firms to non-likely manipulator firms decreased over the three year period of study. In 2011, the first year of the study, 55.95 per cent of the firms tested appears to be likely manipulators and 44.05 per cent non-likely manipulators. The proportion improved from one year to the next year according to the results derived from the model. Although the total number of firms tested was not the same every year, the ratio of the likely manipulator firms to non-likely manipulator firms shows a decreasing trend, and the percentage of manipulators had decreased from 55.95 per cent in 2011 to 46.51 per cent in 2012, and to 35.80 per cent in 2013. The percentage of non-likely manipulator firms, on the other hand, shows an increasing
Tahmina Ahmed and Jannatul Naima
Asian Journal of Business and Accounting 9(1), 201668
trend moving up from 44.05 per cent to 53.49 per cent, and 64.20 per cent in the years 2011, 2012, and 2013 respectively.
This finding can be explained in line with the argument of Biswas (2012) on the importance of the Corporate Governance Code issued in 2012. The 2012 Code introduced key changes to the governance of firms, particularly in the areas of independent director requirements, board’s statements, chief executive officer (CEO) and chief financial officer (CFO) certifications on financial statements, subsidiary company governance, and reporting and compliance of the Code. These reforms might have been the reasons why manipulation by firms had decreased over time.
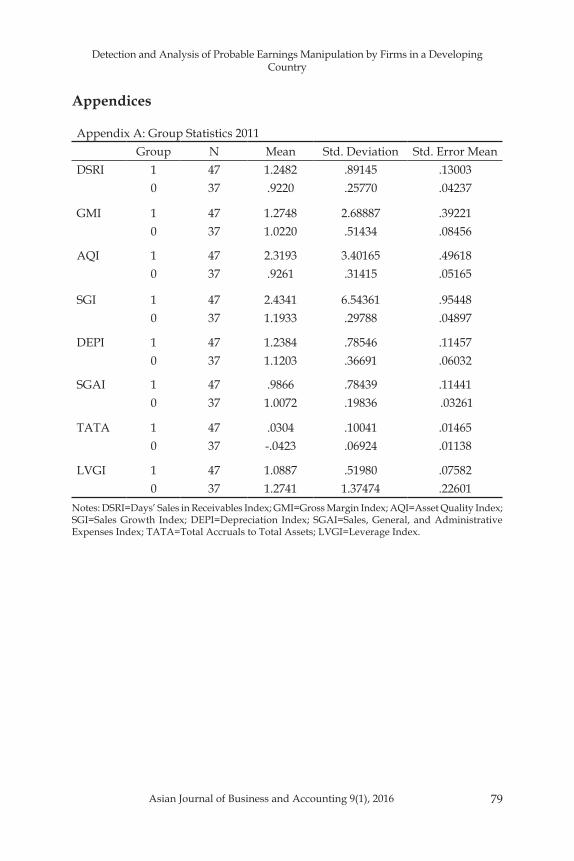
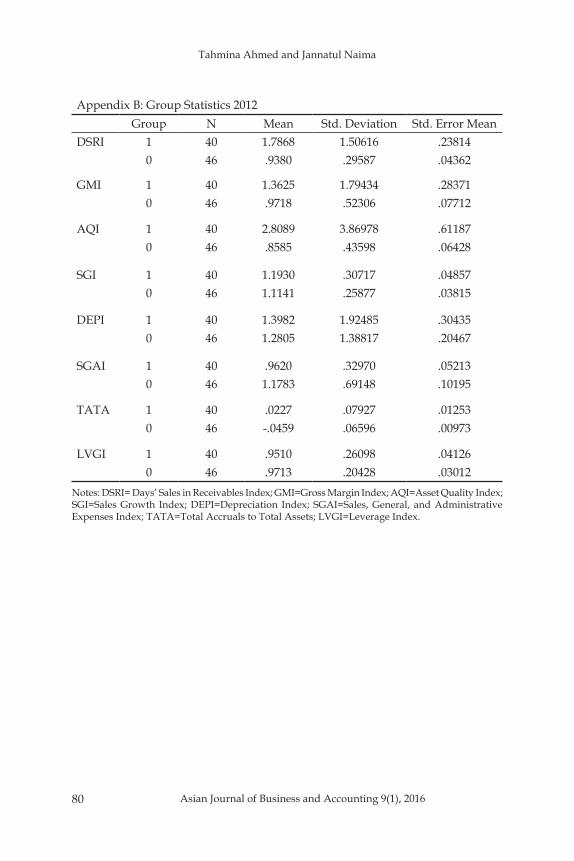
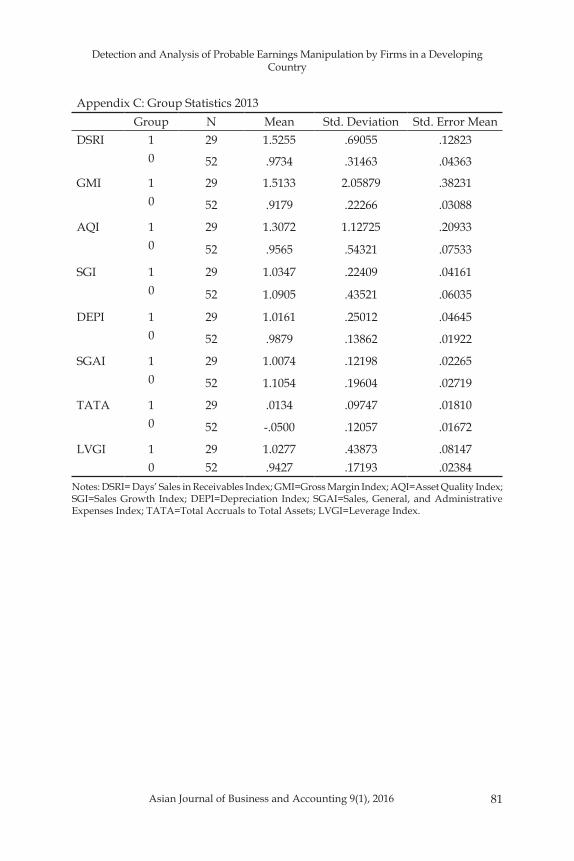
The second phase of this study was to identify the dominating ratios (parameters) that would indicate whether a firm is a likely manipulator or not. Based on the M-Scores, the firms were divided into two groups, Group 1 (likely manipulator firms) and Group 2 (non-likely manipulator firms). To answer the third research question, this study was extended in order to find out which specific ratio(s) of the Beneish model is/ are responsible for the difference between the two groups of firms. Using the statistical analysis software SPSS, independent t-test was carried out to analyse the data from the two groups on yearly basis. The results are shown in Tables 2, 3, and 4. All the descriptive group statistics are included for observation in the Appendices.
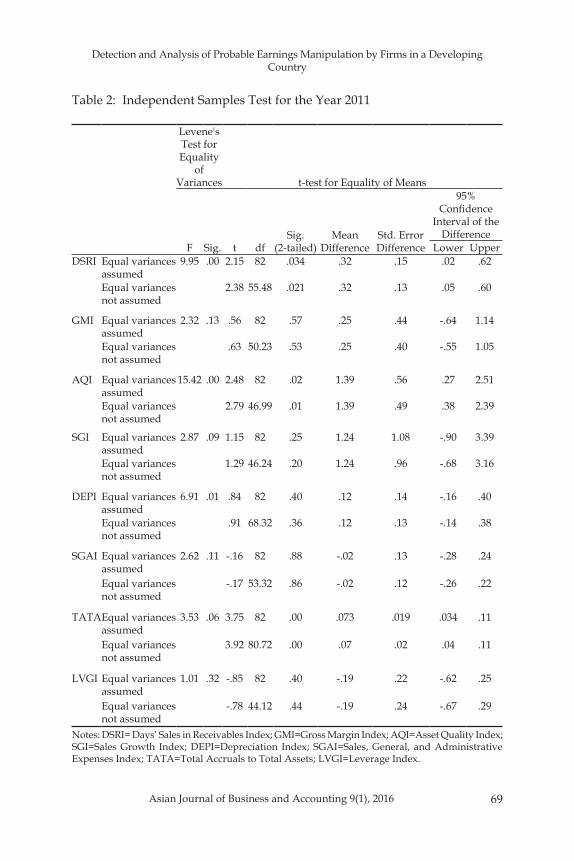
When the significance column of the result of independent t-test shows a value greater than .05, it means that the variability in the variable is about the same and that the difference between one group and the second group is not significant. However, if the value is less than .05, it means that the variability of the variable in question is significantly different. Table 2 summarises the results of the independent t-test for year 2011. The results show that, among the eight variables, GMI, SGI, SGAI, DEPI and LVGI do not vary significantly between the two
2011 2012 2013Number of likely manipulators (M-Score > -2.22) 47
(55.95%)40
(46.51%)29
(35.80%)Number of non-likely manipulators (M-Score < -2.22) 37
(44.05%)46
(53.49%)52
(64.20%)
Table 1: Proportion of Likely Manipulator Firms to Non-Likely Manipulator Firms
Asian Journal of Business and Accounting 9(1), 2016 69
Detection and Analysis of Probable Earnings Manipulation by Firms in a Developing Country
Table 2: Independent Samples Test for the Year 2011
Levene's Test for Equality
of Variances t-test for Equality of Means
F Sig. t dfSig.
(2-tailed)Mean
DifferenceStd. Error Difference
95% Confidence
Interval of the Difference
Lower UpperDSRI Equal variances
assumed9.95 .00 2.15 82 .034 .32 .15 .02 .62
Equal variances not assumed
2.38 55.48 .021 .32 .13 .05 .60
GMI Equal variances assumed
2.32 .13 .56 82 .57 .25 .44 -.64 1.14
Equal variances not assumed
.63 50.23 .53 .25 .40 -.55 1.05
AQI Equal variances assumed
15.42 .00 2.48 82 .02 1.39 .56 .27 2.51
Equal variances not assumed
2.79 46.99 .01 1.39 .49 .38 2.39
SGI Equal variances assumed
2.87 .09 1.15 82 .25 1.24 1.08 -.90 3.39
Equal variances not assumed
1.29 46.24 .20 1.24 .96 -.68 3.16
DEPI Equal variances assumed
6.91 .01 .84 82 .40 .12 .14 -.16 .40
Equal variances not assumed
.91 68.32 .36 .12 .13 -.14 .38
SGAI Equal variances assumed
2.62 .11 -.16 82 .88 -.02 .13 -.28 .24
Equal variances not assumed
-.17 53.32 .86 -.02 .12 -.26 .22
TATAEqual variances assumed
3.53 .06 3.75 82 .00 .073 .019 .034 .11
Equal variances not assumed
3.92 80.72 .00 .07 .02 .04 .11
LVGI Equal variances assumed
1.01 .32 -.85 82 .40 -.19 .22 -.62 .25
Equal variances not assumed
-.78 44.12 .44 -.19 .24 -.67 .29
Notes: DSRI= Days’ Sales in Receivables Index; GMI=Gross Margin Index; AQI=Asset Quality Index; SGI=Sales Growth Index; DEPI=Depreciation Index; SGAI=Sales, General, and Administrative Expenses Index; TATA=Total Accruals to Total Assets; LVGI=Leverage Index.
Tahmina Ahmed and Jannatul Naima
Asian Journal of Business and Accounting 9(1), 201670
Levene's Test for Equality
of Variances t-test for Equality of Means
F Sig. t dfSig.
(2-tailed)Mean
DifferenceStd. Error Difference
95% Confidence
Interval of the Difference
Lower UpperDSRI Equal variances
assumed20.90 .00 3.74 84 .00 .85 .27 .40 1.30
Equal variances not assumed
3.51 41.62 .00 .85 .24 .36 1.34
GMI Equal variances assumed
2.40 .13 1.41 84 .16 .39 .28 -.16 .94
Equal variances not assumed
1.33 44.77 .19 .39 .29 -.20 .98
AQI Equal variances assumed
28.93 .00 3.40 84 .00 1.95 .57 .81 3.09
Equal variances not assumed
3.17 39.86 .03 1.95 .62 .71 3.19
SGI Equal variances assumed
.83 .36 1.29 84 .20 .08 .06 -.042 .20
Equal variances not assumed
1.28 76.68 .21 .08 .06 -.04 .20
DEPI Equal variances assumed
.27 .61 .33 84 .74 .12 .36 -.59 .83
Equal variances not assumed
.32 69.87 .75 .12 .37 -.61 .85
SGAI Equal variances assumed
1.55 .22 -1.81 84 .07 -.21 .12 -.45 .02
Equal variances not assumed
-1.89 66.37 .06 -.21 .11 -.44 .012
TATA Equal variances assumed
.74 .39 4.38 84 .00 .07 .02 .04 .10
Equal variances not assumed
4.33 76.17 .00 .07 .02 .04 .10
LVGI Equal variances assumed
3.01 .09 -.40 84 .69 -.02 .05 -.12 .08
Equal variances not assumed
-.40 73.54 .69 -.02 .05 -.12 .08
Table 3: Independent Samples Test for the Year 2012
Notes: DSRI= Days’ Sales in Receivables Index; GMI=Gross Margin Index; AQI=Asset Quality Index; SGI=Sales Growth Index; DEPI=Depreciation Index; SGAI=Sales, General, and Administrative Expenses Index; TATA=Total Accruals to Total Assets; LVGI=Leverage Index.
Asian Journal of Business and Accounting 9(1), 2016 71
Detection and Analysis of Probable Earnings Manipulation by Firms in a Developing Country
Levene's Test for
Equality of Variances t-test for Equality of Means
F Sig. t dfSig.
(2-tailed)Mean
DifferenceStd. Error Difference
95% Confidence
Interval of the Difference
Lower UpperDSRI Equal variances
assumed8.55 .01 4.94 79 .00 .55 .11 .33 .78
Equal variances not assumed
4.08 34.60 .00 .55 .14 .28 .83
GMI Equal variances assumed
12.64 .00 2.07 79 .04 .60 .29 .02 1.17
Equal variances not assumed
1.55 28.37 .13 .60 .39 -.19 1.38
AQI Equal variances assumed
6.15 .015 1.89 79 .06 .35 .18 -.02 .72
Equal variances not assumed
1.58 35.40 .12 .35 .22 -.10 .80
SGI Equal variances assumed
.02 .90 -.64 79 .52 -.06 .09 -.23 .12
Equal variances not assumed
-.76 78.64 .45 -.06 .07 -.20 .09
DEPI Equal variances assumed
5.15 .03 .65 79 .52 .03 .04 -.058 .11
Equal variances not assumed
.56 37.81 .58 .03 .05 -.07 .13
SGAI Equal variances assumed
3.34 .07 -2.44 79 .02 -.09 .04 -.18 -.02
Equal variances not assumed
-2.77 77.96 .01 -.09 .04 -.17 -.03
TATA Equal variances assumed
.00 .99 2.42 79 .02 .06 .03 .01 .12
Equal variances not assumed
2.57 68.71 .01 .06 .02 .01 .11
LVGI Equal variances assumed
2.32 .13 1.24 79 .22 .08 .07 -.05 .22
LVGI Equal variances assumed
2.32 .13 1.24 79 .22 .08 .07 -.05 .22
Equal variances not assumed
1.00 32.87 .32 .08 .08 -.09 .26
Table 4: Independent Samples Test for the Year 2013
Notes: DSRI= Days’ Sales in Receivables Index; GMI=Gross Margin Index; AQI=Asset Quality Index; SGI=Sales Growth Index; DEPI=Depreciation Index; SGAI=Sales, General, and Administrative Expenses Index; TATA=Total Accruals to Total Assets; LVGI=Leverage Index.
Tahmina Ahmed and Jannatul Naima
Asian Journal of Business and Accounting 9(1), 201672
groups. However, there are significant differences with regards to the other three variables, DSRI, AQI and TATA. Table 2 shows that DSRI, AQI and TATA are the only variables with values which are less than or equal to a value of .05; hence, it can be concluded that these variables differ significantly between the two groups and that the differences in the means are not due to chance but rather, due to manipulation.
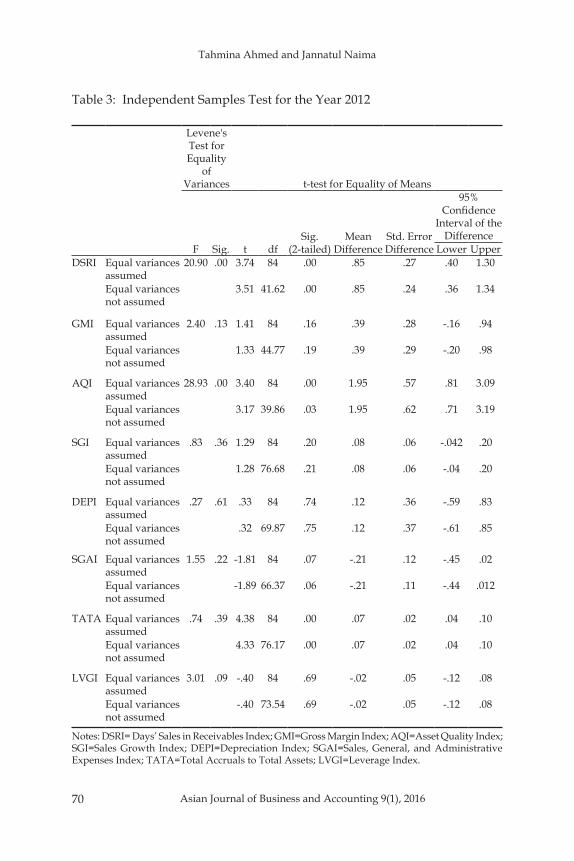
Table 3 shows similar results for the year 2012. It is noted that DSRI, AQI, and TATA are statistically significant in terms of differences in mean scores between the two groups while the other five variables are considered insignificant in terms of differences in mean scores.
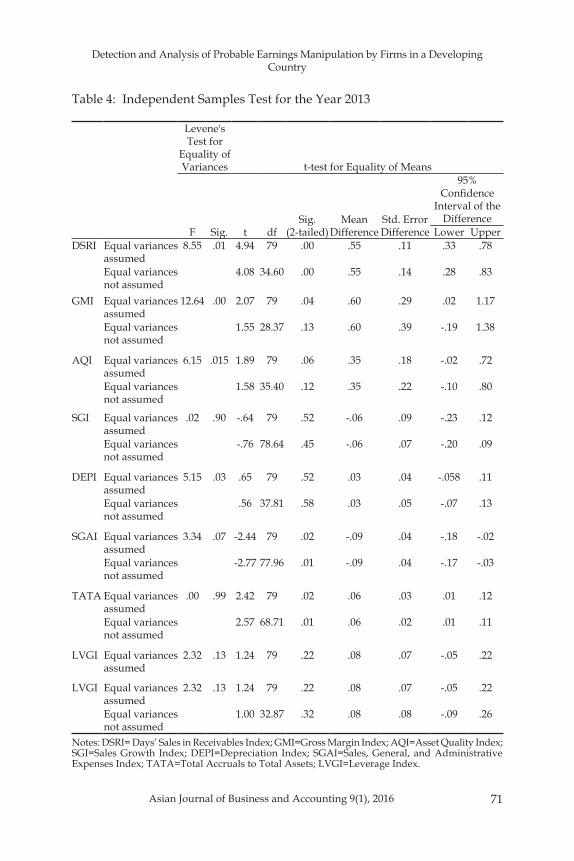
This study also analysed the outcomes for the year 2013. The result is tabulated in Table 4. It shows that DSRI and TATA continue to be the two statistically significant variables which caused the difference between the two groups of likely manipulator firms and non-likely manipulator firms. However, the AQI is found to be not statistically significant in the differences of the means of the two groups. In addition, a new variable, SGAI is found to be a significant ratio in 2013.
4.2 Analysis of FindingsFrom the study, it is noted that there is a declining pattern of probable manipulative behaviours. This declining pattern is the indication of improvement in reporting practices, possibly due to the implementation of the Corporate Governance Code 2012 which brought several changes in the disclosure requirement. This finding suggests that future research may be conducted to explore the relationship between the Code and the change in the manipulating behaviour of firms.
The second phase where t-test has been used separately in the two groups for all the three years aims to look for the significant ratios which are responsible for classifying firms into the two groups of likely manipulator firms and non-likely manipulator firms. From the data extracted from years 2011 and 2012, three ratios namely DSRI, AQI, and TATA are found to be significant in stimulating the firms to be different in terms of manipulation in reporting. However, the analysis of data for year 2013 shows that AQI is no longer significantly different between the groups. However, the two ratios of DSRI and TATA are still considered significant. In addition, SGAI appears to be a significant variable that had caused the difference in the two groups. To further discuss the findings of the particular ratios that have been identified as significant, this study analyses the scores of the individual index of all the three years.
Asian Journal of Business and Accounting 9(1), 2016 73
Detection and Analysis of Probable Earnings Manipulation by Firms in a Developing Country
According to Warshavsky (2012) and Harrington (2005), a disproportionate increase in accounts receivable and relative to sales, which is measured by DSRI, may be indicative of inflated revenues. As the ratio under this study detects a rise in receivables, it can be concluded that the increase might have resulted from revenue inflation, thus, from manipulated reporting of earnings.
The second significant ratio, AQI, reflects the change in asset realisation risk which is done by comparing current assets and property, plant, and equipment with total assets (Harrington, 2005). As Warshavsky (2012) suggests, the increase in the ratio might be an indication that a firm has increased its cost deferral or its intangible assets as a way to manipulate its earnings.
The third ratio which causes significance difference between likely manipulator firms and non-likely manipulator firms is TATA. The total accruals to total assets ratio has often been used as proxies for earnings management (Dechow & Dichev, 2002; McNichols, 2002; Jones, Krishnan, & Meleudrez, 2008). Hence, this study’s result is consistent with the findings of previous studies.
The last parameter that is found to be causing the difference between the two groups of firms is SGAI. An increase in SGAI, according to Warshavsky (2012), serves as a negative indication of a firm’s future prospects. The significance of SGAI can be interpreted as the profit manipulating behaviour, especially through the charging of higher expenses. In this study, SGAI, in year 2013, has consistently shown a higher measure in likely manipulator firms than in non-likely manipulator firms.
The four variables, DSRI, AQI, TATA and SGAI, that played vital roles in distinguishing the likely manipulator firms from the non-likely manipulator firms, can be reflective of how the firms under study might be manipulating earnings. A particular reflection on two variables, AQI and SGAI, is suggested. AQI is a significant variable indicating manipulations for two consecutive years (2011 and 2012) but in the year of 2013, it became insignificant while SGAI became a significant factor. This result suggests that the firms have been manipulating earnings by capitalising on expenses in earlier years and allocating those expenses over the later periods.
5. Concluding RemarksResearchers believe that competitive firms have a lesser probability of getting involved in the manipulation of reporting (Fama, 1980;
Tahmina Ahmed and Jannatul Naima
Asian Journal of Business and Accounting 9(1), 201674
Marciukaityte & Park, 2009). In order to examine the likelihood of manipulation and fraudulent reporting in Bangladesh, this study analysed the reported data of 102 firms in the non-financial industries of Bangladesh. The study classified the firms into two groups based on the outcomes of the Beneish model, popularly known as M-Score. Following Beneish et al. (2011)’s study, this study also classified the firms under study into two groups i.e. likely manipulators and non-likely manipulators.
This study had aimed to identify the financial ratios used in the Beneish model which could play the most significant roles in producing the difference between likely manipulator firms and non-likely manipulator firms. In using the Beneish model, the results extracted from the M-Scores show a declining pattern of the likelihood of manipulation by the firms under study. This is traced to the decrease in proportion of likely manipulator firms as identified by the M-Scores over the years. The results of this study suggest that the lack of punishment of firms involved in the Bangladesh stock market crash in 2011 may have led some firms to continue the manipulation. Such an indication is in line with the findings of Singh, Vasudeva, and Dev (2014) who find that a delay in the final judgment of fraud related court cases is the most important cause of unethical financial reporting followed by inadequate punishment for defaulters. Besides the above findings, the result of the independent t-test, the objective of which was to identify factors influencing manipulation by firms, had indicated that DSRI, AQI, TATA and SGAI are the ratios that had mainly caused the probable manipulation. These results pointed out the possible ways of manipulation such as recognising future revenues thus, inflating accruals and capitalising expenses that leads to high expenses in later years (Harrington, 2005; Warshavsky, 2012).
This study highlights the emergence of likely manipulator firms, discovers the patterns of manipulation, and identifies the parameters of manipulation. In addition, this study also contributes to current literature by extending the findings of the M-Score through a comparison of two groups of firms and through highlighting the significant variables of probable manipulation. However, this study is also subjected to some limitations. As pointed out by Rufus (2003), though accounting ratios are important tools in any financial analysis, ratios are constructed from the accounting data, which are subjected to interpretations and even manipulation. Thus, it is suggested that this research be extended by analysing the data with some other measures or through case studies of
Asian Journal of Business and Accounting 9(1), 2016 75
Detection and Analysis of Probable Earnings Manipulation by Firms in a Developing Country
firms. Finally, this study may be adapted by researchers in other South Asian and Middle Eastern countries where the nature of business and financial reporting environment is similar to that of Bangladesh so as to confirm the findings and make comparisons.
ReferencesAggarwal, K.R., & Samwick, A.A. (1999). The other side of the trade-off: The
impact of risk on executive compensation. Journal of Political Economy, 10(1), 65-105.
Akers, M., Giacomino, D., & Bellovary, J. (2007). Earnings management and its implications: Educating the accounting profession. The CPA Journal, 77(8), 64-68.
Alexander, R.C., & Cohen, A.M. (1996). New evidence on the origins of corporate crime. Managerial and Decision Economics, 17(4), 421-435.
Baucus, S.M., & Near, P.J. (1991). Can illegal corporate behavior be predicted? An event history analysis. The Academy of Management Journal, 34(1), 9-36.
Beasley, M. (1996). An empirical analysis of the relation between the board of director composition and financial statement fraud. The Accounting Review, 74(4), 443-465.
Beatty, A., & Liao, S. (2014). Financial accounting in the banking industry: A review of the empirical literature. Journal of Accounting and Economics, 58(2-3), 339-383.
Beneish, M.D., & Nichols, D. (2005). Earnings Quality and Future Returns: The Relation between Accruals and the Probability of Earnings Manipulation. Available at SSRN:http://ssrn.com/abstract=725162 (accessed on 28 May 2016).
Beneish, M.D., Lee, C.M.C., & Nichols, D.C. (2011). To Catch a Thief: Can Forensic Accounting Help Predict Stock Returns? Available at SSRN: http://ssrn.com/abstract=1903593 (accessed on 28 May 2016).
Beneish, M. (2001). Earnings management: A perspective. Managerial Finance, 27(12), 3-17.
Beneish, M. (1999). The detection of earning manipulation. Financial Analyst Journal, 55(5), 24-36.
Biswas, P.K. (2012). Corporate governance guidelines in Bangladesh: Some observations. The Cost and Management, 40(4), 5-9.
Brewer, L. (2004). Capitalizing on the Value of Integrity. Available at http://lynnbrewer.info/white_papers.html (accessed on 3 May 2016).
Burgstahler, D., & Dichev, I. (1997). Earnings management to avoid earnings decreases and losses. Journal of Accounting and Economics, 24(1), 99-126.
Cahan, S. (1992). The effect of antitrust investigations on discretionary accruals: A refined test of the political-cost hypothesis. The Accounting Review, 67(1), 77-95.
Tahmina Ahmed and Jannatul Naima
Asian Journal of Business and Accounting 9(1), 201676
Cheng, Q., & Warfield, T. (2005), Equity incentives and earnings management. The Accounting Review, 80(20), 441-476.
Centre for Policy Dialogue (CPD). (2014). State of the Bangladesh Economy in Fiscal Year 2014 (Third Reading), Independent Review of Bangladesh’s Development (IRBD). Centre for Policy Dialogue. Available at http://cpd.org.bd/wp-content/uploads/2014/06/Centre-for-Policy-Dialogue-IRBD-FY14-Third-Reading-Full-Study.pdf (accessed on 28 May 2016).
Centre for Policy Dialogue (CPD). (2015). State of the Bangladesh Economy in FY2015 and the Closure of Sixth Five Year Plan. Centre for Policy Dialogue. Available at http://cpd.org.bd/wp-content/uploads/2015/06/CPD-IRBD-FY15-State-of-Bangladesh-Economy-June-2015.pdf (accessed on 28 May 2016).
D’Ambrogio E. (2014). Workers’ Conditions in the Textile and Clothing Sector: Just an Asian Affair? Issues at Stake after the Rana Plaza Tragedy (Briefing). Eoropeun Parliamentary Research Service. Available at http://www.europarl.europa.eu/EPRS/140841REV1-Workers-conditions-in-the-textile-and-clothing-sector-just-an-Asian-affair-FINAL.pdf (accessed on 28 May 2016).
DeAngelo, L. (1988). Discussion of evidence of earnings management from the provision for bad debts. Journal of Accounting Research, 26(Suppl.), 32-40.
Dechow, P.M., & Dichev, T.D. (2002). The quality of accruals and earnings: The role of accrual estimation errors. The Accounting Review, 77(Supplement), 35-59.
Dechow, P., Sloan, R., & Sweeney, A. (1996). Causes and consequences of earnings manipulation: An analysis of firms subject to enforcement by SEC. Contemporary Accounting Research, 13(1), 1-36.
Ekrem, K., Mustafa, U., & Mehmet, K. (2015). Using Beneish model in identifying accounting manipulation: An empirical study. Journal of Accounting, Finance and Auditing Studies, 1(1), 21-39.
Erickson, M., Hanlon, M., & Maydew, E. (2006). Is there a link between executive equity incentives and accounting fraud? Journal of Accounting Research, 44(1), 113-143.
Fama, F.E. (1980). Agency problems and the theory of the firm. Journal of Political Economy, 88(2), 288-307.
Fama, F.E., & Jensen, C.M. (1983a). Separation of ownership and control. Journal of Law and Economics, 26(2), 301-325.
Fama, F.E., & Jensen, C.M. (1983b). Agency problems and residuals claims. Journal of Law and Economics, 26(2), 327-349.
Farber, D. (2005). Restoring trust after fraud: Does corporate governance matter? The Accounting Review, 80(2), 539-561.
Giroux, G. (2006). Earnings Magic and the Unbalance Sheet: The Search for Financial Reality. New York: John Wiley & Sons.
Goldman Sachs. (2007). Our Thinking: Goldman Sachs. Available at http://www.goldmansachs.com/our-thinking/archive/BRICs-and-Beyond.html (accessed on 3 May 2016).
Asian Journal of Business and Accounting 9(1), 2016 77
Detection and Analysis of Probable Earnings Manipulation by Firms in a Developing Country
Harrington, C. (2005, March/April). Analysis ratios for detecting financial statement fraud. Fraud Magazine. Available at http://www.fraud-magazine.com/article.aspx?id=4294967726 (accessed on May 3, 2016).
Healy, P.M., (1985). The effect of bonus schemes on accounting decisions. Journal of Accounting and Economics, 7, 85-107.
Ibrahim Khalid Share Market Probe Committee (2011). Ibrahim Khalid Committee Share Probe Report. Ministry of Finance, Government of People’s Republic of Bangladesh, Dhaka.
Jansen, I., Ramnath, S., & Yohn, T. (2012). A diagnostic for earnings management using changes in asset turnover and profit margin. Contemporary Accounting Research, 29(1), 221-251.
Jones, K.L., Krishnan, G.V., & Meleudrez, K.D. (2008). Do models of discretionary accruals detect actual cases of fraudulent and restated earnings? An empirical analysis. Contemporary Accounting Research, 25(2), 499-531.
Jones, J.J. (1991). Earnings management during import relief investigations. Journal of Accounting Research, 29(2), 193-228.
Lara, J., Osma, B., & Neophytou, E. (2009). Earnings quality in ex-post failed firms. Accounting and Business Research, 39(2), 119-138.
Lennox, C.S., Lisowsky, P., & Pittman, J. (2013). Tax aggressiveness and accounting fraud. Journal of Accounting Research, 51(4), 739-778.
Marciukaityte, D. & Park, J.C., 2009. Market Competition and Earnings Management. Available at http://ssrn.com/abstract=1361905 (accessed on 30 May 2016).
McNichols, M.E. (2002). Discussion of the quality of accruals and earnings: The role of accrual estimation errors. The Accounting Review, 77(s-1), 61-69.
Mesquita, B.B., & Smith, A. (2004). The political economy of corporate fraud: A theory and empirical tests. NYU Working Paper No. CLB-06-001. Available at http://www.nyu.edu/gsas/dept/politics/faculty/smith/fraud_paper_SEPT2004.pdf (accessed on 28 May 2016).
National Commission on Fraudulent Financial Reporting. (1987). Report of the National Commission on Fraudulent Financial Reporting. Available at http://www.coso.org/publications/ncffr.pdf (accessed on 28 May 2016).
Paolone, F., & Magazzino, C. (2014). Earnings manipulation among the main industrial sectors: Evidence from Italy. Economia Aziendale Online, 5(4), 253-261.
Pustylnick, I. (2009). Combined Algorithm for Detection of Manipulation in Financial Statements. SMC University, Swiss Management Center. Available at http://papers.ssrn.com/sol3/papers.cfm?abstract_id=1422693 (accessed on 28 May 2016).
Rezaee, Z. (2005). Causes, consequences, and deterrence of financial statement fraud. Critical Perspectives on Accounting, 16(3), 277-298.
Rufus, R. (2003). Financial ratios: Use, predictive power and the Z-Score. The Valuation Examiner. (May-June), 14-17.
Sharma, V. (2004). Board of director characteristics, institutional ownership, and fraud: Evidence from Australia. Auditing: A Journal of Practice and Theory, 23(2), 105-117.
Tahmina Ahmed and Jannatul Naima
Asian Journal of Business and Accounting 9(1), 201678
Singh, A.K., Vasudeva, S., & Dev, A.N. (2014). Unethical financial reporting: An empirical analysis of causes and consequences. Journal of Finance and Accounting, 1(1), 1-30.
Vasudev, P.M. (2014). Corporate Governance at Nortel – Board Functions and the Need for Redefinition.. Available at http://sites.telfer.uottawa.ca/nortelstudy/files/2014/02/vasudev-corporate-governance-at-nortel.pdf (accessed on 28 May 2016).
Warshavsky, M. (2012). Analyzing earnings quality as a financial forensic tool. Financial Valuation and Litigation Expert Journal, 39, 16-20.
Zhao, Y., & Chen, K.H. (2009). Earnings quality effect of state antitakeover statutes. Journal of Accounting Public Policy, 28(2), 92-117.
Asian Journal of Business and Accounting 9(1), 2016 79
Detection and Analysis of Probable Earnings Manipulation by Firms in a Developing Country
Notes: DSRI=Days’ Sales in Receivables Index; GMI=Gross Margin Index; AQI=Asset Quality Index; SGI=Sales Growth Index; DEPI=Depreciation Index; SGAI=Sales, General, and Administrative Expenses Index; TATA=Total Accruals to Total Assets; LVGI=Leverage Index.
Appendix A: Group Statistics 2011Group N Mean Std. Deviation Std. Error Mean