Application Note 40030214 Keywords Flame Ionization Detector (FID) Integration Time Gate Open Lab Software Pulsed Flame Photometric Detector (PFPD) Spearmint Oil WinPulse Software Presented at the 2014 Pittsburgh Conference on Analytical Chemistry and Applied Spectroscopy, Chicago, Illinois, March 2 - 6, 2014 Detection of Low-Level Sulfur Compounds in Spearmint Oil Using the Pulsed Flame Photometric Detector (PFPD) Introduction Two species of spearmint (mentha spicata and mentha gracilis) are cultivated in the United States. In 2008, 1.09 million kilograms of spearmint oil were produced in the U.S. (1) Forty-five percent of the mint oil produced in the U.S. is used to flavor chewing gum. One 55-gallon drum of mint oil can flavor 5,200,000 sticks of gum or 400,000 tubes of toothpaste. (2) The principal chemical components in spearmint oil are -pinene, - pinene, carvone, 1,8-cineole, linalool, limonene, myrcene, caryophyllene, and menthol. This study was undertaken to determine if a Pulsed Flame Photometric Detector (PFPD) could be used to find low-level sulfur compounds in spearmint oil. Sulfur compounds impart undesirable odors to essential oils used in flavor and fragrance products. Volatile sulfur compounds have extremely low olfactory thresholds. Detecting, identifying, and eliminating sulfur compounds is an important aspect of flavor and fragrance work. Associating sulfur compounds by their retention times, with the peaks of hydrocarbon compounds measured by an FID detector provides both qualitative and %total measurements normally used in flavor and fragrance labs. The objectives of the experimental work were: • Associate the PFPD carbon element response with the FID detector output for chromatographic verification of the peaks obtained by both techniques • Use the carbon element to find the sulfur species in the sample by vaporization temperature • Isolate sulfur species and sulfur containing compounds from the HC compounds by retention times • Find the area % for all C and S elements and demonstrate the C ele- ment percentages are recognizably similar • Provide an area % for the sulfur species • Detect the lowest possible sulfur value that can be confirmed and show results The carbon chromatograms obtained from PFPD and FID detectors are different because the PFPD is an equimolar photometric detector, while the FID responds to and measures all broken hydrocarbon bonds. The combustion cycle occurring in the PFPD breaks down molecules into
Transcript
Application Note 40030214
KeywordsFlame Ionization Detector (FID)Integration Time GateOpen Lab SoftwarePulsed Flame Photometric
Detector (PFPD)Spearmint OilWinPulse Software
Presented at the 2014 Pittsburgh Conference on Analytical Chemistry and Applied
Spectroscopy, Chicago, Illinois, March 2 - 6, 2014
Detection of Low-Level Sulfur Compounds in Spearmint Oil Using the Pulsed Flame
Photometric Detector (PFPD)
IntroductionTwo species of spearmint (mentha spicata and mentha gracilis) are cultivated in the United States. In 2008, 1.09 million kilograms of spearmint oil were produced in the U.S.(1) Forty-five percent of the mint oil produced in the U.S. is used to flavor chewing gum. One 55-gallon drum of mint oil can flavor 5,200,000 sticks of gum or 400,000 tubes of toothpaste.(2)
The principal chemical components in spearmint oil are -pinene, -pinene, carvone, 1,8-cineole, linalool, limonene, myrcene, caryophyllene, and menthol.
This study was undertaken to determine if a Pulsed Flame Photometric Detector (PFPD) could be used to find low-level sulfur compounds in spearmint oil. Sulfur compounds impart undesirable odors to essential oils used in flavor and fragrance products. Volatile sulfur compounds have extremely low olfactory thresholds. Detecting, identifying, and eliminating sulfur compounds is an important aspect of flavor and fragrance work.
Associating sulfur compounds by their retention times, with the peaks of hydrocarbon compounds measured by an FID detector provides both qualitative and %total measurements normally used in flavor and fragrance labs.
The objectives of the experimental work were:
• Associate the PFPD carbon element response with the FID detector output for chromatographic verification of the peaks obtained by both techniques
• Use the carbon element to find the sulfur species in the sample by vaporization temperature
• Isolate sulfur species and sulfur containing compounds from the HC compounds by retention times
• Find the area % for all C and S elements and demonstrate the C ele-ment percentages are recognizably similar
• Provide an area % for the sulfur species• Detect the lowest possible sulfur value that can be confirmed and
show results
The carbon chromatograms obtained from PFPD and FID detectors are different because the PFPD is an equimolar photometric detector, while the FID responds to and measures all broken hydrocarbon bonds. The combustion cycle occurring in the PFPD breaks down molecules into
atomic species. The number of carbon atoms present determines the resulting response factor.
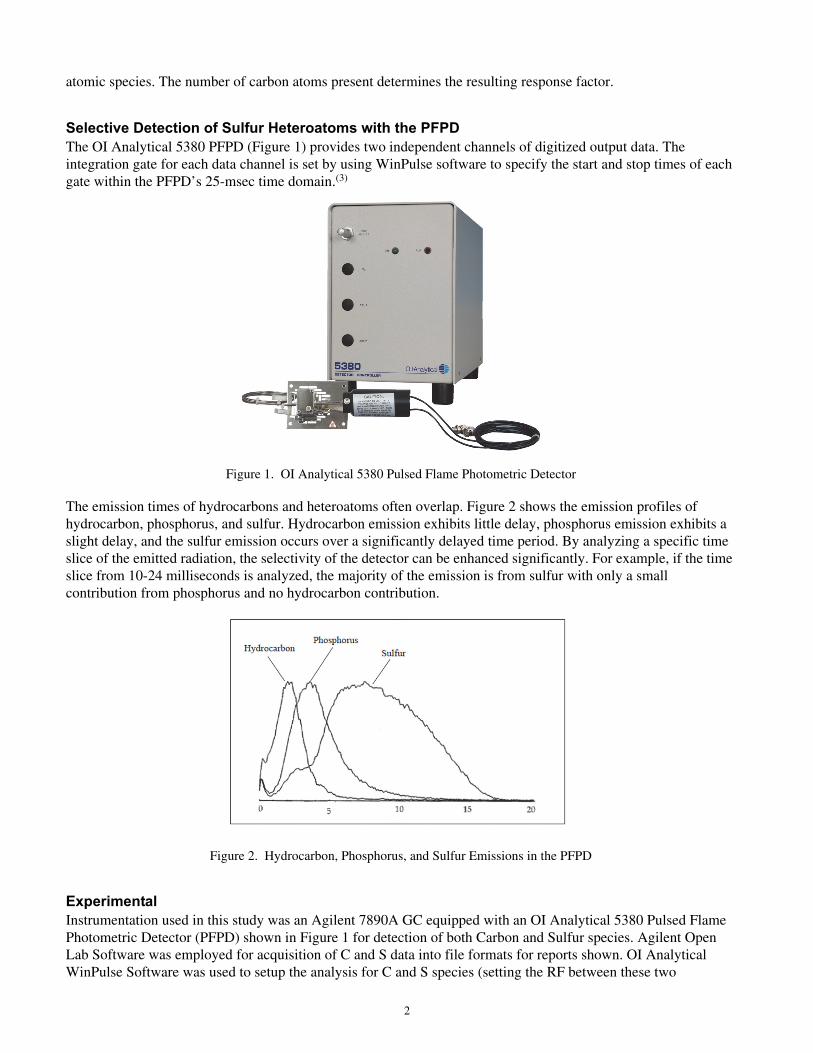
Selective Detection of Sulfur Heteroatoms with the PFPDThe OI Analytical 5380 PFPD (Figure 1) provides two independent channels of digitized output data. The integration gate for each data channel is set by using WinPulse software to specify the start and stop times of each gate within the PFPD’s 25-msec time domain.(3)
Figure 1. OI Analytical 5380 Pulsed Flame Photometric Detector
The emission times of hydrocarbons and heteroatoms often overlap. Figure 2 shows the emission profiles of hydrocarbon, phosphorus, and sulfur. Hydrocarbon emission exhibits little delay, phosphorus emission exhibits a slight delay, and the sulfur emission occurs over a significantly delayed time period. By analyzing a specific time slice of the emitted radiation, the selectivity of the detector can be enhanced significantly. For example, if the time slice from 10-24 milliseconds is analyzed, the majority of the emission is from sulfur with only a small contribution from phosphorus and no hydrocarbon contribution.
Figure 2. Hydrocarbon, Phosphorus, and Sulfur Emissions in the PFPD
ExperimentalInstrumentation used in this study was an Agilent 7890A GC equipped with an OI Analytical 5380 Pulsed Flame Photometric Detector (PFPD) shown in Figure 1 for detection of both Carbon and Sulfur species. Agilent Open Lab Software was employed for acquisition of C and S data into file formats for reports shown. OI Analytical WinPulse Software was used to setup the analysis for C and S species (setting the RF between these two
2
compounds types allowed display of widely different concentrations on the same output result). WinView 32 software was used to check each peak for the emission timing and characterize it as C and S with the filter and setup used. Details of instrument configuration and operating conditions for PFPD analyses are shown in Table 1. A 3 mm I.D. combustor was used because it quickens the S fluorescence time and provides the highest intensity at 6-16 ms.
Two different samples of neat spearmint oil were tested. The identity of sulfur compounds in the sample was not known, only suspected.
Table 1. Instrument Operating Conditions Used for PFPD Analyses of Spearmint Oil
Results and DiscussionThe peaks were very large and saturated the detector with a 1µL injection and 200:1 split ratio. A 0.1µL injection 70:1 split ratio was found to give good low level results without saturating the C element trace. WinView 32 software was used to compare the PFPD C element trace to the FID HC trace.
Figure 3. PFPD C and S Element Traces of a Spearmint Oil Sample
The C element trace is shown in gray and sulfur trace underneath it in black arranged on the same X time scale in Figure 3. Is there sulfur in this sample? The short answer is most probably, yes, from this first glance data. More complete peak analysis is required to be certain.
Gas Chromatograph Agilent 7890AColumn DBWAX 30m x 0.25mm ID x 0.5µmCarrier Gas HeliumInjection Manual 0.2 µL using 5 µL syringe, split 70:1
Oven Program
Initial Temp 40 °C hold 3 minutesRamp 40 to 100 at 5 °C/min hold zeroRamp 100 to 150 at 10 °C / min hold zeroRamp 150 to 220 at 25 °C / min hold 5 minutes
Carbon Detector Attn 256; Zero 11500Sulfur Detector Attn 4; Zero 14Detector Range 10Combustion Chamber 3 mm I.D.Data Acquisition Open Lab SoftwareEmission Time Analysis WinView 32 Software
3
The carbon channel chromatogram in Figure 4 shows peak separation and the 65 peaks that could be labeled with retention times using Open Lab software.
Figure 4. PFPD Carbon Channel Chromatogram of Spearmint Oil from Open Lab Showing 65 Peaks with Labeled Retention Times
4
The %area report in Figure 5 shows the PFPD chromatographic response factors for major HC peaks expected for spearmint oil. The ratios in the rectangles matched well with expected C percentages from the FID chromatogram, as well as the total response.
Figure 5. Percent Area Report of PFPD C Element Response Factors for a Spearmint Oil Sample
5
The PFPD found nine S element peaks in this run. The PFPD sulfur channel chromatogram showing the retention times of peaks registered as sulfur compounds is shown in Figure 6.
Figure 6. PFPD Sulfur Channel Chromatogram of Spearmint Oil
The next step was to confirm these peaks were not hydrocarbon or phosphorus compounds. Figure 7 shows a sulfur-specific PFPD chromatogram obtained using OpenLab software.
Figure 7. Sulfur-specific PFPD Chromatogram Obtained from OpenLab Software
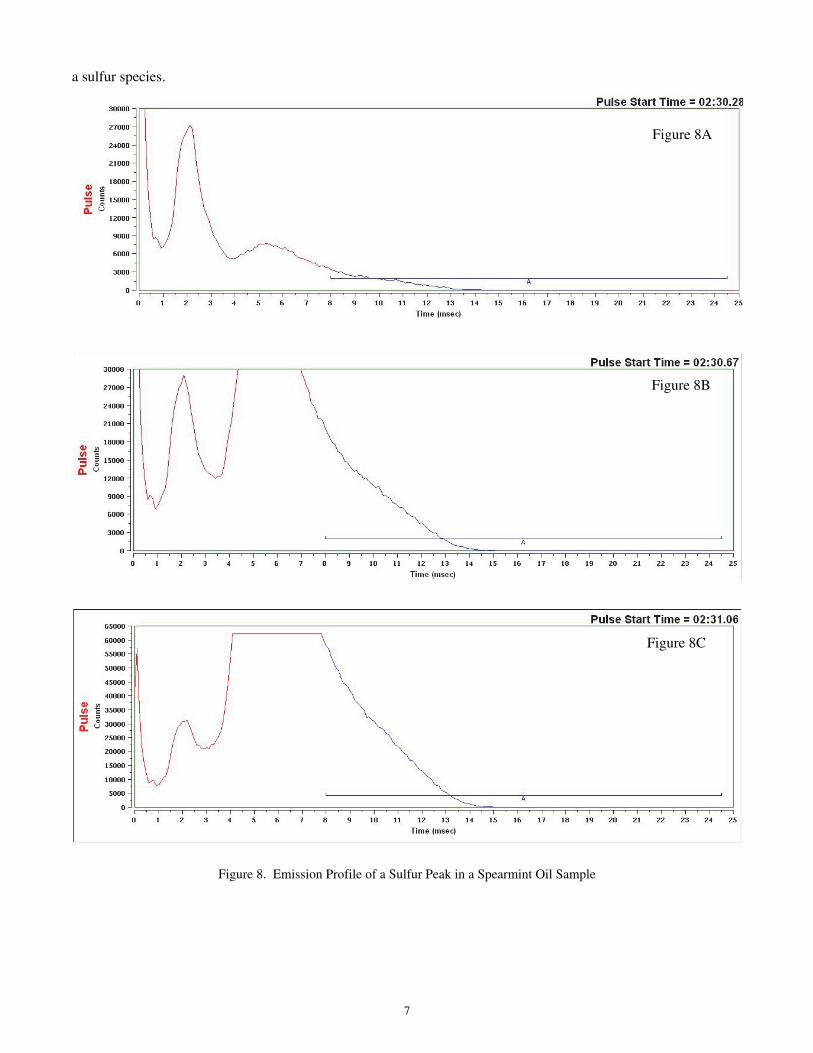
Figure 8 shows the WinPulse response to a sulfur containing species. This sequence provides an example of how emission times can be used to determine and confirm the validity of a sulfur peak. This sulfur peak begins with a rise at 6ms, then rises sharply without changing the C peak height and widening in the sulfur range out to 16ms (Figure 8 A, B, C). This peak extends past the phosphorus range and does not change the C height confirming it is
6
a sulfur species.
Figure 8. Emission Profile of a Sulfur Peak in a Spearmint Oil Sample
Figure 8A
Figure 8B
Figure 8C
7
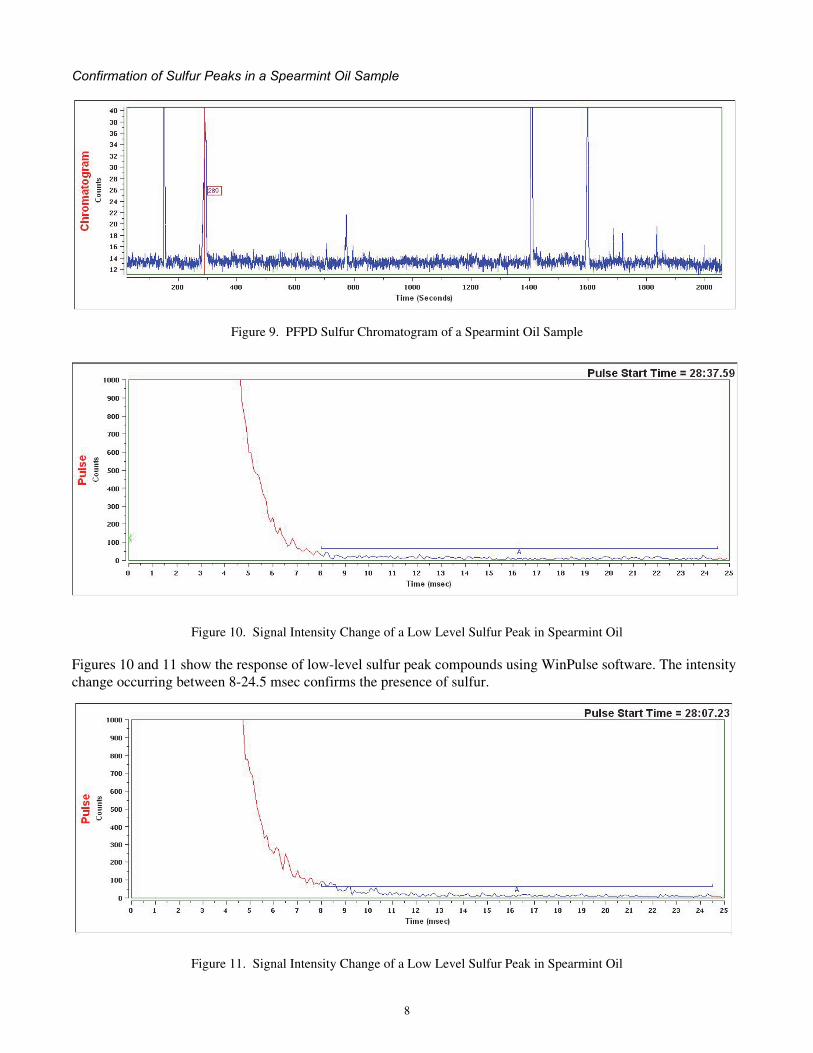
Confirmation of Sulfur Peaks in a Spearmint Oil Sample
Figure 9. PFPD Sulfur Chromatogram of a Spearmint Oil Sample
Figure 10. Signal Intensity Change of a Low Level Sulfur Peak in Spearmint Oil
Figures 10 and 11 show the response of low-level sulfur peak compounds using WinPulse software. The intensity change occurring between 8-24.5 msec confirms the presence of sulfur.
Figure 11. Signal Intensity Change of a Low Level Sulfur Peak in Spearmint Oil
8
An intensity increase at 8+ msec is a characteristic response for low sulfur containing compounds.
Figure 12. Response Factor for Nine Peaks in Sulfur Channel Chromatogram of Spearmint Oil
The sulfur channel chromatograms contain nine peaks at retention times reported in Figure 12. There were five confirmed sulfur peaks in this spearmint oil sample.
1. Peak at 2.57 is a high RF sulfur peak with 63246 height counts. This peak contains multiple sulfurs.
2. Peak at 23.49 is also a high RF sulfur peak. 63189.2 height counts. This peak contains multiple sulfurs and has a very high area% of sulfur (over 55% of the total) and 5000:1 signal to noise ratio.
3. Peak at 28.15 is a low RF sulfur peak. The low intensity indicates the peak contains one or two sulfurs.
4. Peak at 28.69 is a low RF sulfur peak. The RF indicates the peak contains only one or two sulfurs and a signal to noise ratio of 10:1.
5. Peak at 30.63 is a low RF sulfur peak. It appears to contain only one or two sulfurs.
Summary and ConclusionsThe results of this study demonstrate that low-level sulfur compounds can be detected in spearmint oil using a PFPD detector, dual integration time gates, and comparative carbon peak matching with FID chromatograms. The PFPD C trace matched the FID HC trace for major peaks that have the same number of C atoms as HC bonds.
Five confirmed sulfur peaks were found in each of the spearmint oil samples. The percent total sulfur of the smallest peak that could be detected and confirmed was .00206%.
Response differences between the sulfur peaks show a linear dynamic range of 3+ for S elements. The lowest response for sulfur in the spearmint oil sample was the 28.69 RT peak with a 263.8 height and 10:1 signal to noise ratio.
9
Publication 40030214
References1. Productivity, Oil Content, and Composition of Two Spearmint Species in Mississippi, V. D. Zheljazkov, C.L.
Cantrell, T. Astatkie, and M.W. Ebelhar, Agronomy Journal, Vol. 102, Issue 1, 2010.
2. Mint Industry Research Council, www.usmintindustry.org.
3. OI Analytical Application Note #1127, Using Dual Gate Subtraction to Enhance the Selectivity of a Pulsed Flame Photometric Detector.