Determinants of farm households’ willingness to accept (WTA) compensation for conservation technologies in Northern Ghana Article Published Version Creative Commons: Attribution 4.0 (CC-BY) Open Access Ahiale, E. D., Balcombe, K. and Srinivasan, C. (2020) Determinants of farm households’ willingness to accept (WTA) compensation for conservation technologies in Northern Ghana. Bio-based and Applied Economics, 8 (2). pp. 211-234. ISSN 2280-6172 doi: https://doi.org/10.13128/bae-8931 Available at http://centaur.reading.ac.uk/91256/ It is advisable to refer to the publisher’s version if you intend to cite from the work. See Guidance on citing . Identification Number/DOI: https://doi.org/10.13128/bae-8931 <https://doi.org/10.13128/bae-8931> Publisher: Firenze University Press
Transcript
Determinants of farm households’ willingness to accept (WTA) compensation for conservation technologies in Northern Ghana
Article
Published Version
Creative Commons: Attribution 4.0 (CC-BY)
Open Access
Ahiale, E. D., Balcombe, K. and Srinivasan, C. (2020) Determinants of farm households’ willingness to accept (WTA) compensation for conservation technologies in Northern Ghana. Bio-based and Applied Economics, 8 (2). pp. 211-234. ISSN 2280-6172 doi: https://doi.org/10.13128/bae-8931 Available at http://centaur.reading.ac.uk/91256/
It is advisable to refer to the publisher’s version if you intend to cite from the work. See Guidance on citing .
All outputs in CentAUR are protected by Intellectual Property Rights law, including copyright law. Copyright and IPR is retained by the creators or other copyright holders. Terms and conditions for use of this material are defined in the End User Agreement .
1 Department of Agricultural Economics and Extension Education, University of Education, Winneba, Ghana2 School of Agriculture, Policy and Development, University of Reading, UK
Abstract. This paper examines the determinants of farmers’ willingness-to-accept (WTA) in a hypothetical payment scheme for the adoption of stone and soil bunds in northern Ghana using contingent valuation data from 305 farm households. Bayesian estimation of the interval-data regression model is employed to obtain farmers’ WTA and its determinants. Besides farmer and household characteristics, farm characteris-tics and socioeconomic and institutional variables such as soil fertility and previous participation in conservation projects increase and decrease willingness-to-accept respectively. The results suggest that costs of soil and water conservation payment schemes may be significantly decreased by careful targeting of households more ready to accept compensation.
Land degradation is one of the world’s environmental concerns today. It can be regarded as a process that includes soil degradation and erosion. The main processes that lead to land degradation are soil erosion by water and wind; chemical changes such as acidification, salinization, and nutrient loss; and physical degradation through pressures such as compaction (Eswaran et al., 2001; UNCCD, 2013). There is no consensus on the exact extent and severity of land degradation in the African region, there is however con-sensus that it is severe and widespread. Analyses of global land degradation indicate that Africa is especially susceptible to land degradation and is the most severely affected part of the world (Lal, 1995; Obalum et al., 2012). An estimate of two-thirds of Africa’s pro-ductive land is affected by land degradation and almost all the land area is susceptible to
soil and environmental degradation (FAO, 2011; Jones et al., 2013; UNCCD, 2013; Vlek et al., 2008). In sub-Saharan Africa (SSA), in excess of 320 million hectares of land have been made unsuitable for agricultural purposes due to soil erosion, deforestation, over-grazing and mismanagement of land resources (Sant, 2001). Nabhan (1997) also reports that 67% of agricultural lands are affected by land degradation, with close to 490 million hectares displaying signs of erosion and declining fertility.
The issue of land degradation is of immense importance in Africa as majority of its population’s livelihood is heavily reliant on natural resources. Agricultural productivity in the region is stagnating or declining, largely due to land degradation. Land degradation in Africa has thus been immensely detrimental to agricultural ecosystems and crop pro-duction consequently leading to increasing levels of food insecurity, loss of farm incomes, poverty, high mortality rates, other social vulnerabilities, migration and conflict (Gomiero, 2016; Hamdy & Aly, 2014; Hemant & Padmini, 2013; UNCCD, 2013). Land degradation thus has socioeconomic implications for African countries.
Soil and land degradation in Ghana was recognized decades ago, as since the 1930s, it has attracted considerable attention and concern (Agyepong, 1987; Benneh & Agyepong, 1990). Land degradation is affecting all parts of Ghana, however, the northern regions placed within the Guinea and Sudan Savannahs are the most vulnerable zones and the most degraded area of the country (Asiedu et al., 2016; World Bank, 2006). Ghana had 35% of its land threatened by desertification particularly in the northern regions (Upper East, Upper West and Northern Regions) since the 1960s (Adanu et al., 2013; Kenwor-thy, 1995). Land degradation in the northern regions of Ghana has thus rendered large tracts of croplands which were once fertile currently unproductive as such contributing to depleting farm income and food sources. As a result of land degradation, grasslands, woodlands and forests are being lost while natural water bodies are drying up due to prolonged droughts and deposition of sediments into water courses (Adanu et al., 2013). Land degradation in Ghana, which is mainly as a result of soil erosion and soil nutri-ent depletion, has negative impact on farm productivity and environmental quality. The human-associated drivers of long-term soil and vegetation degradation in Ghana include unsustainable farming practices, removal of vegetation cover (including deforestation and overgrazing), mining activities, and urbanization and industrial activities caused by increased population growth pressures.
Agriculture remains an important sector in the Ghanaian economy contribut-ing about 22% to the country’s gross domestic product (GDP) and providing 44.7% of employment in 2013 (Aryeetey & Baah-Boateng, 2015). Agriculture also remains the main source of livelihood for many subsistence smallholder farmers living in rural Gha-na. The agricultural activities of these smallholders is cited to be a key factor in promot-ing land degradation through the use of environmentally unsustainable cultural practices (Asiedu-Amoako et al., 2016; Boardman et al., 2003; Diao & Sarpong, 2007; Helming et al., 2006; Senayah et al., 1998). As agriculture is the major user of rural land, its rele-vance is not only in relation to its economic significance, but also its influence over the use of land in rural Ghana and its environmental health in general. With the relationship between land degradation, agricultural productivity and poverty well understood (Das-gupta & Mäler, 1995; Gomiero, 2016; Hamdy & Aly, 2014; Heath & Binswanger, 1996; Hemant & Padmini, 2013; Shetty et al., 1995; World Bank, 1992), it is clear that land
213Determinants of Farm Households’ Willingness to Accept Compensation in Northern Ghana
degradation is a threat not only to national and household food security but the overall welfare of many households in Ghana.
In order to maintain agricultural productivity, reduce food insecurity and poverty, and improve environmental conditions, the Government of Ghana (GoG), international donor agencies and Non-Governmental Organizations (NGOs) have promoted soil and water conservation practices and technologies including soil and stone bunds. This has been done for several decades particularly in the Northern, Upper-East and Upper-West regions because they collectively constitute the most degraded part of the country.
Adoption of the promoted technologies has arguably been unsuccessful due among others to weak regulatory institutions which have restricted the ‘command and control’ interventions (Wunder, 2008). Farmers’ inability to adopt soil and water conservation measures is mainly as a result of constraints resulting from market failures which lead to externalities like degradation. When externalities are present, government interven-tion has the potential to internalise these externalities. One potential intervention is Pay-ment for Environmental Services (PES) in which incentive payments are made to resource managers in return for the adoption of conservation practices/technologies. Such external financial incentives may be crucial in ensuring that socially desirable levels of environ-mental services/goods (ES) are supplied and maintained since poor smallholder farmers may not be able to afford to maintain healthy environmental quality especially when large opportunity costs occur when conservation technologies/practices are adopted.
Soil and water conservation technologies (e.g., soil and stone bund) are technologies that preserve the integrity of soils and their water content, and they offer a number of on-farm and off-farm ecosystem services of value to society as well as on-farm productiv-ity improvements. Stone and soil bunds are stone or soil walls built across a slope (along a contour) to act as a barrier to prevent run-off, therefore helping in reducing soil ero-sion and increasing water retention capacity of soil. They are often appropriate for gen-tle slopes (2-5%) (Diao & Sarpong, 2007). Ecosystem services from stone and soil bunds include: substantial flood and erosion control, substantial reduction in sedimentation of water bodies and its consequent improvement in water quality and aquatic life; reduction in leaching and deposition of fertilizers, herbicides and pesticides, i.e. generally improved landscape quality, etc. (Bingham et al., 1995; Holland, 2004; Webb et al., 2001). The adop-tion of soil and water conservation (SWC) technologies is aimed at returning a landscape to a condition where it can again provide the ES enumerated above after a period of deg-radation. Farmers can therefore be paid/compensated for the adoption of such technolo-gies as soil and stone bund per unit area to produce the socially beneficial ES mentioned. Payments can be in the form of money, in kind, and access to resources and markets.
In order to know the optimum rate of public investment, the required level of com-pensation (WTA) necessary for encouraging agricultural households to adopt a conserva-tion technology which produces ES must be ascertained. In addition, knowledge of the factors determining WTA also informs policy implementation by enabling the direction of payments towards those that are the most predisposed towards adopting the proposed technologies.
The current study therefore uses the contingent valuation (CV) method to estimate farmers’ WTA for adopting stone and soil bunds in a hypothetical conservation plan/valuation scenario context. The method of elicitation within the CV employed allows
for uncertain responses so as to maximise respondent’s engagement with the survey. It employs an interval regression model to estimate WTA and determines the factors influ-encing their WTA, having adapted this model to allow for uncertain responses.
Extensive literature exists on PES as an alternative intervention for environmental conservation. However, much of this has focused on parts of the world other than Africa leading to a dearth of knowledge on environmental values and the main factors influenc-ing WTA for PES conservation practice/technologies for Africa and specifically for PES schemes in Ghana. This study fills this gap by building on previous studies, with a specific aim to determine the manner in which various factors influence WTA compensation for stone and soil bunds in northern Ghana. The manner in which various factors influence WTA for conservation technologies may be location and conservation practice specific. This study therefore serves to analyse these factors, so they can be understood in a way that enables better designed interventions and decision-making in Ghana.
The paper proceeds by first reviewing literature on valuation of the welfare impact of adoption of soil and stone bunds and the factors that influence farmers’ preferences for or WTA for conservation practices in Section 2. The interval data regression model speci-fication and estimation is presented in Section 3 while Section 4 discusses the field sur-vey, data and variables. The results are presented in Section 5 and Section 6 discusses the results. The conclusions and policy implications is given in Section 7.
2. Literature review
2.1 Valuation of the welfare impact of adoption of soil and stone bunds
The contribution of a resource to human welfare forms the basis of the economic approach to the valuation of resources. An economic value is measured by the variations in welfare related to the variation in the quantity or quality of goods or services. Varia-tions in environmental service flows can influence the welfare of individuals in complex ways and through both marketed or non-marketed activities (Shiferaw et al., 2005). Inter-ventions like adoption of soil and stone bund by farm households that lead, for example, to reduction in soil erosion apparently change the welfare of different members of the society. Welfare economics suggests that welfare values or changes are determined by indi-vidual preferences and measured by their personal assessment of changes in well-being (Bockstael et al., 2000) or the extent to which they are willing to make trade-offs between scarce resources to obtain or preserve something.
Investments in soil and stone bund provide multiple economic and environmental ben-efits to different groups of people beside the adopting smallholder farm households. An impact evaluation of the interventions should therefore take into account any non-mar-keted ecosystem goods and services along with marketed economic benefits (Baker, 2000; Shiferaw et al., 2005). The welfare gains from investments in soil and stone bund include the direct economic benefits (e.g., yield gains) and environmental benefits (e.g., sustain-ability benefits and ecosystem services) that have both use and non-use values to people. Indirect welfare benefits obtained from environmental improvements are justifiable compo-nents of the welfare changes related to any conservation interventions, and must be meas-ured in impact evaluation (Shiferaw et al., 2005). Total welfare benefit to people, therefore,
215Determinants of Farm Households’ Willingness to Accept Compensation in Northern Ghana
is the sum of the direct economic and indirect environmental benefits. Hence, the benefits accruing to soil and stone bund can be assessed as those captured privately by the farm household, which include the value of yield loss averted and/or yield gains which may be felt on-site by the farm household, and those external to the farm household that are cap-tured publicly, whose value include the improvement in ecosystem services.
The valuation of changes in ecosystem services as a result of the adoption of soil and stone bund by farmers “needs to take into account both intended and unintended out-comes as different individuals may attach values for such changes because of the use ben-efits they derived, or any expected or conceived non-use welfare benefits” (Shiferaw et al., 2005). The concept of total economic value (TEV), the usual and most appropriate frame-work for aggregating the value of non-market ecosystem goods and services and meas-uring welfare changes is a vital part of economic valuation (Pearce, 2002; Philcox, 2007). Economic values reflect the services of an ecosystem and not the economic value of that ecosystem (Nijnik & Miller, 2017).
The potential welfare changes or impacts as a result of soil and stone bund on groups of individuals differ, i.e., the farm household’s welfare change is different from the welfare impact on the consumers of the ecosystem services accruing from soil and stone bund. Assessing the economic value of soil and stone bund can thus be done in two ways. First, the measurement “of how much better or worse-off a person is due to the variation in the quantity or quality of the service flow” and second, “the addition of the individual wel-fare variation (gains and losses or WTP/WTA) to assess the value of this variation for the entire society (Shiferaw et al., 2005). The former is the focus of the current paper.
Total welfare gains include the direct economic benefits (e.g., yield gains) and indirect environmental benefits (e.g., ecosystem services) that have both use and non-use values to people (Shiferaw et al., 2005). The benefits accruing to the adoption of soil and stone bunds can be assessed as those captured privately by the farm household, which include the value of yield loss averted and/or yield gains which may be felt on-farm by the farm household, and those external to the farm household (off-farm) that are captured publicly, whose value include improvement in ecosystem services. Direct use values comprise con-sumptive uses including the potential yield increase that may be associated with the adop-tion of the conservation technology and indirect use value is improvement in landscape quality. The non-use value of soil and stone bund includes improved and preservation of aquatic life, erosion control, and the reduction of the deposition of soil and agricultural chemicals into water bodies. For this study, the WTP or WTA indicates how the adoption of stone and soil bund impact on the welfare of participating farm households.
The benefits accruing to farmers by adopting soil and stone bunds are often below the total benefits created once public good values have been accounted for, leading to below optimal levels of resource supply. In the presence of high public good values, incen-tive payments for resource conservation may be necessary. There is dissimilarity between the average gross margin of adoption and non-adoption of conservation technologies/practices that result in conservation opportunity costs for farmers (Krishna et al., 2013). The opportunity costs for farmers adopting soil and stone bunds include: loss of valua-ble cropping land to bunds (Ludi, 1997; Wyatt, 2002) which for farmers is an important issue when land is scarce and which imposes revenue loss to farmers; additional labour requirements of household for construction and annual maintenance (Shiferaw & Holden,
2001; Stocking & Abel, 1989). PES schemes should pay for the farmers’ opportunity costs. The stated preference (SP) of farm households’ stated WTA compensation for adopting soil and stone bunds can be employed as an appropriate measure of the opportunity cost of adopting such technologies. The minimum compensation needed to motivate a farm household to accept a PES contract involving the construction of soil or stone bunds on a unit area of land is presumed to indicate the farmer’s real opportunity cost per unit area of soil or stone bunds adoption.
2.2 Factors determining farmers’ willingness to accept/preferences for conservation practices/technologies
The factors influencing preferences and WTA compensation for conservation prac-tices and technologies have generally been categorised into: farm characteristics; farmer and household characteristics; socioeconomic; and, institutional factors by previous stud-ies (see, e.g., Ayuba et al., 2011; Cooper & Keim, 1996; Matta et al., 2009; Minten, 2003).
Key farmer and household characteristics have generally been thought to include gender, age, level of education of household head, own labour, labour sufficiency of the household, and wealth status of the household. For example, Thurston (2006) observes that females have higher WTA than males in valuing environmental conservation. Ste-phen (2015) and Wang et al. (2019) also estimate higher WTA for females relative to males. Sangkapitux et al. (2009), PRESA/ICRAF (2010), Minten (2003), Stephen (2015), and Wang et al. (2019) all find a positive relationship between age and WTA compen-sation. However, this relationship is found to be significant by Sangkapitux et al. (2009), Minten (2003), Stephen (2015), and Wang et al. (2019) and insignificant by PRESA/ICRAF (2010). Feng et al. (2018) however observe a negative effect of age on WTA. Edu-cation has usually been found to have a positive influence on WTA for conservation/sup-ply of environmental services (Ninan et al., 2007; Wang et al., 2018; Wang et al., 2019; Xu et al., 2015). Minten (2003) explains that more educated households, who have a higher reservation wage, prefer to put more effort in off-farm earnings and hence, prefer to prac-tice agriculture in a more extensive manner. In contrast, Xiong and Kong (2017) and Yu and Cai (2015) observe a negative influence of education on WTA. Household size has been used as an index of the farm household’s access to labour in most studies. PRESA/ICRAF (2010) find a significant negative effect of household size on WTA compensation for watershed services whilst Minten (2003) observes an insignificant positive influence of household size on WTA to give up slash and burn agriculture (‘tavy) and an insignificant negative effect of household size on WTA to give up forest use in Madagascar. Stephen (2015), Xiong and Kong (2017), and Wang et al. (2019) all find a significant positive effect of household size on WTA. Sangkapitux et al. (2009) observe that poorer farmers have a higher willingness to engage in a compensation scheme for providing better ecologi-cal services, probably indicating a lower WTA for the supply of environmental services. Farmers who rely on income from farm and aquatic products have higher WTA (Stephen, 2015; Xiong & Kong, 2017).
Key farm characteristics include total farm size, level/severity of erosion on farm/plot, level of soil fertility of farm/plot, slope of plot, and location/region. Sukic (2001), Xiong and Kong (2017) and Wang et al. (2019) find statistically significant positive impact of
217Determinants of Farm Households’ Willingness to Accept Compensation in Northern Ghana
land size on WTA compensation for conservation practices whilst PRESA/ICRAF (2010) discovers an insignificant influence. Previous findings suggest that the higher the level of erosion and the lower the soil fertility, the higher the willingness to participate in a pay-ment scheme (Sangkapitux et al., 2009). This in turn suggests that farmers with severe farm erosion and low soil fertility are likely to demand less compensation for conservation practices than those with less severe erosion on their fields and more fertile soils. Farm location heavily influences WTA (Minten, 2003; Stephen, 2015; Xiong & Kong, 2017; Yu & Cai, 2015). Minten (2003) reports that households with more lowland (which are more flat) are willing to accept less for compensation, though the estimates are statistically insignificant. By contrast farming in highlands (likely to be steeper) is a significant deter-minant of WTA compensation.
Monthly income, adoption status, and previous participation of the household in a con-servation programme/project are institutional and socio-economic factors that have been associated with WTA compensation. A positive relationship between income and WTA is observed by PRESA/ICRAF (2010) and Sukic (2001), though the effect is statistically sig-nificant and insignificant respectively. Xu et al. (2015), Yu and Cai (2015), and Wang et al. (2018) find the opposite, that is a negative influence of household income on WTA.
For non-market valuation, respondents may be unable to give their true preferenc-es because they have had little prior experience with the item in question and so have trouble establishing their minimum WTA during a single survey (Cummings et al., 1986). Household knowledge of the good being valued can be proxied by identifying households who have previously adopted the conservation practice of interest or taken part in wider conservation programmes or projects. The literature is, however, silent on the direction of influence on WTA of households’ prior adoption of a practice/technology and participa-tion in previous conservation projects. However, various studies have found farmers’ envi-ronmental awareness and knowledge affect WTA positively (Feng et al., 2018; Wang et al., 2018; Xu et al., 2015; Yu & Cai, 2015).
3. Estimation methodology
CV studies require questions as to whether respondents are prepared to pay or accept specified monetary amounts in the light of changes that will impact upon them (e.g. the adoption of a technology). Valuation studies often assume that respondents know their preferences with certainty, i.e. they know how much they would be willing to accept for ES provision. However, empirical evidence in the SP literature indicates that respondents are uncertain about their responses (Akter & Bennett, 2013; Akter et al., 2008; Alberini et al., 2003; Champ et al., 1997; Ready et al., 1995). This is mainly because respondents use a heuristic mode while processing information provided in any of several CV formats which tends to dominate over more systematic ways of information processing for decision-making (Bateman et al., 2004). Unsurprisingly, the CV literature has spawned multiple forms of elicitation which are aimed at minimising or mitigating biases. One factor that leads to potential bias is that respondents may not know or be able to state with certainty their underlying preferences and forcing them to do so can induce bias (Akter & Bennett, 2013; Ariely et al., 2003; Poe, 2016; Ready et al., 2010). Uncertainty is an important aspect of many public goods, especially environmental goods (Mitchell & Carson, 1989) such
as produced by SWC technologies like stone and soil bunds. Preference uncertainty is a stochastic error term which comes about in hypothetical valuation scenarios as individu-als do not know their true values of a good with certainty (Li & Mattsson, 1995). In the current study, the LB and UB are obtained based on the expansion approach of Broberg and Brännlund (2008), which takes uncertainty into consideration. This method can be termed the ‘multiple-bounded uncertainty choice’ (MBUC) approach. It has been argued that this approach is more intuitive, better fits the data, estimates mean and median WTP with better precision, is less sensitive to distributional assumptions, and it is better suited for policy analysis than other approaches (Broberg & Brännlund, 2008). The elicitation method employed here (and outlined in Section 4) is to give respondents a ‘payment card’ (a series of possible ranges) but allowing them to indicate whether they would pay for that amount with certainty or with some level of uncertainty. However, this approach also requires an adaptation to the standard methods used to model WTA/WTP.
A standard model for dealing with the case where the dependent variable is only known within a range is the interval data model (Stewart, 1983). Hanemann et al. (1991) observed that the interval-data model improves the statistical efficiency of WTP estimates by reducing the variance and point estimates of WTP models relative to single-bound models. Alberini (1995) explored the efficiency and biases of the estimates obtained from the bivariate probit and interval-data models and observed robust estimates for mean/median WTP and concludes that in the absence of perfect correlation as is the case in many CV studies, the interval-data model might be appropriate. However, the interval-data model assumes that answers provided by respondents reflect WTP/WTA which are known with certainty (Alberini, 1995). However, as discussed above, the elicitation approach outlined in Section 4 is more general in that it allows for uncertain responses. Because MBUC responses do not translate directly into the statistical models convention-ally employed to model stated-preference responses, assumptions about the interpreta-tion of the responses by the researcher are necessary. The literature provides a number of empirical ways to convert MBUC CV data to easily estimable forms. Intervals are obtained by assigning, LB<yi
*<UB given the responses, where LB and UB are the lower and upper bounds respectively.
The notation used in this section are adapted from Balcombe et al. (2009). If utility is unobserved and indicated by the latent variable yi
*, and WTAi is the WTA of the th indi-vidual, then the utility can be expressed as:
WTAi= yi*=β'xi+εi εi ~ N(0,h) (1)
where xi is a vector of explanatory variables determining respondents’ WTA, β' is the parameter vector related to xi and εi is the error term assumed to be normally distributed with zero mean and variance h.
Consequently for WTA, the highest “definitely no” and lowest “definitely yes” respons-es form the LB and UB respectively. Uncertainties are accommodated in the model result-ing in the uncertainty interval model which is employed in this study. The rule used to create the WTA interval for the th individual is a function of his responses with the LB and UB constructed based on the following assumptions:1. A ‘Y’: bid forms WTAupper
219Determinants of Farm Households’ Willingness to Accept Compensation in Northern Ghana
2. A ‘N’: bid forms WTAlower3. A ‘PY’: bid forms WTAupper, with a fixed probability, τ4. A ‘PN’: bid forms WTAlower, with a fixed probability, τwhere τ, a probability value of truncation, is between 0 and 1 and set by the authors at 0.75; Y is definitely yes, PY is probably yes, DK is don’t know, PN is probably no, and N is definitely no.
The latent variable yi* therefore has the clear interpretation of a person’s WTA, and
equation (1) would give a direct estimate of the mean WTA.For a Bayesian estimation and inference, priors for the β and h parameters are speci-
fied normal N(.,.) and inverse gamma IG(.,.) respectively:
(2)
The likelihood of the latent variable y* is
(3)
The posterior distribution is obtained by combining equations (2) and (3). The poste-rior distribution of model (1) is simulated using the Gibbs sampler (see for example Koop, 2003).
Two models were estimated using the model above. The first one contains an estimate of the WTA which can be interpreted as describing the unconditional distribution of the WTA in the population (Verbeek, 2004). The second model includes the explanatory vari-ables shown in Table 2 below.
The models were estimated using Markov Chain Monte Carlo (MCMC), setting the burn-in phase to 2000 iterations which is followed by another 200,000 iterations in which every 20th observation was sampled in order to lessen the dependence in the sequence, resulting eventually in 10,000 observations for analysis. Convergence diagnosis was done using visual plots of the sequences of values produced by the sampler and by modified t-tests for the hypothesis of ‘no-difference’ between the first and second halves of the sam-pled values for each of the parameters. Observations without either an upper or lower bound were not included in the analysis; hence none of the models was estimated with the total of 350 observations.1
4. Field survey, data and variables
In a hypothetical conservation plan context, data were collected from 305 house-holds in the three northern regions of Ghana through a survey conducted from January – March, 2010. The questionnaire used included a description of the technologies with pictures as well as pictures of the possible environmental consequences (i.e., landscape quality improvement/maintenance) of the technologies. A multi-stage sampling approach was adopted in which a district was first selected from each region. From a purposively
1 Gauss code for estimation of the models written by Kelvin Balcombe.
selected group of communities in each district where physical evidence of the SWC struc-tures of interest to the research are present, ten communities from two of the districts and five from the remaining district were then randomly chosen.2 Finally, ten or five respond-ents were randomly selected from the 25 communities.
For the estimation of WTA, a CV of four polychotomous-choice multiple-bounded elicitation format with variations of yes/no answers to indicate respondent uncertainty (FAO, 2000; Mitchell & Carson, 1989). The dichotomous choice format with follow-up questions reasonably mimics the bargaining process common in developing countries (FAO, 2000) and hence familiar to respondents.
The CV consisted of a question format of eight bid amounts ranging from a mini-mum of GH¢200 to a maximum of GH¢600 for each of the technologies of interest, namely, stone bund and soil bund.3 These amounts were obtained from focus groups ses-sions and discussions with experts. Face-to-face interviews with respondents were con-ducted during the CV survey. Table 1 shows an example of a CV question format and how it should be answered and Table 2 presents a description of variables.
5. Results
5.1 Description of respondents
Descriptive and summary statistics of selected socio-economic and demographic characteristics of respondents, physical characteristics of farm/fields, and institution-al characteristics are presented in Table 3. Out of the total of 305 survey respondents, approximately 78% are males. The dominance of male-headed households in the survey
2 Physical evidence is important because for stated preference studies, knowledge and familiarity of the good being valued is useful. 3 The average exchange rate in 2009 was GH¢2.2024 and GH¢1.4132 to GB £1 and US$1 respectively (BoG, 2010: p.51).
Table 1. An example of an answered CV question.
Example: Which of the values would you be willing to accept for constructing STONE BUNDS on an acre of your own field? Please tick only one option for each value.
Amount in Cedis/acre Definitely No Probably No Don’t Know Probably Yes Definitely Yes
200 √300 √ √350 √400 √450 √500 √550 √600 √
221Determinants of Farm Households’ Willingness to Accept Compensation in Northern Ghana
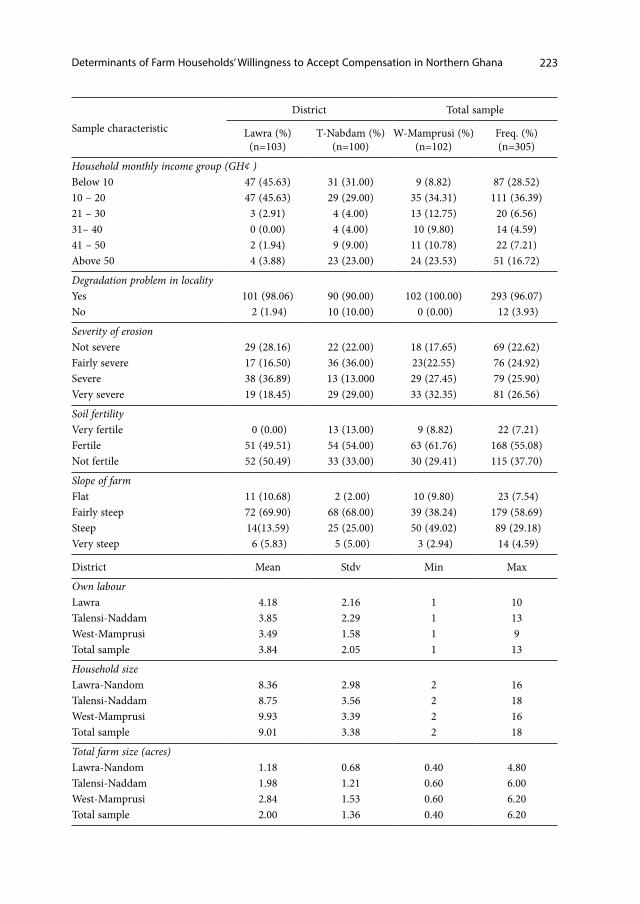
sample conforms to GLSS5 (2008), which reports that the proportion of male-headed households in the rural savannah areas (study area fall within this category) is 85%. The highest proportions of more than 36% of respondents are over 50 years of age, whilst 33% are under 41 years, and about 67% are over 40 years. It can be concluded that households involved in agriculture are headed more by older heads than by young ones. This could be the reason why the adoption of SWC technologies by farm households in the study area is low. Respondents have low levels of education. About 77% and only 15% of respond-ents have had no formal education and primary education respectively. Only 8% of farm household heads have had either secondary or higher level of education. With an aver-age family size of nine (9) persons, households in the study area generally reflect the large household sizes typical of African villages and farm households. On average, 4 persons per household provide on-farm labour. Most households (71%) do not have enough own/household labour to perform farm production activities. This has important implications for the adoption of labour intensive soil and water conservation technologies like stone and soil bunds. This lack of adequate household labour is probably one of the reasons why adoption of these technologies is low in the study area. In terms of land holdings, the study area is generally characterized by small holdings. The average total farm size is 2 hectares, with minimum and maximum values of 0.40 and 6.20 hectares respectively. Only 31% of households have total land sizes greater than the mean value. The small farm sizes
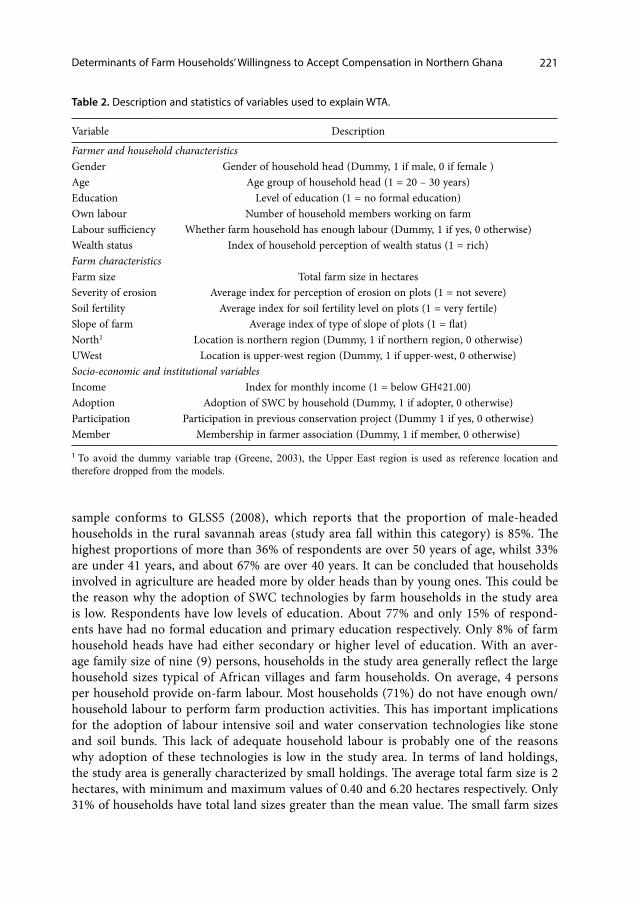
Table 2. Description and statistics of variables used to explain WTA.
Variable Description
Farmer and household characteristicsGender Gender of household head (Dummy, 1 if male, 0 if female ) Age Age group of household head (1 = 20 – 30 years)Education Level of education (1 = no formal education)Own labour Number of household members working on farmLabour sufficiency Whether farm household has enough labour (Dummy, 1 if yes, 0 otherwise)Wealth status Index of household perception of wealth status (1 = rich)Farm characteristicsFarm size Total farm size in hectaresSeverity of erosion Average index for perception of erosion on plots (1 = not severe)Soil fertility Average index for soil fertility level on plots (1 = very fertile)Slope of farm Average index of type of slope of plots (1 = flat)North1 Location is northern region (Dummy, 1 if northern region, 0 otherwise)UWest Location is upper-west region (Dummy, 1 if upper-west, 0 otherwise)Socio-economic and institutional variablesIncome Index for monthly income (1 = below GH¢21.00)Adoption Adoption of SWC by household (Dummy, 1 if adopter, 0 otherwise)Participation Participation in previous conservation project (Dummy 1 if yes, 0 otherwise)Member Membership in farmer association (Dummy, 1 if member, 0 otherwise)
1 To avoid the dummy variable trap (Greene, 2003), the Upper East region is used as reference location and therefore dropped from the models.
may also indicate that households will have low willingness to adopt SWC technologies that take up too much of cropland.
In terms of the adoption of either one or both SWC technologies under consideration, 55% of the responding households are adopters. This distribution provides enough data to make comparisons between adopting and non-adopting households. An adopter house-hold in this study is one that has already adopted any one or both of the technologies
Table 3. Sample descriptive and summary statistics.
under consideration. Almost equal proportions of respondents belong to an organized farmer association/group. An important feature of these associations is labour sharing. A proportion of about 65% of households earn a monthly income (from all sources, both on and off-farm) below GH¢21.00 ($14.87) and are categorised as poor based on the Ghana Living Standard Survey (GLSS5, 2008). However, from the farmers’ own perspective, only 20% of them consider themselves as poor. Ninety-six percent (96%) of respondents think that land degradation is a problem in their area. Most households, 95%, report that ero-sion is a problem on their own farms/fields, whilst about 77% perceive the level of erosion as being fairly severe to very severe. However, only about 38% of respondents view their farms as infertile.
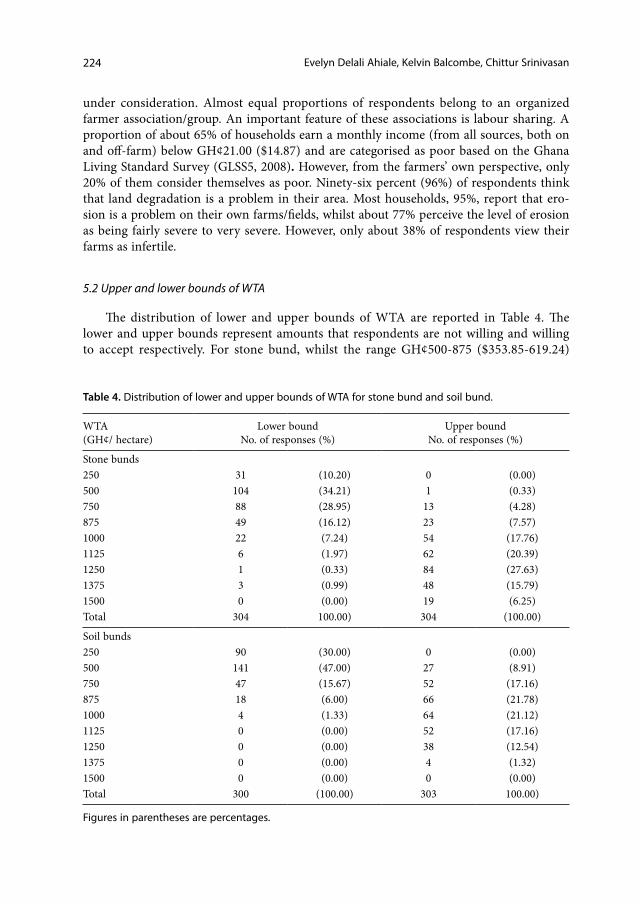
5.2 Upper and lower bounds of WTA
The distribution of lower and upper bounds of WTA are reported in Table 4. The lower and upper bounds represent amounts that respondents are not willing and willing to accept respectively. For stone bund, whilst the range GH¢500-875 ($353.85-619.24)
Table 4. Distribution of lower and upper bounds of WTA for stone bund and soil bund.
225Determinants of Farm Households’ Willingness to Accept Compensation in Northern Ghana
form the most important range in terms of numbers reporting for the lower bound, it is GH¢1000-1375 ($707.71-973.10) for the upper bound.
Amounts ranging from GH¢250-750 ($176.92-530.78) and GH¢750-1250 ($530.78-884.64) form the most important lower and upper ranges respectively for soil bund. The total numbers reporting are different for the two technologies because, in some cases, respondents do not have either an upper or lower bound and therefore the percentages are in respect of the numbers reporting for the bounds and not of the total sample of 305.
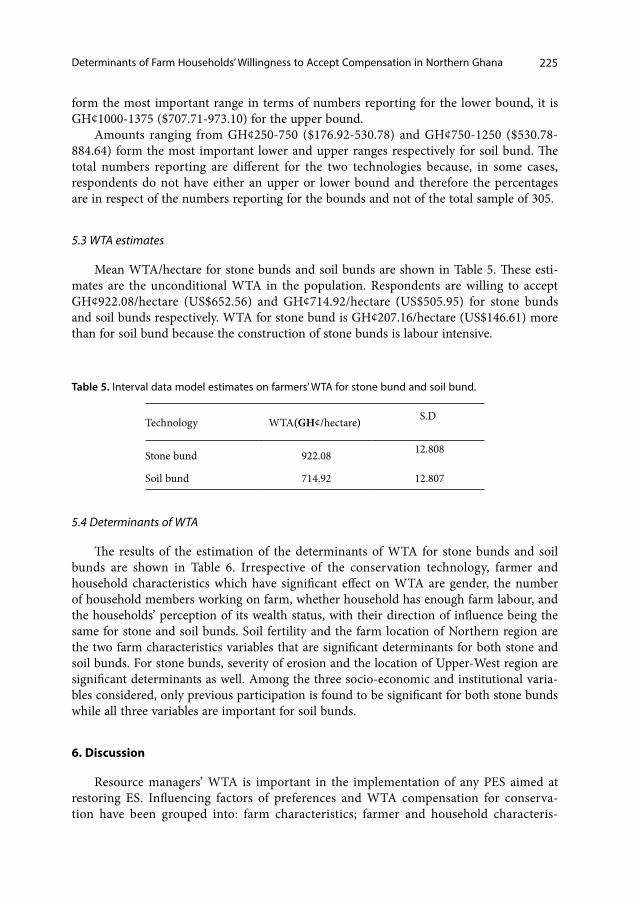
5.3 WTA estimates
Mean WTA/hectare for stone bunds and soil bunds are shown in Table 5. These esti-mates are the unconditional WTA in the population. Respondents are willing to accept GH¢922.08/hectare (US$652.56) and GH¢714.92/hectare (US$505.95) for stone bunds and soil bunds respectively. WTA for stone bund is GH¢207.16/hectare (US$146.61) more than for soil bund because the construction of stone bunds is labour intensive.
Table 5. Interval data model estimates on farmers’ WTA for stone bund and soil bund.
Technology WTA(GH¢/hectare) S.D
Stone bund 922.08 12.808
Soil bund 714.92 12.807
5.4 Determinants of WTA
The results of the estimation of the determinants of WTA for stone bunds and soil bunds are shown in Table 6. Irrespective of the conservation technology, farmer and household characteristics which have significant effect on WTA are gender, the number of household members working on farm, whether household has enough farm labour, and the households’ perception of its wealth status, with their direction of influence being the same for stone and soil bunds. Soil fertility and the farm location of Northern region are the two farm characteristics variables that are significant determinants for both stone and soil bunds. For stone bunds, severity of erosion and the location of Upper-West region are significant determinants as well. Among the three socio-economic and institutional varia-bles considered, only previous participation is found to be significant for both stone bunds while all three variables are important for soil bunds.
6. Discussion
Resource managers’ WTA is important in the implementation of any PES aimed at restoring ES. Influencing factors of preferences and WTA compensation for conserva-tion have been grouped into: farm characteristics; farmer and household characteris-
tics; socioeconomic; and, institutional factors by previous studies (see, e.g., Ayuba et al., 2011; Cooper & Keim, 1996; Matta et al., 2009; Minten, 2003). In the current study, as is shown in Table 6, gender, the number of household members working on farm, whether household has enough farm labour, and the households’ perception of its wealth status are the farmer and household characteristics significantly influencing WTA. The direc-tion of influence of these factors on WTA for both stone and soil bunds is the same. The observed differences in all the coefficient estimates for stone and soil bunds, i.e., higher positive and lower negative for stone bunds and lower positive and higher negative for soil bunds is because it costs more to adopt stone bunds than soil bunds.
Households headed by females are willing to accept less than male household heads. Female are willing to accept GH¢52.22/hectare ($36.98/hectare) and GH¢61.55/hec-tare ($43.59/hectare) less than males for stone and soil bunds respectively. This result is contrary to Thurston (2006), Stephen (2015), and Wang et al. (2019) who found female respondents have higher WTA than male respondents in valuing environmental conser-vation. The dissimilarity between the genders may be due to a number of reasons. First, wage disparity between genders and weak negotiation skills of females; second, females
Table 6. Interval data model estimates on determinants of WTA/hectare for stone bund and soil bund.
Note: * pseudo t-value significant at 5%; Within Bayesian inference, the coefficient’s confidence/cred-ible interval excludes zero if the ratio of the estimate of the mean to the standard deviation exceeds 2.
227Determinants of Farm Households’ Willingness to Accept Compensation in Northern Ghana
may not be fully aware of the effort required as construction of bunds is done by males in the study area; third, women consider conserving the environment as a personal ben-efit unlike men who focus on financial rewards; and finally, women see current levels of PES funding as more helpful and useful than do men (Schwartz, 2017). Households with higher number of members providing farm labour are willing to accept less for adoption. This could be because the higher the household members providing on-farm labour, the less that household would require hired labour. The WTA for own labour for stone and soil bunds are GH¢5.75/hectare ($4.07/hectare) and GH¢9.55/hectare ($6.76/hectare) respectively implying that an additional household member working on the farm leads to a reduction in the WTA/hectare accepted by these amounts. There is no plausible explana-tion for the positive influence of labour sufficiency on WTA. Households who perceive themselves as poor demand GH¢52.50/hectare ($37.18/hectare) and GH¢80.92/hectare ($57.31/hectare) less for stone and soil bunds respectively than those who perceive them-selves of average wealth. This result is consistent with that of Sangkapitux et al. (2009) that poorer farmers have a higher willingness to engage in a compensation scheme for pro-viding better ecological services, indicating a lower WTA for the supply of environmental services. Education is a significant determinant of WTA for only stone bunds. Consistent with Ninan et al. (2007), Wang et al. (2019), Wang et al. (2018), and Xu et al. (2015), the more educated the household head, the more the WTA and this is explained by Minten (2003) that more educated households have a higher reservation wage and thus prefer to put more effort in off-farm earnings. This is particularly true as stone bunds require much more effort than soil bunds. For example, farmers who have had primary education will accept GH¢24.75/hectare ($17.53/hectare) more than farmers with no formal education. In contrast, Xiong and Kong (2017) and Yu and Cai (2015) observe a negative influence of education on WTA.
Two farm characteristics, soil fertility and the farm location of Northern Region are the significant determinants for both stone and soil bunds. For stone bunds, severity of erosion and the location of Upper-West region are significant determinants as well. As the fertility of soil becomes poorer, farmers demand more compensation. Farmers will accept GH¢76.16/hectare ($53.94/hectare) more for stone bunds on fertile than on very fertile soil. Also the higher the severity of erosion, the more WTA wanted. More infertile soils and highly eroded lands require more resources to construct closer bunds which also mean that more productive land is lost to conservation structures. The severity of erosion is significant for stone bund but not soil bund because stone bunds are comparatively bet-ter at controlling erosion. This result does not agree with Sangkapitux et al. (2009) whose results on peoples’ willingness to participate in payment schemes posits that the lower the soil fertility and severe the erosion, the lower the WTA demanded is likely to be.
For soil bund, farm size is a significant variable showing that the bigger the house-holds’ farm size, the less WTA those households are willing to accept. Farm size nega-tively influences WTA probably because the opportunity cost of committing land is less for large landholders than for small landholders. This result conforms to that of Minten (2003) but contradicts that of Sukic (2001), Xiong and Kong (2017), and Wang et al. (2019). Willingness-to-accept of farmers in Northern and Upper-West regions are less and more compared to Upper-East region respectively for stone bunds. Farmers in Northern Region are willing to accept GH¢36.62/hectare ($25.93/hectare) less than their counter-
parts in the Upper East Region, whereas those in Upper-West Region demand higher, a mean of GH¢93.51/hectare ($66.22/hectare) more than those in Upper East. Willingness-to-accept is more in the Upper-West because stones are more readily available on farms in Upper-East than in Upper-West where stones will need to be transported from elsewhere. In the case of Northern region, it is perhaps because though stones are not abundant here, lands are much more flatter here compared to those in Upper-West and Upper-East and therefore will require less labour and materials for construction. This result does show that location influences WTA as is found by Minten (2003), Stephen (2015), Yu and Cai (2015), and Xiong and Kong (2017).
Previous participation is found to be the only socio-economic and institutional vari-able significant for both stone bunds and soil bunds. Households that have participated in previous soil and water conservation projects are willing to accept GH¢84.21/hectare ($59.64/hectare) less than households that have not. This result is also observed by PRE-SA/ICRAF(2010). Such result, Cummings et al.(1986) explained as respondents probably being unable to provide their true preferences because they have had little prior experi-ence with the item being valued and thus have difficulty establishing their minimum WTA during a single survey. This explanation does not however tell us the direction of influence on WTA. However, various studies have found farmers’ environmental aware-ness and knowledge affect WTA positively (Feng et al., 2018; Wang et al., 2018; Xu et al., 2015; Yu & Cai, 2015).
For soil bunds, income and adoption affect WTA in a negative and positive way respectively. For instance, farmers in the monthly income range of GH¢21-30 ($14.87-21.25) will accept GH¢27.05/hectare ($19.16/hectare) than those earning GH¢31-40 ($21.95-28.33) per month. The higher the income of the household, the less WTA they are willing to accept agrees with Xu et al. (2015), Yu and Cai (2015), and Wang et al. (2018) but is inconsistent with PRESA/ICRAF (2010). This result is however contradictory to the influence observed for the wealth status variable probably because wealth status is a vari-able measuring perception than actual wealth. The adoption variable has positive effect, indicating, for example, that adopter households demand GH¢53.57/hectare ($66.22/hec-tare) more than non-adopter households. Adopter households have previous knowledge of the technology thus it is logical to assume that their WTA represent their true pref-erences. This result contradicts that of the participation variable in that previous experi-ence leads to positive effect on WTA (i.e., adoption) and negative influence on WTA (i.e., previous participation) at the same time. The only explanation that can be given for this inconsistency is that adopters perhaps have better and more experience with the technol-ogy because they have actually adopted on their own fields than previous participants of projects who may not have adopted.
7. Conclusions
Factors like gender, the number of household members working on farm, whether household has enough farm labour, the households’ perception of its wealth status, soil fertility, farm location and participation in previous conservation project are significant determinants of WTA for both soil and water conservation technologies/practices. How-ever, other factors like education, farm size, severity of erosion and income also show that
229Determinants of Farm Households’ Willingness to Accept Compensation in Northern Ghana
the determinants of WTA may vary with technology and location and therefore results from one location and for one technology should be employed in another location and on another technology with care.
The fact that location effects are observed in the average amount of compensation that smallholders in northern Ghana are prepared to accept indicates that location spe-cific approaches might be employed, and that the amounts paid for the promotion of pay-ment schemes should also be location specific. Particularly, smallholders in the Northern Region are willing to accept less for soil and stone bund than those in Upper East region and should be targeted.
A widely held argument in the literature is that poor smallholders are concerned about short-term but not long-term economic interests, and are, therefore, not willing to adopt sustainable management services. The fact that in the current study, households who perceived themselves as poor are willing to accept less than those who perceived themselves as rich suggests that the poorer groups among the farm households in north-ern Ghana are more willing to engage in conservation compensation schemes. Therefore, the evidence provided in the current study supports the proposition that compensation schemes can, in addition to their environmental objectives, address poverty.
To ensure effectiveness and efficiency of PES, policies should be designed to consid-er important factors. Factors such as gender, age, education, location, farm size, income, and previous participation in conservation programmes are important. Any category of household prepared to accept less compensation is more likely to participate in the PES scheme. Therefore, if a PES scheme will be implemented in the study, groups that need to be consciously targeted include: less educated and female headed households and house-holds headed by older individuals. Compensation schemes should also concentrate more on poorer households than richer ones since this achieves both efficiency and equity objectives. Monetary compensation can be an avenue for improving livelihoods, alleviat-ing poverty and diminish reliance of such groups on natural resources.
We briefly mention some limitations of our study. First, the high illiteracy rates of smallholder farmers impose some difficulties when conducting stated preference surveys in developing countries. Even after considerable training, enumerators may still make con-siderable mistakes. We tried to address this by reviewing each administered questionnaire at the end of each interview to highlight incorrect responses, and make sure that respons-es are corrected before leaving the respondents. Second, all valuation methods involve some uncertainty. The very complex nature of ES themselves limits how precisely they can be valued. The complexity limits the ability of respondents to understand and appreciate nature of ES or the reasoning behind the choices they make. We employed the MBUC CV format and the interval-data model to try and address the issue of uncertainty. Finally, the values attached to benefits from ES are subjective and variable over time, space and issue. These values differ substantially with people’s attitudes, awareness of background issues, cultural norms, preferences and status. Additionally, it is extensively known that valuation of ES is very context specific and should be informed by the viewpoints and needs of the beneficiaries within these contexts. Thus the results obtained are space and time specific and apply only to a particular location. We reason that the results may well be extended to other parts of Ghana and perhaps SSA where conditions are similar, however, this should be done with care.
The authors are grateful to an anonymous referee for his valuable comments.
9. References
Adanu, S.K., Mensah, F.K. and Adanu, S.K. (2013). Enhancing Environmental Integrity in the Northern Savanna Zone of Ghana: A Remote Sensing and GIS Approach. Jour-nal of Environment and Earth Science 3(5): 67-77.
Agyepong, G.T. (1987). Perspectives on Land Resource Planningfor Conservafion in Ghana. Environmental Protection Council (EPA), Accra.
Akter, S. and Bennett, J. (2013). Preference uncertainty in stated preference studies: facts and artefacts. Applied Economics 45(15): 2107-2115.
Akter, S., Bennett, J. and Akhter, S. (2008). Preference uncertainty in contingent valuation. Ecological Economics 67(3): 345-351.
Alberini, A. (1995). Efficiency vs Bias of Willingness-to-Pay Estimates: Bivariate and Interval-Data Models. Journal of Environmental Economics and Management 29(2): 169-180.
Alberini, A., Boyle, K. and Welsh, M. (2003). Analysis of contingent valuation data with multiple bids and response options allowing respondents to express uncertainty. Journal of Environmental Economics and Management 45(1): 40-62.
Ariely, D., Loewenstein, G. and Prelec, D. (2003). “Coherent arbitrariness”: Stable demand curves without stable preferences. Quarterly Journal of Economics 118(1): 73-105.
Aryeetey, E. and Baah-Boateng, W. (2015). Understanding Ghana’s growth success story and job creation challenges. Helsinki, Finland: UNU-WIDER.
Asiedu-Amoako, S., Ntiamoah, M.K. and Gedzi, V.S. (2016). Environmental Degradation: A Challenge to Traditional Leadership at Akyem Abuakwa in the Eastern Region of Ghana. American Journal of Indigenous Studies 1(1): 1-13.
Ayuya, O.I., Lagat, J.K. and Mironga, J.M. (2011). Factors influencing potential acceptance and adoption of clean development mechanism projects: Case of carbon trade pro-ject among small scale farmers in Njoro District, Kenya. Research Journal of Envi-ronmental and Earth Sciences 3(3): 275-285.
Baker, J. (2000). Evaluating the Impact of Development Projects on Poverty: A Handbook for Practitionersb. Washington, DC: World Bank.
Balcombe, K., Chalak, A. and Fraser, I. (2009). Model selection for the mixed logit with Bayesian estimation. Journal of Environmental Economics and Management 57(2): 226-237.
Bateman, I., Burgess, D., Hutchinson, W.G. and Matthews, D. (2004). Learning Effects in Repeated Dichotomous Choice Contingent Valuation Questions. Paper presented at the Royal Economic Society Annual Conference. Swansea.
Benneh, G. and Agyepong, G.T. (1990). Land Degradation in Ghana. Commonwealth Sec-retariat, London; University of Ghana, Legon, Ghana.
Bingham, G., Bishop, R., Brody, M., Bromley, D., Clark, E., Cooper, W., et al. (1995). Issues in ecosystem valuation: improving information for decision making. Ecologi-cal Economics 14(2): 73-90.
231Determinants of Farm Households’ Willingness to Accept Compensation in Northern Ghana
Boardman, J., Poesen, J. and Evans, R. (2003). Socio-economic factors in soil erosion and conservation. Environmental Science & Policy 6(1): 1-6.
Bockstael, N.E., Freeman, A.M., Kopp, R.J., Portney, P.R. and Smith, V.K. (2000). On Measuring Economic Values for Nature. Environmental Science & Technology 34(8): 1384-1389.
BoG. (2010). Bank of Ghana Annual Report. Accra: Bank of Ghana.Broberg, T. and Brännlund, R. (2008). An alternative interpretation of multiple bounded
WTP data--Certainty dependent payment card intervals. Resource and Energy Eco-nomics 30(4): 555-567.
Champ, P.A., Bishop, R.C., Brown, T.C. and McCollum, D.W. (1997). Using Donation Mechanisms to Value Nonuse Benefits from Public Goods. Journal of Environmental Economics and Management 33(2): 151-162.
Cooper, J.C. and Keim, R.W. (1996). Incentive Payments to Encourage Farmer Adoption of Water Quality Protection Practices. American Journal of Agricultural Economics 78(1): 54-64.
Cummings, R.G., Brookshire, D.S., Schulze, W.D., Bishop, R.C. and Arrow, K.J. (1986). Valuing Environmental Goods: An Assessment of the Contingent Valuation Method. Totowa, NJ: Rowman & Allanheld.
Dasgupta, P. and Mäler, K.-G. (1995). Chapter 39 Poverty, institutions, and the environ-mental resource-base. In Jere, B. and Srinivasan, T.N. (Eds.), Handbook of Develop-ment Economics, Elsevier, pp. 2371-2463.
Diao, X. and Sarpong, D.B. (2007). Cost implications of agricultural land degradation in Ghana: An economywide, multimarket model assessment. Washington, DC: Interna-tional Food Policy Research Institute (IFPRI).
Eswaran, H., Lal, R. and Reich, P.F. (2001). Land Degradation: an Overview. Conference Proceedings of the 2nd International Conference on Land Degradation and Desertifi-cation. Khon Kaen, Thailand: Oxford Press.
FAO. (2000). Applications of the contingent valuation method in developing countries: A survey (Vol. 146). Rome: United Nations Food and Agriculture Organization.
FAO. (2011). Assessing forest degradation. Towards the development of globally applicable guidelines. Forest Resources Assessment Working Paper 177. Rome.
Feng, D., Liang, L., Wu, W., Li, C., Wang, L., Li, L., et al. (2018). Factors influencing will-ingness to accept in the paddy land-to-dry land program based on contingent value method. Journal of Cleaner Production 183: 392-402.
GLSS5. (2008). Ghana Living Standards Survey Report of the Fifth Round. Accra: Ghana Statistical Service.
Gomiero, T. (2016). Soil Degradation, Land Scarcity and Food Security: Reviewing a Complex Challenge. Sustainability 8(3): 1-41.
Greene, W.H. (2003). Econometric Analysis (5th ed.). New Jersey: Prentice Hall.Hamdy, A. and Aly, A. (2014). Land degradation, agriculture productivity and food secu-
rity. Fifth International Scientific Agricultural Symposium. Agrosym 2014. (October 2014).
Hanemann, W.M., Loomis, J. and Kanninen, B. (1991). Statistical Efficiency of Double-Bounded Dichotomous Choice Contingent Valuation. American Journal of Agricul-tural Economics 73(4): 1255-1263.
Heath, J. and Binswanger, H. (1996). Natural resource degradation effects of poverty and population growth are largely policy-induced: the case of Colombia. Environment and Development Economics 1(01): 65-84.
Helming, K., Rubio, J. and Boardman, J. (2006). Soil erosion across Europe: research approaches and perspectives. Catena 68(2-3).
Hemant, K. and Padmini, P. (2013). Effects of soil erosion on agricultural productivity in semi-arid regions: the case of Lower Chambal Valley. Journal of Rural Development (Hyderabad) 32(2): 165-180.
Holland, J.M. (2004). The environmental consequences of adopting conservation tillage in Europe: reviewing the evidence. Agriculture, Ecosystems & Environment 103(1): 1-25.
Jones, A., Breuning-Madsen, H., Brossard, M., Dampha, A., Deckers, J., Dewitte, O., et al. (2013). Soil Atlas of Africa. Luxembourg: Publications Office of the European Union.
Kenworthy, J.M. (1995). Environmental degradation and desertification in Ghana: a study of the Upper Western Region. African Affairs 94(374): 120-121.
Koop, G. (2003). Bayesian Econometrics. Chichester, West Sussex: John Wiley & Sons Ltd.Krishna, V.V., Drucker, A.G., Pascual, U., Raghu, P.T. and King, E.D.I.O. (2013). Estimat-
ing compensation payments for on-farm conservation of agricultural biodiversity in developing countries. Ecological Economics 87: 110-123.
Lal, R. (1995). Erosion-Crop Productivity Relationships for Soils of Africa. Soil Science Society of America Journal 59(3): 661-667.
Li, C.-Z. and Mattsson, L. (1995). Discrete Choice under Preference Uncertainty: An Improved Structural Model for Contingent Valuation. Journal of Environmental Eco-nomics and Management 28(2): 256-269.
Ludi, E. (1997). Household and communal strategies: small-scale farming families and their options for self-improvement: A case study in Anjeni, Ethiopia. Addis Abeba and Bern: Soil Conservation Research Programme, Research Report 30.
Matta, J.R., Alavalapati, J.R.R. and Mercer, D.E. (2009). Incentives for Biodiversity Conser-vation Beyond the Best Management Practices: Are Forestland Owners Interested? Land Economics 85(1): 132-143.
Minten, B. (2003). Compensation and Cost of Conservation Payments for Biodiversity. Cornell Food and Nutrition Policy Program Working Paper, 142.
Mitchell, R.C. and Carson, R.T. (1989). Using surveys to value public goods: The contingent valuation method: Resources for the Future, Washington DC
Nabhan, H. (1997). Integrated soil management for sustainable agriculture and food secu-rity in southern and east Africa (pp. 8-12). Harare, Zimbabwe: Proceedings of FAO/ISCW Expert Consultation on Management of Degraded Soils in Southern and East Africa (MADS – SEA).
Nijnik, M. and Miller, D. (2017). Valuation of ecosystem services: paradox or Pandora’s box for decision-makers? One Ecosystem 2:e14808: 1-33.
Ninan, K.N., Jyothis, S., Babu, P. and Ramakrishnappa, V. (2007). The Economics of Biodi-versity Conservation: Valuation in Tropical Forest Ecosystems. London: Earthscan.
Obalum, S.E., Buri, M.M., Nwite, J.C., Hermansah, Watanabe, Y., Igwe, C.A., et al. (2012). Soil Degradation-Induced Decline in Productivity of Sub-Saharan African Soils: The Prospects of Looking Downwards the Lowlands with the Sawah Ecotechnology. Applied and Environmental Soil Science 2012: 10.
233Determinants of Farm Households’ Willingness to Accept Compensation in Northern Ghana
Pearce, D. (2002). The Role of ‘Property Rights’ in Determining Economic Values for Envi-ronmental Costs and Benefits. Bristol: The Environment Agency.
Philcox, N. (2007). Literature review and framework analysis of non-market goods and services provided by British Columbia’s Ocean and Marine Coastal Resources: Can-ada/British Columbia Oceans Coordinating Committee.
Poe, G.L. (2016). Behavioral Anomalies in Contingent Values and Actual Choices. Agricul-tural and Resource Economics Review 45(2): 246-269.
PRESA/ICRAF (2010). Assessing landholder preferences for alternative land management schemes and willingness to accept rewards for watershed services provision: the case of Kapingazi River basin, Mt. Kenya East. Nairobi: Pro-poor Reward for Environ-mental Services in Africa (PRESA/ICRAF).
Ready, R.C., Champ, P.A. and Lawton, J.L. (2010). Using Respondent Uncertainty to Miti-gate Hypothetical Bias in a Stated Choice Experiment. Land Economics 86(2): 363-381.
Ready, R.C., Whitehead, J.C. and Blomquist, G.C. (1995). Contingent Valuation When Respondents Are Ambivalent. Journal of Environmental Economics and Management 29(2): 181-196.
Sangkapitux, C., Neef, A., Polkongkaew, W., Pramoon, N., Nonkiti, S. and Nanthasen, K. (2009). Willingness of upstream and downstream resource managers to engage in compensation schemes for environmental services. International Journal of the Com-mons 3(1): 41-63.
Sant, R.A. (2001). Soil degradation and crop production in arid regions of Africa, The 4th Session of the Inter-African Experts Committee on African Soils Conference (pp. 6–8.). Accra, Ghana.
Schwartz, G.J. (2017). The role of women in payment for environmental services programs in Osa, Costa Rica. Gender, Place & Culture 24(6): 890-910.
Senayah, J.K., Adjei-Gyapong, T. and Asiamah, R.D. (1998). Soils of the Busa agricultural station of the Upper West Region. Kumasi, Ghana: Soil Research Institute (SRI) of The Council for Scientific and Industrial Research (CSIR).
Shetty, S.V.R., Debrah, S.K. and Renard, C. (1995). Technology development, testing and transfer: An overview of ICRISAT’s experience in semi-arid Africa, Proceedings of Workshop on Moist Savannas of Africa: Potentials and constraints for crop production. Cotonou, Benin.
Shiferaw, B., Freeman, H.A. and Navrud, S. (2005). Valuation Methods and Approaches for Assessing Natural Assessment: Management Impacts. In Shiferaw, B., Freeman, H.A. and Swinton, S.M. (Eds.), Natural Resource Management in Agriculture: Meth-ods for Assessing Economic and Environmental Impacts. Wallingford: CABI Publish-ing, pp. 19-51.
Shiferaw, B. and Holden, S.T. (2001). Farm-level benefits to investments for mitigating land degradation: empirical evidence from Ethiopia. Environment and Development Economics 6: 335-358.
Stephen, C. (2015). Willingness to accept payment for conservation of ecosystem services in Mount Kilimanjaro, Tanzania and Taita Hills, Kenya. Unpublished MSc. disserta-tion, Department of Agricultural Economics and Agribusiness, Sokoine University of Agriculture, Morogoro, Tanzania.
Stocking, M. and Abel, N. (1989). Labour Costs: A Critical Element in Soil Conservation. 6th International Soil Conservation Conference. Addis Ababa, Ethiopia.
Sukic, A.D.M. (2001). Landowners’ willingness to accept compensation for selling saltwa-ter marshes to a conservation program: a multiple bounded discrete choice approach: McGill University.
Thurston, H.W. (2006). Non-market valuation on the internet. In Alberini, A. and Kahn, J. (Eds.), Handbook on Contingent Valuation. Edward Elgar: Edward Elgar, pp. 265-291.
UNCCD. ( 2013). The Economics of Desertification, Land Degradation and Drought: Meth-odologies and Analysis for Decision-Making. Bonn: United Nations Convention to Combat Desertification.
Verbeek, M. (2004). A Guide to Modern Econometrics. Chichester: John Wiley & Sons, Ltd.Vlek, P.L.G., Le, B.Q. and Tamene, L. (2008). Land decline in Land-Rich Africa: A creeping
disaster in the making. Rome: CGIAR Science Council Secretariat.Wang, J., Moucheng, L., Yang, L. and Min, Q. (2018). Factors Affecting the Willingness of
Farmers to Accept Eco-Compensation in the Qianxi Chestnut Agroforestry System, Hebei. Journal of Resources and Ecology 9(4): 407-415.
Wang, X., Adamowski, J.F., Wang, G., Cao, J., Zhu, G., Zhou, J., et al. (2019). Farmers’ Willingness to Accept Compensation to Maintain the Benefits of Urban Forests. For-ests 10(8): 691.
Webb, J., Loveland, P.J., Chambers, B.J., Mitchell, R. and Garwood, T. (2001). The impact of modern farming practices on soil fertility and quality in England and Wales. The Journal of Agricultural Science 137(02): 127-138.
World Bank (1992). Ghana 2000 and beyond: setting the stage for accelerated growth and poverty reduction: Report No. 11486-GH, Western Africa Department, The World Bank, Washington, D.C.
World Bank (2006). Ghana Country Environmental Analysis: Report No: 36985-GH, Envi-ronmentally and Socially Sustainable Development Department (AFTSD), African Region, World Bank.
Wunder, S. (2008). Necessary conditions for ecosystem service payments, Paper presented at the Economics and Conservation in the Tropics: A Strategic Dialogue. San Fran-cisco: Conservation Strategy Fund/ Moore Foundation /Resources for the Future.
Wyatt, T.J. (2002). Liquidity and Soil Management: Evidence from Madagascar and Niger. In Barrett, C.B., Place, F. and Aboud, A.A. (Eds.), Natural Resources Management in African Agriculture: Understanding and Improving Current Practices. Oxon and New York: CABI Publishing, pp. 129-142.
Xiong, K. and Kong, F. (2017). The Analysis of Farmers’ Willingness to Accept and Its Influencing Factors for Ecological Compensation of Poyang Lake Wetland. Procedia Engineering 174: 835-842.
Xu, L., Yu, B. and Li, Y. (2015). Ecological compensation based on willingness to accept for conservation of drinking water sources. Frontiers of Environmental Science & Engineering 9(1): 58-65.
Yu, L.l. and Cai, Y.Y. (2015). Ecological compensation based on farmers’ willingness: A case study of Jingsan County in Hubei Province, China. The Journal of Applied Ecol-ogy 26(1): 215-223.