Determination of Small Ions by Capillary Zone Electrophoresis with Indirect Photometric Detection Application Note David Heiger and Robert Weinberger The special criteria necessary for the separation and detection of small non-UV absorbing anions and cations are described in this note. The following applications are used to demonstrate the techniques: l metal cations in mineral water, yogurt and red wine l organic acids in beer l small anions in tap water, snow and urine. Using automated buffer replenishment, the analytical values of merit for small anions were as follows: migration time relative standard deviation (RSD) of 0.4 to 1.5 %, peak area RSD of 0.9 to 2.0 %, and a limit of detection (LOD) of 5 ppb for chloride. This impressive LOD was obtained without any complex trace-enrichment schemes. Environmental and food analysis Agilent Technologies Innovating the HP Way
Transcript
Determination of Small Ionsby Capillary Zone Electrophoresiswith Indirect PhotometricDetection
Application Note
David Heiger andRobert Weinberger
The special criteria necessary for the separation and detection of small
non-UV absorbing anions and cations are described in this note.
The following applications are used to demonstrate the techniques:
� metal cations in mineral water, yogurt and red wine
� organic acids in beer
� small anions in tap water, snow and urine.
Using automated buffer replenishment, the analytical values of merit
for small anions were as follows: migration time relative standard
deviation (RSD) of 0.4 to 1.5 %, peak area RSD of 0.9 to 2.0 %, and a
limit of detection (LOD) of 5 ppb for chloride. This impressive LOD
was obtained without any complex trace-enrichment schemes.
Environmentaland food analysis
Agilent TechnologiesInnovating the HP Way
Introduction
Separation of small ions is tradi-tionally performed by ion-ex-change chromatography usingconductivity detection. Thistechnique, known as ion chroma-tography (IC), has been success-fully employed for over twentyyears. However, the technologyhas some limitations. Expensiveand sometimes short-lived col-umns are required and the mobilephase is usually strongly acid orbase. Pumping systems mayrequire frequent maintenance forpeak performance. Matrix effectsare commonplace and extensivesample preparation may berequired. The cost per analysis canbe high.
Capillary zone electrophoresis(CZE) is well suited for separatingthese species. The basis forseparation is the differences inmobilities among the various ions.This is readily exploited toperform high speed separationswith superior speed and resolutioncompared with IC. The columnrequired for ion-exchangechromatography, which can costapproximately U.S. $700, can bereplaced with a fused-silicacapillary costing only a fewdollars. Like most CZE methods,the cost per analysis is consider-ably less than comparable chro-matographic methods. Theproblem here is detection. Mostsmall ions do not absorb in theultraviolet (UV) or visible regionsof the spectrum.
The detection problem is solvedwith indirect photometric detec-tion (IPD), the principle of which isillustrated in figure 1. In thistechnique, a UV-absorbing soluteof the same charge as theseparands (a co-ion) serves as anadditive to the backgroundelectrolyte (BGE). This additive,known as a visualizing reagent(VR) elevates the baseline. Whensolute ions are present, theydisplace the visualizing reagentas required by the principle ofelectroneutrality.
As the separated ions migratepast the detector window, theyare measured as negative peaksrelative to the high baseline. Byreversing the signal and referencewavelengths of the diode-arraydetector (DAD), a positive signal is
obtained. With the spectralcapability of the DAD, it is simpleto select the optimal wavelengthsfor the reference and signalchannels.
This combination of CZE with IPDhas been employed for a varietyof applications that are listed intable 1. It should be noted fromthis table and beyond, that CZE-IPDis suitable for virtually all ionicanalytes lacking chromophores.
Mechanism of indirect or vacancy detection
Absorbance
Non UV-absorbingbuffer cation
UV-absorbingbuffer anion
Non UV-absorbingseparand anion
Figure 1The principle of indirect photometric detection
Solute Sample matrix Reference
Amines, aliphatic Standards 1-2Anions Coffee 2
Water 3-4Urine 5Bulk drugs 6Kraft process liquors 7Bayer liquors 8Prenatal vitamins 9Milk 10Standards 11-15
Carbohydrates Fruit juice 16Cations Hydrogen peroxide 17
Figure 2Migration of ions incapillary zoneelectrophoresis
Capillary electrophoresis ofsmall ionsThe movement of small ions andthat of the electro-osmotic flow(EOF) is shown schematically infigure 2. It is often necessary tomanipulate the EOF to adjust thespeed and selectivity of theseparation. For example:
1. To perform the highest speedseparations, both electrophoresisand electroendosmosis shouldbe in the same direction. Thiscondition is automatically metfor cations since those ions andthe EOF are naturally directedtoward the cathode.
For anions, an additive to enablethe EOF to be reversed (operatethe instrument with reversepolarity, sample side negative)may be required. Cationic surfac-tants are generally used for thispurpose. Additionally, the anionspresent a unique case. To monitorhighly mobile and less mobileanions simultaneously, the EOFmust be reversed. Otherwise, thehighly mobile anions migratetoward the anode while the low
Table 1Applications of CZE with IPD
Solvation of the ionic specieshas a direct role in determiningmobility. For example, lithiumion would be expected to be themost mobile of the alkali metalions. It is actually the least mobilebecause of a large radius ofhydration. Organic solvents canaffect the solvent cage. The iodide-chloride and perchlorate-azidepairs coelute under certainconditions. Addition of 15 %methanol to the electrolytefacilitates resolution of thesesolute pairs.11
The role of electrolyte pHThe pH of the electrolyte does notaffect the net charge of manysmall ions. For example, chloride,bromide, sodium and potassiumare fully charged at the pH valuesusually employed in CZE. On theother hand, nitrate has a pK
a of
3.37, borate is 9.24 (pKa1
) andcarbonate is 10.25 (pK
a2). For
these ions, adjusting the pH of thebackground electrolyte has aprofound impact on selectivity15.Mobility plotting (a graph ofmobility versus the pH of thebackground electrolyte) is aneffective tool to optimize selec-tivity.
The pH values affect the EOF as afunction of the silanol dissociationon the capillary wall. Less obvi-ously, the electrolyte pH governsthe ionization of the visualizingreagent (VR).11 This affects itsmobility, which in turn influencespeak symmetry (see discussion inthe next section).
mobility anions are swept by theEOF toward the cathode. Whenseparating anions of similarmobilities, EOF manipulation isnot necessary except to optimizefor speed or selectivity (see 2.below).
2. To resolve separands withsimilar mobilities, the EOF mayhave to be reduced. This isparticularly important when theconcentration of one solute issubstantially different from theother. The basis for this effectcomes from the fundamentalequation for electrophoreticresolution
where: Rs = resolution�µ = difference in mobility
between a solute pairE = electric field strengthL = capillary lengthµep = average mobilityµeo = EOFDm = average diffusion coefficient.
For cations, chelating reagentsmay be necessary to enhanceresolution of the transition metalsand lanthanides. Anionic chelatingreagents are required otherwiseinterference with indirect detec-tion will occur. Hydroxyisobutyricacid (HIBA, 5 to 10 mM) is usuallyselected 21-23, 25 although manyweak anionic chelators such aslactate or tartrate can be em-ployed.23 A reagent such as HIBAcan also be employed at higherconcentrations to lower the EOF.This improves resolution withoutfurther complicating the back-ground electrolyte. A neutralcrown ether may be required toresolve ammonium ion frompotassium.19
Indirect detectionThere are several requirementsplaced on the VR.1 The reagent must be a co-ion
of the separand.2 Ideally, the VR will serve as the
buffer.3 The VR must be charged at the
separating pH.4 The molar absorptivity of the
VR must be high.5 The VR must absorb at differ-
ent wavelengths from theseparands.
6 The concentration of the VR inthe background electrolytemust be relatively low, orsensitivity will be lost.
7 The mobility of the VR shouldmatch as nearly as possible themobility of the separands,otherwise band broadeningwill occur.
The requirement for mobilitymatching occurs as a consequenceof point 6. Whenever the concen-tration of a separand approachesthat of the background electrolyteions, a form of band broadeningoccurs due to the impact of thesolute on the local electric field.This phenomenon, known aselectrodispersion, is illustrated forcations in figure 3 where µ
c is the
mobility of the cationic separandand µ
BGE is the mobility of the
background electrolyte co-ion.There are three cases to consider:
1 µc > µBGEA highly mobile solute (relative tothe background electrolyte)generates a low electric field dueto its high conductivity. Whendiffusion across the rear boundaryoccurs, the solute is exposed tothe high field of the backgroundelectrolyte and thus acceleratestoward the cathode. This causesrecompression at the rear of thezone since these cations catch up
RS = 0.177DµepEL
(µep + µeo) Dm(1)
Unstable boundary Stable boundary
Low field Uniform field High field
Stable boundary Unstable boundary
µc > µ BGE µc = µ BGE µc < µBGE
Time
with the other solute ions. At thefront of the zone, electrophoresisand diffusion across the boundaryagain exposes the analyte to thehigh field. But this time, these ionsrace ahead of the rest of the band.The frontal zone boundary isunstable, resulting in a frontedsawtooth peak.
2 µc < µBGEFor solutes with low mobility, therear boundary is unstable since thehigh field is generated over thebackground electrolyte. In thiscase, the cations decelerate andlag behind the rest of the zone. Thefront of the zone is stable sinceions crossing the boundary areexposed to a low field. Thisenables the solute ions from therear of the zone to, in effect, catchup.
3 µc = µBGEWhen the mobility of the separandis equal to the mobility of theelectrolyte ions, no such disper-sion occurs because a uniformelectric field is generated acrossthe boundaries between the sepa-rand and background electrolyte.
This effect is seldom observed inconventional CZE because theseparand concentration is muchlower than the backgroundelectrolyte ion concentration.To eliminate this effect completely,the solute concentration wouldhave to be 50-fold lower than thebackground electrolyte and this isimpossible when CZE-IPD isemployed.
Figure 3The phenomenon ofelectrodispersion,illustrated for cationswhere µc and µBGE are themobilities of the cationicsolute and backgroundelectrolyte respectively
When measuring ions with lowmobility, a low-mobility VR shouldbe selected and vice-versa. Whencovering a wide range of ionicmobilities, compromises must bemade. Note that this effect doesnot affect quantitation providedpeak areas are used. However, ifthe band broadening causessubstantial changes in the resolu-tion of closely migrating peaks,problems may occur. Table 2contains data for a selection ofuseful VRs. The list is not all-inclusive.
ause for common inorganic ions, e.g. chloridebuse for carboxylic acidscuse for alkyl sulfates or sulfonatesdat low pH, this material serves as a low mobility reagentehighest pKafat 214 nm
Table 2Properties of visualization reagents
Sensitivity of indirect photo-metric detectionBefore considering the detectabil-ity with IPD, the LOD of directabsorption detection can bedetermined from the rearrangedform of Beer’s law
where:A = baseline noise of the absorbance detectorb = optical pathlengtha = molar absorptivity.
Substituting values for thesevariables:S/N = 5, A = 2 x 10⁻⁵, a = 10,000and b = 5 x 10⁻³ cm (50-m idcapillary) in this equation gives aCLOD of 2 x 10⁻⁶M. This theoreticalvalue assumes that all band-broadening mechanisms areinoperative.
The equation governing thesensitivity of IPD is
where:CVR = concentration of the VR,R = displacement ratio (number of VR ions
displaced by separand)Dr = dynamic reserve of the system.
Thus the LOD is directly propor-tional to the concentration of theVR.
The dynamic reserve of thesystem is the signal generated bythe VR divided by the baselinenoise. This defines the maximumlinear dynamic range attainable.With a stable baseline, a dynamicreserve of 1000 yielding a lineardynamic range of up to threeorders of magnitude can beachieved.
CLOD(M) = = 2 x 10⁻⁶ MA
ab
(5) (2 x 10⁻⁵ AU)
(10000 AUcm-1 M-1) ( 5 x 10⁻³ cm)= (2)
CLOD =CVR
RDr
(3)
CLOD = = 1 x 10⁻⁸ MAVR
aVRbRDR
(5) (1 x 10⁻⁴ AU)
(10000 AUcm-1 M-1) ( 5 x 10⁻³ cm)(1000)= (5)
to two orders of magnitude. Analyte specific properties suchas molar absorptivity togetherwith the experimental conditionsall influence the final result. Inmany cases, it is possible toapproach the theoretical limit towithin an order of magnitude.Further improvements in CLODare possible using sample stack-ing, transient isotachophoresis orextended lightpath capillaries.
The sensitivity of the system canbe determined as follows.13 FromBeer’s Law
where:Io = light intensity entering the cellI = light intensity exiting the cellaVR = molar absorptivity of the VRCVR = VR concentration.
Substituting equation (4) intoequation (3) and rearranging gives
As in equation (2), AVR
is thesystem noise. Since the absor-bance background is high in IPD,the noise of the system is high aswell and a value of 1 x 10⁻⁴ AU isused here. Then for the samevalues as in equation (2) alongwith D
R=1000 and R=1, a theoreti-
cal LOD of 1 x 10⁻⁸ M is found.Thus it is possible for the LOD ofIPD to exceed that of directdetection, at least in theory by up
AVR = log(I0 / I) = aVRbCVR (4)
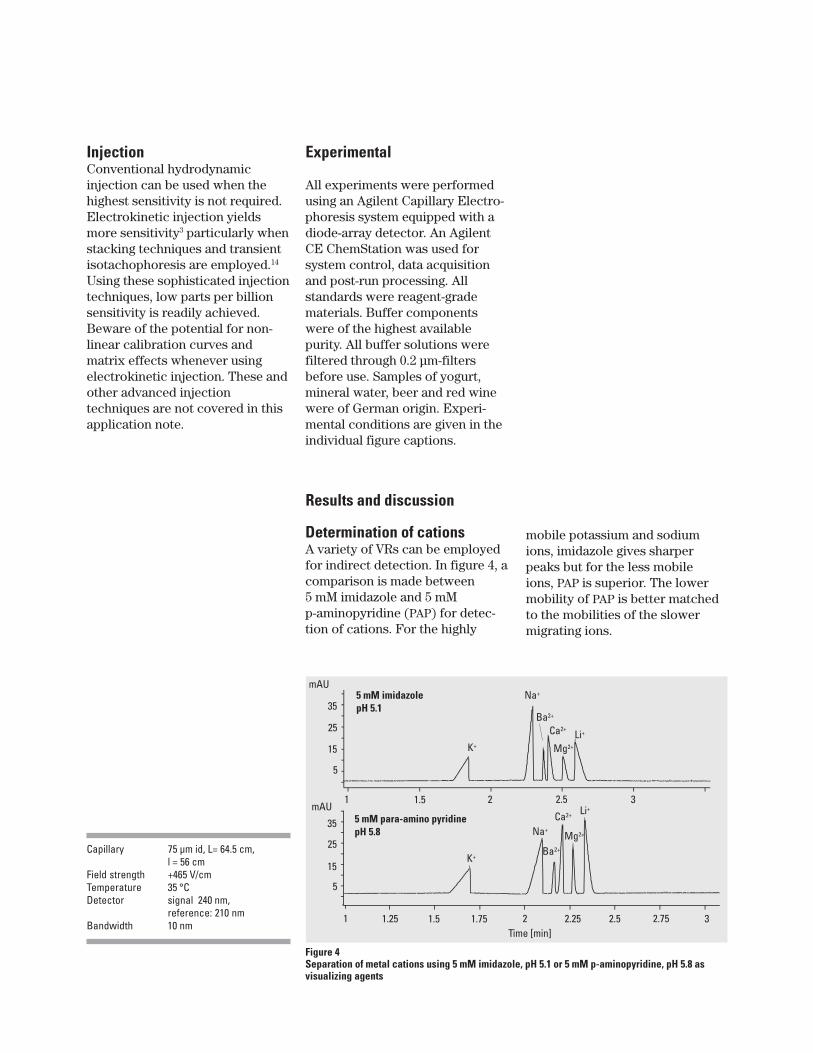
Figure 4Separation of metal cations using 5 mM imidazole, pH 5.1 or 5 mM p-aminopyridine, pH 5.8 asvisualizing agents
K+
Na+
Ba2+
Ca2+
Mg2+
1
1.5 2 32.5
Li+
35
25
15
5
mAU
5 mM imidazolepH 5.1
5 mM para-amino pyridinepH 5.8
32.521.51.25 1.75 2.25 2.75Time [min]
1
K+
Na+
Ba2+
Ca2+
Mg2+
Li+
35
25
15
5
mAU
InjectionConventional hydrodynamicinjection can be used when thehighest sensitivity is not required.Electrokinetic injection yieldsmore sensitivity3 particularly whenstacking techniques and transientisotachophoresis are employed.14
Using these sophisticated injectiontechniques, low parts per billionsensitivity is readily achieved.Beware of the potential for non-linear calibration curves andmatrix effects whenever usingelectrokinetic injection. These andother advanced injectiontechniques are not covered in thisapplication note.
Experimental
All experiments were performedusing an Agilent Capillary Electro-phoresis system equipped with adiode-array detector. An AgilentCE ChemStation was used forsystem control, data acquisitionand post-run processing. Allstandards were reagent-gradematerials. Buffer componentswere of the highest availablepurity. All buffer solutions werefiltered through 0.2 µm-filtersbefore use. Samples of yogurt,mineral water, beer and red winewere of German origin. Experi-mental conditions are given in theindividual figure captions.
Results and discussion
Determination of cationsA variety of VRs can be employedfor indirect detection. In figure 4, acomparison is made between5 mM imidazole and 5 mMp-aminopyridine (PAP) for detec-tion of cations. For the highly
mobile potassium and sodiumions, imidazole gives sharperpeaks but for the less mobileions, PAP is superior. The lowermobility of PAP is better matchedto the mobilities of the slowermigrating ions.
Capillary 75 µm id, L= 64.5 cm,l = 56 cm
Field strength +465 V/cmTemperature 35 °CDetector signal 240 nm,
reference: 210 nmBandwidth 10 nm
Time [min]
0.5 1 1.5 2 2.5 3 3.5
mAU
0
10
20
30
40
50 Plain yogurtDiluted 1:100 in water
K+
Ca2+
Mg2+Na+
a)
Time [min]
0
0.5 1 1.5 2 2.5 3
mAU
0
20
40
60
80
100
120 Red wineDiluted 1:100 in water
K+
Ca2+
Mg2+
Na+
b)
Time [min]0 0.5 1 1.5 2 2.5 3
mAU
0
2
4
6
8
10
12
Mineral waterDiluted 1: 100 dilution
Ca2+
Mg2+
(300 ppb)
Na+
Concentrations on Label: Na2+ 120 ppmCa2+ 120 ppmMg2+ 30 ppm
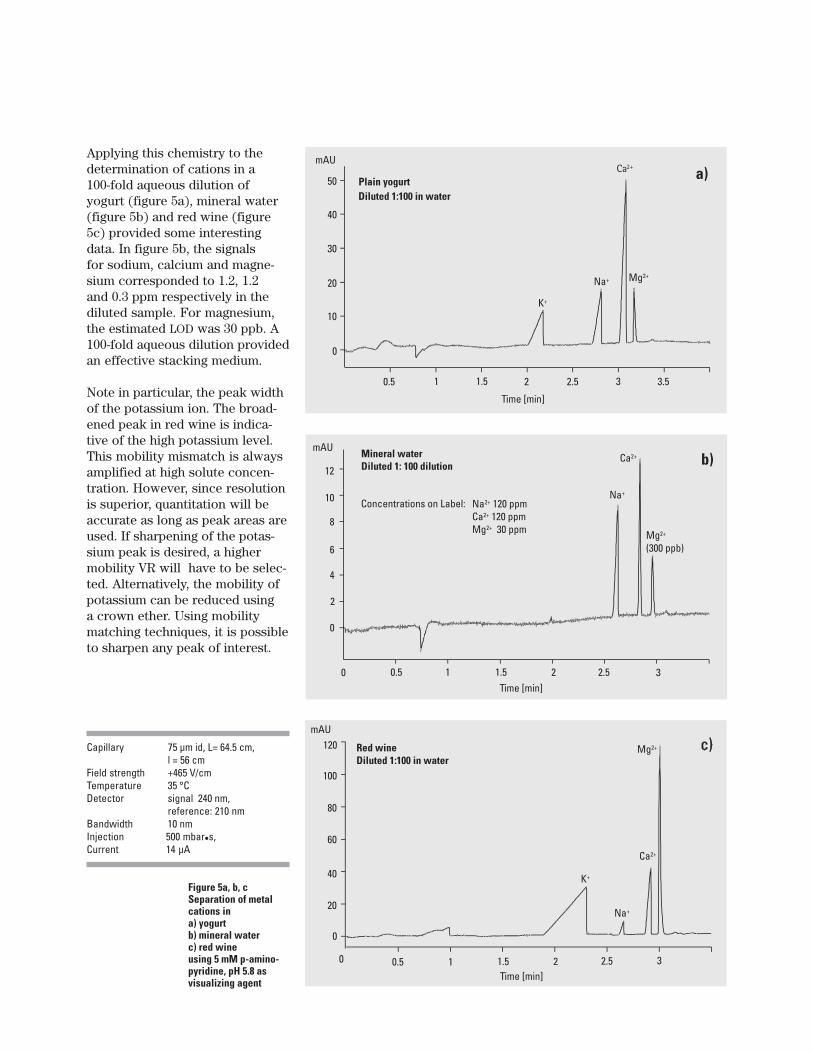
Figure 5a, b, cSeparation of metalcations ina) yogurtb) mineral waterc) red wineusing 5 mM p-amino-pyridine, pH 5.8 asvisualizing agent
Applying this chemistry to thedetermination of cations in a100-fold aqueous dilution ofyogurt (figure 5a), mineral water(figure 5b) and red wine (figure5c) provided some interestingdata. In figure 5b, the signalsfor sodium, calcium and magne-sium corresponded to 1.2, 1.2and 0.3 ppm respectively in thediluted sample. For magnesium,the estimated LOD was 30 ppb. A100-fold aqueous dilution providedan effective stacking medium.
Note in particular, the peak widthof the potassium ion. The broad-ened peak in red wine is indica-tive of the high potassium level.This mobility mismatch is alwaysamplified at high solute concen-tration. However, since resolutionis superior, quantitation will beaccurate as long as peak areas areused. If sharpening of the potas-sium peak is desired, a highermobility VR will have to be selec-ted. Alternatively, the mobility ofpotassium can be reduced usinga crown ether. Using mobilitymatching techniques, it is possibleto sharpen any peak of interest.
Capillary 75 µm id, L= 64.5 cm,l = 56 cm
Field strength +465 V/cmTemperature 35 °CDetector signal 240 nm,
Determination of organic acidsin beerAs figure 6 illustrates, the mobilityof the anionic VR, phthalic acid,was well matched to the separatedorganic acids. Note as well that0.5 mM cetyltrimethylammoniumchloride, a cationic surfactant wasadded to the backgroundelectrolyte. This sub-micellarconcentration of surfactant wassufficient to reverse the charge on
the wall of the capillary and thus,the EOF. The instrument wasoperated in the reverse polaritymode with the sample side beingnegative. A 10-fold aqueousdilution of beer is shown as well infigure 6. Identification of individualcomponents is facilitated byspiking experiments (data notshown), performed automaticallyby double injections with theinstrument.
Another useful system for theseparation of organic acids isshown in figure 7. Using 5 mMdinitrobenzoic acid as the VR, thiselectrolyte provided excellentpeak symmetry for the C
2 - C
9
aliphatic acids. Peak asymmetrywas noted only for the C
10 moiety.
Such an electrolyte system isuseful for separation of organicacids in dairy products.
Succinic acidmAU
40
30
20
10
0
3 4 5 6 7 8 9Time [min]
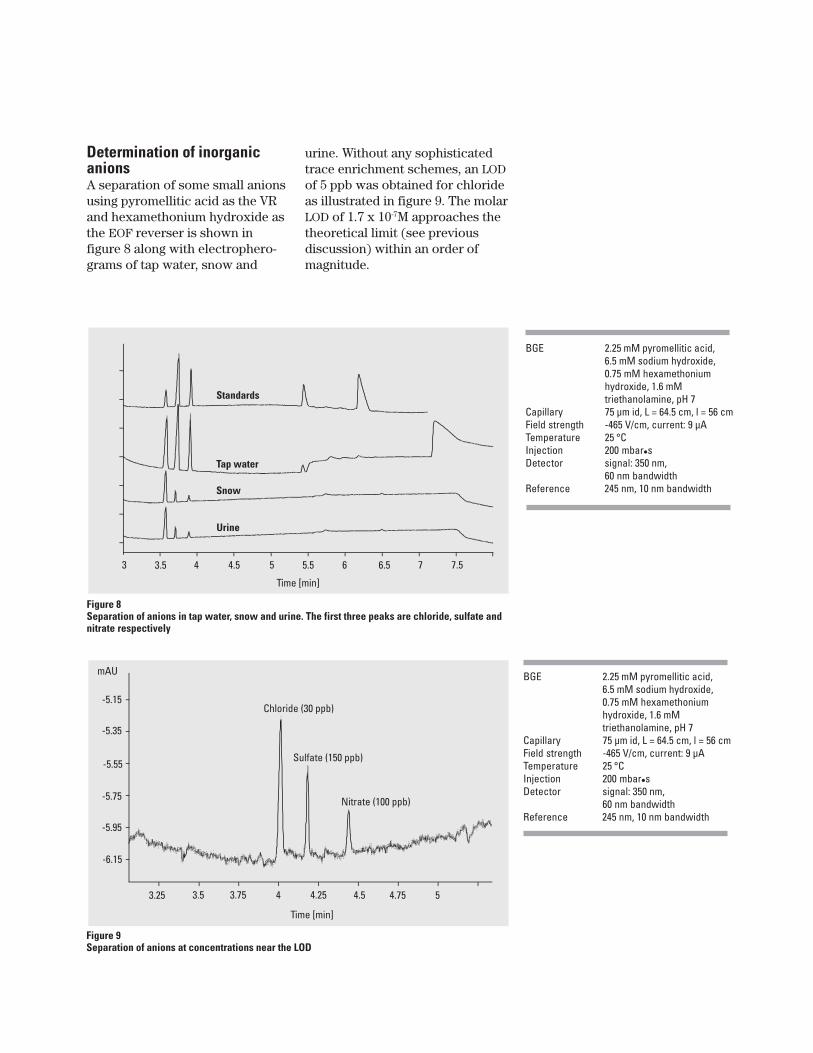
Figure 8Separation of anions in tap water, snow and urine. The first three peaks are chloride, sulfate andnitrate respectively
Time [min]
3 3.5 4 4.5 5 5.5 6 6.5 7 7.5
Urine
Standards
Snow
Tap water
Time [min]
3.25 3.5 3.75 4 4.25 4.5 4.75 5
mAU
-6.15
-5.95
-5.75
-5.55
-5.35
-5.15Chloride (30 ppb)
Sulfate (150 ppb)
Nitrate (100 ppb)
Figure 9Separation of anions at concentrations near the LOD
Determination of inorganicanionsA separation of some small anionsusing pyromellitic acid as the VRand hexamethonium hydroxide asthe EOF reverser is shown infigure 8 along with electrophero-grams of tap water, snow and
urine. Without any sophisticatedtrace enrichment schemes, an LODof 5 ppb was obtained for chlorideas illustrated in figure 9. The molarLOD of 1.7 x 10⁻⁷M approaches thetheoretical limit (see previousdiscussion) within an order ofmagnitude.
BGE 2.25 mM pyromellitic acid,6.5 mM sodium hydroxide,0.75 mM hexamethoniumhydroxide, 1.6 mMtriethanolamine, pH 7
Capillary 75 µm id, L = 64.5 cm, l = 56 cmField strength -465 V/cm, current: 9 µATemperature 25 °CInjection 200 mbar�sDetector signal: 350 nm,
60 nm bandwidthReference 245 nm, 10 nm bandwidth
Amount[ppm]
0 5 10 15 20 25 30
12
3
4
530
30
25
20
15
10
5
0
Area
Time [min]
2 3 4 5 6 7 8
Cl-
SO42-
NO3- F PO4
2- BGE 2.25 mM pyromellitic acid,6.5 mM sodium hydroxide,0.75 mM hexamethoniumhydroxide, 1.6 mMtriethanolamine, pH 7
Capillary 75 µm id, L = 64.5 cm, l = 56 cmField strength -465 V/cm, current: 9 µATemperature 25 °CInjection 200 mbar�sDetector signal: 350 nm,
60 nm bandwidthReference 245 nm, 10 nm bandwidth
BGE 2.25 mM pyromellitic acid,6.5 mM sodium hydroxide,0.75 mM hexamethoniumhydroxide, 1.6 mMtriethanolamine, pH 7
Capillary 75 µm id, L = 64.5 cm, l = 56 cmField strength -465 V/cm, current: 9 µATemperature 25 °CInjection 200 mbar�sDetector signal: 350 nm,
60 nm bandwidthReference 245 nm, 10 nm bandwidth
Figure 10Calibration curve for chloride ion
The calibration curve for chlorideconcentrations was linear be-tween 0.5 to 30 ppm (figure 10).This range can probably beextended, particularly on the lowconcentration side, giving a lineardynamic range of at least threeorders of magnitude. The migra-
tion time reproducibility for thefive anions ranged from 0.4 to1.5 % RSD over 20 runs while thepeak area RSDs ranged from 0.9to 2 % provided the buffers werereplenished for each run. Anoverlay of odd-numbered runs5 to 19 is shown in figure 11.
Figure 11Reproducibility of the anion separation.Odd numbered runs 5-19 are overlaid
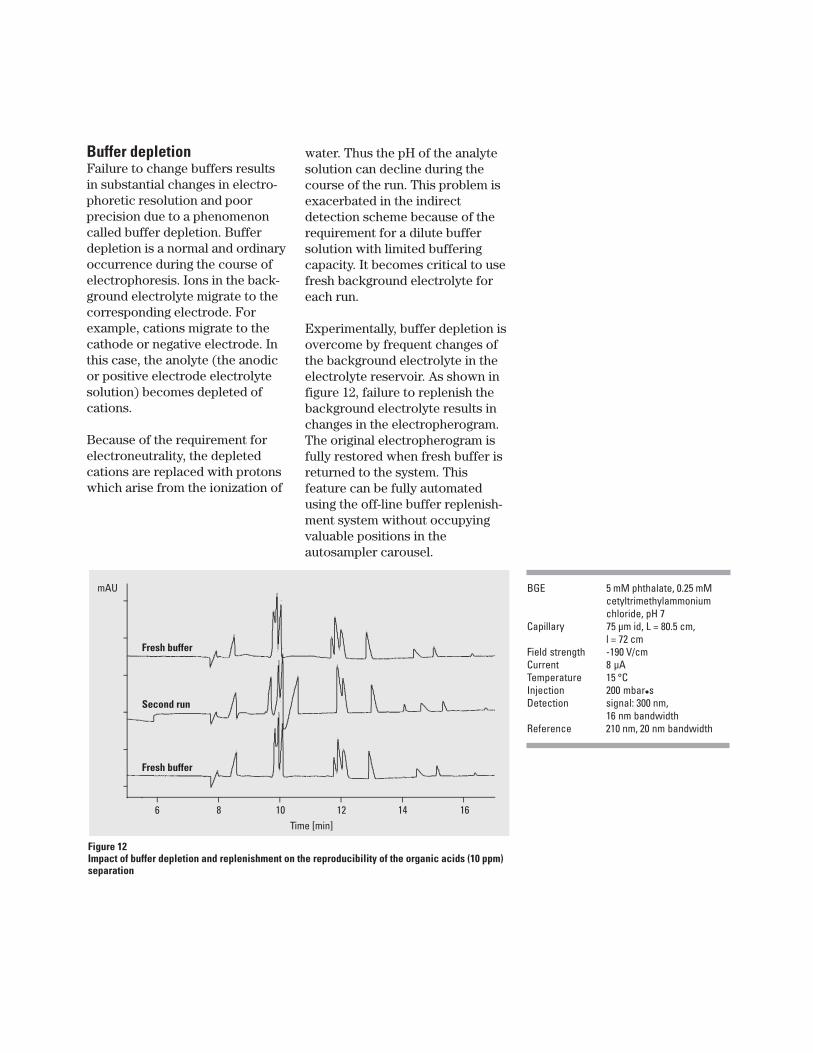
BGE 5 mM phthalate, 0.25 mMcetyltrimethylammoniumchloride, pH 7
water. Thus the pH of the analytesolution can decline during thecourse of the run. This problem isexacerbated in the indirectdetection scheme because of therequirement for a dilute buffersolution with limited bufferingcapacity. It becomes critical to usefresh background electrolyte foreach run.
Experimentally, buffer depletion isovercome by frequent changes ofthe background electrolyte in theelectrolyte reservoir. As shown infigure 12, failure to replenish thebackground electrolyte results inchanges in the electropherogram.The original electropherogram isfully restored when fresh buffer isreturned to the system. Thisfeature can be fully automatedusing the off-line buffer replenish-ment system without occupyingvaluable positions in theautosampler carousel.
Buffer depletionFailure to change buffers resultsin substantial changes in electro-phoretic resolution and poorprecision due to a phenomenoncalled buffer depletion. Bufferdepletion is a normal and ordinaryoccurrence during the course ofelectrophoresis. Ions in the back-ground electrolyte migrate to thecorresponding electrode. Forexample, cations migrate to thecathode or negative electrode. Inthis case, the anolyte (the anodicor positive electrode electrolytesolution) becomes depleted ofcations.
Because of the requirement forelectroneutrality, the depletedcations are replaced with protonswhich arise from the ionization of
Fresh buffer
Second run
Fresh buffer
mAU
6 8 10 12 14 16Time [min]
Figure 12Impact of buffer depletion and replenishment on the reproducibility of the organic acids (10 ppm)separation
Improving sensitivity with thebubble cellIt is possible to use an ExtendedLight Path capillary to furtherimprove limits of detection. This isnoted in figure 13 for the organicacids separation where a 75-µm idcapillary is compared with thesame diameter capillary having adetector window with a “bubble
factor” (BF) of 3. The BF-3capillary has an effective lightpathof 225 µm (that is, three times theunextended capillary id). Note thatthe unique operating characteris-tics of the bubble cell combinedwith a reduced aperture slitgenerate this improvementwithout sacrificing resolution. Thepeaks are slightly offset in the twoelectropherograms because
Conclusion
When considering the basis for theelectrophoresis and detection ofsmall ions, the mysteries surround-ing this technique become clearlyunderstandable. With thisbackground, a route towardoptimization is forthcoming. Byemploying the features of theAgilent Capillary Electrophoresissystem, in particular the DAD,buffer replenishment system,high precision injector andAgilent Extended Light Pathcapillaries, high performanceseparations become easy toreproduce. With advances insample trace enrichment tech-niques such as transientisotachophoresis, low parts-per-billion detection should becomereadily attainable.
different capillaries are used.It is important to realize that whenconcentrated solutionsof VR are employed, use of thebubble cell may not improvesensitivity due to the increasedbackground noise.
Time [min]
mAU
40
30
20
10
0
3 4 5 6 7 8 9
75 µm BF3
75 µm
BGE 5 mM phthalate, 0.25 mMcetyltrimethylammoniumchloride, pH 7
detectionLOD limit of detectionPAP p-aminopyridineRSD relative standard devia-
tionUV ultravioletVR visualizing reagent
References
1Capillary Electrophoresis ofInorganic Cations and LowMolecular-Mass Amines Using aCopper-Based Electrolyte WithIndirect UV Detection, Riviello, J.M.; Harrold, M. P. J. Chromatogr.
93, 652, 385.
2Various Approaches to Analysis ofDifficult Sample Matrices ofAnions Using Capillary IonElectrophoresis, Jones, W. R.;Jandik, P. J. Chromatogr. 92, 608,385.
3Optimization of Injection Techniquein Capillary Ion Electrophoresis forthe Determination of Trace LevelAnions in Environmental Samples,Jackson, P. E.; Haddad J.
Chromatogr. 93, 640, 481.
4Capillary Ion Analysis, AnEnvironmental Method for theDetermination of Anions in Water,Romano, J. P.; Krol, J.J. Chromatogr. 93, 640, 403.
5Analysis of Anion Constituents ofUrine by Inorganic CapillaryElectrophoresis, Wildman, B. J.;Jackson, P. E.; Jones, W. R.; Alden,P. G. J. Chromatogr. 91, 546, 459.
6Anion Screening for Drugs andIntermediates by Capillary IonElectrophoresis, Nair, J. B.; Izzo,C. G. J. Chromatogr. 93, 640, 445.
7Applications of Capillary IonElectrophoresis in the Pulp andPaper Industry, Saloman, D. R.;Romano, J. J. Chromatogr. 92,602, 219.
8Applications of Ion Chromatogra-phy and Capillary Ion Electro-phoresis in the Alumina andAluminum Industry, Grocott, S. C.;Jeffries, L. P.; Bowser, T.;Carnevale, J.; Jackson, P. E.J. Chromatogr. 92, 602, 257.
9Capillary Electrophoretic Determi-nation of Inorganic Ions in aPrenatal Vitamin Formulation,Swartz, M. E. J. Chromatogr. 93,640, 441.
10Effect of Temperature on the SaltBalance of Milk Studied byCapillary Ion Electrophoresis,Schmitt, M.; Saulnier, F.;Malhautier, L.; Linden, G.J. Chromatogr. 93, 640, 419.
11Parameters Influencing Separationand Detection of Anions byCapillary Electrophoresis,Harrold, M. P.; Wojtusik, M. J.;Riviello, J.; Henson, P.J. Chromatogr. 93, 640, 463.
12Method Development Approachesfor Capillary Ion Electrophoresis,Jones, W. R. J. Chromatogr. 93,640, 387.
13Optimization of IPD of Anions inHigh-Perfromance CapillaryElectrophoresis, Ma, Y.; Zhang, R.J. Chromatogr. 92, 625, 341.
14Optimization of Detection Sensi-tivity in the Capillary Electro-phoresis of Inorganic Anions,Jandik, P.; Jones, W. R.J. Chromatogr. 91, 546, 431.
15Controlled Changes of Selectivityin the Separation of Ions byCapillary Electrophoresis, Jones,W. R.; Jandik, P. J. Chromatogr.
91, 546, 445.
16Capillary Zone ElectrophoreticAnalysis of Carbohydrates byDirect and Indirect UV Detection,Oefner, P. J.; Vorndran, A. E.; Grill,E.; Huber, C.; Bonn, G. K.Chromatographia 92, 34, 308.
17Capillary Electrophoresis Methodsfor the Trace Cation Analysis ofSemiconductor Grades of Hydro-gen Peroxide, Carpio, R. A.;Jandik, P.; Fallon, E.J. Chromatogr. 93, 657, 185.
18Capillary Electrophoretic Determi-nation of Alkali and Alkaline-EarthCations in Various MultipleElectrolyte Solutions forParenteral Use, Koberda, M.;Konkowski, M.; Youngberg, P.;Jones, W. R.; Weston, A.J. Chromatogr. 92, 602, 235.
19Separation of Non UV-AbsorbingCations by Capillary Electrophore-sis, Beck, W.; Engelhardt, H.Fresenius J. Anal. Chem. 93, 346,618.
20Separation of Metal Ions byCapillary Electrophoresis, Chen,M.; Cassidy, R. M. J. Chromatogr.
93, 640, 425.
21Capillary Zone Electrophoresis ofRare Earth Metals with IndirectUV Absorbance Detection, Foret,F.; Fanali, S.; Nardi, A.; Bocek, P.Electrophoresis 90, 11, 780.
29Fosfomycin Determination inSerum by Capillary Zone Electro-phoresis with Indirect UltravioletDetection, Baillet, A.; Pianetti, G.A.; Taverna, M.; Mahuzier, G.;Baylocq-Ferrier, D. J. Chromatogr.
93, 616, 311.
30Separation of Inositol Phosphatesby Capillary Electrophoresis,Henshall, A.; Harrold, M. P.; Tso, J.M. Y. J. Chromatogr. 92, 608, 413.
31Application of Capillary Electro-phoresis to the Analysis of theOligomeric Distribution of Polydis-perse Polymers, Bullock, J.J. Chromatogr. 93, 645, 169.
32Quantification of Organic Acids inSugar Refinery Juices with Capil-lary Zone Electrophoresis andIndirect UV Detection, Lalljie, S. P.D.; Vindevogel, J.; Sandra, P.J. Chromatogr. 93, 652, 563.
33Analysis of Organic Acids in Winesby Capillary Electrophoresis andHPLC, Levi, V.; Wehr, T.; Talmadge,K.; Zhu, M. Amer. Lab. 93, January,29.
34Determination of Organic Acids inFood Samples by Capillary Electro-phoresis, Kenney, B. F.J. Chromatogr. 91, 546, 423.
35IPD of Polyamines in BiologicalSamples Separated by High-Performance Capillary Electro-phoresis, Ma, Y.; Zhang, R.; Cooper,C. L. J. Chromatogr. 92, 608, 93.
22Factors Affecting the Separationof Inorganic Metal Cations byCapillary Electrophoresis, Weston,A.; Brown, P. R.; Jandik, P.; Jones,W. R.; Heckenberg, A. L.J. Chromatog. 92, 593, 289.
23Separation of Metal Ions byCapillary Electrophoresis with aComplexing Electrolyte, Shi, Y.;Fritz, J. S. J. Chromatogr. 93, 640,473.
24Bonded-Phase Capillaries and theSeparation of Inorganic Ions ByHigh-Voltage Capillary Electro-phoresis, Chen, M.; Cassidy, R. M.J. Chromatogr. 92, 602, 227.
25Effect of Electrolyte Compositionon the Separation of InorganicMetal Cations by Capillary IonElectrophoresis, Weston, A.;Brown, P. R.; Heckenberg, A. L.;Jandik, P.; Jones, W. R.J. Chromatogr. 92, 602, 249.
27Separation of Ethoxylated AlcoholSulfates by Capillary Electrophore-sis Using Indirect UV Detection,Goebel, L. K.; McNair, H. M.;Rasmussen, H. T.; McPherson, B. P.J. Microcol. Sep. 93, 5, 47.
28Quantitative Determination ofFluorine in Toothpastes, Skocir,E.; Pecavar, A.; Prosek, M. J. High
Res. Chromatogr. 93, 16, 243.
36Determination of Total Polyaminesin Tumor Cells by High-Performance Capillary ZoneElectrophoresis with IndirectPhotometric Detection, Zhang, R.;Cooper, C. L.; Ma, Y. Anal. Chem.
93, 65, 704.
37Indirect UV Photometric Detectionin Capillary Zone Electrophoresisfor the Determination of Phytatein Soybeans, Nardi, A.; Cristalli,M.; Desiderio, C.; Ossicini, L.;Shukla, S. K.; Fanali, S. J.
Microcol. Sep. 92, 4, 9.
38Determination of AlkylphosphonicAcids by Capillary Zone Electro-phoresis Using Indirect UVDetection, Pianetti, G. A.; Taverna,M.; Baillet, G.; Mahusier, G.;Baylocq-Ferrier, D.J. Chromatogr. 93, 630, 371.
39Determination of Propionate inBread Using Capillary ZoneElectrophoresis, Ackermans, M. T.;Ackermans-Loonen, J. C. J. M.;Beckers, J. L. J. Chromatogr. 92,627, 273.
40Quantitative Aspects of IndirectUV Detection in Capillary ZoneElectrophoresis, Nielen, M. W. F. J.
42Optimization of Inorganic Capil-lary Electrophoresis for theAnalysis of Anionic Solutes in RealSamples, Romano, J.; Jandik, P.;Jones, W. R.; Jackson, P. E.J. Chromatogr. 91, 546, 411.
David Heiger is an applicationschemist based at AgilentTechnologies Company, Little FallsDE, U.S.A.
Robert Weinberger is aconsultant at CE Technologies,Inc., Chappaqua NY, U.S.A.