Ioannis Fiamegkos, Beatriz de la Calle, Fernando Cordeiro, Håkan Emteborg, John Seghers, Hanne Leys, James Snell, Mitja Vahcic, Aneta Cizek-Stroh, and Piotr Robouch EURL-HM-20 Proficiency test Report Determination of total As, Cd, Pb, Hg and inorganic As in chocolate 2015 JRC 98502
Transcript
Ioannis Fiamegkos, Beatriz de la Calle,
Fernando Cordeiro, Håkan Emteborg,
John Seghers, Hanne Leys, James Snell,
Mitja Vahcic, Aneta Cizek-Stroh, and
Piotr Robouch
EURL-HM-20 Proficiency test
Report
Determination of total As, Cd, Pb, Hg and inorganic As in chocolate
2015
JRC 98502
1
This publication is a Technical report by the Joint Research Centre, the European Commission’s in-house science
service. It aims to provide evidence-based scientific support to the European policy-making process. The scientific
output expressed does not imply a policy position of the European Commission. Neither the European
Commission nor any person acting on behalf of the Commission is responsible for the use which might be made
1. Introduction ................................................................................................... 6 2. Scope and aim ............................................................................................... 6 3. Set up of the exercise ..................................................................................... 7
3.1 Time frame ............................................................................................. 7 3.2 Confidentiality ......................................................................................... 7 3.3 Distribution ............................................................................................ 7 3.4 Instructions to participants ....................................................................... 7
5. Assigned values and their uncertainties ............................................................. 9 5.1 Assigned value, Xref ................................................................................. 9 5.2 Associated uncertainty, uref ..................................................................... 10 5.3 Standard deviation of the proficiency test assessment, σ ............................ 11
6. Evaluation of results ..................................................................................... 13 6.1 Scores and evaluation criteria ................................................................. 13 6.2 General observations .......................................................................... 14 6.3 Laboratory results and scorings ............................................................... 15
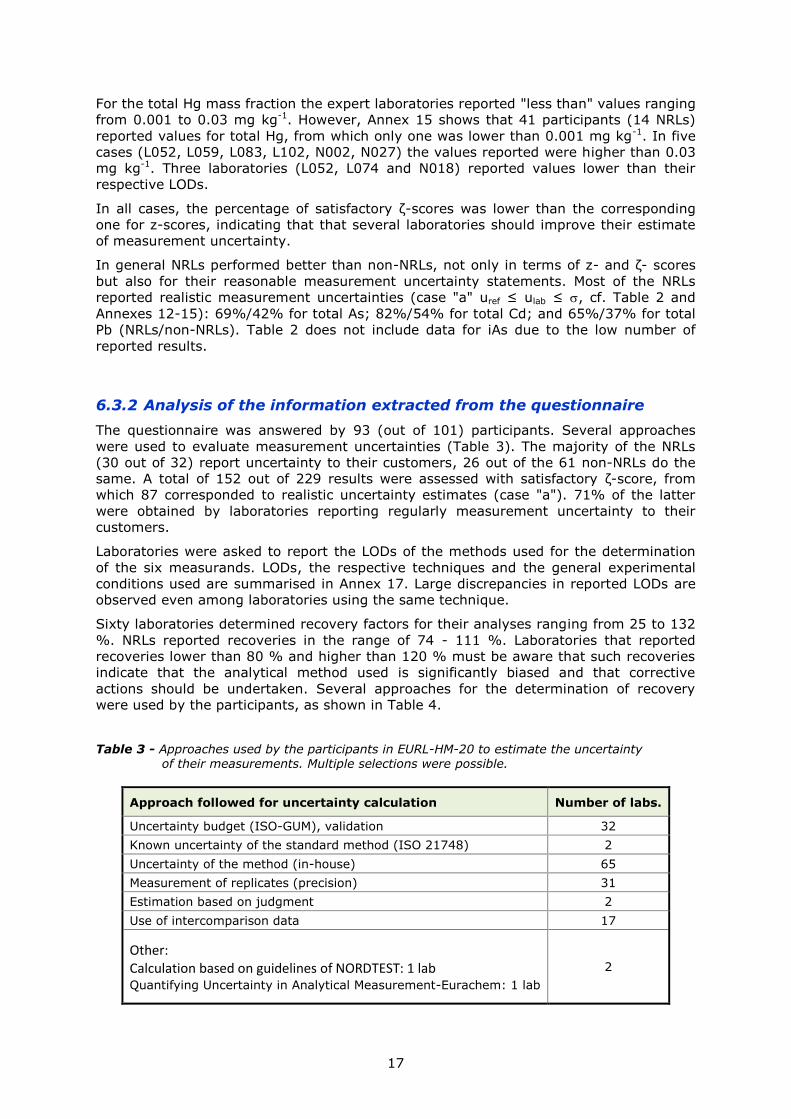
6.3.1 Performances .................................................................................. 15 6.3.2 Analysis of the information extracted from the questionnaire ................ 17
Conclusion ....................................................................................................... 18 References ......................................................................................................... 19 List of abbreviations and definitions ....................................................................... 20 Annexes ............................................................................................................. 21
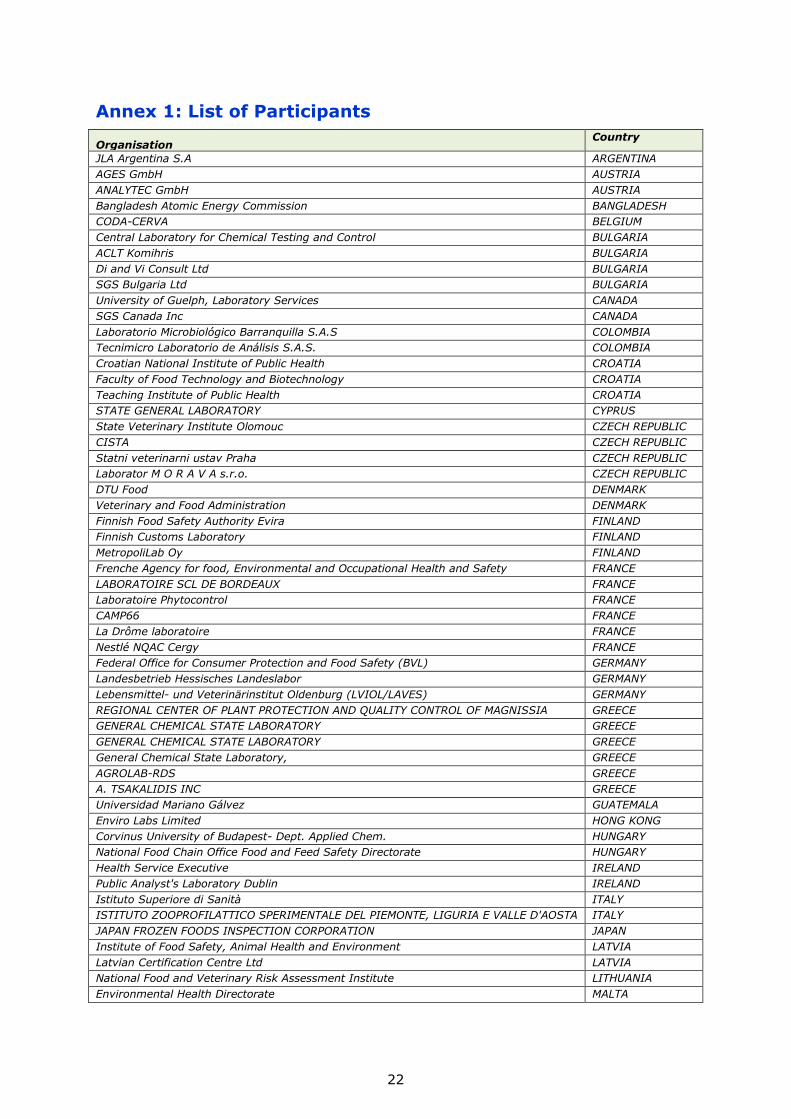
Annex 1: List of Participants .............................................................................. 22 Annex 2: JRC web announcement ....................................................................... 24 Annex 3: Invitation letter to NRLs....................................................................... 25 Annex 4: Invitation letter to European Collaboration for Accreditation (EA) .............. 26 Annex 5: Invitation letter to Asian Pacific Laboratory Accreditation Cooperation
(APLAC) .......................................................................................................... 27 Annex 6: Invitation letter to Inter-American Accreditation Cooperation (IAAC) ......... 28 Annex 7: Invitation letter to African Accreditation Cooperation (AFRAC) .................. 29 Annex 8: Test item accompanying letter .............................................................. 30 Annex 9: Confirmation of receipt form ................................................................ 31 Annex 10: Questionnaire ................................................................................... 32 Annex 11: Homogeneity and stability studies ....................................................... 34
11.1 Homogeneity studies (all values in mg kg-1)............................................... 34 11.2 Stability studies (all values in mg kg-1) ...................................................... 34
Annex 12: Results for total As ............................................................................ 35 Annex 13: Results for total Cd ........................................................................... 37 Annex 14: Results for total Pb ............................................................................ 39 Annex 15: Results for inorganic arsenic, iAs ......................................................... 41 Annex 16: Results for total Hg ........................................................................... 43 Annex 17: Experimental details .......................................................................... 44
4
Executive summary
The European Union Reference Laboratory for Heavy Metals in Feed and Food (EURL-HM)
organised a proficiency test (EURL-HM-20) for the determination of total As, Cd, Pb, Hg
and inorganic As (iAs) in chocolate in support to Commission Regulation (EC) 1881/2006
setting maximum levels for certain contaminants in foodstuffs. This PT was open to
National Reference Laboratories (NRLs), official control laboratories (OCLs) and other
interested laboratories.
One hundred and six participants from 42 countries registered to the exercise. Only five
participants did not report results. Thirty two NRLs (out of the 33 that registered)
reported results.
The material used as test item was commercially available chocolate which, after
appropriate processing, was bottled, labelled and dispatched to the participants during
the first half of May 2015. Seven laboratories with demonstrated measurement
capabilities in the field provided results to establish the assigned values. The standard
uncertainties associated to the assigned values were calculated according to ISO Guide
35.
Laboratory results were rated using z- and zeta (ζ-) scores in accordance with ISO
13528:2005. The relative standard deviation for proficiency assessment was set to 19%
for total Cd, to 22 % for total As and Pb and to 25% for iAs. The expert laboratories
reported "less than" values for the total Hg mass fraction; therefore no scoring was
provided for this measurand.
All NRLs (100%) and 94 % of the other laboratories performed satisfactorily for the
determination of the total Cd mass fraction in chocolate demonstrating that the recently
amended European Regulation (EC) No 1881/2006 setting MLs for cadmium in cocoa and
chocolate can be implemented The percentage of satisfactory scores decreased to 61, 67
and 64%, (63, 77 and 78% for NRLs) due to the low mass fractions of total As, Pb and
iAs in the chocolate. Several laboratories reported "less than" values. Only 27% of the
participants (50% of the NRLs) reported results for iAs, half of which were "less than"
values.
In all cases, the percentage of satisfactory ζ-scores was lower than the corresponding
one for z-scores indicating that several laboratories should improve their estimate of
measurement uncertainty.
5
Acknowledgements
The authors wish to thank colleagues from the IRMM for their valuable contributions they
made during preparation and testing of the proficiency test matrix.
The hundred and one laboratories having participating in this exercise, listed in Annex 1,
are kindly acknowledged.
6
1. Introduction
Contamination with toxic elements is a global environmental and food safety concern.
The consumption of contaminated food leads to uptake of toxic elements by humans,
with the risk increasing proportionally with the quantity consumed. Heavy metal toxicity
can affect mental development and central nervous system function, alter the blood
composition and disturb the function of organs like kidneys, lungs and liver [1].
The European Food Safety Authority (EFSA) carried out in 2012 an in-depth evaluation of
the dietary exposure to cadmium (Cd) via different food commodities, over specific
groups of population [2]. Data indicated that high levels of Cd were found (among
others) in cocoa-based products. According to previous EFSA opinions published in 2009
and 2011 certain population groups (such as children, vegetarians and people living in
highly contaminated areas) can easily exceed by a factor of two the tolerable weekly Cd
intake of 2.5 μg kg-1 body weight. Cocoa powder and cocoa-based products are critical
food commodities, especially for children due to high consumption, their lower body
weight and their higher digestive absorption of metals. Following these findings, the
European Commission published an amendment to Regulation (EC) No 1881/2006
setting maximum levels (MLs) for certain contaminants in food, in order to include MLs
for Cd in cocoa and chocolate [3-5]. The following limits are effective from 1 January
2019:
0.10 mg kg-1 for milk chocolate with < 30 % total dry cocoa solids; 0.3 mg kg-1 for chocolate with < 50 % total dry cocoa solids; and milk chocolate
with ≥ 30 % total dry cocoa solids, and 0.8 mg kg-1 for chocolate with ≥ 50 % total dry cocoa solids.
The European Union Reference Laboratory for Heavy Metals in Feed and Food (EURL-HM)
organised the proficiency test (EURL-HM-20) to assess the performance of National
Reference Laboratories (NRLs) and other food control laboratories in the determination
of total arsenic (As), cadmium (Cd), lead (Pb), mercury (Hg) and inorganic Arsenic (iAs)
mass fractions in chocolate, as agreed with the Directorate General for Health and Food
Safety (DG SANTE) in the annual work programme of the EURL-HM. This report
summarises the outcome of this PT.
2. Scope and aim
As stated in Regulation (EC) No 882/2004 one of the core duties of the European Union
Reference Laboratories is to organise interlaboratory comparisons for the benefit of NRLs
[6].
The present proficiency test (PT) aims to assess the performance of NRLs and other
interested laboratories in the determination of total As, Cd, Pb, Hg and iAs mass
fractions in chocolate.
The assessment of measurement results follows the administrative and logistic
procedures of the EC-JRC-IRMM for the organisation of PTs which is accredited according
to ISO 17043:2010 [7].
This PT is identified as EURL-HM-20.
7
3. Set up of the exercise
3.1 Time frame
The organisation of the EUR-HM-20 exercise was agreed upon by the NRL network at the
8th EURL-HM Workshop held in Brussels on September 24, 2013. The exercise was
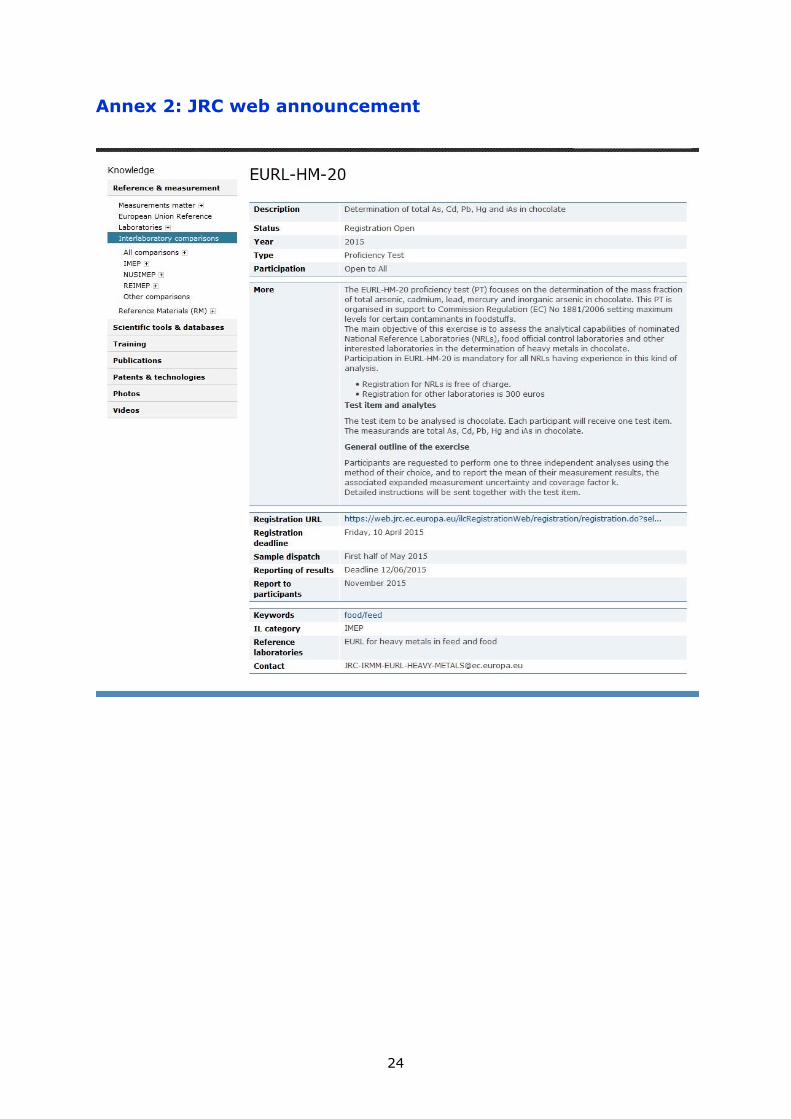
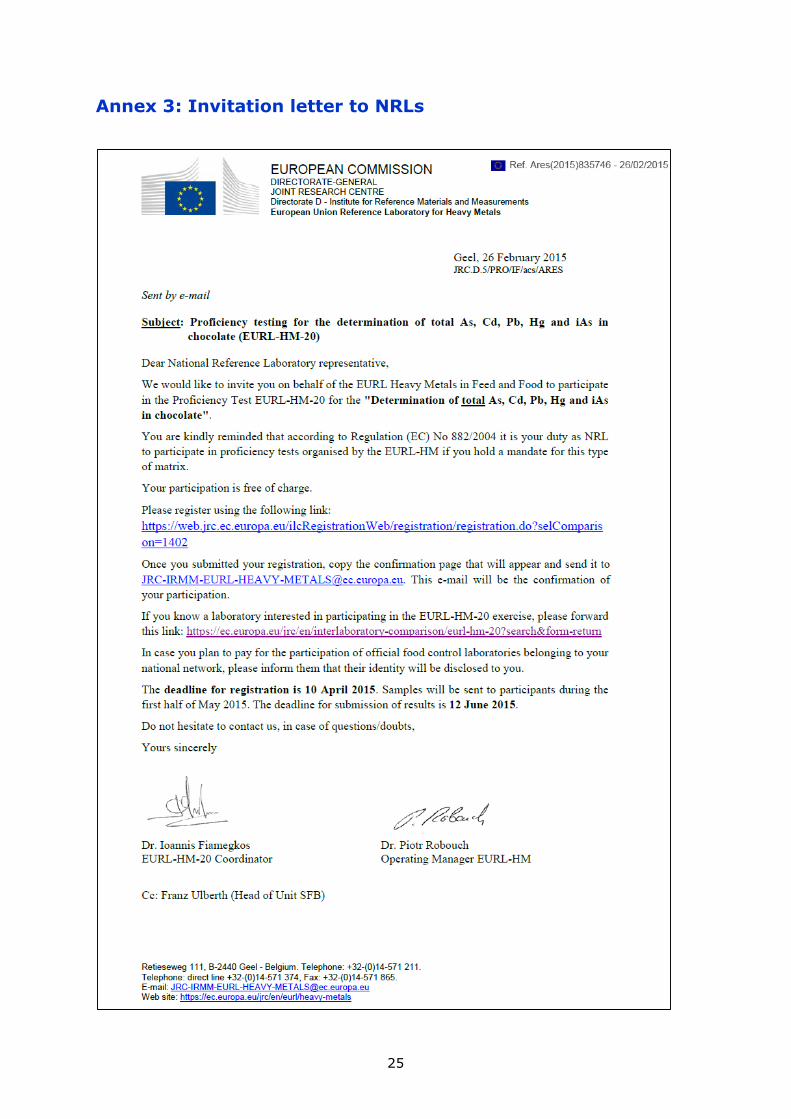
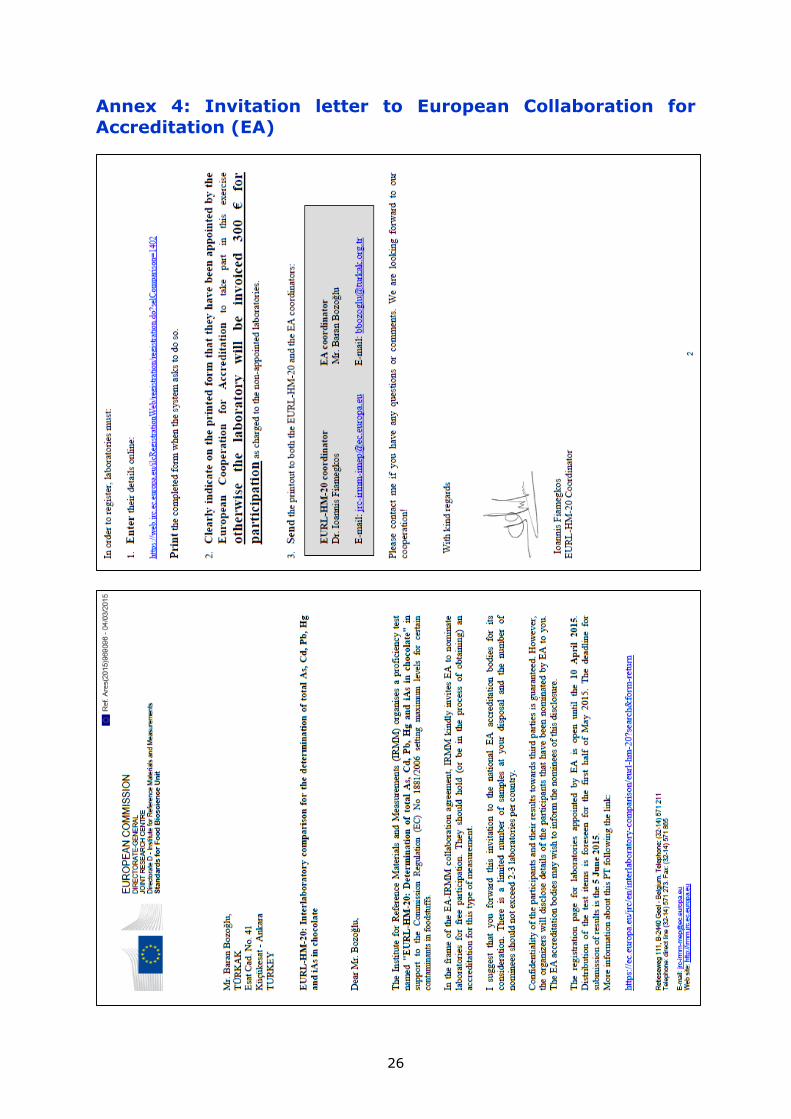
announced on the JRC webpage on February 25, 2015 (Annex 2). Invitation letters were
sent to NRLs as well as to the European Cooperation for Accreditation (EA), to the Asian
Pacific Laboratory Accreditation Cooperation (APLAC), to Inter-American Accreditation
Cooperation (IAAC) and to African Accreditation Cooperation (AFRAC) on March 4, 2015
(Annex 3-7). The registration deadline was set to April 10, 2015. The reporting deadline
was set to June 12, 2015. Dispatch was monitored by the PT coordinator using the
messenger's parcel tracking system on the internet.
3.2 Confidentiality
The following confidentiality statement was made to the EA, APLAC, IAAC and AFRAC:
"Confidentiality of the participants and their results towards third parties is guaranteed.
In the case of EA and NRLs having appointed OCLs to participate in the PT an additional
statement of disclosure was added (Annex 3,4): "The organisers will disclose to you the
details of the participants that have been nominates by you".
3.3 Distribution
Test items were dispatched to participants during the first half of May (4-13 May). Each
participant received:
One pack of six vials containing the test item (approx. 0.5 g / bottle);
A "Test item accompanying letter" (Annex 8); and
A "Confirmation of receipt form" to be sent back to IRMM after receipt of
the test item (Annex 9).
3.4 Instructions to participants
Detailed instructions were given to participants in the "Test item accompanying letter"
mentioned above. Measurands were defined as "the mass fractions of total As, Cd, Pb,
Hg and iAs in chocolate".
Participants were asked to perform two or three independent measurements, to report
their calculated mean (Xlab) and the associated expanded measurement uncertainty
(Ulab).
Participants received an individual code to access the on-line reporting interface, to
report their measurement results and to complete the related questionnaire. A dedicated
questionnaire was used to gather additional information related to measurements and
laboratories (Annex 9).
Participants were informed that the procedure used for the analysis should resemble as
closely as possible their routine procedures for this type of matrix/analytes and
concentration levels.
The laboratory codes were given randomly and communicated to the participants by
e-mail.
8
4.Test item
4.1 Preparation
Dark south-American chocolate (1kg of 64% cocoa content) was purchased in a local
market. Its origin and the batch number was clearly stated on the package. Chocolate
from four different batch numbers were screened for cadmium, lead and arsenic
contents using an Agilent 7500 series ICP-MS (Diegem, BE) after digestion. The batches
showed high content of cadmium and lower amounts of lead and arsenic. All results were
within the legal limits set by the amended European Regulation (EC) 1881:2006.
In order to provide test items that could be easily removed from their containers, it was
decided to supply single units of 0.5 g chocolate pellets in acid washed 10-mL vial. Six
vials were placed in an aluminised sachet, resulting in a kit of six pellets. At the time of
analysis, pellets were to be accurately weighed and placed directly in the proper
digestion vessel. Due to the relatively low mass of the pellets, the fat content and the
amount of other organic material were not expected to produce over-pressure conditions
during digestion with strong mineral acids. A total of 250 sachets (1,500 pellets) were
prepared for the EURL-HM-20 project.
The vials (10-mL) and rubber lyo-inserts were first acid washed for 30 minutes with
nitric acid 10 % in a three dimensional mixer (Dynamix CM-200, WAB, Basel, CH) and
subsequently rinsed with Type I water. Vials were then soaked in 10 % nitric acid for 24
h and rinsed three times with Type I water. Thereafter the glass vials and rubber inserts
were left to dry on acid washed nylon meshes placed in a clean cell, flushed with a HEPA
filtered air. The cleaned vials were then placed in plastic crates awaiting filling with the
chocolate pellets.
Having contacted the chocolate industry at Barry Callebaut Services, (Lebbeke-Wieze,
BE), it was decided to use polycarbonate moulds to produce the 0.5-g chocolate pellets.
Each mould consisted of 88 uniform volume pits where melted chocolate would solidify
into pellets. The necessary moulds were prepared by the IRMM workshop using
computerised milling equipment. The pits were made conical to simplify removal of the
pellets after cooling down.
For the production of pellets, IRMM processing staff assisted the industry experts. The
day before production the chocolate was melted using a Hermes JKV-30 equipment (JKV,
Gilze, NL) at 45 °C. The chocolate was allowed to recirculate over-night at about 5 L
min-1 in order to thoroughly homogenize the bulk. On the day of production the
temperature of chocolate was set to 32 °C (optimal temperature to work with dark
chocolate) and chocolate was allowed to recirculate for another 30 min. After the moulds
were filled, chocolate solidified in a fridge and was later transferred into properly labelled
polyethylene bags. All parts of the machine that were in contact with the chocolate were
made of AISI 304-grade stainless steel which is not expected to contaminate chocolate
with cadmium, lead or arsenic.
Finally, the plastic bags were emptied on an acid washed plastic tray and each pellet was
manually introduced into one vial using acid washed Teflon tweezers. All operations were
performed inside a clean cell flushed with HEPA filtered air. Once the vials were filled,
the rubber inserts were placed in the neck of the vial and placed in a Martin Christ
Epsilon 2-100D freeze dryer (Osterode, DE). Air was then removed from the freeze
drying chamber and replaced by argon. The shelves of the freeze dryer were used to
press down the inserts firmly into the necks of the vials resulting in chocolate pellets
sealed under oxygen free atmosphere. Subsequent capping and labelling according to fill
order took place using the Bausch und Ströbel (Ilshofen, DE) and BBK (Beerfelden, DE)
equipments.
9
4.2 Homogeneity and stability
Measurements for the homogeneity and stability studies were performed by the Centro
de Salud Pública de Alicante (CSPA, Alicante, Spain). Inductively coupled plasma mass
spectrometry (ICP-MS) was used, after microwave digestion (using 0.50 g of chocolate
sample and 5 ml of a mixture of HNO3/H2O2 1:1).
An elemental mercury analyser (EMA) was used to quantify the total Hg mass fraction,
using approximately 60 mg of chocolate per analysis.
The statistical treatment of data was performed by the EURL-HM.
Homogeneity was evaluated according to ISO 13528:2005 [8]. The test item proved to
be adequately homogeneous for all the investigated measurands.
The stability study was conducted applying the isochronous design [9, 10]. The test item
proved to be adequately stable for all measurands at 18oC during the 6 weeks that
elapsed between the dispatch of the samples and the deadline for reporting.
From previous experience (IMEP-107, IMEP-118), it was assumed that the homogeneity
and stability of the total As mass fraction are representative of those of iAs.
The contribution from homogeneity (ubb) and stability (ust) to the standard measurement
uncertainty of the assigned value (uref) was calculated using SoftCRM [11]. The
analytical results reported by the expert laboratories and the statistical evaluation of the
homogeneity and stability studies are presented in Table 1 and in Annex 10.
5. Assigned values and their uncertainties
5.1 Assigned value, Xref
The assigned values for the five measurands (total As, Cd, Pb, Hg and iAs in chocolate)
were determined by seven laboratories, all selected on the basis of on their
demonstrated measurement capabilities (later referred to as expert laboratories):
ALS Scandinavia AB (Luleå, Sweden);
SCK-CEN - Studiecentrum voor Kernenergie (Mol, Belgium);
Umweltbundesamt GmbH (Vienna, Austria);
CSPA - Centro de Salud Pública de Alicante (Alicante, Spain);
VITO - Vlaamse Instelling voor Technologisch Onderzoek (Mol, Belgium);
IRMM – Institute for Reference Materials and Measurements (Geel, Belgium); and
Institut für Chemie, Bereich Analytische Chemie, University of Graz (Graz,
Austria)
Expert laboratories were asked to use the method of analysis of their choice and no
further requirements were imposed regarding methodology. They were also requested to
report their results together with the associated expanded measurement uncertainty and
with a clear and detailed description on how their measurement uncertainty was
calculated. However, they were not required to report values for all measurands.
ALS Scandinavia used inductively coupled plasma sector field mass spectrometry
(ICP-SFMS) after closed microwave digestion of the sample (approx.. 0.5 g in
closed Teflon containers) using HNO3, H2O2 and HF. Analyses were made
according to the modified EPA 200.8 method. ALS reported results for the total
As, Cd, Pb and Hg mass fractions.
10
SCK-CEN applied instrumental neutron activation analysis (k0-INAA) for the
determination of total As, Cd and Hg mass fractions. Three samples of (approx.
0.5 g) were transferred in standard high-density polyethylene vials and weighed.
Samples were irradiated for seven hours in the BR1 reactor under a thermal flux
of 3 1011 n s-1 cm2 together with six IRMM-530 (Al-0.1%Au alloy) neutron flux
monitors, and several reference materials for validation (SMELS II; SMELS III;
BCR 176 - fly ash; and BCR 278 - mussel tissue). Two spectra per sample were
then collected (after 3 and 14 days) on a k0-calibrated HPGe detector. No
additional sample treatment was applied.
Umweltbundesamt GmbH used microwave assisted digestion with 5 ml HNO3 +
2 ml H2O2 using the total content of each bottle (approx. 0.5 g). The
determination of total As, Cd and Pb mass fractions was done by ICP-MS applying
EN ISO 17294-2 and of total Hg by CV-AAS applying EN ISO 12846.
CSPA used ICP-MS after microwave digestion for the total As, Cd and Pb mass
fractions, while elemental mercury analysis (EMA) was used for the total Hg mass
fraction. All samples (approx. 0.5 g) were weighted in a quartz digestion vessels
and 5 mL of HNO3:H2O 1:1 were added in a fume hood. The mixture was left to
react approximately an hour till the end of the gas generation process. Samples
were placed in the microwave digestion system and a two steps digestion
approach was applied.
VITO used high resolution ICP-MS after digestion for the determination of total
As, Cd and Pb mass fractions and CV-AFS for total Hg. The test item (approx. 0.5
g) was weighed accurately into a PTFE vessel, and 6 ml of ultrapur nitric acid
were added together with 2 ml of ultrapure hydrogen peroxide. The vessels were
closed and the samples were digested.
IRMM used isotope dilution ICP-MS for the determination of the total mass
fractions of Cd and Pb. The chocolate pellets were accurately weighed and spiked
with the appropriate isotopic CRM. After spiking 5 mL of 60 % ultra-pure nitric
acid, 0.5 ml of supra pure H202 was added and the samples were left for one hour
to allow for isotopic equilibration before microwave digestion. The obtained
sample digests were properly diluted with H2O and analysed using ICP-MS.
Institut für Chemie of the University of Graz used microwave digestion with
concentrated nitric acid for the mineralisation of the sample (0.5 g of chocolate)
combined with ICP-MS for the determination of total As mass fraction. For iAs,
samples were heated with a solution of CF3COOH/H2O2 (95oC for 60 min) and
analysed by HPLC-ICP-MS.
For this PT, the mean of the means reported by the expert laboratories was used to
derive the assigned values (Xref) according to ISO Guide 35:2006 [12].
5.2 Associated uncertainty, uref
The associated standard uncertainties (uref) of the assigned values were calculated
following the law of uncertainty propagation, combining the standard measurement
uncertainty of the characterization (uchar) with the standard uncertainty contributions
from homogeneity (ubb) and stability (ust), in compliance with ISO Guide 35:2006 [12].
222
stbbcharref uuuu Eq. 1
11
In all cases expert laboratories reported values with overlapping expanded measurement
uncertainties (Table 1 and Figure 1), hence uchar was calculated according to ISO
13528:2005 [8]:
p
ichar up
u1
225.1 Eq. 2
where p is the number of expert laboratories used to assign the reference value; and ui
is the standard measurement uncertainty reported by the experts.
For iAs, results were requested from one expert laboratory only; his measurement
uncertainty was used to set the corresponding uchar.
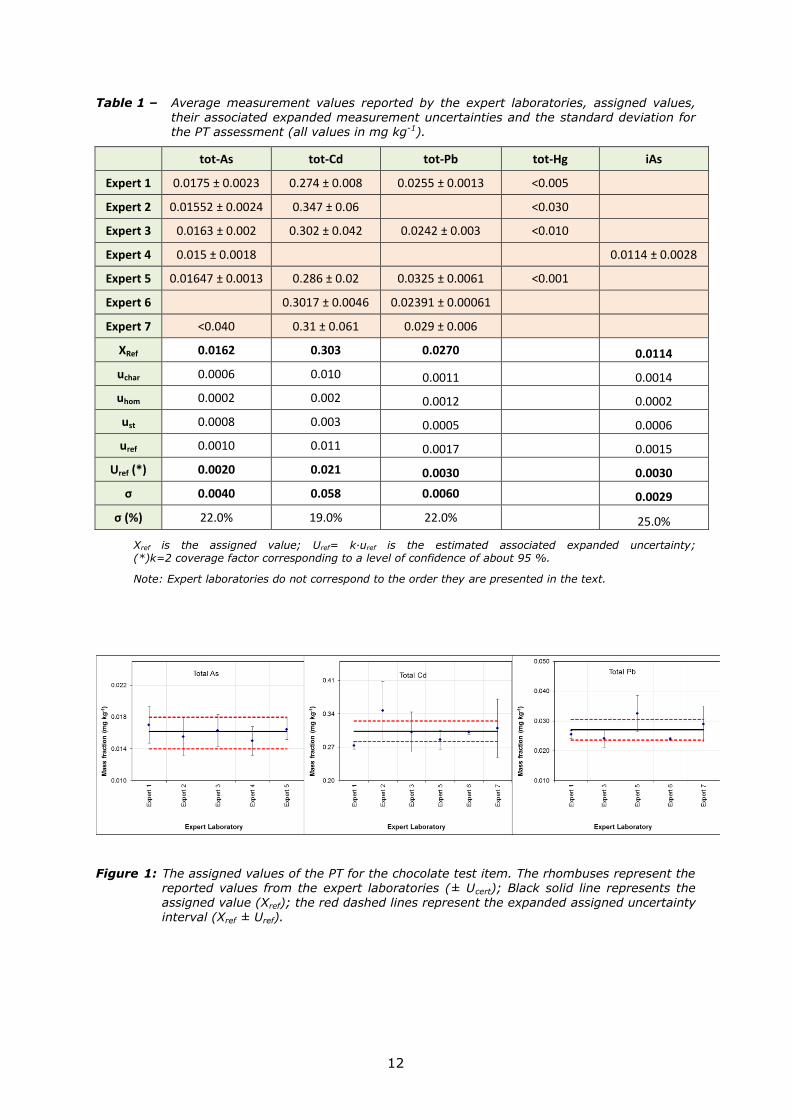
Table 1 presents the average measurement values reported by the expert laboratories
and their associated expanded measurement uncertainties; the assigned values (Xref, uref
and Uref); all standard measurement uncertainty contributions (uchar, ubb, ust); and the
standard deviation for the PT assessment (σ).
5.3 Standard deviation of the proficiency test assessment, σ
The relative standard deviation for PT assessment (σ, in %) was derived from the
Horwitz equation modified by Thompson [13] and was set to 19 % for total Cd, 22 % for
total As and Pb. Since the mass fraction of iAs in the test item was low , the scientific
board of the PT has set the σ to 25% for iAs.
For total Hg mass fractions all expert laboratories stated that their measurement results
were below their limit of quantification; therefore the performance of participants for
total Hg determination was not scored.
12
Table 1 – Average measurement values reported by the expert laboratories, assigned values, their associated expanded measurement uncertainties and the standard deviation for the PT assessment (all values in mg kg-1).
Xref is the assigned value; Uref= k·uref is the estimated associated expanded uncertainty; (*)k=2 coverage factor corresponding to a level of confidence of about 95 %.
Note: Expert laboratories do not correspond to the order they are presented in the text.
Figure 1: The assigned values of the PT for the chocolate test item. The rhombuses represent the reported values from the expert laboratories (± Ucert); Black solid line represents the assigned value (Xref); the red dashed lines represent the expanded assigned uncertainty interval (Xref ± Uref).
13
6. Evaluation of results
6.1 Scores and evaluation criteria
Individual laboratory performance was expressed in terms of z- and -scores in
accordance with ISO 13528:2005 [8]:
z = σ
refXx lab Eq. 3
22
labref
lab
uu
refXx
Eq. 4
where: xlab is the measurement result reported by a participant;
ulab is the standard measurement uncertainty reported by a participant;
Xref is the assigned value;
uref is the standard measurement uncertainty of the assigned value;
σ is the standard deviation for proficiency test assessment.
The interpretation of the z- and ζ-score is done according ISO 17043:2010 [7]:
|score| ≤ 2 satisfactory performance (green in Annexes 11 to 15)
2 < |score| < 3 questionable performance (yellow in Annexes 11 to 15)
|score| ≥ 3 unsatisfactory performance (red in Annexes 11 to 15)
The z-score compares the participant's deviation from the assigned value with the
standard deviation for proficiency test assessment (σ) used as common quality criterion.
The ζ-score states whether the laboratory's result agrees with the assigned value within
the respective uncertainty. The denominator is the combined uncertainty of the assigned
value (uref) and the measurement uncertainty as stated by the laboratory (ulab). The
ζ-score includes all parts of a measurement result, namely the expected value (assigned
value), its measurement uncertainty in the unit of the result as well as the uncertainty of
the reported values. An unsatisfactory ζ-score can either be caused by an inappropriate
estimation of the concentration, or of its measurement uncertainty, or both.
The standard measurement uncertainty of the laboratory (ulab) was obtained by dividing
the reported expanded measurement uncertainty by the reported coverage factor, k.
When no uncertainty was reported, it was set to zero (ulab = 0). When k was not
specified, the reported expanded measurement uncertainty was considered as the half-
width of a rectangular distribution; ulab was then calculated by dividing this half-width by
√3, as recommended by Eurachem and CITAC [14].
Uncertainty estimation is not trivial, therefore an additional assessment was provided to
each laboratory reporting measurement uncertainty, indicating how reasonable their
measurement uncertainty estimation was.
The standard measurement uncertainty from the laboratory (ulab) is most likely to fall in
a range between a minimum and a maximum allowed uncertainty (Case "a":
umin ≤ ulab≤ umax). The minimum allowed uncertainty (umin) is set to the standard
uncertainties of the assigned values (uref). It is unlikely that a laboratory carrying out the
analysis on a routine basis would determine the measurand with a smaller measurement
14
uncertainty than the expert laboratories chosen to establish the assigned value. The
maximum allowed uncertainty is set to the standard deviation accepted for the PT
assessment (σ). Consequently, Case "a" becomes: uref ≤ ulab≤ σ.
If ulab is smaller than uref (Case "b": ulab<uref) the laboratory may have underestimated
its measurement uncertainty. Such a statement has to be taken with care as each
laboratory reported only measurement uncertainty, whereas the uncertainty associated
with the assigned value also includes contributions for homogeneity and stability of the
test item. If those are large, measurement uncertainties smaller than uref are possible
and plausible.
If ulab is larger than σ (Case "c": ulab>σ) the laboratory may have overestimated its
measurement uncertainty. An evaluation of this statement can be made when looking at
the difference between the reported value and the assigned value: if the difference is
smaller than Uref then overestimation is likely. If the difference is larger but xlab agrees
with Xref within their respective expanded measurement uncertainties, then the
measurement uncertainty is properly assessed resulting in a satisfactory performance
expressed as a ζ-score, though the corresponding performance, expressed as a z-score,
may be questionable or unsatisfactory.
It should be pointed out that umax is a normative criterion when set by legislation.
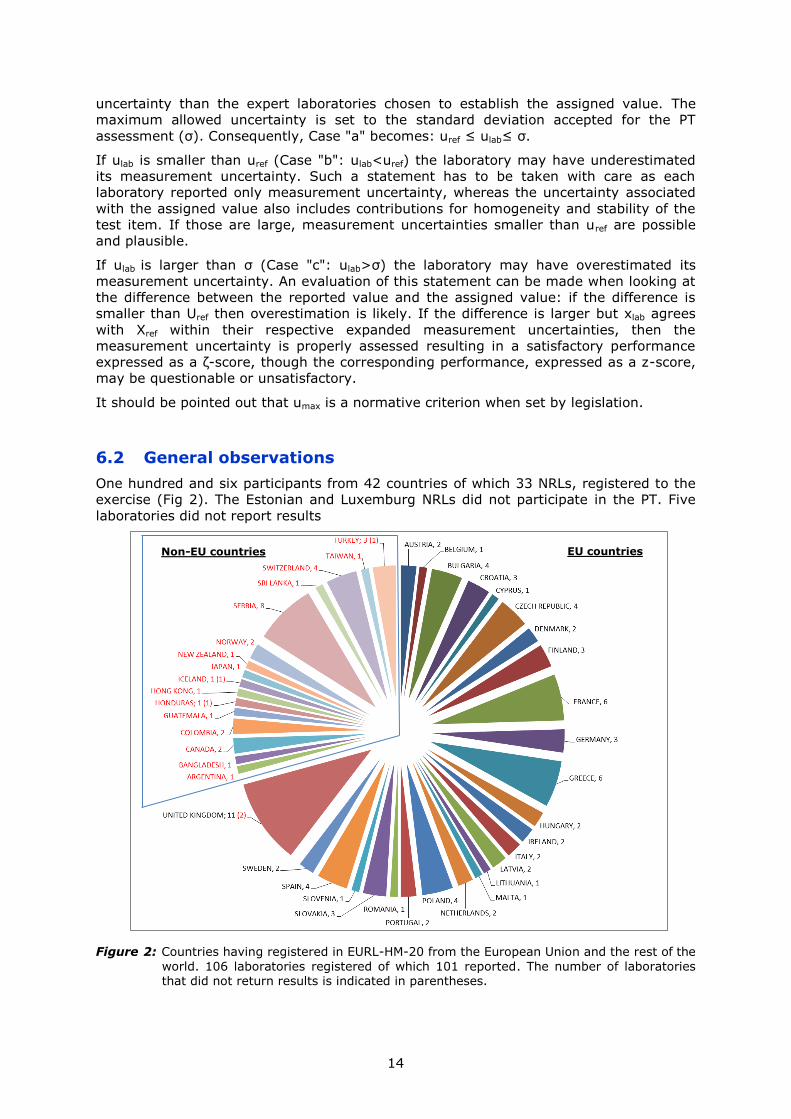
6.2 General observations
One hundred and six participants from 42 countries of which 33 NRLs, registered to the
exercise (Fig 2). The Estonian and Luxemburg NRLs did not participate in the PT. Five
laboratories did not report results
Figure 2: Countries having registered in EURL-HM-20 from the European Union and the rest of the
world. 106 laboratories registered of which 101 reported. The number of laboratories that did not return results is indicated in parentheses.
EU countries Non-EU countries
15
6.3 Laboratory results and scorings
6.3.1 Performances
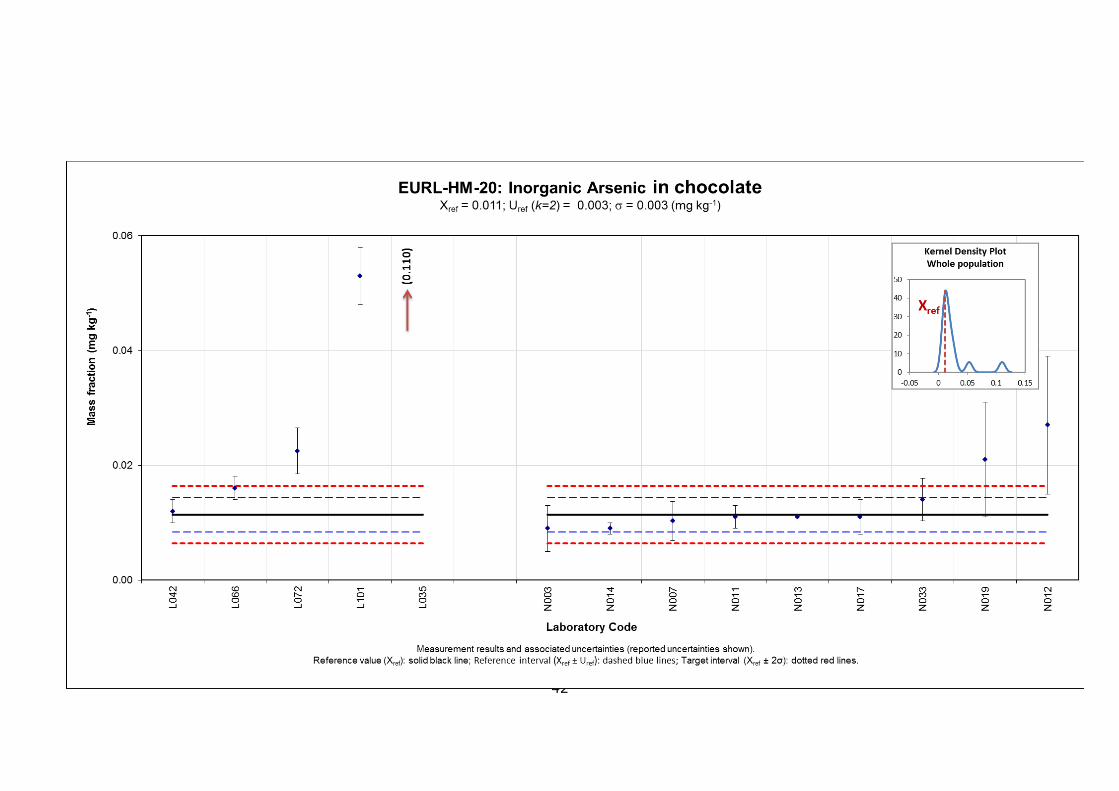
Annexes 12 to 16 present the reported results as tables and graphs for each measurand,
where NRLs and non-NRLs, are denoted as NXXX and LXXX, respectively. The
corresponding Kernel density plots, obtained using the software available from the
Statistical Subcommittee of the Analytical Methods Committee of the UK Royal Society of
Chemistry [15] are also included.
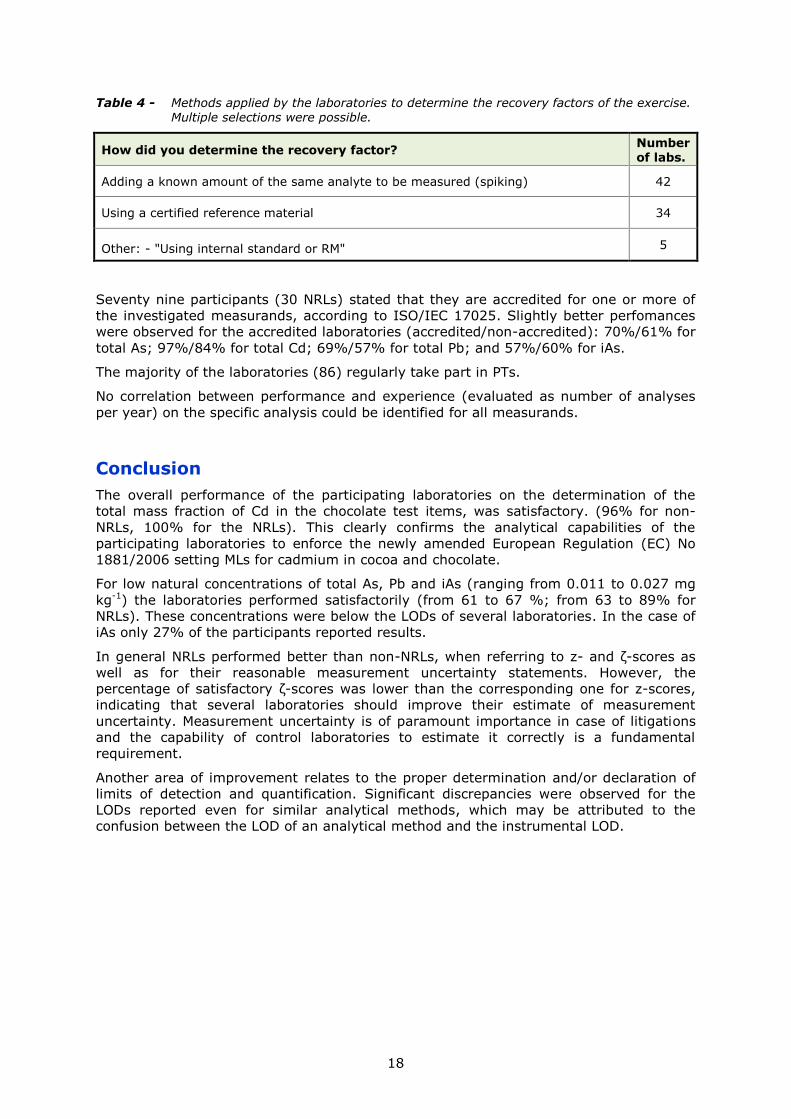
Figure 3 presents the reporting and performance statistics of the PT, expressed as z- and
ζ-scores for the whole population, for NRLs and non-NRLs sub-populations. Participants
performed satisfactorily for the determination of the total Cd mass fraction (96%) while
poorer performances were recorded for the total As, Pb and iAs mass fractions, where
61, 67 and 64% of satisfactory performances were observed.
No direct correlations could be found between the analytical methods used by the
participants and the quality of their reported results. The main observations are
summarised hereafter.
For all the measurands considered in this PT, the laboratories reporting "less than" and
"0" values were not included in the evaluation. However, reported "less than" values
were compared with the corresponding "Xref – Uref" values. When the reported limit value
was lower than the corresponding Xref – Uref, this statement was considered incorrect
(flagged in red in Annexes 12 - 15), since the laboratory should have detected the
corresponding element. Three laboratories reported incorrect "less than" values: Ν020
(0.005 mg kg-1) and N021 (0.01 mg kg-1) for the total As mass fraction for which
"Xref - Uref" = 0.014 mg kg-1; and N009 (0.02 mg kg-1) for the total mass fraction of Pb
for which "Xref – Uref" = 0.02 mg kg-1.
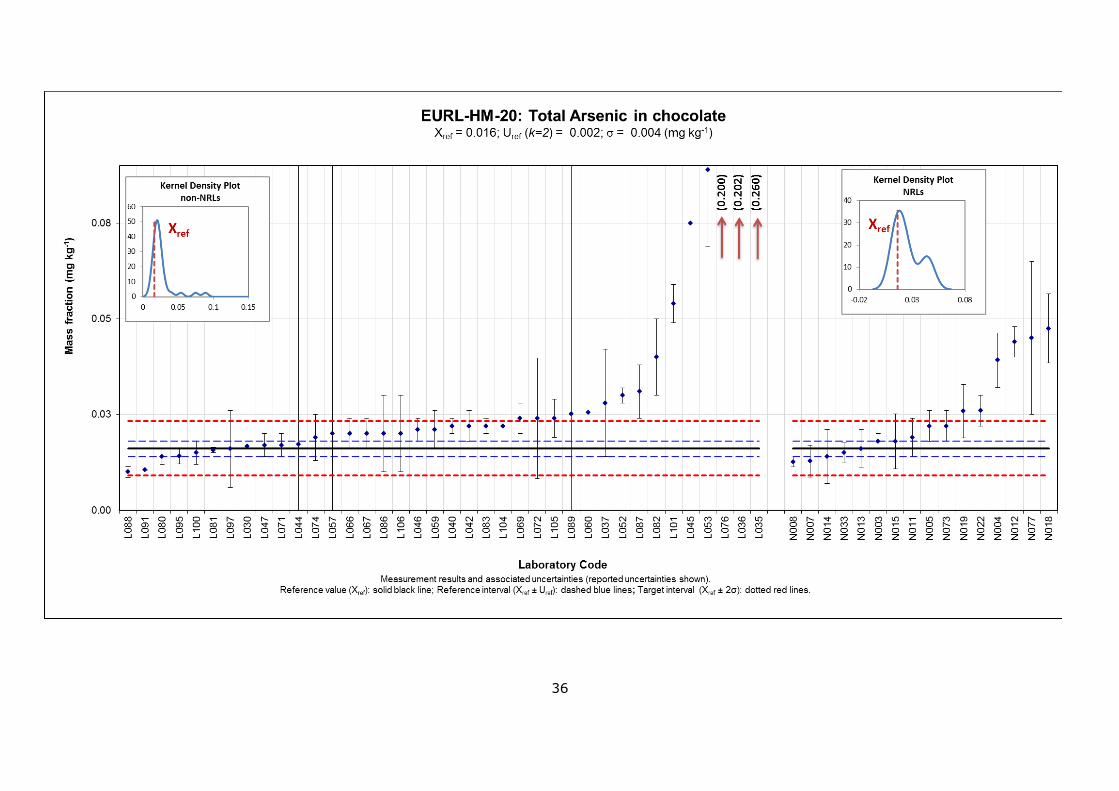
For the total As mass fraction the low percentage of satisfactory performances (61%)
could be attributed to the relatively low concentration of the measurand (0.0162 ±
0.0020 mg kg-1). This hypothesis is further confirmed by the 33 out of 87 laboratories
having reported "less than" values. Questionable or unsatisfactory performances were
due to overestimated values which may be attributed to contamination at low total As
concentration.
The same was observed for the even lower concentration of iAs mass fraction. Only 27
laboratories reported results (16 NRLs) half of which (13) where "less than" values. For
the remaining 14 laboratories, 64 % of them (78 % of the NRLs) performed
satisfactorily.
For the total Cd mass fraction all participants except two non-NRLs, reported results with
an overall satisfactory performance of 96% (100% for the NRLs).
For the total Pb mass fraction where the assigned value was relatively low (0.0270 ±
0.0030 mg kg-1) 67% of the participants performed satisfactorily (77% for NRLs).
Twenty one (6 NRLs) laboratories reported "less than" values. Most of the unsatisfactory
performances (22 out of 25) were due to overestimation. From the 96 laboratories that
reported results for total Pb, 30 (9 NRLs) used AAS based techniques for their analysis,
from which 11 reported "less than" and 12 questionable/unsatisfactory results. As for the
ICP based techniques 42 out of the 65 participant using them, performed satisfactorily.
A total of twenty-three participants (14 NRLs) reported results for all measurands, but
only seven laboratories performed satisfactorily for total As, Cd, Pb and iAs.
16
Figure 3: Number of laboratories with satisfactory (green), questionable (yellow) and unsatisfactory performance (red) together with the respective number of participants that reported results, less than values or did not report at all for each measurand.
L081 0.0157 0.0007 1.96 HG-AAS 0.0004 -0.13 -0.43 b
L082 0.04 0.01 2 HG-AAS 0.005 6.71 4.67 c
L083 0.022 0.002 2 ICP-MS 0.001 1.64 4.11 b
L084 < 0.0200 HG-AAS
L085 < 0.1000 AAS
L086 0.02 0.01 2 ICP-MS 0.005 1.08 0.75 c
L087 0.031 0.007 2 ICP-MS 0.0035 4.18 4.07 a
L088 0.01 0.0015 2 HG-AAS 0.0008 -1.73 -4.9 b
L089 0.0252 0.245 2 ICP-MS 0.1225 2.54 0.07 c
L091 0.0105 0.0001 v3 ICP-MS 0.0001 -1.59 -5.6 b
L092 < 0.0200 ICP-MS
L094 < 0.0700 ICP-MS
L095 0.0142 0.0021 2 ICP-MS 0.0011 -0.55 -1.34 a
L097 0.016 0.01 2 HG-AAS 0.005 -0.04 -0.03 c
L099 < 0.0500 100 AAS
L100 0.015 0.003 2 ICP-OES 0.0015 -0.33 -0.64 a
L101 0.054 0.005 2 AFS 0.0025 10.65 14.04 a
L102 < 0.1000 HG-AAS
L104 0.022 v3 ICP-MS 0 1.64 5.8 b
L105 0.024 0.005 2 ICP-MS 0.0025 2 2.91 a
L106 0.02 0.01 2 ICP-MS 0.005 1.08 0.75 c
a √3 is set by the ILC coordinator when no expansion factor k is reported. The reported uncertainty was assumed to have a rectangular distribution with k=√3, bperformance: satisfactory, questionable, unsatisfactory,
ca : umin(uref) ≤ ulab ≤ umax(σ); b : ulab<umin; and c :ulab>umax
36
37
Annex 13: Results for total Cd Assigned range: Xref = 0.303; Uref (k=2) = 0.021; σ = 0.058
(all values in mg kg-1) Lab code Xlab Ulab Ka technique ulab z-scoreb ζ-scoreb Uncert.c
N001 0.313 AAS 0 0.17 0.89 b
N002 0.28 0.039 2 AAS 0.0195 -0.41 -1.05 a
N003 0.28 0.04 2 ICP-MS 0.02 -0.41 -1.03 a
N004 0.288 0.04 2 ICP-MS 0.02 -0.27 -0.68 a
N005 0.31 0.074 2 ICP-MS 0.037 0.11 0.17 a
N006 0.34 0.07 2 ICP-MS 0.035 0.63 1 a
N007 0.29 0.044 2 ICP-MS 0.022 -0.23 -0.55 a
N008 0.335 0.035 2 ICP-MS 0.0175 0.55 1.54 a
N009 0.34 0.035 2 AAS 0.0175 0.63 1.78 a
N010 0.263 0.047 2 GF-AAS 0.0235 -0.70 -1.57 a
N011 0.33 0.04 2 ICP-MS 0.02 0.46 1.17 a
N012 0.306 0.018 2 ICP-MS 0.009 0.04 0.18 b
N013 0.3 0.069 2 ICP-MS 0.0345 -0.06 -0.1 a
N014 0.265 0.12 2 ET-AAS 0.06 -0.67 -0.63 c
N015 0.32 0.128 2 ICP-MS 0.064 0.29 0.26 c
N016 0.35 0.054 2 ICP-MS 0.027 0.81 1.6 a
N017 0.298 0.078 2 ICP-MS 0.039 -0.09 -0.13 a
N018 0.2344 0.0445 v3 ICP-MS 0.0257 -1.2 -2.48 a
N019 0.386 0.042 2 ETAAS 0.021 1.43 3.5 a
N020 0.31 0.022 2 ICP-MS 0.011 0.11 0.43 a
N021 0.35 0.14 2 ICP-MS 0.07 0.81 0.66 c
N022 0.275 0.024 2 ICP-MS 0.012 -0.49 -1.77 a
N025 0.272 0.045 2 AAS 0.0225 -0.55 -1.26 a
N026 0.27 0.0265 2 ICP-MS 0.0132 -0.58 -1.96 a
N027 0.27 0.09 2 ICP-MS 0.045 -0.58 -0.72 a
N033 0.294 0.05 2 ICP-MS 0.025 -0.16 -0.35 a
N034 0.3 0.038 2 AAS 0.019 -0.06 -0.16 a
N038 0.288 0.043 2 ICP-MS 0.0215 -0.27 -0.64 a
N039 0.29 0.03 2 ICP-MS 0.015 -0.23 -0.73 a
N054 0.306 0.055 2 AAS 0.0275 0.04 0.09 a
N073 0.294 0.016 2 ICP-MS 0.008 -0.16 -0.71 b
N077 0.286 0.029 2 ICP-MS 0.0145 -0.30 -0.97 a
L024 0.27 0.0089 v3 GFAAS 0.0051 -0.58 -2.81 b
L028 0.281 0.021 2 AAS 0.0105 -0.39 -1.49 b
L029 0.32 0.04 2 ICP-MS 0.02 0.29 0.73 a
L030 0.285 ICP-MS 0 -0.32 -1.72 b
L032 0.207 0.038 v3 ICP-OES 0.0219 -1.67 -3.95 a
L035 0.31 0.02 2 ICP-MS 0.01 0.11 0.45 b
L036 0.2822 0.0036 2 ICP-OES 0.0018 -0.37 -1.95 b
L037 0.296 0.148 2 ICP-MS 0.074 -0.13 -0.1 c
L040 0.307 0.031 v3 ICP-MS 0.0179 0.06 0.17 a
L041 0.198 0.013 2 GF-AAS 0.0065 -1.83 -8.4 b
L042 0.309 0.046 2 ICP-MS 0.023 0.1 0.22 a
L043 0.335 0.04 v3 ICP-MS 0.0231 0.55 1.24 a
L044 0.324 20 2 ICP-MS 10 0.36 0.00 c
L045 0.283 GFAAS 0 -0.35 -1.9 b
L046 0.271 0.046 2 ICP-MS 0.023 -0.56 -1.28 a
L047 0.281 0.042 2 ET-AAS 0.021 -0.39 -0.95 a
Lab code Xlab Ulab Ka technique ulab z-scoreb ζ-scoreb Uncert.c
L048 0.29 0.035 2 AAS 0.0175 -0.23 -0.66 a
L049 0.27 7 3.5 ICP-MS 2 -0.58 -0.02 c
L050 0.297 0.044 2 ICP-MS 0.022 -0.11 -0.26 a
L051 < 0.5000 v3 ICP-OES
L052 0.3 0.06 0.12 GF-AAS 0.5 -0.06 -0.01 c
L053 0.315 0.032 2 AAS 0.016 0.2 0.6 a
L055 0.289 0.055 2 ICP-OES 0.0275 -0.25 -0.49 a
L056 0.31 0.03 v3 ICP-AES 0.0173 0.11 0.32 a
L057 0.18 17 2 AAS-GTA 8.5 -2.14 -0.01 c
L059 0.325 0.049 2 ICP-MS 0.0245 0.37 0.81 a
L060 0.282 ICP-MS 0 -0.37 -2 b
L061 0.275 ICP-MS 0 -0.49 -2.65 b
L062 0.402 CV-AAS 0 1.71 9.18 b
L063 0.3 0.02 2 AAS 0.01 -0.06 -0.24 b
L064 0.268 0.054 2 ET-AAS 0.027 -0.61 -1.22 a
L065 0.28 0.03 v3 ICP-MS 0.0173 -0.41 -1.15 a
L066 0.3 0.045 2 ICP-MS 0.0225 -0.06 -0.14 a
L067 0.3 0.06 2 ICP-MS 0.03 -0.06 -0.11 a
L068 2.6 0.3 v3 ICP-MS 0.1732 39.83 13.23 c
L069 0.32 0.004 v3 ICP-MS 0.0023 0.29 1.51 b
L070 0.2664 0.0293 2 GF-AAS 0.0146 -0.64 -2.04 a
L071 0.323 0.048 2 SEM-ICP-MS 0.024 0.34 0.74 a
L072 0.326 0.0126 2 ICP-MS 0.0063 0.39 1.81 b
L074 0.297 0.083 2 ICP-MS 0.0415 -0.11 -0.15 a
L075 0.419 0.02 2 ET-AAS 0.01 2 7.87 b
L076 0.16 0.01 2 ICP-OES 0.005 -2.49 -12.11 b
L078 0.358 0.055 2 AAS 0.0275 0.95 1.85 a
L079 0.29 0.04 2 AAS 0.02 -0.23 -0.59 a
L080 0.246 0.016 2 ICP-MS 0.008 -1 -4.29 b
L081 0.2853 0.0034 1.96 ICP-MS 0.0017 -0.31 -1.67 b
L082 0.289 0.059 2 FAAS 0.0295 -0.25 -0.46 a
L083 0.287 0.028 2 ICP-MS 0.014 -0.29 -0.93 a
L084 0.246 0.04 2 AAS 0.02 -1.00 -2.53 a
L085 0.396 0.077 2 AAS 0.0385 1.61 2.32 a
L086 0.31 0.08 2 ICP-MS 0.04 0.11 0.16 a
L087 0.289 0.067 2 ICP-MS 0.0335 -0.25 -0.41 a
L088 0.288 0.0288 2 ICP-MS 0.0144 -0.27 -0.86 a
L089 0.2676 0.282 2 ICP-MS 0.141 -0.62 -0.25 c
L091 0.2917 0.0297 v3 ICP-MS 0.0171 -0.2 -0.58 a
L092 0.292 ICP-MS 0 -0.2 -1.07 b
L093 0.24 0.6 2 FAAS 0.3 -1.1 -0.21 c
L094 0.27 ICP-MS 0 -0.58 -3.11 b
L095 0.2986 0.0448 2 ICP-MS 0.0224 -0.08 -0.2 a
L097 0.236 0.019 2 GF-AAS 0.0095 -1.17 -4.7 b
L098 0.27 0.06 2 AAS 0.03 -0.58 -1.05 a
L099 0.297 25 100 AAS 0.25 -0.11 -0.03 c
L100 0.295 0.057 2 ICP-OES 0.0285 -0.15 -0.28 a
L101 0.249 0.025 2 ICP-AES 0.0125 -0.94 -3.3 a
L104 0.316 ICP-MS 0 0.22 1.17 b
L105 0.336 0.067 2 ICP-MS 0.0335 0.56 0.93 a
L106 0.24 0.05 2 ICP-MS 0.025 -1.10 -2.33 a a √3 is set by the ILC coordinator when no expansion factor k is reported. The reported uncertainty was assumed to have a rectangular distribution with k=√3, bperformance: satisfactory, questionable, unsatisfactory,
ca : umin(uref) ≤ ulab ≤ umax(σ); b : ulab<umin; and c :ulab>umax
38
39
Annex 14: Results for total Pb Assigned range: Xref = 0.027; Uref (k=2) = 0.003; σ = 0.006
(all values in mg kg-1) Lab code Xlab Ulab Ka technique ulab z-scoreb ζ-scoreb Uncert.c
N001 < 0.0500 v3 AAS
N002 0.013 0.0047 2 AAS 0.0024 -2.36 -4.81 a
N003 0.031 0.006 2 ICP-MS 0.0030 0.67 1.15 a
N004 0.0265 0.0087 2 ICP-MS 0.0043 -0.09 -0.11 a
N005 0.029 0.01 2 ICP-MS 0.0050 0.33 0.37 a
N006 0.02 0.004 2 ICP-MS 0.0020 -1.18 -2.66 a
N007 0.0111 0.0037 2 ICP-MS 0.0019 -2.68 -6.30 a
N008 0.037 0.0038 2 ICP-MS 0.0019 1.68 3.89 a
N009 < 0.0200 AAS
N010 0.047 0.01 2 GF-AAS 0.0050 3.36 3.78 a
N011 0.027 0.006 2 ICP-MS 0.0030 0.00 -0.01 a
N012 0.019 0.002 2 ICP-MS 0.0010 -1.35 -4.03 b
N013 0.024 0.007 2 ICP-MS 0.0035 -0.51 -0.77 a
N014 0.035 0.0086 2 ET-AAS 0.0043 1.34 1.72 a
N015 0.024 0.012 2 ICP-MS 0.0060 -0.51 -0.48 c
N016 0.0216 0.0091 2 ICP-MS 0.0046 -0.91 -1.11 a
N017 0.03 0.008 2 ICP-MS 0.0040 0.50 0.68 a
N018 0.0832 0.0166 v3 ICP-MS 0.0096 9.45 5.76 c
N019 0.0288 0.0037 2 ETAAS 0.0019 0.30 0.70 a
N020 0.024 0.0023 2 ICP-MS 0.0011 -0.51 -1.46 b
N021 0.025 0.013 2 ICP-MS 0.0065 -0.34 -0.30 c
N022 0.027 0.003 2 ICP-MS 0.0015 0.00 -0.01 b
N025 < 0.0500 AAS
N026 < 0.1200 ICP-MS
N027 0.033 0.012 2 ICP-MS 0.0060 1.01 0.96 c
N033 0.023 0.0032 2 ICP-MS 0.0016 -0.68 -1.71 b
N034 0.22 0.07 2 AAS 0.0350 32.46 5.51 c
N038 0.0257 0.0049 2 ICP-MS 0.0024 -0.22 -0.44 a
N039 0.029 0.006 2 ICP-MS 0.0030 0.33 0.57 a
N054 < 0.5000 AAS
N073 0.04 0.01 2 ICP-MS 0.0050 2.18 2.45 a
N077 < 0.3000 ICP-MS
L024 0.03 0.008 v3 GFAAS 0.0046 0.50 0.60 a
L028 0.055 0.016 2 AAS 0.0080 4.71 3.42 c
L029 < 0.0400 ICP-MS
L030 0.0233 0 ICP-MS 0 -0.63 -2.16 b
L032 < 0.2000 ICP-OES
L035 0.04 0.01 2 ICP-MS 0.0050 2.18 2.45 a
L036 0.0903 0.0029 2 ICP-OES 0.0015 10.64 28.01 b
L037 0.02 0.01 2 ICP-MS 0.0050 -1.18 -1.33 a
L040 < 0.0500 ICP-MS
L041 0.02 0.002 2 GF-AAS 0.0010 -1.18 -3.53 b
L042 0.031 0.003 2 ICP-MS 0.0015 0.67 1.74 b
L044 0.0308 20 2 ICP-MS 10.0000 0.64 0.00 c
L045 0.027 0 v3 GFAAS 0 0.00 -0.01 b
L046 0.032 0.007 2 ICP-MS 0.0035 0.84 1.28 a
L047 0.033 0.006 2 ET-AAS 0.0030 1.01 1.73 a
L048 0.039 0.012 2 AAS 0.0060 2.01 1.92 c
Lab code Xlab Ulab Ka technique ulab z-scoreb ζ-scoreb Uncert.c
L049 0.022 0.51 0.26 ICP-MS 1.9615 -0.84 0.00 c
L050 0.022 0.003 2 ICP-MS 0.0015 -0.84 -2.20 b
L051 < 1.0000 ICP-OES
L052 0.23 0.01 0.02 GF-AAS 0.5000 34.14 0.41 c
L053 0.054 0.011 2 AAS 0.0055 4.54 4.68 a
L055 < 0.5000 ICP-OES
L056 < 0.3000 ICP-AES
L057 0.08 15 2 GF-AAS 7.5000 8.91 0.01 c
L059 0.024 0.006 2 ICP-MS 0.0030 -0.51 -0.87 a
L060 0.0357 0 v3 ICP-MS 0 1.46 5.04 b
L061 0.024 0 v3 ICP-MS 0 -0.51 -1.76 b
L062 1.267 0 v3 CV-AAS 0 208.58 720.85 b
L063 < 0.0500 AAS
L064 0.042 0.011 2 ET AAS 0.0055 2.52 2.60 a
L065 < 0.0500 ICP-MS
L066 0.025 0.005 2 ICP-MS 0.0025 -0.34 -0.67 a
L067 0.02 0.004 2 ICP-MS 0.0020 -1.18 -2.66 a
L068 0.75 0.08 v3 ICP-MS 0.0462 121.61 15.64 c
L069 0.025 0.002 v3 ICP-MS 0.0012 -0.34 -0.98 b
L070 < 0.0500 GF-AAS
L071 0.02 0.005 2 SEM-ICP-MS 0.0025 -1.18 -2.31 a
L072 0.039 0.0124 2 ICP-MS 0.0062 2.01 1.86 c
L074 0.032 0.014 2 ICP-MS 0.0070 0.84 0.69 c
L075 0.367 0.03 2 EET-AAS 0.0150 57.19 22.52 c
L076 0.25 0.01 2 ICP-AES 0.0050 37.51 42.17 a
L078 < 0.1000 AAS
L079 0.25 0.06 2 AAS 0.0300 37.51 7.42 c
L080 0.027 0.002 2 ICP-MS 0.0010 0.00 -0.01 b
L081 0.0357 0.0023 1.96 AAS 0.0012 1.46 4.17 b
L083 0.174 0.017 2 ICP-MS 0.0085 24.72 16.95 c
L084 < 0.1000 AAS
L085 < 0.1200 AAS
L086 0.03 0.01 2 ICP-MS 0.0050 0.50 0.56 a
L087 0.026 0.006 2 ICP-MS 0.0030 -0.17 -0.30 a
L088 < 0.1000 ICP-MS
L089 0.0096 0.0924 2 ICP-MS 0.0462 -2.93 -0.38 c
L091 0.0368 0.0027 v3 ICP-MS 0.0016 1.64 4.21 b
L092 0.031 0 v3 ICP-MS 0 0.67 2.31 b
L094 0.037 0 v3 ICP-MS 0 1.68 5.80 b
L095 0.0274 0.0041 2 ICP-MS 0.0021 0.07 0.15 a
L097 0.03 0.023 2 GF-AAS 0.0115 0.50 0.26 c
L098 < 0.0800 AAS
L099 < 0.0500 100 AAS
L100 0.28 0.055 2 ICP-OES 0.0275 42.55 9.18 c
L101 0.086 0.009 2 ICP-AES 0.0045 9.92 12.24 a
L102 v3
L104 0.21 0 v3 ICP-MS 0 30.78 106.37 b
L105 0.025 0.005 2 ICP-MS 0.0025 -0.34 -0.67 a
L106 0.02 0.01 2 ICP-MS 0.0050 -1.18 -1.33 a a √3 is set by the ILC coordinator when no expansion factor k is reported. The reported uncertainty was assumed to have a rectangular distribution with k=√3, bperformance: satisfactory, questionable, unsatisfactory, ca : umin(uref) ≤ ulab ≤ umax(σ); b : ulab<umin; and c : ulab>umax
Lab Code Xlab Ulab k technique ulab z-score ζ-score uncert.
N001 <0.2 LC-ICP-MS
N003 0.009 0.004 2 HPLC-ICP-MS 0.002 -0.84 -0.96 a
N004 <0.05
N007 0.0103 0.0034 2 HPLC-ICP-MS 0.002 -0.39 -0.48 a
N011 0.011 0.002 2 HPLC-ICP-MS 0.001 -0.14 -0.22 b
N012 0.027 0.012 2 HPLC-ICP-MS 0.006 5.47 2.52 c
N013 0.011 LC-ICP-MS 0 -0.14 -0.26 b
N014 0.009 0.001 2 HG-AAS 0.001 -0.84 -1.50 b
N016 <0.025 LC-ICP-MS
N017 0.011 0.003 2 LC-ICP-MS 0.002 -0.14 -0.19 b
N019 0.021 0.01 2 HG-AAS 0.005 3.37 1.84 c
N020 <0.0084 LC-ICP-MS
N025 <0.065 HG-AAS
N027 <0.020 HPLC-ICP-MS
N033 0.014 0.0037 2 ICP-MS 0.002 0.91 1.09 a
N077 <0.035 LC-ICP-MS
L029 <0.05 ICP-MS
L031 <0.1 HPLC-ICP-MS
L032 <0.1 ICP-OES
L035 0.110 0.03 2 HPLC-ICP-MS 0.015 34.60 6.54 c
L042 0.012 0.002 2 HPLC-ICP-MS 0.001 0.21 0.33 b
L051 <3.3 ICP-OES
L066 0.016 0.002 2 LC-ICP-MS 0.001 1.61 2.53 b
L072 0.023 0.004 2 LC-ICP-MS 0.002 3.89 4.42 a
L081 <0.05 AAS
L101 0.053 0.005 2 AFS 0.003 14.60 14.22 a
L102 <0.1 HG-AAS a √3 is set by the ILC coordinator when no expansion factor k is reported. The reported uncertainty was assumed to have a rectangular distribution with k=√3, bperformance: satisfactory, questionable, unsatisfactory, ca : umin(uref) ≤ ulab ≤ umax(σ); b : ulab<umin; and c : ulab>umax